41
Climate Change and Protection What can I do? Climate Booklet
Climate Change and Protection
What can I do?Climate
Booklet

32
“Whatever befalls the earth, befalls the sons and daughters of the earth.”
die-klimaschutz-baustelle.de
“The topic of climate change is far too serious to be left to the boffins.”
We sent the first edition of the climate booklet to be printed (climate neutrally) with this sentence in 2007. Some time has passed since then. For a long time now, climate change has been a topic concerning more than just scientists and stu-dents. The vast majority of people are aware of our collective influence on the global climate. Some of us feel it with our own bodies. But what was that about greenhouse gases? What can I do? What does energy have to do with CO₂? Is CO2 the sole cause of climate fluctuations? How did our climate come to be? How does it work?
Do you want to refresh and extend your knowledge? This updated climate booklet is more in-depth and shows you steps you can take – for yourself and our climate.
The myclimate team wishes you happy reading.
Speech by Chief Seattle, 1855

54
What Exactly is “the Climate”? 7
The Difference Between Weather and Climate 8
Earth’s Climate 12
Greenhouse Gases 14
Climate Change 17 The Human Influence 19
Current Changes to the Climate 20
Effects of Climate Change 22
The Problem: Emissions 25
Greenhouse Gas Emissions in Europe 26
Energy Use in Switzerland 28
International Air Traffic 30
How do I Contribute to Climate Change and 33 what can I Do?
Category “Mobility” 34
How far can four People go 36 with one Tonne of CO2e?
Category “Living” 38
Category “Consumption” 40
Food 43
Vegan Burger Versus Meat Burger 46
Food Waste 48
Clothing 50
Second hand 53
Emissions per Activity 54
How can I take Responsibility? 57
Global Warming and your Carbon Footprint 58
Development of the last 164 Years 60
Extreme Weather, Risks and Climate Change 62
The Work of myclimate 64
Carbon Offset Projects 66
Glossary 74
Bibliography 76

76
For scientists, the term “climate” encompasses weather patterns over a long period. Although this term is somewhat abstract, its impact is very real. In rich, developed countries, we also observe the change in the climate but will be able to deal with it for the foreseeable future. The situation in poorer countries and island nations is different. Similarly, plants and animals feel the effects of a changing climate much more profoundly. In contrast to people, particularly those in devel-oped countries, they cannot adapt at the same speed.
What Exactly is “the Climate”?
“Such a thing as the climate doesn’t exist. Everything that weexperience and feel through our senses outside is weather – heat, warmth, rain or snow.”
Source: Own quote

98
0
5
10
15
20
25
30
35
Temperature progression, June 2019, Paris-Montsouris
Tem
pera
ture
(°C)
Weather
Atmospheric conditions that we can actively feel and expe-rience come under the term weather (e. g. temperature, pre- cipitation, humidity, wind speed and direction, etc.). These are always applicable to a comparatively short period of time (hours, days or a few weeks) and to particular locations or regions. High-speed and high-amplitude weather changes are normal, such as the day-and-night or seasonal cycles.
Climate
The term “climate” refers to the average weather phenomena in a selected place, a large region or across the entire globe over a period of at least 30 years. This time span is defined as a climate normal. Since it covers a large timescale, climate is a slow, more stable system. Changes occur, but at a slower pace, and the fluctuation range is likewise considerably narrower. The climate is determined by a variety of factors.
infoclimat.fr
0.0
0.5
–0.5
–1.01000
Year1200 1400 1600 1800 2000
1.0
1.5
Tem
pera
ture
�uc
tuat
ion
(°C)
Temperature progression, Central Europe, last 1000 years
The Difference Between Weather and Climate

1110
AtmosphereThe concentration of greenhouse gases in the atmosphere plays an important role in the average global temperature.
SunSolar radiation is the most important source of heat for the climate. Radiation emitted by the sun is sub-ject to cyclical �uctuations.
Atmospheric Circulation This distributes gas, water and energy within the atmosphere and de�nes the regional climate above all.
Eccentricity (Milankovitch Cycles)Earth’s orbit around the sun changes over about 100,000 years. It starts o� rounder and becomes more elliptical.
PrecessionIn about 21,000 years, Earth’s axis rotates once like a spinning top round the vertical axis.
Earth’s Axial TiltThe tilt of Earth’s axis varies in the course of 41,000 years between 22.5° and 24°.
Fluctuations in Earth’s orbit and axis cause changes to the solar radiation emitted onto Earth and in turn to the climate.
Ocean CurrentsCurrents such as the Gulf Stream transport vast amounts of energy and shape the climate of entire regions.
TectonicsThe movement of land masses a�ects how much radiation falls on ocean areas and how much on land masses. Ocean areas absorb more warmth than land masses.
Landscape and VegetationSoil conditions and vegetation determine how much radiation is absorbed by the earth’s surface.
Climate Factors and Drivers
The prevailing climate of our planet is determined by the following physical factors:
Earth’s climate is the result of all these influences. A change in one or more factors thus brings about a change in the climate. Individual influencing factors, such as volcanic eruptions, have only a short-term effect over a few years. Whereas fluctuations in Earth’s orbit change the climate very gradually over hundreds of thousands of years.

1312
Sun
Earth
Short-wave
solar radiatio
n
UV radiatio
n
Ozone layer
N₂O
Air
21 % oxygen
0.90 % argon0.04 % carbon dioxide 0.06 % rest
78 %nitrogen
Plus hydrogen, with a strong regional variation of 1–4 %.
CH₄
O₃
Long-wave
heat radiatio
n from
Earth’s surfa
ce
CO₂
H₂O
Earth’s Climate
The atmosphere and its composition play a crucial role in determining the prevailing climate. This gas envelope is what makes life on Earth possible in the first place, sheltering us from some damaging external influences such as UV radia-tion. It is in its lowest layer, the “troposphere”, where weather takes place. There, winds ensure heat exchange between cold and warm regions. Alongside its primary constituents oxygen and nitrogen, the atmosphere also contains the greenhouse gases water vapour (H2O), carbon dioxide (CO2), methane (CH4) and nitrous oxide (N2O). These gases are able to absorb and re-release long-wave thermal radiation emitted by Earth’s surface. Part of this radiation is returned to Earth’s surface, causing a higher temperature by reducing the cooling effect of heat emission.
This natural process is known as the greenhouse effect and causes an increase in the global average temperature of around 33 °C. Some two thirds of this is caused by water vapour. The remaining third is caused by CO₂ (22 per cent), ozone (7 per cent), N₂O and CH₄. Consequently, the prevailing average global temperature on Earth is a pleasant +15 °C and not –18 °C, which is what it would be were it not for the green-house effect.
Greenhouse gas emissions caused by people strengthen this natural effect.

1514
Greenhouse Gases
Not only does the concentration of greenhouse gases influence Earth’s temperature but temperature fluctuations caused by natural climate factors (see page 10) in turn alter these concentrations. CO2 concentrations of between 180 and 300 ppm (parts per million) have been ascertained for the last 800,000 years from Arctic ice and sediment core samples.
The respective influence of CO2, CH4 and N2O on the climate varies. Thus, CH4 and N2O have a disproportionate impact on the greenhouse effect relative to their comparatively small atmospheric concentrations.
In order to compare the respective impact on the climate and the warming potential of the greenhouse gases, methane and nitrous oxide are measured in CO2 equivalents (CO2e). For this purpose, emissions are multiplied by the respective climate impact factor. The basis for this calculation is CO2 with a warming potential of one.
0 60 120 180 240 300
N₂O
CH₄
CO₂ 1
Comparison of warming potential
Gre
enho
use
gase
s
298
25
CO2
0.018–0.03 %CH4
0.000 072 %N2O0.000 027 %
Pre-industrial Concentration

1716
If we want to alleviate climate change, we must understand it! The term is now on everyone’s lips. The issue is a very com-plex one. What is climate change? What causes it? What dangers and opportunities does it bring? What does it have to do with all of us? Let’s take a look!
Climate Change
“We are rich enoughto alleviate climate change, but too poorto do nothing.”Modified quote from Sigmar Gabriel, German Minister of the Economy and Energy, 2008
die-klimaschutz-baustelle.de

1918
Since the industrial revolution of the 18th century, the com-bustion of black and brown coal, oil and natural gas has re-leased the carbon stored inside these materials for millions of years into the atmosphere as CO2. With a rapidly growing population and economy, annual energy demand likewise increases and is in large part covered by consumption of these “fossil fuels”. In turn, annual global CO2 emissions are also increasing. In 2018, around 52 billion tonnes of CO2e were released into the atmosphere by anthropogenic (human) activity. China, the USA and the EU are among the biggest emitters. They alone are responsible for more than 50 per cent of global greenhouse gas emissions.
Human activity also influences atmospheric concentrations of methane and nitrous oxide. Agriculture is the dominant source of methane (CH4) emissions. Livestock farming in particular is linked with high methane emissions, as is rice production. Nitrous oxide (N₂O) is likewise predominantly generated by agriculture, through the use of nitrogen and nitrate fertilisers. On the whole, increasing methane and nitrous oxide emissions can be attributed to the increasing world population and changes in eating habits.
IEA/UNEP (2019), Statista
2 % 2 %6 % 6 %
11 %16 %
76 %81 %
Global EU & UK
Composition of greenhouse gas emissions – global and in EU and UK
CO₂ CH₄ N₂O Other
The Human Influence
2000 2010 2016
160 000
140 000
120 000
100 000
80 000
60 000
40 000
20 000
0
80 000
70 000
60 000
50 000
40 000
30 000
20 000
10 000
0
TWh
Meg
aton
nes
(Mt)
CO2e
Primary global energy consumption (TWh) Emissions (Mt CO₂e)

2120
1000 1500 2000500
300
800
1200
1600
2000
350
400
Year
CO2 (p
pm),
N2O
(ppb
)
CH4 (p
pb)
Carbon dioxide (CO2)
Methane (CH4)Nitrous oxide (N20)
250
Models that only consider natural drives
Observations
Models that consider both natural and anthropogenic drives
Tem
pera
ture
(°C)
Land Surface
1910 1960 2010
Tem
pera
ture
(°C)
Land and Ocean Surface
1910 1960 2010
OH
C (10
22 J)
Heat Content of Ocean
1910 1960 2010–1
0
1
2
–1
0
1
2
–10
0
10
20
Current Changes to the Climate
Since the start of the century before last, global climate records document increasing changes. Significant increases in the concentration of the greenhouse gases CO2, CH4 and N₂O are apparent. Meanwhile, the speed of the increase in the global average temperature is unusual.
Natural climate fluctuations have always existed (see page 9). According to the Intergovernmental Panel on Climate Change (IPCC), the sharp increase in temperature since the mid-20th century can only be explained by human activity. The cause of this is the rapid increase in greenhouse gas concentrations and an amplified greenhouse effect.
UBA (2017), IPCC (2013c), ipcc.ch (diagram simplified)

2322
Effects of Climate Change
The direct consequences of climate change can be ascer- tained by observing various climate and geological param-eters. Increasing greenhouse gas concentrations in the atmo-sphere increase air and sea temperatures. This reduces the total global snow and ice mass (sea ice, polar ice caps and glaciers). In conjunction with the increasing volume of water and higher temperatures, sea levels are also rising. These higher temperatures are also accelerating the global water cycle. The evaporation rate, water content in the atmosphere, and the frequency and intensity of heavy rainfall are all increasing.
A faster evaporation rate and an increase in aridity are redu-cing freshwater reservoirs and negatively impacting agricul-tural productivity. Famine and water crises coupled with increasing heat reduce quality of life, increase mortality rates and cause waves of migration. Altered climatic conditions have in part dramatically reduced the typical biodiversity of local ecosystems thanks to the limited adaptive capacity of flora and fauna. Parasites and pathogens are taking hold in previously unaffected regions and doing damage. Heavier storms and rainfall lead to more frequent infrastructural issues. Power cuts, restrictions on train travel and overcrowd- ed streets are negatively impacting daily life increasingly.
To mitigate the damage of current and future changes to the climate, corrective measures must be taken across the entire globe now, with significant costs.
Despite the already noticeable changes to the climate, with far-reaching climate protection measures we can curb clima-te change and safeguard the quality of life of future genera-tions. To this end, every person must be aware of their individ- ual influence on and responsibility for the climate and actively participate in its protection.
IPCC (2013a)/https://images.nasa.gov

2524
The increasing demand for energy from the world’s ever- growing population and the lifestyle of a small part of it threaten the future of our planet and so the future of subse-quent generations. People in developed countries see it as their right, here and now, to live a pleasant, privileged life. However, they forget their duty to ensure that other people and subsequent generations have the same opportunity.
The Problem: Emissions
Sofia (18)
“We are the last generation with the opportunity to turn the tide.”
die-klimaschutz-baustelle.de

2726
1 t CO₂e = production of 80 kg of beef
1 t CO₂e = heating for a 55 m² energy-optimised home for one year
12 %
29 %
13 %
11 %
35 %
Industry and commerce
Greenhouse gas emissions by sector (2018)
HouseholdOtherElectricity and heat production
Transport
Total emissions
3209 MtCO₂e
1 t CO₂e = operation of electronic devices in one household for 350 days
IEA (2020)
Greenhouse Gas Emissions
Greenhouse gas emissions can be attributed to various consumer sectors: transport is the biggest contributor, at around 40 per cent, followed by industry and commerce.
We contribute to all of these emissions directly and indirectly through our daily activities, our lifestyles and our consumer behaviour. We cannot ignore our responsibility and must recognise that we all contribute to the changes in the climate that are currently taking place. Through small adjustments leading to a more conscientious and sustainable lifestyle, each and every one of us can take part in the global climate pro-tection project.

2928
In 2018, primary energy consumption in the EU amounted to 18,049 terawatt hours (TWh), with final energy consumption of 12,346 TWh.
On average, only seven out of 100 citizens of the world (6.5 per cent) live in the countries of the EU and UK. Per-person energy consumption in these countries is considerably higher than the global average, which is reflected in greenhouse gas emissions. Moreover, there are huge differences between individual countries within Europe itself (see Eurostat data). By the year 2050, the EU aims to be greenhouse gas neutral. To achieve the planned reduction in greenhouse gases, per capita emissions (also referred to as a carbon footprint) must be drastically reduced from the year 2015 onwards – by more than 80 per cent – in comparison to 1990 levels.
Energy Consumption in Europe
27 %
3 %
31 %
25 %
14 %
Final energy
12 346 TWh
Energy consumption in EU & UK (2018)
Transport IndustryServices Other
Household
0
0 2 4 6 8 10 12 14
10 000 20 000 30 000 40 000
Europe
Worldwide
Comparison of global per capita energy use and greenhouse gas emissions with per capita data for Europe (2018)
t CO₂e
kWh
kWht CO₂e*
*Incl. emissions generated abroad by imported goods
Eurostat (2018) European Union (2019)/IEA (2018)/UNEP (2019)

3130
International Air Traffic While recording greenhouse gas emissions is a national matter, international traffic crosses international borders and consequently the allocation of these emissions is difficult and mostly calculated separately. Since international air traffic volumes are consistently increasing, resulting in an increase in emissions, close examination of the numbers is important if we want to protect the climate and reduce our emissions. Globally, air traffic emissions account for 2-3 per cent of total emissions, though in Europe the percentage is slightly higher. Here too there are large differences between individual countries.
icao.int
1633 mil. passengers in EU & UK (2019)
Corresponds to more than three times the population
12.1 mil.�ights in European airspace
Corresponds to 33,208 �ights per day or 1384 �ights per hour
4 100 000 000Global airline passengers (2017)
That corresponds to half of the world’s population. However, these flights are primarily taken by people from richer count-ries. They fly multiple times a year.
Eurostat, European Commission

3332
The average European citizen generates 8.7 tonnes of CO2e each year. To reach global climate targets and effectively curb climate change, this value must sink sharply.
How do I Contri-bute to Climate Change and what can I Do?
“When lots of little people in lots of little places do lots of little things, the face of our Earth will change.”
die-klimaschutz-baustelle.de Eurostat
African proverb

3534
28 % vans/trucks/buses
13 % shipping
13 % aviation
1 % motorbikes
0.5 % misc.
0.5 % trains
44 % cars
Total emissions
1097 MT CO₂e
Greenhouse Gas Emissions in Europe in Transport Sector (2018)
www.eea.europa.eu
Some 3821 terawatt hours of final energy can be attributed to the transport sector, corresponding to almost 37 per cent of total final energy consumption in Switzerland for 2017. Around 25 per cent of greenhouse gas emissions in the EU in 2018 were generated by the transport sector (including internatio-nal flights), amounting to some 1097 Mt CO₂e. For mobility alone, more than 2 tonnes of greenhouse gases are emitted in Europe per capita per year.
If we consider domestic personal transport within Europe, more than 80 per cent of journeys are still made with cars, while just under 20 per cent are made on public transport. Trains are used most frequently in Austria and the Nether-lands and least frequently (aside from the islands of Malta and Cyprus) in Greece and Lithuania.
Tips CO₂ savings
Use local public transport Up to 69 % in comparison with private vehicles
Take a coach or long-distance train for holidays abroad
On average, some 77 % fewer emissions (compared with cars) and more than 660% fewer (compared with planes)
Beware of the emission value when purchasing a car
The bigger and heavier the car, the higher the fuel consumption and in turn the emissions
Adjust your way of driving and speed
Travelling at 110 km/h instead of 120 km/h on motorways could save 30 kg CO2e per vehicle each year
To reduce our personal carbon footprints, we must rethink our daily mobility attitudes and habits.
Category “Mobility”
Eurostat

3736
How far can four People go with a Tonne of CO2e?
Since greenhouse gas emissions vary by mode and capacity of transport, the accompanying illustration shows how far a family of four can travel without emitting more than a tonne of CO₂e. Starting in Frankfurt, by plane it is only possible to cross the German border. Conversely, you can reach destina-tions in the south of Spain or north of the Arctic Circle by train. The choice of transport for holidays abroad can thus have a big impact on the emissions generated by the trip and, in turn, your personal carbon footprint.
UBA (2018e), myclimate
London
Brest
Edinburgh
Galway
Inverness
Brussels
Paris
Liverpool
Plymouth
BarcelonaRome
Lyon
Munich
Frankfurt
Zurich
Madrid
Gibraltar
Lisbon
MarseillesZadar
Budapest
Venice
OsloStockholm
Helsinki
Kaunas
Riga
Ternopil
Soa
Palermo
Minsk
Warsaw
Bucharest
Kiev
Tirana
Tallinn
Rügen
Copenhagen
Tromsø Kirkenes
Bordeaux
Hanover
Leipzig
Car** Plane***
210
180
150
120
90
60
30
0
CO₂e
in g
/pas
seng
er k
m
Train* Coach*
Comparison of Average Emissions of Individual Transport Type per Kilometre Travelled
*With average capacity and typical energy mix for country**Data based on one person in car, more occupants decrease individual carbon footprint***With average capacity, economy and business class averaged

3938
Category “Living”
14 %
15 %
3233 TWh
Final Energy Consumption in Private Households (2018)
Space heatingWater heatingLighting and appliancesCookingSpace coolingother
63.5 %0.5 %
1 %
6 %
Around 27 per cent of the total final energy consumption in Europe can be attributed to private households. The majority of energy consumed in European households comes from natural gas. 20 per cent comes from renewable sources of energy. 3.5 per cent is still extracted from coal.
Within the EU, Sweden is the frontrunner in renewable energy, which amounts to some 60 per cent of the energy mix there. Finland and Latvia likewise have a very “green” energy mix.
Tips Savings
Lower your heating temperature
Each additional degree increases energy use by around 6 % ≅ 350 kg CO2e per year per household
Air dry your washing instead of using a tumble dryer
Around 130 kg CO2e per year and household (4 people)
Switch inefficient and outmoded filament lamps for LED lights
1 filament lamp – around 6.96 kg CO₂e per year; with 20 filament lamps per house – around 140 kg CO₂e per year
Eurostat Eurostat, European Commission
4140
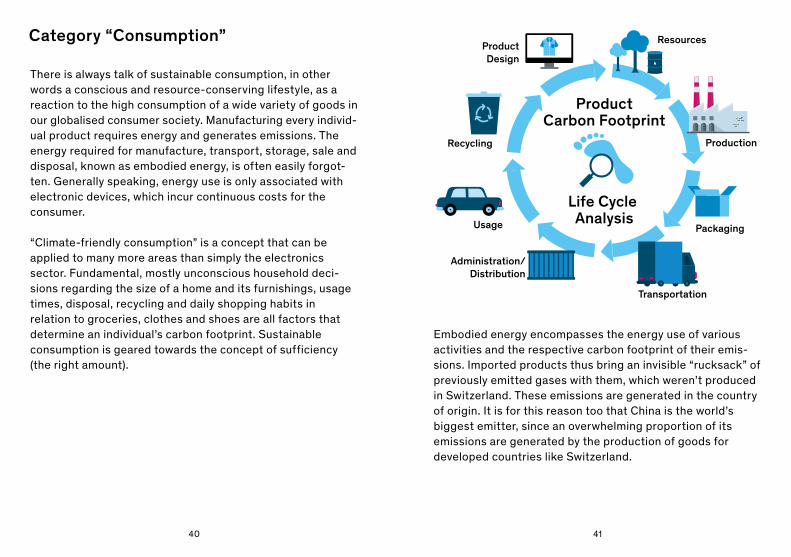
Category “Consumption”
There is always talk of sustainable consumption, in other words a conscious and resource-conserving lifestyle, as a reaction to the high consumption of a wide variety of goods in our globalised consumer society. Manufacturing every individ- ual product requires energy and generates emissions. The energy required for manufacture, transport, storage, sale and disposal, known as embodied energy, is often easily forgot-ten. Generally speaking, energy use is only associated with electronic devices, which incur continuous costs for the consumer.
“Climate-friendly consumption” is a concept that can be applied to many more areas than simply the electronics sector. Fundamental, mostly unconscious household deci- sions regarding the size of a home and its furnishings, usage times, disposal, recycling and daily shopping habits in relation to groceries, clothes and shoes are all factors that determine an individual’s carbon footprint. Sustainable consumption is geared towards the concept of sufficiency (the right amount).
ProductDesign
Recycling
Administration/Distribution
Usage
Transportation
Packaging
Production
Resources
ProductCarbon Footprint
Life Cycle Analysis
Embodied energy encompasses the energy use of various activities and the respective carbon footprint of their emis- sions. Imported products thus bring an invisible “rucksack” of previously emitted gases with them, which weren’t produced in Switzerland. These emissions are generated in the country of origin. It is for this reason too that China is the world’s biggest emitter, since an overwhelming proportion of its emissions are generated by the production of goods for developed countries like Switzerland.

4342
Beef �lletBeefPork
Pork schnitzelChicken breast
ButterHard cheeseSoft cheese
Feta (cow’s milk)Mozzarella (cow’s milk)
Cream (full fat)Oat cream
Eggs (free range)Quark
Yoghurt (natural)Milk (UHT, full fat)
Soya drinkPasta, spaghetti
BreadBread roll (white �our)
FriesPotatoes (fresh)
TomatoesCarrots
LeeksTomato concentrate
AvocadosBananas
Apples
kg CO₂e/kg foodstu�s
10 20 15 25 30 35 40 45 50 550 5
Food
Food has a huge influence on the individual carbon footprint of every human being. The carbon footprint varies enormously from food to food. Animal products such as meat and dairy have a bad climate balance owing to methane and nitrous oxide emissions, but also because of their production processes, which are comparatively more energy inten-sive. If the products are then sold on the international market, the respective carbon footprint of each foodstuff is increased thanks to long transport routes.
A bacon, sausage and egg sandwich on a German breakfast table, for example, gener-ates almost 1.5 kg of CO2 emissions – this roughly equates to the CO2e produced by a 19 km car journey. So, contrary to popular belief, the use of your own car is not the only decisive factor in determining your personal carbon footprint. Dietary habits also play a significant role; this is an area in which it is easy to save lots of emissions with a few simple measures.
eaternity.ch

4544
Alongside consuming mainly plant-based products, the most important aspects of climate-friendly eating habits are the origin of the food and the time of year. Choosing regionally produced food products reduces greenhouse gas emissions thanks to short transport routes. Seasonal products in Swit-zerland and abroad can be produced without additional effort (e.g. heating greenhouses) so the associated emissions are low. Consuming certified organic, ecologically cultivated products can significantly reduce your individual carbon footprint. As opposed to conventional farming, ecological methods forgo the use of nitrogen and nitrate fertilisers. This results in a significant decrease in the greenhouse gas N₂O, which is particularly bad for the climate.
Tip Savings
Reduce your meat consumption by 100 g a day; for comparison: on average, a burger contains 150 g of meat
344 kg CO2e savings per person per year are possible with 100 g less of meat each day
Choose organic products when shopping
Savings of 5–15 % CO2e possible
Opt for fresh ingredients with minimal processing instead of frozen products
Fresh potatoes: 200 g CO2e per kg; frozen chips: 5.7 kg CO2e per kg 96 % saving
Reduce your consumption of other animal products
On average a 16 % CO2e saving is possible by switching to a vegan diet from a vegetarian one and a 26 % CO2e saving is possible by forgoing meat and switching to vegetarian
CareElite (2018), myclimate, Scarborough et al. (2014), Lindenthal et al. (n.d.) eaternity.ch, wwf.ch, bmu.de

4746
1258 g CO₂
0 g 600 g100 g 200 g 700 g 800 g400 g 1000 g300 g 900 g500 g 1100 g 1200 g
Recipe at
myclimate.org/
zeroburger
Our diet has a huge impact on our personal carbon footprint. Vegetarian alternatives to meat products, such as myclimate’s “Zero Burger”, are tasty and significantly more climate friendly. A vegan burger causes less than a sixth of the CO₂ emissions generated by a meat burger. This comparison shows that substituting just one meat meal with a vegan alternative per week considerably reduces CO₂ emissions – all without sacrificing taste.
Zero burger recipe: myclimate Germany, meat recipes: swissmilk.ch, bettybossy.ch, myclimate calculations, photo: roberthoernig.com
Zero burger (175 g)
Meat burger (175 g)
198 g CO₂
Vegan burger versus meat burger

4948
Food Waste
In our society, appreciation of the value of everyday items is significantly diminished. In particular, a huge variety of food is available everywhere at low prices, which encourages a more thoughtless lifestyle. Each year around 1.3 billion tonnes of food are wasted worldwide. In Europe, it is estimat-ed that 88 million tonnes are wasted, which corresponds to around 173 kg per person. With regard to total European consumption, a good 20 per cent of food that is produced is not used as intended, but is simply thrown away. Around 50 per cent of avoidable losses are attributable to us as individ-ual end consumers. Some 170 million tonnes of CO₂ are produced from the disposal of food waste alone in the EU.This is equivalent to the entire transport sector in Germany per year.
Food waste is also an economic and social issue, costing around 143 billion euros every year at a time when 42 million Europeans still cannot afford proper meals.
1.3 bil. t. per year
88 mil. t. per year
European Parliament, UBA (2017), wwf.ch

5150
Clothing
Clothing consumption in the last decades has risen sharply; within the last 15 years global sales have almost doubled. Central Europeans purchase on average 65 to 70 new items of clothing each year, motivated by huge and frequently changing offerings and cheap prices. In the midst of such intensive consumer behaviour, little thought is given to the high water and energy consumption involved in the produc-tion of raw materials, international distribution and, finally, disposal. Statistics show that 40 per cent of all clothing purchased is never even worn. By adjusting our behaviour and consuming more consciously, greenhouse gas emissions in the clothing sector can be drastically reduced too.
Tip Savings
When making a purchase,be aware of the material, its origin and the place where the textiles were processed
A t-shirt made from organic cotton in Europe has around an 80 % lower carbon footprint than a comparable cotton shirt from China, which must be transported to Central Europe by air
greenpeace-magazin.ch (2015), worldwatchers Paper: Elemental LCA, publication, study by myclimate and Tutti.ch, 2019
33.4 kg CO₂e
Made in China
Emissions caused by production of a pair of jeans
4.8 kg CO₂e
0.7 kg CO₂e
Made in Germany (Bio)
Extra tips – Pay attention to quality and processing when shopping.
The longer you wear the item, the better its carbon footprint.
– Weigh up shopping online and on the high street.
– Place group orders. If you choose to shop on the high street, it is best to combine this trip with other appoint-ments and to use local public transport.

5352
Second hand
There are lots of options for reducing your personal carbon footprint. Although the main goal is to reduce your consumption of re-sources, a climate-friendly lifestyle doesn’t necessarily mean you have to miss out. Rather, it is a question of adopting conscious and sustainable shopping habits. One exam-ple of this would be purchasing second-hand items. As a result of the high levels of con-sumption in Europe, many still usable prod-ucts and fully functional electronic devices are thrown out. If these items were resold, often buyer and seller would be financially better off and, at the same time, enormous quantities of CO2e could be avoided. By purchasing a used TV, the approx. 640 kg CO₂e in emissions generated by a new device can be saved. Depending on allocation, it is possible to save the entire 640 kg CO₂e. A calculation of the CO2e savings generated through second-hand purchases on online platforms in Europe with around 60 million users per year estimates the annual emis- sions savings at around 16.3 million tonnes.
Study by myclimate and Tutti.ch, 2015, Schibsted 2017
0 200100 300 400 500 600 700
TV
Fridge
Sofa
Exercise bike
Laptop
Bicycle
Vacuum cleaner
Tablet
Table
Digital camera
Sewing machine
Mobile
Drawer unit
Co�ee machine
kg CO₂e/unit
Average CO₂ emissions for new devices/objects
39
48
50
75
77
80
98
210
297
378
437
638
109
91

5554
100 km per person in average regional and distance tra�c
100 km per person (EU average)
ICE4.8 kg CO₂e12 kg CO₂e
1116 t CO₂eper year
Online shopping (Switzerland): approx. 7 mil. Zalando returns per year with an average parcel weight of 3 kg
1050–1125 kgCO2e per year
Vegan Vegetarian
The numbers give a spectrum of the greenhouse gas emissions from various average forms of European nutrition in kg CO₂e per person per year.
Flexitarian Meat intake
1280–1390 kgCO2e per year
1500–1700 kgCO2e per year
≤ 1800 kgCO2e per year
European Environment Agency, ecoinvent.org, wwf.ch, fea.ch, logistik-watchblog.de, blog.carpathia.ch, mobitool.ch, web.de, myclimate calculations, Swiss Academy of Natural Sciences (numbers rounded), bafu.admin.ch, naturwissenschaften.ch, Statista 2020
Emissions per Activity
Tumble dryer emissions (Energy class B):542 g CO₂e/cycle
Cardboard vs plastic �lm vs aluminium
1.1 kg CO₂e
1 kg1 kg
19 kg CO₂e2–3 kg CO₂e
1 kg
250 ml white coffee =0.16 kg CO₂e/contents250 ml coffee cup =0.015 kg CO₂e/card cup
The contents are ten times as damaging to the environment as the packaging!
Cooking with a lid saves 20 % CO₂e
20 g CO₂e/l boiling water
25 g CO₂e/l boiling water
One Google search generates around 10 g CO₂e; 2 billion annual searches worldwide ≈ 20 mil. t CO₂e; 20 searches a day x 365 = 73 kg personal CO₂e emissions per year

5756
A few examples of how you can reduce CO2e have been given on the previous pages. Unfortunately, even the most careful person cannot avoid producing emissions entirely. Neverthe-less, you can take responsibility for them.
How can I take Responsibility?
“One waits for times to change, while another seizes the day and takes action.”Dante Alighieri, Italian poet, 1265–1321
5958
IPCC Special Report (2018). Global Warming of 1.5ºC
Global Warming and your Carbon Footprint
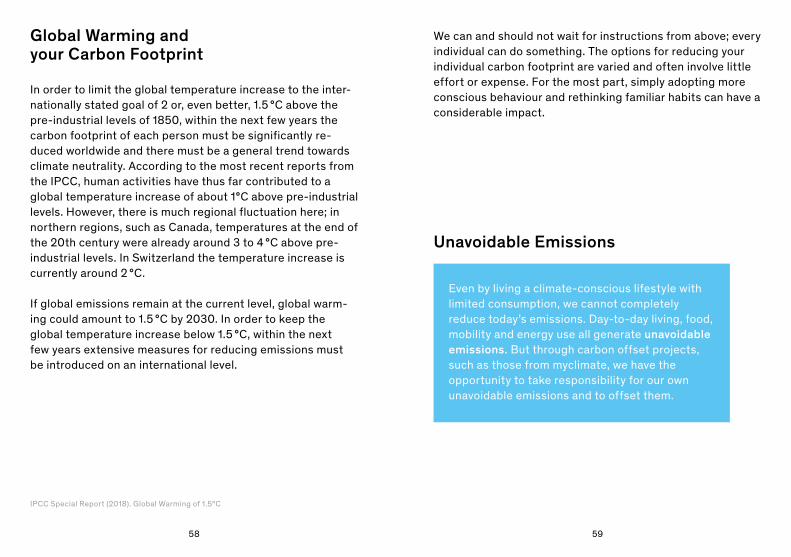
Unavoidable Emissions
In order to limit the global temperature increase to the inter-nationally stated goal of 2 or, even better, 1.5 °C above the pre-industrial levels of 1850, within the next few years the carbon footprint of each person must be significantly re- duced worldwide and there must be a general trend towards climate neutrality. According to the most recent reports from the IPCC, human activities have thus far contributed to a global temperature increase of about 1°C above pre-industrial levels. However, there is much regional fluctuation here; in northern regions, such as Canada, temperatures at the end of the 20th century were already around 3 to 4 °C above pre- industrial levels. In Switzerland the temperature increase is currently around 2 °C.
If global emissions remain at the current level, global warm-ing could amount to 1.5 °C by 2030. In order to keep the global temperature increase below 1.5 °C, within the next few years extensive measures for reducing emissions must be introduced on an international level.
We can and should not wait for instructions from above; every individual can do something. The options for reducing your individual carbon footprint are varied and often involve little effort or expense. For the most part, simply adopting more conscious behaviour and rethinking familiar habits can have a considerable impact.
Even by living a climate-conscious lifestyle with limited consumption, we cannot completely reduce today’s emissions. Day-to-day living, food, mobility and energy use all generate unavoidable emissions. But through carbon offset projects, such as those from myclimate, we have the opportunity to take responsibility for our own unavoidable emissions and to offset them.

6160
0
10
20
30
40
50
60
Annu
al e
mis
sion
s (G
t CO
₂e/y
ear)
13.4
13.6
13.8
14.0
14.2
14.4
14.8
14.6
Aver
age
glob
al te
mpe
ratu
re o
n av
erag
e
CO₂ emissionsCH₄ emissionsN₂O emissions
Average global temperature
Since the 1970s, the global temperature increase has been exponential! 1850–2014: 1°C
1850 1858 1866 1874 1882 1890 1898 1906 1914 1922 1930 1938 1946 1952 1962 1970 1978 1986 1994 2002 2014
Climatewatch (n. d.), PIK (2017), IPCC (2013c), ACIA (2004)
Development of the last 164 Years
6362
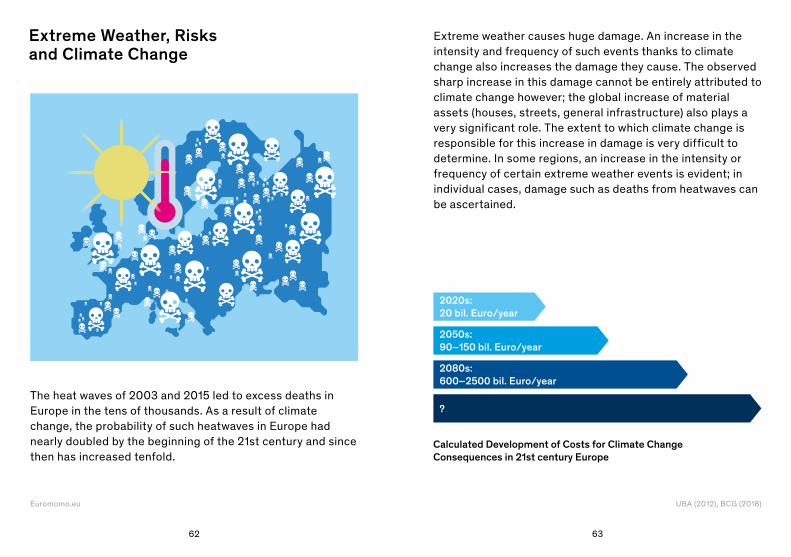
Extreme weather causes huge damage. An increase in the intensity and frequency of such events thanks to climate change also increases the damage they cause. The observed sharp increase in this damage cannot be entirely attributed to climate change however; the global increase of material assets (houses, streets, general infrastructure) also plays a very significant role. The extent to which climate change is responsible for this increase in damage is very difficult to determine. In some regions, an increase in the intensity or frequency of certain extreme weather events is evident; in individual cases, damage such as deaths from heatwaves can be ascertained.
The heat waves of 2003 and 2015 led to excess deaths in Europe in the tens of thousands. As a result of climate change, the probability of such heatwaves in Europe had nearly doubled by the beginning of the 21st century and since then has increased tenfold.
Euromomo.eu UBA (2012), BCG (2018)
Extreme Weather, Risks and Climate Change
2020s: 20 bil. Euro/year
2050s: 90–150 bil. Euro/year
2080s: 600–2500 bil. Euro/year
?
Calculated Development of Costs for Climate Change Consequences in 21st century Europe

6564
The Work of myclimate
myclimate is a charitable organisation and your partner for effective climate protection, globally and locally. Together with partners from the business sector, as well as private individuals, myclimate wants to shape the future of the world through consultation and educational programmes, as well as its own projects.
Generally speaking, myclimate carbon offset projects are implemented in developing countries, as in such places steps can be taken at comparatively low cost to protect the climate and more: these initiatives have been proven to contribute to the fulfilment of the United Nations’ Sustainable Develop-ment Goals (SDGs). These include, for example, fighting poverty, hunger, illness and unemployment, the improvement of schooling and also the improvement of gender equality. It doesn’t matter to the climate where greenhouse gas emis- sions are reduced and saved; what’s important is that a reduction takes place overall.
TrainingThrough our interactive and action-orientated education- al programmes, we encour-age everyone to make a contribution to our future.
Carbon Offset ProjectsWith our projects of the highest quality, we promote quantifiable climate protec-tion and sustainable development worldwide.
Consulting and SolutionsWe advise companies on integrated climate protec-tion with tangible added value. This is done through analyses, IT solutions, awards and resource management.

6766
Carbon Offset Project “Solar Energy for Education and Jobs”
Some 2.5 billion people, around a third of the global popula-tion, live without a reliable energy supply. Kerosene is often used as a fuel for the production of electricity, but it is expen-sive and produces lots of emissions. Thanks to a myclimate project, people in Tanzania can acquire subsidised solar panels, adapted to their energy demands, which include a battery, light source and a mobile phone charger. Microfinan-cing systems within the project framework also help to make the investment.
The people are no longer dependent on natural light, enabling children to learn for longer in the evening and adults to gene- rate additional income. Installation is carried out by the local population, which creates additional jobs. The contribution to climate protection currently amounts to a 10,000 tonne CO2e saving per year.
Light increases the sense of security. Photo: mobisol/myclimate Solar energy opens up income opportunities. Photo: mobisol/myclimate

6968
Carbon Offset Project “Clean Drinking Water for Schools and Households”
In many regions of the world, particularly south of the Sahara, there is still little or no access to clean drinking water. Without chemical or physical treatment of the water before drinking or use in cooking, there is a high risk of various diseases. In Uganda, around 40 per cent of the population boil water before it is used, primarily through burning wood. This results in an increasing rate of deforestation. In addition, since people must travel ever farther to collect the wood, this work is increasingly time consuming for the local population.
With various simple, yet effective filter technologies, myclimate has already given many people access to clean drinking water and thus significantly improved their living conditions. For example, children who catch fewer diseases can attend school more regularly. “Previously, we had to purify the water with chemical tablets, since we were unable to boil a sufficient amount. It tasted awful, the tablets were expensive and not always available,” explains Mulindwa Muhammed Noor, Headmistress of Kawempe Mbogo School. The annual reduction of CO2e emissions through this project is around 61,500 tonnes.
The 900 pupils of Kawempe Mbogo School can drink water at any time. Photo: myclimate
Water preparation system of Nkumba Talemwa Junior School in Entebbe. Photo: myclimate

7170
Carbon Offset Project “Efficient Boilers save Habitat for the last of the Mountain Gorillas”
Inefficient cookers using wood as fuel cause Earth huge problems in many regions. Alongside the smoke produced by combustion, local ecosystems, and rainforests in particular, are jeopardised by the ever-increasing demand for wood resulting from higher population numbers. This is having a particularly profound effect on Rwanda’s mountain gorillas, of which there are just 1 000 left in the world.
myclimate is working with local players and developing cheap, efficient cookers for the population. These reduce wood consumption by about two thirds, protecting both the rainforest and the mountain gorillas, while improving the living conditions of the local population too.
Money and time savings resulting from a decreased need for wood allow women and children to take part in other activi-ties, promote education and create new jobs, as the cookers are produced and installed by local people. The significant decrease in smoke generated inside huts measurably im- proves the health and living standards of children and women above all. The project saves a total of 72,000 tonnes CO2e per year.
Photos: Likano/myclimate

7372
Carbon Offset Project “Mangrove Reforestation and Female Empowerment”
The goal is to create healthy mangrove forests in a coastal region of Myanmar, which absorb CO₂, protect the population from natural disasters and promote biodiversity by providing a crucial habitat for endangered species. The project con- nects the local population with the replenishment of the degraded mangrove ecosystems while simultaneously improving their quality of life.
C
C C
CC
CCC
CO2
CO2CO2
CO2
CO2
CO2
C

7574
Glossary
CH4: Methane – chemical compound of carbon and hydrogen. Primary constituent of natural gas. Second most significant greenhouse gas generated by human activity.
CO2: Carbon dioxide – chemical compound of carbon and oxygen. By far the most significant greenhouse gas generated by human activity.
CO2e: CO₂ equivalents. For the emission of greenhouse gases other than CO₂, the equivalent amount of CO₂ is calculated on the basis of the respective greenhouse effect of the gas. These “virtual” CO₂ emissions are then added together and provide the sum total of CO₂ equivalents.
Emission: The release of gases (here greenhouse gases) or their precursors into the atmosphere above a certain region and within a certain time period.
Final energy: The form of energy that is used by consumers (e.g. heating oil, petrol, electricity, etc.).
Energy efficiency: The ratio of energy output and use. The greater the utility of the energy volume used, the greater the energy efficiency.
Renewable energy: Forms of energy that regenerate themsel-ves such as solar, wind or geothermal energy.
Warming potential: Warming potential compares the climate impact of a unit of a given greenhouse gas to the climate impact of a unit of CO2. We use warming potential to calculate CO₂ equivalents.
Fossil energy: Energy from combustible fuels, which were created by the bacterial decomposition of dead plants and animals. Fossil energies are not renewable. Examples are black and brown coal, natural gas and crude oil. Although an element, uranium is also included here.
Embodied energy: Energy volume used for the manufacture, transport, storage, sale, disposal, etc. of goods.
Gt: Gigatonne (factor 109)
kWh: Kilowatt hour (factor 10³)
Mt: Megatonne (factor 106)
N2O: Nitrous oxide
OHC: Ocean heat content
ppb/ppm: parts per billion/million. Relative indication of the concentration of gases in the air.
Primary energy: Primary energy is the inherent energy pre-sent in energy sources (e.g. the fuel value of coal). Primary energy is converted in power plants, refineries, etc. into final energy (usable energy such as electricity or heat). This con-version incurs energy losses.
kt: Kilotonne (factor 10³)
TWh: Terawatt hour (factor 1012)

7776
Bibliography
ACIA (2004). Impacts of a warming Arctic. Retrieved on 20.07.18 from https://www.amap.no/documents/download/1058.
CareElite (2018). Plastikmüll Zahlen, Fakten & Studien 2017/2018. Retrieved on 13.08.20 from https://www.careelite.de/plastik-muell-fakten/.
Climatewatch (n. d.). Global Historical Emissions. Retrieved on 13.08.20 from https://www.climatewatchdata.org/ghg-emissions?source=32&version=2.
CSI (n. d.). Natural Causes of Climate Change. Retrieved on 28.06.18 from http://www.ces.fau.edu/nasa/module-4/causes-2.php.
Eaternity (2020). Climate Score. Retrieved on 14.08.2020 from https://eaternity.org/foodprint/climate-score.
EPA (n.d.). Global Greenhouse Gas Emissions Data. Retrieved on 13.08.20 from https://www.epa.gov/ghgemissions/global-greenhouse-gas-emissions-data.
European Union (2019). Going climate neutral by 2050, a strategic long-term vision for a prosperous, modern, competitive and climate-neutral EU- economy, a publication of the European Commission. Retrieved on 13.11.20 from https://op.europa.eu/de/publication-detail/-/publication/92f6d5bc-76bc-11e9-9f05-01aa75ed71a1.
European Parliament (2017). Food waste: the problem in the EU in numbers. Retrieved on 13.11.20 from https://www.europarl.europa.eu/news/en/headlines/society/20170505STO73528/lebensmittelverschwendung-in-der-eu-infografik.
European Commission (2020). Reducing emissions from aviation. Retrieved on 13.11.20 from https://ec.europa.eu/clima/policies/transport/aviation_en.
European Commission (2020). In focus: Renewable energy in Europe. Retrieved on 13.11.20 from https://ec.europa.eu/info/news/focus-renewable-energy-europe-2020-mar-18_en.
European Environment Agency (2019). Greenhouse gas emissions from transport in Europe. Retrieved on 13.11.20 from https://www.eea.europa.eu/data-and-maps/indicators/transport-emissions-of-greenhouse-gases/transport-emissions-of-greenhouse-gases-12.
European Environment Agency (2019). Average carbon dioxide emissions from new passenger cars. Retrieved on 13.11.20 from https://www.eea.europa.eu/data-and-maps/daviz/average-emissions-for-new-cars-5#tab-chart_1.
Eurostat (2018). Energy consumption in households by type of end-use. Retrieved on 13.11.20 from https://ec.europa.eu/eurostat/de/web/products-eurostat-news/-/DDN-20200626-1.
Eurostat (2018). Greenhouse gas emission statistics – emission inventories. Retrieved on 13.11.20 from https://ec.europa.eu/eurostat/statistics-explained/index.php/Greenhouse_gas_emission_statistics_-_emission_inventories#Trends_in_greenhouse_gas_emissions.
Eurostat (2018). Eurostat news release, Energy consumption in 2018. Retrieved on 13.11.20 from https://ec.europa.eu/eurostat/documents/2995521/10341549/8-04022020-BP-DE.pdf/3e62b994-68fb-0ea8-7d29-f1769272bf5a.
Eurostat (2019). Population statistics by age and sex. Retrieved on 13.11.20 from https://appsso.eurostat.ec.europa.eu/nui/show.do?dataset=demo_pjan&lang=de.
Eurostat (2020). Aircraft traffic data by reporting country. Retrieved on 13.11.20 from https://ec.europa.eu/eurostat/databrowser/view/avia_tf_acc/default/table?lang=en.
Eurostat (2020). Greenhouse gas emissions per capita. Retrieved on 13.11.20 from https://ec.europa.eu/eurostat/tgm/refreshTableAction.do?tab=table&plugin=1&pcode=t2020_rd300&language=en.
Eurostat (2020). People on the move statistics on mobility in Europe 2020 edition. Retrieved on 13.11.20 from https://ec.europa.eu/eurostat/cache/digpub/eumove/index.html?lang=en
EuroMOMO (2020). Graphs and maps. Retrieved on 13.11.20 from https://www.euromomo.eu/graphs-and-maps.
GCA (2017). CO₂ Emissions. Retrieved on 28.06.18 from http://www.globalcarbonatlas.org/en/CO₂-emissions.
Greenpeace (2017). Konsumkollaps durch Fast Fashion. Retrieved on 28.06.18 from https://www.greenpeace.de/sites/www.greenpeace.de/files/publications/s01951_greenpeace_report_konsumkollaps_fast_fashion.pdf.
Greenpeace (2017). 10 Jahre Smartphone – Die globalen Umweltfolgen von 7 Milliarden Mobiltelefonen. Retrieved on 26.03.19 from https://www.greenpeace.de/sites/www.greenpeace.de/files/publications/s01981_greenpeace_report_10_jahre_smartphone.pdf.
IEA (2020). Data and statistics. Retrieved on 13.11.20 from https://www.iea.org/data-and-statistics?country=EU28&fuel=CO₂%20emissions&indicator=CO₂BySource.
IEA (2020). Key World Energy Statistics 2020. Retrieved on 13.11.20 from https://www.iea.org/reports/key-world-energy-statistics-2020.
Infoclimat.fr (2019). Temperature progression in June 2019 in Paris Retrieved on 13.11.20 from https://www.infoclimat.fr/observations-meteo/archives/1er/juin/2019/paris-montsouris/07156.html.

7978
IPCC (2013a). Chapter 3 Observations: Ocean. Retrieved on 28.06.18 from https://www.ipcc.ch/pdf/assessment-report/ar5/wg1/WG1AR5_Chapter03_FINAL.pdf.
IPCC (2013b). Information from Paleoclimate Archives. Retrieved on 17.07.18 from https://www.ipcc.ch/pdf/assessment-report/ar5/wg1/WG1AR5_Chapter05_FINAL.pdf.
IPCC (2013c). Summary for Policymakers. Retrieved on 17.07.18 from https://www.ipcc.ch/pdf/assessment-report/ar5/wg1/WG1AR5_SPM_FINAL.pdf.
IPCC (2014). Chapter 5 Drivers, Trends and Mitigation. Retrieved on 28.06.18 from https://www.ipcc.ch/pdf/assessment-report/ar5/wg3/ipcc_wg3_ar5_chapter5.pdf.
IPCC Special Report (2018). Global Warming of 1.5ºC. Retrieved on 18.08.20 from https://www.ipcc.ch/sr15/.
Munich Re (2019). Retrieved on 14.08.20 from https://www.munichre.com/de/loesungen/fuer-industriekunden/natcatservice.html#1675154658.
Nature Climate Change (2014). https://www.nature.com/articles/nclimate2468.
Olivier, J.; Peters, J. (2019). Trends in Global CO₂ and Total Greenhouse Gas emissions. Summary of the 2019 Report. Retrieved on 18.08.20 from https://www.pbl.nl/en/publications/trends-in-global-co2-and-totaal-greenhouse-gas-emissions-summary-of-the-2019-report.
Perkins-Kirkpatrick, S. E.; Lewis, S. C (2020). Increasing trends in regional heatwaves. Nat Commun 11, 3357.
ProClim − Forum for Climate and Global Change. https://naturwissenschaften.ch.
Robine, J. M.; Cheung, K.; Roy, S.; Oyen, H.; Herrmann, F. (2007). Report on excess mortality in Europe during summer 2003. EU Community Action Programme for Public Health, Grant Agreement.
Scarborough, P.; Appleby, P. N.; Mizdrak, A.; Briggs, A. D. M.; Travis, R. C.; Bradbury, K. E.; Key, T. J. (2014). Dietary greenhouse gas emissions of meat-eaters, fish-eaters, vegetarians and vegans in the UK.
Schibsted (2017). The Second Hand Effect Report 2017. Retrieved on 03.07.18 from https://secondhandeffect.schibsted.com/wp-content/uploads/2017/04/PDF-Rapport_2017.pdf.
Statista (2020). Höhe der Treibhausgasemissionen in der EU-28 nach Gas im Jahresvergleich 2000 und 2018. Retrieved on 13.11.20 from https://de.statista.com/statistik/daten/studie/311892/umfrage/treibhausgasemissionen-in-der-eu-28-nach-gasen-im-jahresvergleich/.
Tagesschau (2019). Warum anderswo weniger in der Tonne landet. Retrieved on 13.11.20 from https://www.tagesschau.de/inland/containern-lebensmittel-verschwendung-101.html.
TextileExchange (2014). The Life Cycle Assessment of Organic Cotton Fiber – A Global Average. Retrieved on 11.07.18 from https://textileexchange.org/wp-content/uploads/2017/06/TE-LCA_of_Organic_Cotton-Fiber-Summary_of-Findings.pdf.
Tutti (n. d.). Klima. Retrieved on 14.08.20 from http://www.klima.tutti.ch/.
UBA (2013). Ist nicht Wasserdampf statt CO₂ das wichtigste Treibhausgas? Retrieved on 14.08.20 from https://www.umweltbundesamt.de/service/uba-fragen/ist-nicht-wasserdampf-statt-co2-das-wichtigste.
UBA (2014). Klima und Treibhauseffekt. Retrieved on 14.08.20 from https://www.umweltbundesamt.de/themen/klima-energie/klimawandel/klima-treibhauseffekt#textpart-1.
UBA (2017). Atmosphärische Treibhausgas-Konzentrationen. Retrieved on 14.08.20 from https://www.umweltbundesamt.de/daten/klima/atmosphaerische-treibhausgas-konzentrationen#textpart-1.
UBA (2017). Pressemitteilung Klimabilanz 2017. Retrieved on 13.11.20 from https://www.umweltbundesamt.de/presse/pressemitteilungen/klimabilanz-2017-emissionen-gehen-leicht-zurueck.
UNEP (2019). Emissions Gap Report 2019. https://www.unenvironment.org/resources/emissions-gap-report-2019.
Worldwatchers (2019). TRIGEMA T-Shirts mit gutem CO₂-Footprint. Retrieved on 28.06.18 from https://www.worldwatchers.org/news/trigema-t-shirts-mit-gutem-co2-footprint.
WWF (2010). Bekleidung und Umwelt. Retrieved on 28.06.18 from https://www.wwf.de/fileadmin/fm-wwf/Publikationen-PDF/HG__Bekleidung_Umwelt_BB_JE_06_2010.pdf.
WWF (2015). Das grosse Wegschmeissen. Vom Acker bis zum Verbraucher: Ausmass und Umwelteffekte der Lebensmittelverschwendung in Deutschland. Retrieved on 09.07.18 from https://www.wwf.de/fileadmin/fm-wwf/Publikationen-PDF/WWF_Studie_Das_grosse_Wegschmeissen.pdf.
WWF (n. d.). Fleisch und Milchprodukte. Retrieved on 18.08.20 from https://www.wwf.ch/de/unsere-ziele/fleisch-und-milchprodukte.
Zhiyenbek A.; Beretta C.; Stoessel F.; Hellweg S. (2016). Ökobilanzierung Früchte- und Gemüseproduktion. ETH Zürich. https://www.wwf.ch/sites/default/files/doc-2018-02/2017-02-Studie-Fruechte-und-Gemuese-Oekobilanz_0.pdf.
Foundation myclimatePfingstweidstrasse 108005 ZurichT +41 44 500 43 [email protected]
Donations in EUR:Swiss PostAccount number: 91- 377511-5IBAN: CH35 0900 0000 9137 7511 5BIC/SWIFT: POFICHBE
myclimate Deutschland gGmbhKurrerstr. 40/372762 ReutlingenT +49 7121 31 777 [email protected]
GLS Gemeinschaftsbank eGIBAN: DE72 4306 0967 7044 8548 00 BIC/SWIFT: GENODEM1GLS
New issue
© 2020 Foundation myclimate Reproduction for non-commercial use permitted under citation of the source.
Paper made out of 100 % recycled fibres. Editorial support from ProClim – Swiss Academy of Natural Sciences myclimate.org/01-16-158743
Printed matterneutral


![Climate Safeguard System (CSS) booklet [English]](https://static.documents.pub/doc/80x56/568c36591a28ab023597b34d/climate-safeguard-system-css-booklet-english.jpg)


