CLIMATE MODEL SIMULATES GLOBAL COLD CLIMATE DURING LATE MAUNDER MINIMUM (1675-1710) Hans von Storch, Fidel González-Ruoco, Ulrich Cubasch, Jürg Luterbacher, Eduardo Zorita, Beate Müller, Stephanie Legutke, and Ulrich Schlese Visit to JISAO, Seattle, 30. October 2003
Transcript
CLIMATE MODEL SIMULATES GLOBAL COLD CLIMATE DURING
LATE MAUNDER MINIMUM (1675-1710)
Hans von Storch, Fidel González-Ruoco, Ulrich Cubasch, Jürg Luterbacher,
Eduardo Zorita, Beate Müller, Stephanie Legutke, and Ulrich Schlese
Visit to JISAO, Seattle, 30. October 2003
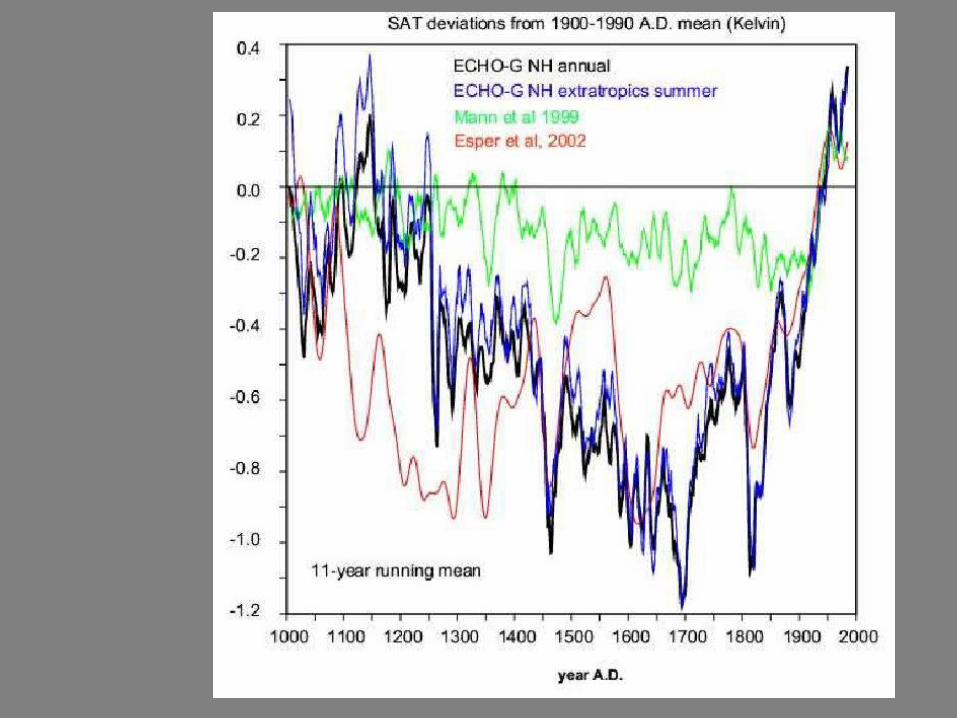
Simulation with ECHO-G (ECHAM4/HOPE-G) for
- 500 years (Columbus-run), and - 1000 years (Erik run)
forced with
- variable solar output- Volcanic aerosol load- GHG concentrations
Ed
uard
o Z
ori
ta,
pers
. co
mm
.
Yegor Dimitriev, pers. comm.
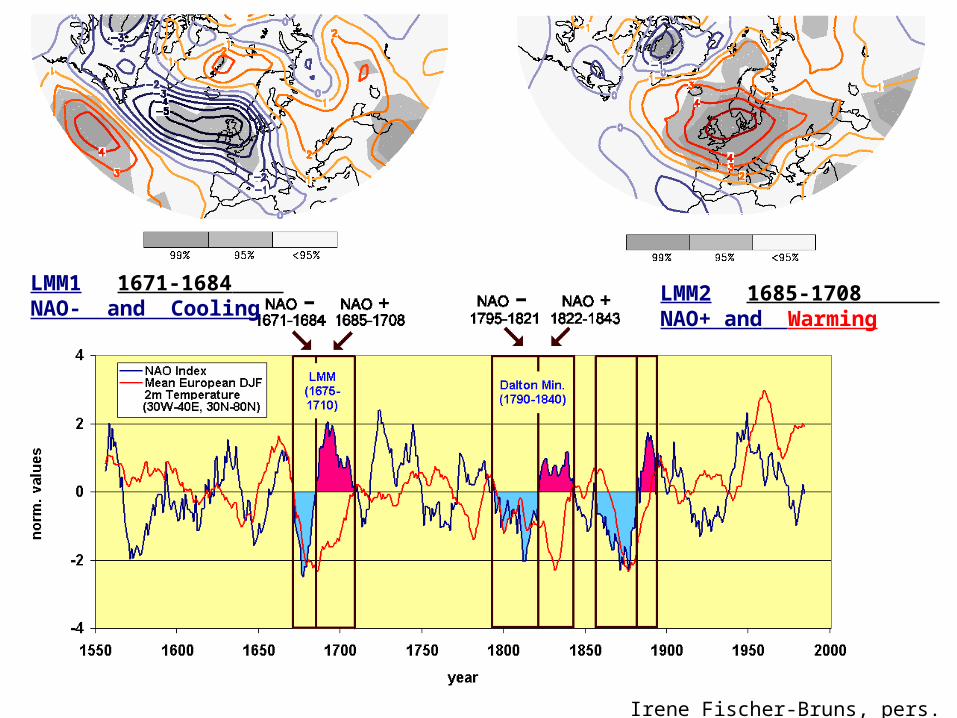
LMM1 1671-1684 NAO- and Cooling
LMM2 1685-1708 NAO+ and Warming
Irene Fischer-Bruns, pers. comm.
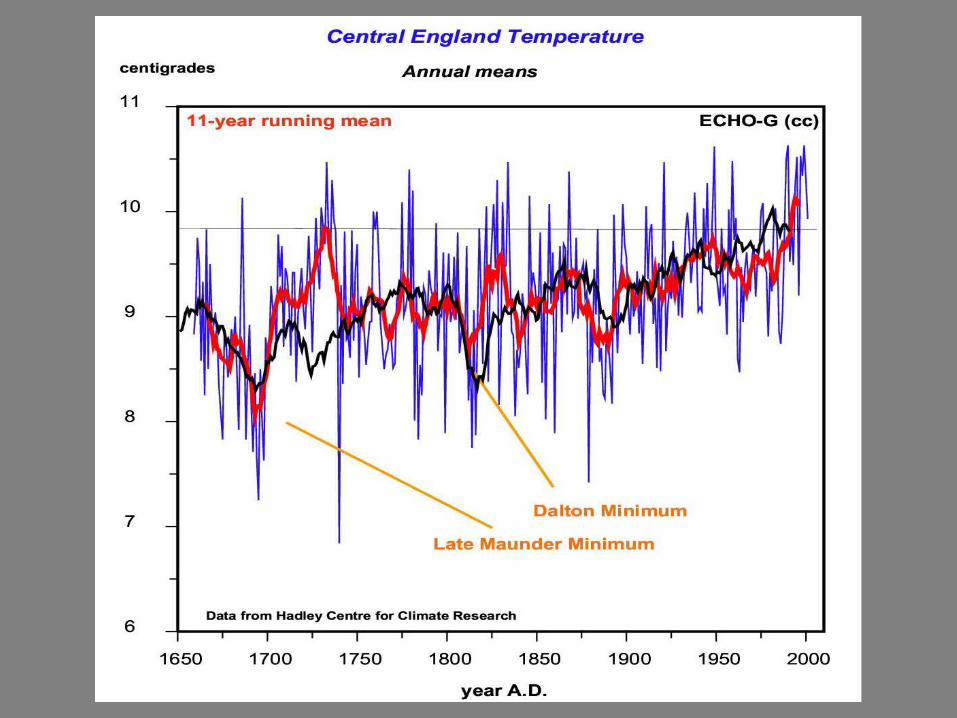
Late Maunder Minimum
Cold winters and springs, 1675-1710
Late Maunder Minimum
Cold winters and springs, 1675-1710
Analysis of Columbus run, only.
Baltic Sea ice winter index after Koslowski (1998)
grey: Index, red: 5 year mean, blue:20 year mean
The Late Maunder Minimum (LMM) is the coldest phase of the so-called ‘Little Ice Age’ with marked climatic variability over wide parts of Europe.
Temperature conditions in Switzerland according to Pfister‘s (1999) classification.
1675-1710vs. 1550-1800
Reconstruction from historical evidence, from Luterbacher et al.
Mean winter temperatures in TallinMean winter temperatures in Tallin as reconstructed by Tarand & Nordli, 2001as reconstructed by Tarand & Nordli, 2001
-12
-10
-8
-6
-4
-2
0
2
1550 1600 1650 1700 1750 1800 1850 1900 1950 2000
Tem
pera
tur [
°C]
Tarand & Nordli Gauß Filter (10 Jahre)
LMM
1675-1710vs. 1550-1800
Reconstruction from historical evidence, from Luterbacher et al.
Late Maunder Minimum
Model-based reconstuction
LMM – reference period, winter
Beate Müller, pers. comm.
Erik
Columbus
Eduardo Zorita, pers. comm.
Simulated global 1675-1710 temperature anomaly
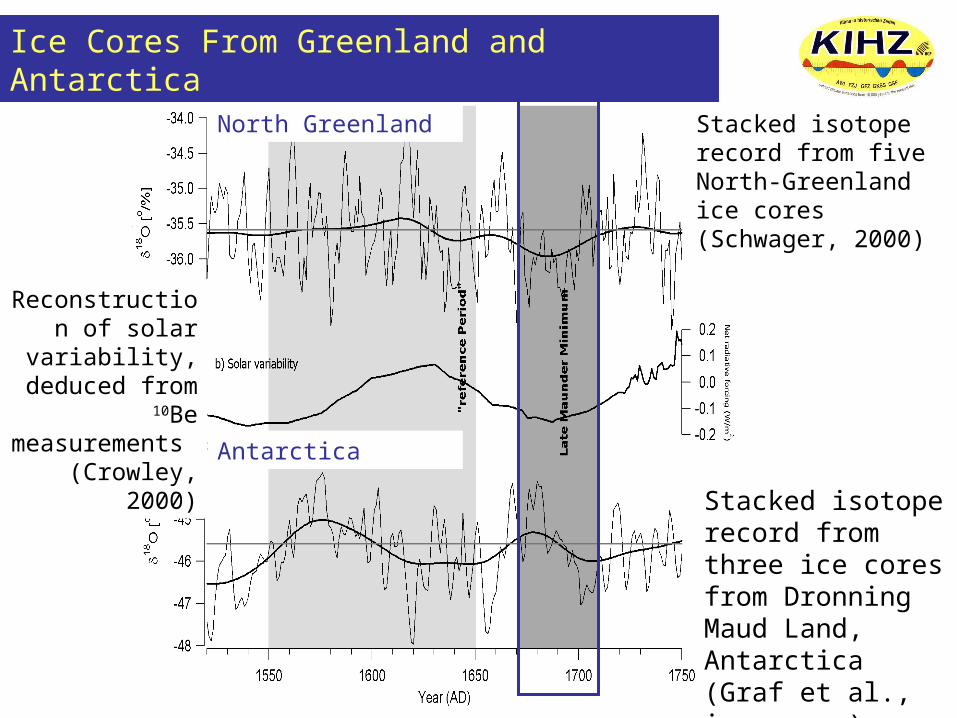
Ice Cores From Greenland and Antarctica
Stacked isotope record from five North-Greenland ice cores (Schwager, 2000)
Stacked isotope record from three ice cores from Dronning Maud Land, Antarctica (Graf et al., in press )
Reconstruction of solar
variability, deduced from
10Be measurements
(Crowley, 2000)
Antarctica
North Greenland
Corals off Madagaskar
The empirically reconstructed 338 year record of variations in sea-surface temperatures as inferred from the 1982-95 annual mean 18O -SST calibration equations using SST observations from different sources.
(From Jens Zinke)
Galapagos (E-Pacific, 1oS, 90oW, Dunbar et al., 1994):
367 years of coral 18O records from 1587-1953, with annual resolution. The intervals 1660-80, 1710-1800 and 1870-95 were found warmer than “normal”, whereas the intervals 1600-1660, 1680-1700 (LMM) and 1800-25 cooler than on average. 18O increases of about 0.1-0.15‰ heavier during LMM than between 1660-70 and 1705-50 is indicative for a cooling of 0.5-0.75K.
New Caledonia (SW-Pacific, 22oS, 166oE, Quinn et al., 1998):
335 years of coral 18O records from 1657-1952, with seasonal resolution. The records describe a brief interval of modest cooling in the late 17th century, with an annual mean SST about 0.2-0.3K cooler between 1680-1740 than between 1660-80 and 1740-50
Great Barrier Reef, Abraham Reef (SW-Pacific, 22oS, 153oE, Druffel and Griffin, 1993):
323 years of coral 18O records from 1635-1957, with bi-annual resolution. More positive 18O values (ca. 0.1‰) during the LMM, are consistent with lower SST’s of about 0.5K
Zin
ke, p
ers.
com
mun
icat
ion
deMenocal et al.
(2000)
Simulated differences of ice coverage, in percent, during the LMM event 1675-1710 and the long term mean 1550-1800.
Information provided by
Fidel González-Rouco andSimon Tett
HadCM3
ECHO-G
differences relative to the 1550-1800 average;25-year running averages.
gridding:
Spatial: 0.5° x 0.5°Temporal: 6 h
REMO Model AreaREMO Model Area
ECHO-G griddingECHO-G gridding
Dynamical downscaling
reconstructed data - REMO reconstructed data - ECHO
DifferencesDifferencesTemperatures in JanuaryTemperatures in January
DifferencesDifferencesTemperatures in JulyTemperatures in July
reconstructed data - REMO reconstructed data - ECHO
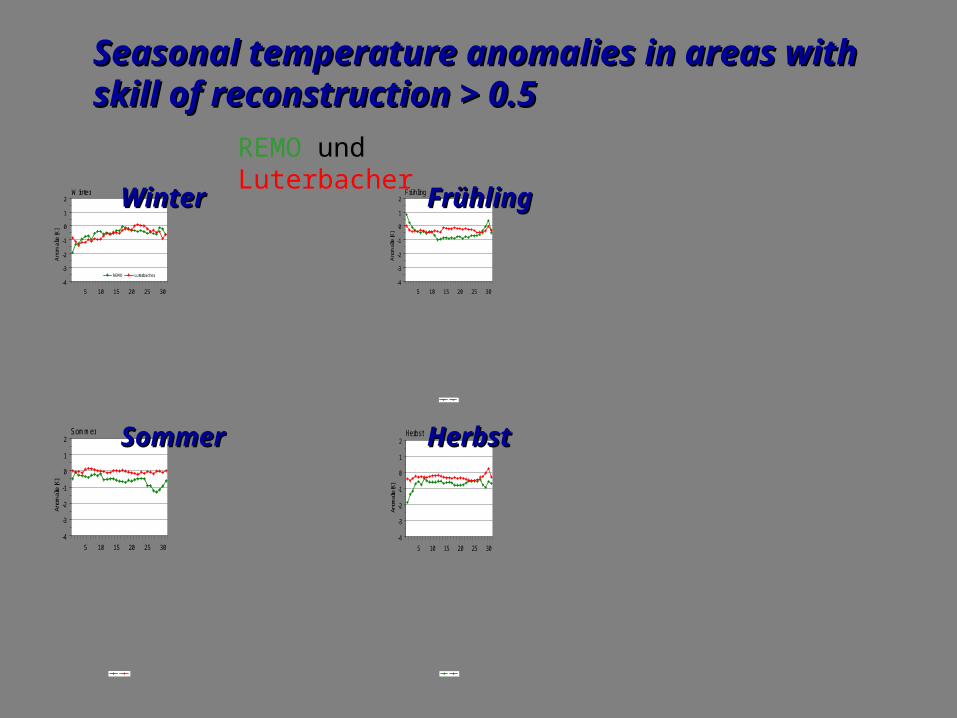
Winter
-4
-3
-2
-1
0
1
2
5 10 15 20 25 30
Ano
mal
ie [K
]
REMO Luterbacher
Frühling
-4
-3
-2
-1
0
1
2
5 10 15 20 25 30
Anom
alie
[K]
Sommer
-4
-3
-2
-1
0
1
2
5 10 15 20 25 30
Anom
alie
[K]
Herbst
-4
-3
-2
-1
0
1
2
5 10 15 20 25 30
Anom
alie
[K]
REMO und Luterbacher
Seasonal temperature anomalies in Seasonal temperature anomalies in areas with skill of reconstruction > 0.5areas with skill of reconstruction > 0.5
WinterWinter
HerbstHerbst
FrühlingFrühling
SommerSommer
Temperaturanomalie des LMM Temperaturanomalie des LMM für Zentral-Englandfür Zentral-England
WinterWinter
-4
-3
-2
-1
0
1
2
5 10 15 20 25 30
Anom
alie
[K]
Manley REMO Luterbacher
256
260
264
268
272
5 10 15 20 25 30
Tem
pera
tur [
K]
LMM Tarand&Nordlivorind. P. Tarand&NordliLMM REMONP REMO
Winterliche Mitteltemperatur und Anomalie Winterliche Mitteltemperatur und Anomalie des LMMdes LMM
für den Tallinner Hafenfür den Tallinner Hafen
MittelMittel
Conclusions
• AOGCM ECHO-G has been integrated with natural forcing (estimates) related to solar output and volcanic aerosols and anthropogenic GHG forcing over several hundred years (Columbus: 450 yrs, Erik the Red: 1000 yrs).
• Both simulations generate a globally cooler Northern winter Earth, 1400-1800, consistent with the concept of LIA. The cooling is considerably larger than described by Mann et al. The 1000 yrs Erik-simulation generates a medieval warm time.
• Both simulations simulate a marked global (north of 30°S) cooling during the Late Maunder Minimum. (Also: Dalton Minimum). The extra cooling amounts to 0.2-0.5K.
• Model simulations consistent with a number of proxy data, in Europe, and across the globe (corals, ice cores).
• Model simulates a significant ice anomaly in the Labrador Sea and adjacent seas during the LMM. NAO not uniform during LMM.