1 www.oeko.de Climate Protection Scenario 2050 Summary of second final report Study conducted on behalf of the German Federal Ministry for the Environment, Nature Conservation, Building and Nuclear Safety Berlin, 26.07.2016 Öko-Institut e.V. Berlin office Schicklerstraße 5-7 D-10179 Berlin Germany Phone: +49 30 405085-0 Fax: +49 30 405085-388 www.oeko.de Fraunhofer ISI Breslauer Str. 48 D-76139 Karlsruhe Germany Phone: +49 721 6809-203 Fax: +49 721 6809-272 www.isi.fhg.de
Transcript
1
ww
w.o
eko.
de
Climate Protection Scenario 2050
Summary of second final report Study conducted on behalf of the German Federal Ministry for the Environment, Nature Conservation, Building and Nuclear Safety
List of figures Figure 2-1: Fulfilment of energy and climate targets for 2050 with 80 % GHG
reduction target 10 Figure 3-1: Total GHG emissions (without LULUCF, international aviation and
maritime transport), 2010-2050 12 Figure 3-2: Relative reduction of GHG emissions compared to 1990 13 Figure 3-3: Total GHG emissions (without LULUCF, international aviation and
maritime transport), 1990-2050 16 Figure 4-1: Change of electricity consumption in CS 80 and CS 95, 2008-2050 18 Figure 4-2: Electricity production and electricity imports in CS 80 and CS 95, 2010-
2050 22 Figure 4-3: Energy consumption of buildings in CS 80 and CS 95, 2008-2050 25 Figure 4-4: Change in final energy consumption of appliances and processes in
households, 2010-2050 28 Figure 4-5: Change in final energy consumption of appliances and processes in the
tertiary sector, 2020 – 2050 compared to 2010 29 Figure 4-6: Change in final energy consumption and reduction of GHG emissions
in the industry sector, 2020 – 2050 compared to 2010 30 Figure 4-7: Change in final energy consumption and reduction of GHG emissions
in transport in CS 80 and CS 95 (w/o internat. aviation and maritime transport), 2020 – 2050 compared to 2010 34
Figure 4-8: GHG emissions of the agricultural sector in CS 80 and in CS 95 37 Figure 4-9: GHG emissions and inclusion of LULUCF sector in CS 80 and CS 95,
2010-2050 41 Figure 5-1: Developments of renewable shares in energy consumption in the
scenarios compared to the target paths of Germany’s energy and climate concept, 2010-2050 42
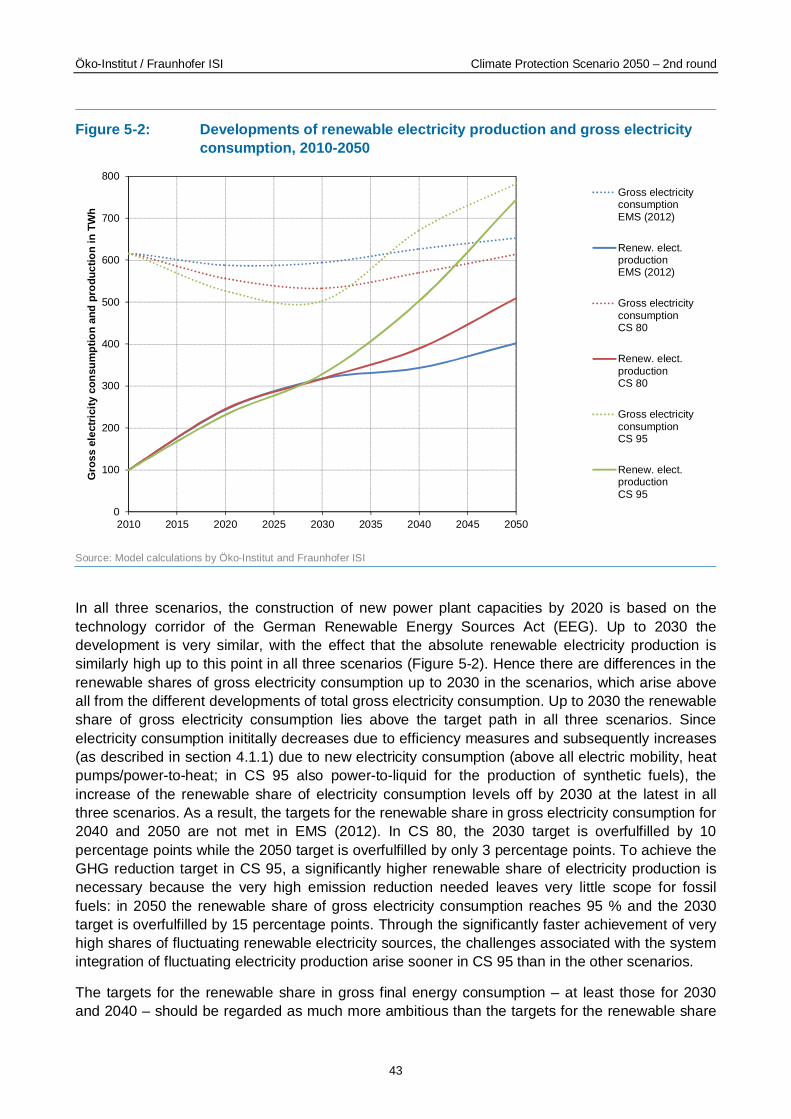
Figure 5-2: Developments of renewable electricity production and gross electricity consumption, 2010-2050 43
Figure 5-3: Development of primary energy consumption, 2010-2050 45 Figure 5-4: Comparison of biomass that is domestically available and used in 2050
in the different scenarios 46
List of tables Table1-1: Target data of Germany’s Energy Concept 2010/2011, the German
Renewable Energy Sources Act (EEG) and the framework for the climate protection scenarios 8
Table 3-1: GHG emissions in 1990 and 2050 and relative emission reductions between 1990 and 2050 11
1. Introduction Combating global climate change is one of the central challenges of this century. It necessitates a huge reduction in greenhouse gas emissions (GHG) and therefore fundamental changes of the energy system as well as the substantial redesign of almost all other economic sectors. Industrialized countries have a special role in this necessary transformation. Given their long history of industrialization, they are predominantly responsible for past, present and foreseeable climate change. At the same time they have the economic and social capacities and innovative potential at their disposal to create the conditions for the necessary global changes.
Against this background, Germany has set very far-reaching long-term targets in the field of climate and energy policy in recent years. With its Energy Concept published in September 2010 and the broader energy policy decisions taken in 2011 towards an energy transition in the areas of climate protection, energy and transport, Germany took its first steps in developing appropriate implementation strategies for the time frame up to the middle of the century. In December 2014 the German government decided on an Action Program for Climate Protection up to 2020 which includes additional measures to enable reliable achievement of the target to reduce Germany’s GHG emissions by 40 % by 2020 compared to 1990. Furthermore, the German government is planning to publish in 2016 a Climate Action Plan for 2050, which specifies the further reduction steps needed to realise the 2050 target in the light of the European targets and the results of the 2015 Paris climate conference. The measures accompanying these steps are being developed within the scope of a broad dialogue process. A far-reaching dialogue and participation process is currently taking place to this end.
The “Climate Protection Scenario 2050” project provides expert support for the German Federal Ministry for the Environment, Nature Conservation, Building and Nuclear Safety in this process.
Many of the sectors that are crucial to the development of GHG emissions have very long-lived capital stocks. This means that the long-term energy and climate targets for key areas and sectors must be implemented within one modernization cycle only (otherwise it can involve huge costs). Extensive measures which involve significant lead times are necessary. These measures include infrastructure development as well as innovation processes for many sectors and areas.
Against this background, the German Federal Ministry for the Environment, Nature Conservation, Building and Nuclear Safety commissioned the consortium of Öko-Institut and Fraunhofer ISI to create and analyze scenarios with different climate policy ambition levels for the period up to 2050.
Key questions of this research project are:
· What emission reduction could be achieved if Germany’s current energy and climate policy is continued?
· What policies and strategies are necessary to achieve the climate protection targets?
· What cost-benefit relationships thereby arise for consumers and the economy?
· Since the energy economic and political environment is very dynamic at the moment, these scenarios should be updated yearly for a period of three years. The results of the second round of modelling should provide, inter alia, the scientific basis for the development of Germany’s Climate Action Plan 2050.
The results of the first round of modelling were published in August 2014. The results of the second round of modelling are now available and are provided in this report. Three scenarios were
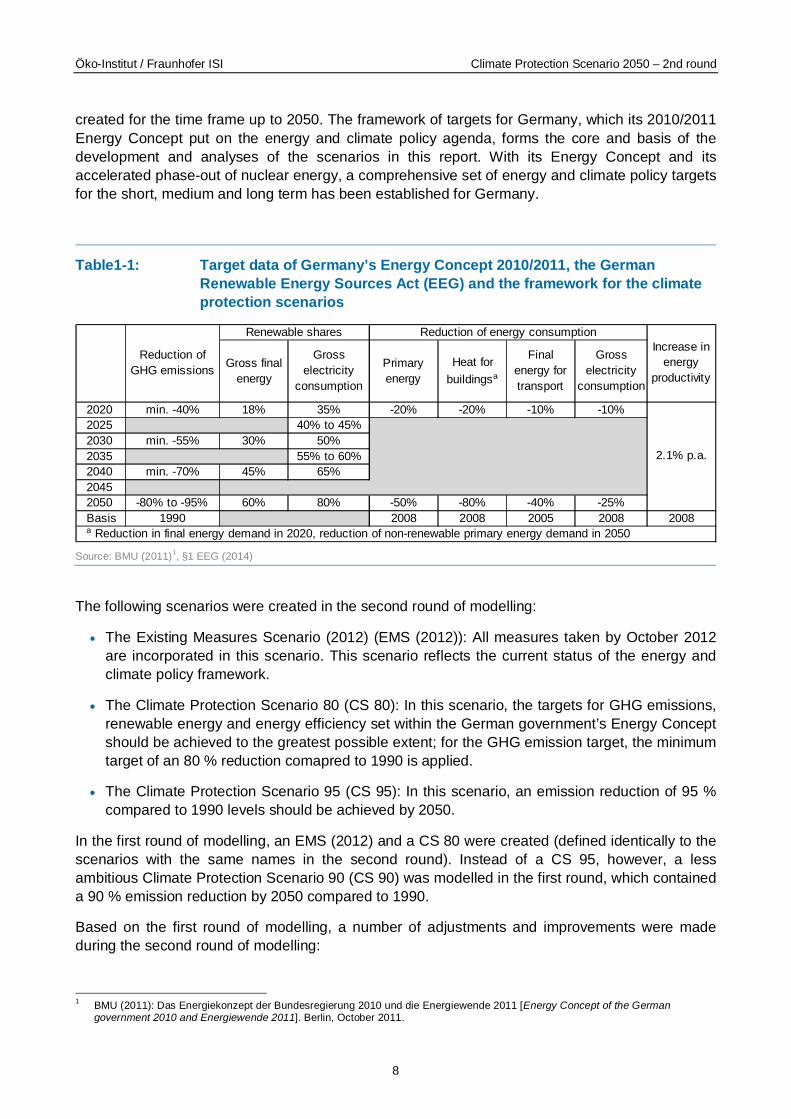
created for the time frame up to 2050. The framework of targets for Germany, which its 2010/2011 Energy Concept put on the energy and climate policy agenda, forms the core and basis of the development and analyses of the scenarios in this report. With its Energy Concept and its accelerated phase-out of nuclear energy, a comprehensive set of energy and climate policy targets for the short, medium and long term has been established for Germany.
Table1-1: Target data of Germany’s Energy Concept 2010/2011, the German Renewable Energy Sources Act (EEG) and the framework for the climate protection scenarios
Source: BMU (2011)1, §1 EEG (2014)
The following scenarios were created in the second round of modelling:
· The Existing Measures Scenario (2012) (EMS (2012)): All measures taken by October 2012 are incorporated in this scenario. This scenario reflects the current status of the energy and climate policy framework.
· The Climate Protection Scenario 80 (CS 80): In this scenario, the targets for GHG emissions, renewable energy and energy efficiency set within the German government’s Energy Concept should be achieved to the greatest possible extent; for the GHG emission target, the minimum target of an 80 % reduction comapred to 1990 is applied.
· The Climate Protection Scenario 95 (CS 95): In this scenario, an emission reduction of 95 % compared to 1990 levels should be achieved by 2050.
In the first round of modelling, an EMS (2012) and a CS 80 were created (defined identically to the scenarios with the same names in the second round). Instead of a CS 95, however, a less ambitious Climate Protection Scenario 90 (CS 90) was modelled in the first round, which contained a 90 % emission reduction by 2050 compared to 1990.
Based on the first round of modelling, a number of adjustments and improvements were made during the second round of modelling:
1 BMU (2011): Das Energiekonzept der Bundesregierung 2010 und die Energiewende 2011 [Energy Concept of the German
government 2010 and Energiewende 2011]. Berlin, October 2011.
Gross final energy
Gross electricity
consumption
Primary energy
Heat for buildingsa
Final energy for transport
Gross electricity
consumption
2020 min. -40% 18% 35% -20% -20% -10% -10%2025 40% to 45%2030 min. -55% 30% 50%2035 55% to 60%2040 min. -70% 45% 65%20452050 -80% to -95% 60% 80% -50% -80% -40% -25%Basis 1990 2008 2008 2005 2008 2008a Reduction in final energy demand in 2020, reduction of non-renewable primary energy demand in 2050
Reduction of GHG emissions
Renewable shares Reduction of energy consumptionIncrease in
· The demographic and overall economic data and the development of primary energy prices and emission allowance prices have been updated.
· The GHG reduction target for 2050 was tightened from 90 % to 95 %: In the second round of modelling, analyses were conducted for how the upper limit of the abatement target set in Germany’s Energy Concept can be fulfilled. Achieving this additional abatement step is a challenging task for most sectors.
· The GHG reduction targets of 80 % and 95 % are achieved in the second round both with and without inclusion of international aviation and maritime transport and land use, land use change and forestry (LULUCF).
· The expansion paths for renewable electricity production were not limited to the terms of reference of the pilot study of the German Federal Ministry for the Environment, but were rather determined in a way consistent with the scenario data used within the modelling.
· The sustainability criteria for the use of biomass were completely revised. Compared to the scenarios in the first round of modelling, this results in the available biomass potential being almost halved.
A complete and detailed description of all results and scenarios and the full description of the methodology used can be found in the long German-language version of this study. In the present summary, only the essential results of the two climate protection scenarios (CS 80 and CS 95) are discussed. Chapter 2 provides an overview of the achievement of the energy and climate targets. Chapter 3 shows the development of the total greenhouse gas emissions in Germany. In Chapter 4 the significant developments in the various sectors and their contribution to fulfilment of the targets are discussed. In Chapter 5, the need for renewable energies in the scenarios and the development of the total primary energy consumption are shown. In Chapter 6, the economic impacts of the climate protection scenarios and questions relating to financing are discussed. In Chapter 7, the final chapter, conclusions are drawn and important starting points derived on this basis for milestones and policy instruments.
2. Fulfilment of the energy and climate targets A comparative consideration of which 2050 targets are under- or overachieved in which scenario is provided in Figure 2-1.
Figure 2-1: Fulfilment of energy and climate targets for 2050 with 80 % GHG reduction target
Note: * Conventional electricity consumption without new consumer groups (heat pumps, electric vehicles, CCS, power-to-gas/-liquid for final consumers, power-to-heat for district heating networks); LULUCF = emissions from land use, land use change and forestry (land use, land-use change and forestry), FED = final energy consumption, PED = primary energy demand.
Source: Modelling results of Öko-Institut and Fraunhofer ISI
In EMS (2012), which reflects the development of energy consumption and GHG emissions on the basis of current policies and measures, none of the energy targets for 2050 are met, resulting in the climate target itself not being achieved. Increasing the renewable share in gross electricity consumption and the reduction of the primary energy demand of buildings bring Germany the closest to the set target.
In CS 80, most targets for 2050 are achieved. The only target not met in the scenario is that for reducing the non-renewable primary energy demand of buildings, which is missed by 2 percentage points. However, the target for reducing final energy consumption in the transport sector is over-fulfilled by 8 percentage points. In terms of their overall effect, the energy targets seem appropriately conducive to fulfilling the climate target of reducing greenhouse gas emissions by 80 % compared to 1990.
To achieve the target of reducing greenhouse gas emissions by 95 % by 2050 compared to 1990, all individual targets must be significantly over-fulfilled in CS 95. On the one hand, the target for the
transport sector (reduction of final energy consumption by 59 % instead of 40 %) has to be substantially overachieved. On the other hand, the results of the CS 95 scenario make clear that greenhouse gas emissions can only decrease by 95 % overall if the renewable shares in gross final energy consumption and gross electricity consumption are significantly expanded (96 % instead of 60 % for gross final energy consumption and 95 % instead of 80 % for gross electricity consumption). Based on the final energy savings being higher overall in CS 95, it follows that the target of increasing energy productivity is also significantly overfulfilled.
3. Development of total greenhouse gas emissions According to the estimate of the German Federal Environment Agency, the country achieved an emission reduction (defined in the conventional way2) of 338 Mt CO2e or 27 % in 2014 compared to 1990 levels. Under this definition, the emissions from land use, land use change and forestry (LULUCF) as well as the emissions from international civil aviation and maritime transport are traditionally excluded and are only provided for information purposes. Taking into account the emissions of international civil aviation and maritime transport, the GHG reduction in 2014 amounts to 306 Mt CO2e, which corresponds to only 25 %. If the emissions of the LULUCF sector are also incorporated, the emission reduction brought about in 2014 amounts to 322 Mt CO2e, which corresponds to only 26 %. Table 3-1, Figure 3-1 and Figure 3-2 provide an overview of the reductions of GHG emissions in the various sectors up to 2050.
Table 3-1: GHG emissions in 1990 and 2050 and relative emission reductions between 1990 and 2050
Color scheme: green = 80 % or 95 % abatement target is achieved, red = 80 % or 95 % abatement target is not achieved Source: Authors‘ own calculations
2 Under the Kyoto Protocol, the emissions of international aviation and maritime transport are not incorporated in national GHG
inventories or the emission reduction targets. LULUCF emissions have only partly been accounted to date.
1990EMS (2012) CS 80 CS 95 EMS (2012) CS 80 CS 95
Energy industry 428.1 169.7 33.2 18.6 -60.4% -92.2% -95.7%Industry 177.3 74.9 30.7 -3.5 -57.7% -82.7% -102.0%Tertiary 88.7 10.2 5.4 1.3 -88.5% -93.9% -98.5%Households 131.5 23.2 16.2 4.6 -82.4% -87.7% -96.5%Transport 164.7 89.6 31.5 2.7 -45.6% -80.9% -98.4%Fugitive emissions from energy 30.1 2.4 1.6 0.4 -91.9% -94.6% -98.7%Industry processes 94.2 55.4 36.4 4.6 -41.1% -61.3% -95.1%Product use 4.5 1.9 1.9 1.9 -58.6% -58.6% -58.6%Agriculture 88.0 68.4 51.1 35.5 -22.2% -42.0% -59.6%Waste management 43.2 5.1 4.2 3.9 -88.2% -90.2% -91.0%Total 1,250.3 500.8 212.3 70.0 -59.9% -83.0% -94.4%For information purposes:Intern. civil air & maritime transport 20.1 52.3 35.6 12.2 +159.5% +76.8% -39.5%LULUCF -35.8 14.7 1.3 -23.0Total incl. data for information purposes 1,234.6 567.8 249.2 59.1 -54.0% -79.8% -95.2%Total incl. int. air & maritime transport 1,270.4 553.1 247.9 82.1 -56.5% -80.5% -93.5%
In the Existing Measures Scenario (2012), the emission reductions in the various sectors are very varied. The energy industry, which was the largest emission source in 1990, makes the largest contribution to emission abatement in absolute terms (258 Mt CO2e), but the reduction only amounts to 60 % when compared to 1990 levels. The emission reductions of the other sectors differ largely, ranging from only 22 % in agriculture to 92 % for fugitive emissions from energy use. The emissions of international aviation and maritime transport are 160 % higher than in 1990. While the LULUCF sector was still an emissions sink in net terms in 1990, it is a significant emission source in 2050.
Under the Kyoto definition, emission reductions of 60 % compared to 1990 are achieved in EMS (2012) overall, which is significantly below the German government’s target of reducing GHG emissions by 80 % to 95 % by 2050. Taking into account the significant increase in emissions attributable to Germany from international aviation and maritime transport and the greenhouse gas emissions from land use, land use change and forestry (LULUCF), emissions reductions of only 54 % compared to 1990 are achieved.
In the Climate Protection Scenario 80, most sectors can reduce their emissions by 80 % to 95 % by 2050 compared to 1990, with the strongest relative reductions taking place in the fugitive emissions of the energy sector (-95 %), the tertiary sector (-94 %) and the energy industry (-92 %). Significantly lower relative reductions take place in the agriculture sector (-42 %), product use (-59 %) and industrial processes (-61 %). The emissions from international aviation and maritime transport are 77 % higher than in 1990.
The energy industry (power plants, thermal power plants, refineries etc.) has to bring about the largest absolute emission reduction, amounting to 395 Mt CO2e compared to 1990. Of this amount, 301 Mt CO2e of the emission reduction comes from the power plants of the public electricity supply alone. The second largest absolute reduction comes from industry, with the combustion- and process-related emissions being reduced by 204 Mt CO2e in total. Significant contributions to absolute emission reductions also come from the transport sector, households and agriculture.
In sum, an 83 % reduction in GHG emissions is achieved compared to 1990 in CS 80. Taking into account international aviation and maritime transport, a reduction of 80 % is achieved. If LULUCF is also incorporated, reductions of approx. 80 % compared to 1990 are achieved.
In the Climate Protection Scenario 95, more far-reaching emission reductions are achieved. To bring this about, several sectors contribute disproportionately to the reduction. The GHG emissions of the energy industry are reduced by 410 Mt CO2e, which corresponds to a 96 % reduction compared to 1990. Of this amount, a reduction of 319 Mt CO2e is brought about by the power plants of public electricity supply. The fugitive emissions of the energy sector even decrease by almost 99 %.
The emissions of industry decrease by 270 Mt CO2e overall, which corresponds to a reduction of more than 99 %. Since biomass use and CCS are sometimes combined in this sector, the energy-related emissions of industry decline by 102 %, thereby creating a small carbon sink. The process-related industry emissions decrease by 95 %.
The emissions of the tertiary sector and domestic transport decrease by approx. 98 % and the emissions of households by 97 %. The emissions of waste management decline only by 91 %, those of the agriculture sector by only 60 % and those of product use by only 59 %. The emissions of international aviation and maritime transport can be reduced by 39 % compared to 1990.
By far the largest absolute emission reductions in CS 95 compared to the CS 80 scenario occur in industry (additional abatement of 34 Mt CO2e of energy-related and 32 Mt CO2e of process-related emissions) and transport (additional reduction of 29 Mt CO2e in the domestic transport sector and 23 Mt CO2e from international aviation and maritime transport). The abatement of 24 Mt CO2e in LULUCF, making the sector a net sink, is especially significant.
The sectors with reductions significantly above 95 % compensate, through their above average abatements, the emissions of agriculture, international aviation and maritime transport as well as waste management and product use, which make below average reduction contributions to achieving a 95 % emission reduction by 2050 compared to 1990.
The intermediate targets for reducing GHG emissions by 2020, 2030 and 2040 are set as minimum targets in Germany’s Energy Concept (reduction of at least 40 %, 55 % and 70 % respectively). Within this time frame, the reduction path consists of 15 percentage points per decade. The reduction target for 2050, however, has a range: a reduction of 80 % to 95 %. To enable an emission abatement of 70 % starting from 2040 to a reduction of 95 % by 2050 in line with the ambitious target path, a reduction of 25 percentage points within a decade is necessary (see Figure 3-3).
To meet the target of reducing GHG emissions by 95 % by 2050, an emission reduction of 80 % must already have been achieved between 2035 and 2040 in order not to have to achieve disproportionately high emission reductions between 2040 and 2050 compared to the preceding decades. Both climate protection scenarios also show (as was the case in the first round of modelling) that the emission reductions diminsh after 2040. The course of the CS 95 scenario is marked by demanding milestones for GHG reductions of 65 % to 70 % for 2030 and 80 % to 85 % for 2040 in order to achieve a GHG reduction of 95 % in 2050. Correspondingly the CS 95 scenario shows significantly higher emission reductions for 2020 than in CS 80 and certainly than in EMS (2012), which only achieves a reduction of approx. 60 % in 2050 compared to 1990.
Thus, the scenarios show that the set minimum target path for the years 2020 to 2040 is sufficient to achieve a reduction of 80 % by 2050. However, in order for Germany to achieve an emission reduction of 95 % by 2050, the set minimum targets have to substantially overfulfilled.
4. Sectoral contributions to fulfilment of the targets
4.1. Energy industry and industrial power plants In the following, the main drivers and developments in the energy industry are shown for Germany. First of all, section 4.1.1 describes the key effects on the demand side (electricity consumption). The development of electricity production is then shown in section 4.1.2. Finally, section 4.1.3 elucidates the main drivers and effects for the rest of the energy industry.
4.1.1. Electricity consumption
Electricity consumption in Germany shows two contrary trends in all scenarios: first, the demand of “conventional electricity consumption” decreases based on efficiency measures; subsequently, however, there is “new electricity consumption”, which compensates the initial savings and even exceeds them in CS 95. The new electricity demand is primarily caused by electrification measures in the final consumption sectors (e.g. electric mobility and heat pumps), which are effective for a much longer time frame than the efficiency measures. It makes sense to discuss these developments separately in order to correctly interpret the economic signals of an initially decreasing electricity consumption and to keep the long-term structural change in view.
The development is similar in the scenarios, but differs in terms of degree. In EMS (2012), gross electricity consumption decreases by 4 % from 2008 to 2020, but is 6 % above the initial value in 2050. In both climate protection scenarios, the minimum target is achieved in 2030 (-13 % in CS 80, -18 % in CS 95). In CS 80, the decrease brought about by new electricity consumption arising after 2030 is more or less balanced by 2050. The development of new electricity consumption in CS 95 is more dramatic: gross electricity consumption in 2050 is 27 % above the 2008 level.
The significance of the new electricity consumption depends on the electrification measures in other sectors. In CS 95 new consumption in 2050 constitutes 44 % of the total electricity consumption, about three-quarters of which comes from the transport sector (directly as electric mobility and indirectly via synthetic fuels) and about one-fifth from the heat supply for industry, the tertiary sector and households (directly as heat pumps and indirectly as electric boilers in district heating networks). By contrast, in CS 80 and in EMS (2012) new electricity consumption has a share of only 25 % and 15 % respectively.
Figure 4-1 shows the change in electricity consumption of conventional and new electricity consumption in CS 80 and in CS 95 compared to 2008. For comparison, the development of gross electricity consumption in EMS (2012) is provided.
In CS 80 gross electricity consumption in the area of conventional electricity consumption is reduced by 105 TWh due to efficiency improvements between 2010 and 2050. Furthermore, other electricity consumption3 decreases by approx. 45 TWh. On the other hand, there is a very significant increase in electric mobility (by 80 TWh) and the use of heat pumps, electric boilers in district heating networks and power-to-heat (by approx. 65 TWh). Therefore, the reduction brought about in the area of conventional electricity consumption is fully compensated.
In CS 95 the savings brought about in conventional electricity consumption amount to 150 TWh. Other electricity consumption is reduced by only approx. 5 TWh. On the other hand, there is a stronger increase in electric mobility (approx. 105 TWh) and heat pumps/power-to-heat (approx. 75 TWh). There is also an additional demand for power-generated fuels (125 TWh), which forms the largest single source of electricity consumption. Due to the very high share of renewable energies, there must be more electricity storage; this is also the case in CS 95 with synthetic gases (hydrogen and methane), which are then re-converted to electricity. In addition, due to the higher electricity demand overall, the network losses are also higher, which is why the electricity consumption directly attributable to the energy industry returns to approximately the same levels of 2010 in total. In spite of a greater net reduction by 2030 (amounting to 115 TWh), the electricity demand in 2050 is 165 TWh higher than in 2010.
4.1.2. Electricity production
As stated in the context of emission reduction targets, the electricity demand has to be fulfilled extensively (CS 80) or almost completely (CS 95) on a carbon neutral basis by 2050. Figure 4-2 shows the shares of various energy sources over time for the CS 80 and CS 95 scenarios. In correspondence with the changing electricity demand, total electricity production also changes. Both climate protection scenarios contain an early and consistently strong expansion of renewable energies. By 2030, the electricity mix has changed dramatically as a result, with wind power the most important energy source for electricity production in both scenarios, followed by photovoltaics.
There is an interaction between the reduction of electricity consumption and the expansion of renewable energies, which is important in terms of the expansion targets for renewable energies in Germany's Energy Concept4: the share of renewables in the electricity mix grows disproportionately in the scenarios (also in the reference scenario) since electricity consumption initially decreases up to 2030 due to efficiency measures and electricity production from renewable energies increases linearly. This results in substantial overfulfilment of the target to increase the renewable energy share of gross electricity consumption to 50 % by 2030. Since a large share of this overfulfilment is, however, brought about by the decrease in electricity consumption resulting from efficiency measures, it is balanced by the demand for carbon neutral electricity increasing again in the long term (see section 4.1.1) in CS 80.
In 2050 the renewables share returns to the order of the magnitude of the set targets as the linear expansion rates in the climate protection scenarios are based exclusively on the modelled electricity demand and the 2050 emissions targets. With a view to the foreseeable increase in
3 For example, consumption in the conversion sector (e.g. coking plants), own consumption of power plants, network losses and
storage power consumption. 4 Germany's Energy Concept (2010) defines the targets as a share of electricity production from renewable energy sources in gross
electricity consumption: 35 % by 2020, 50 % by 2030, 65 % by 2040 and 80 % by 2050. In addition, § 1 of the German Renewable Energy Sources Act (EEG 2014) defines a target corridor of 40-45 % by 2025 and 55-60 % by 2035.
electricity demand, it is not assumed that the expansion of renewable energies stagnates but rather that it remains consistently high, even though the intermediate targets are overfulfilled in 2030. For the 95 % emission reduction in CS 95, larger renewable shares are necessary in 2050 than those in Germany’s Energy Concept.
In both climate protection scenarios, the building of new coal-fired power plants is not necessary beyond the capacities already under construction or planned; additional opencast mines or expansions of existing open-cast mines is also not necessary. Furthermore, there is no need for carbon capture and storage (CCS) to be used in the power sector.
In the Climate Protection Scenario 80, the effects and main drivers of electricity production are the following:
· There is a strong expansion of renewable energies: wind power (from 38 TWh in 2010 to 344 TWh in 2050) constitutes the main electricity source in 2030, while photovoltaics (from 12 to 115 TWh) also make up a large share (13 %). The importance of biomass decreases significantly and the share of other electricity production (above all hydro, geothermal and waste incineration) remains more or less constant. The yearly increase in gross electricity production from renewable energies amounts to between 7 and 15 TWh/a in total.
· By dint of the consistently high expansion rates, the renewables share in 2030 and 2040 temporarily exceeds the target path by up to ten percentage points; in 2050 it is, by contrast, only three percentage points higher than the target path (83 %), as a result of new electricity consumption.
· The share of fossil fuels is reduced from 352 TWh (2010) to 26 TWh (2050) while the CO2 intensity concurrently decreases (i.e. less coal, more natural gas). This is due to an effective EU Emissions Trading System (ETS) with full auctioning and allowance prices of 130 €/EUA in 20505 as well as to the expansion of renewable energies. Based on additional coal policy (decommissioning of individual lignite-fired units by 2020), electricity production from lignite is halved between 2010 and 2030.
· While Germany was still an exporter of electricity in 2010 with a balance of 18 TWh, it is a net importer of 61 TWh of electricity in 2050. It is assumed that a submarine cable to connect Norwegian pumped storage hydropower plants is installed in every decade.
· The GHG emissions from electricity production decrease by 88 % compared to 2010 (cor-responding to a 91 % reduction compared to 1990).
In the Climate Protection Scenario 95, the following measures have a greater effect:
· The expansion of renewable energies is even stronger than in CS 80. In CS 95, wind power is also the most important electricity source by 2030 (increasing from 38 TWh in 2010 to 572 TWh in 2050). Photovoltaics grows from 12 to 123 TWh by 2050. The significance of biomass decreases significantly.
5 These are the model parameters set in the project, which can differ from the actual prices that arise. Also the CO2 price is only one
driver within a set of policy measures that is necessary to achieve the targets.
· The target in Germany’s Energy Concept to increase the renewable shares to 65 % by 2040 is achieved a full decade earlier. The 2050 target of an 80 % share is significantly overfulfilled, with the share of renewable electricity production in gross electricity consumption reaching 95 % by 2050.
· Fossil-fuelled electricity production decreases to slightly more than 12 TWh by 2050. Coal-fired electricity production is marginal from 2030 onwards and falls to zero in 2050 due to far-reaching electricity savings, a strong expansion of renewable energies and an ambitious coal policy within the context of a strengthened EU Emissions Trading System. The emission allowance prices increase more strongly than in CS 80, reaching 200 € / EUA by 2050.
· In 2050 Germany imports significantly less electricity in CS 95 (7 TWh) than in CS 80 since the stronger expansion of renewable energies within the country and the concomitant high electricity production at low marginal costs displaces possible imports from the European electricity market.
· In CS 95, previously power-generated hydrogen and methane is reconverted to electricity from 2040 onwards. Power-generated gases constitute approx. half of the fuel used in the remaining natural gas power plants in 2050.
· Since fossil-fuelled electricity production almost completely ceases, the GHG emissions of electricity production decrease by more than 96 % compared to 2010 (corresponding to 97 % compared to 1990).
Figure 4-2: Electricity production and electricity imports in CS 80 and CS 95, 2010-2050
Note: The left axis refers to the electricity production and the import-export balance, which are shown by the coloured areas; the right
axis refers to the GHG emissions, which are shown by the lines. Other = oil, blast furnace gas, coke oven gas, waste, hydropower, geothermal energy, pumped storage and reconversion of power-to-gas.
4.1.3. Other energy industry and fugitive emissions
The rest of the energy industry is comprised of non-CHP production of district heating, petroleum and biofuel refineries and other segments of the conversion sector (open-cast lignite mines, hard coal collieries, briquette factories, coking plants, other conversion and coating facilities). Following the structure of the greenhouse gas inventory, natural gas compressor stations are attributed to the transport sector rather than the conversion sector.
It should be noted that the energy demand of other energy industry is higher in the climate protection scenarios than in the reference scenario. This is caused by a rising demand for network-connected heat and biofuels. At the same time, the option of combined heat and power (CHP) largely disappears after 2030 given the decrease of fossil-fuelled electricity production; this energy demand then also shifts towards the other energy industry. In EMS (2012) the energy demand of other energy industry decreases by 11 % between 2020 and 2050; in CS 80, however, it only decreases by 2 %. In CS 95, the energy demand in 2050 is again at the 2020 level. To achieve the desired emission reductions, the expansion of solar thermal energy from 2030 onwards is assumed in both climate protection scenarios; in 2050 the installed thermal capacity reaches 35 GW (CS 80) and 61 GW (CS 95), respectively. Power-to-heat also makes a contribution in the form of electrode boilers in district heating networks.
With regard to the GHG emissions, there is a far greater difference between the EMS (-14 % by 2050 compared to 1990) and the climate protection scenarios (-84 % in CS 80 but only -72 % in CS 95). The differences come from the energy mix. The use of fossil fuels decreases sharply in all scenarios, but natural gas is still used to meet half of the demand in EMS (2012); in the climate protection scenarios, natural gas only makes up a fifth (CS 95) to a quarter (CS 80) of the energy mix. Refinery gas has a significant share (14 %) in EMS (2012); in the climate protection scenarios, its share is of little significance. In the latter scenarios, the new technologies of solar thermal energy and power-to-heat have, together, an approx. 50 % share of the energy demand, while biomass (including biogas) makes up a quarter (CS 95) to 40 % (CS 80) of energy use.6
The energy consumption of heat generation in petroleum refineries – which is determined by the demand for petroleum products – decreases substantially in the climate protection scenarios, by 79 % (CS 80) and 91 % (CS 95) respectively compared to 46 % in EMS (2012). Since the other heat generators are dominated by biofuel production, their energy consumption is lower in EMS (2012) than in the climate protection scenarios in which more biofuel is used.
The fugitive emissions of the energy sector are largely caused by the production and processing of fossil fuels; their development is therefore dominated by the development of coal, gas and oil production in Germany. Since the assumptions for the phase-out of hard coal, oil and natural gas mining are identical in the scenarios, there are only small differences in the emissions of lignite mining, the activity of refineries and the transportation of natural gas corresponding to the different fuel demand. Overall, the fugitive emissions of Germany’s energy sector decrease by 88 % by 2050 in CS 80 and by 83 % by 2050 in EMS (2012) compared to 2005. In CS 95 a 97 % reduction of these emissions is achieved.
6 Significantly less biogas is used in CS 95 than in CS 80 due to limited biomass potentials.
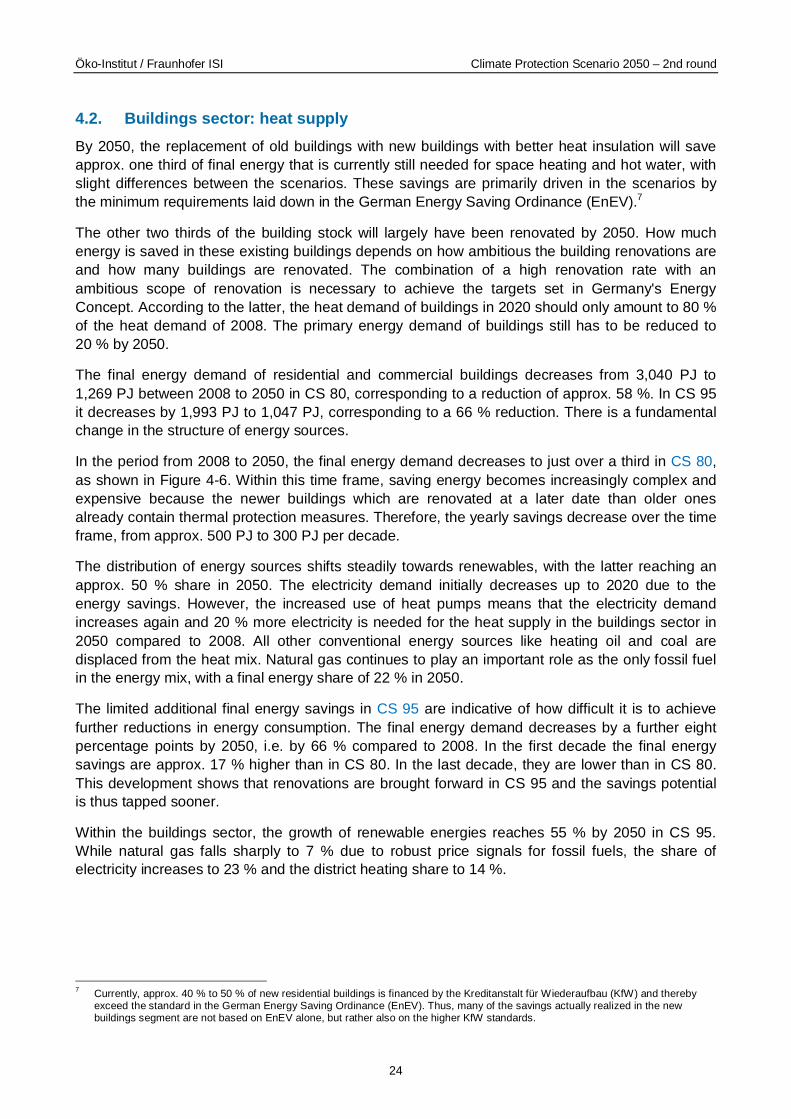
4.2. Buildings sector: heat supply By 2050, the replacement of old buildings with new buildings with better heat insulation will save approx. one third of final energy that is currently still needed for space heating and hot water, with slight differences between the scenarios. These savings are primarily driven in the scenarios by the minimum requirements laid down in the German Energy Saving Ordinance (EnEV).7
The other two thirds of the building stock will largely have been renovated by 2050. How much energy is saved in these existing buildings depends on how ambitious the building renovations are and how many buildings are renovated. The combination of a high renovation rate with an ambitious scope of renovation is necessary to achieve the targets set in Germany's Energy Concept. According to the latter, the heat demand of buildings in 2020 should only amount to 80 % of the heat demand of 2008. The primary energy demand of buildings still has to be reduced to 20 % by 2050.
The final energy demand of residential and commercial buildings decreases from 3,040 PJ to 1,269 PJ between 2008 to 2050 in CS 80, corresponding to a reduction of approx. 58 %. In CS 95 it decreases by 1,993 PJ to 1,047 PJ, corresponding to a 66 % reduction. There is a fundamental change in the structure of energy sources.
In the period from 2008 to 2050, the final energy demand decreases to just over a third in CS 80, as shown in Figure 4-6. Within this time frame, saving energy becomes increasingly complex and expensive because the newer buildings which are renovated at a later date than older ones already contain thermal protection measures. Therefore, the yearly savings decrease over the time frame, from approx. 500 PJ to 300 PJ per decade.
The distribution of energy sources shifts steadily towards renewables, with the latter reaching an approx. 50 % share in 2050. The electricity demand initially decreases up to 2020 due to the energy savings. However, the increased use of heat pumps means that the electricity demand increases again and 20 % more electricity is needed for the heat supply in the buildings sector in 2050 compared to 2008. All other conventional energy sources like heating oil and coal are displaced from the heat mix. Natural gas continues to play an important role as the only fossil fuel in the energy mix, with a final energy share of 22 % in 2050.
The limited additional final energy savings in CS 95 are indicative of how difficult it is to achieve further reductions in energy consumption. The final energy demand decreases by a further eight percentage points by 2050, i.e. by 66 % compared to 2008. In the first decade the final energy savings are approx. 17 % higher than in CS 80. In the last decade, they are lower than in CS 80. This development shows that renovations are brought forward in CS 95 and the savings potential is thus tapped sooner.
Within the buildings sector, the growth of renewable energies reaches 55 % by 2050 in CS 95. While natural gas falls sharply to 7 % due to robust price signals for fossil fuels, the share of electricity increases to 23 % and the district heating share to 14 %.
7 Currently, approx. 40 % to 50 % of new residential buildings is financed by the Kreditanstalt für Wiederaufbau (KfW) and thereby
exceed the standard in the German Energy Saving Ordinance (EnEV). Thus, many of the savings actually realized in the new buildings segment are not based on EnEV alone, but rather also on the higher KfW standards.
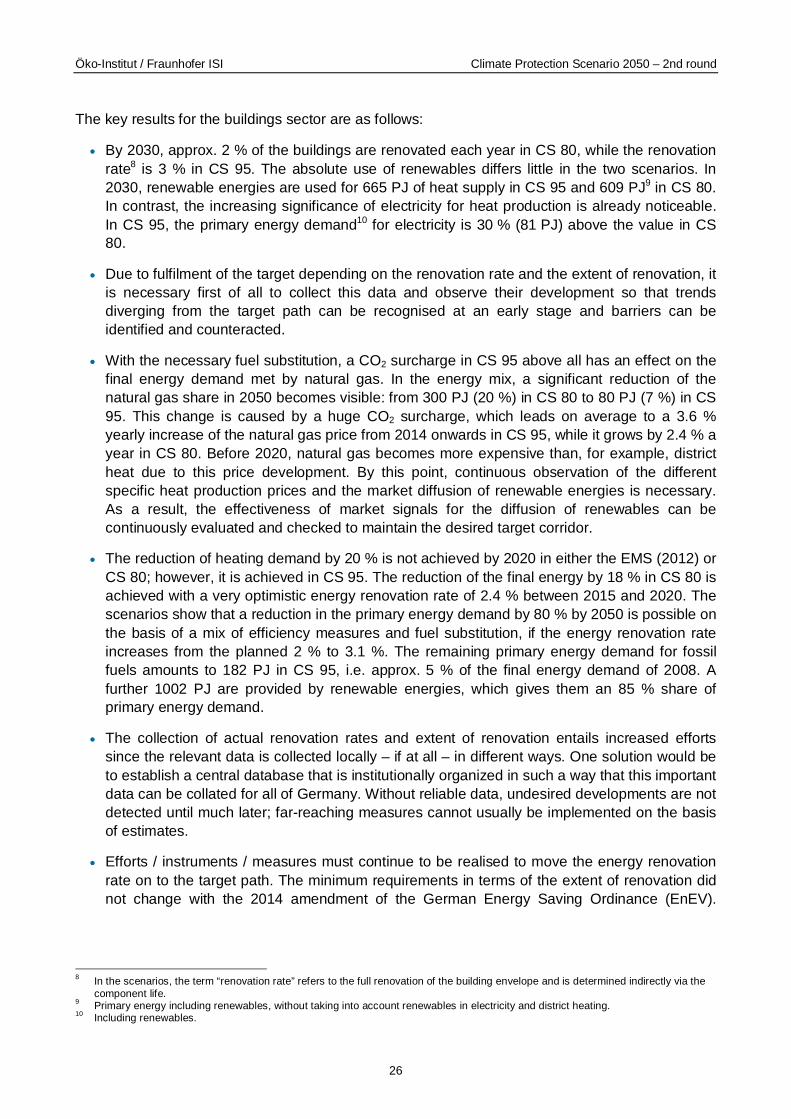
The key results for the buildings sector are as follows:
· By 2030, approx. 2 % of the buildings are renovated each year in CS 80, while the renovation rate8 is 3 % in CS 95. The absolute use of renewables differs little in the two scenarios. In 2030, renewable energies are used for 665 PJ of heat supply in CS 95 and 609 PJ9 in CS 80. In contrast, the increasing significance of electricity for heat production is already noticeable. In CS 95, the primary energy demand10 for electricity is 30 % (81 PJ) above the value in CS 80.
· Due to fulfilment of the target depending on the renovation rate and the extent of renovation, it is necessary first of all to collect this data and observe their development so that trends diverging from the target path can be recognised at an early stage and barriers can be identified and counteracted.
· With the necessary fuel substitution, a CO2 surcharge in CS 95 above all has an effect on the final energy demand met by natural gas. In the energy mix, a significant reduction of the natural gas share in 2050 becomes visible: from 300 PJ (20 %) in CS 80 to 80 PJ (7 %) in CS 95. This change is caused by a huge CO2 surcharge, which leads on average to a 3.6 % yearly increase of the natural gas price from 2014 onwards in CS 95, while it grows by 2.4 % a year in CS 80. Before 2020, natural gas becomes more expensive than, for example, district heat due to this price development. By this point, continuous observation of the different specific heat production prices and the market diffusion of renewable energies is necessary. As a result, the effectiveness of market signals for the diffusion of renewables can be continuously evaluated and checked to maintain the desired target corridor.
· The reduction of heating demand by 20 % is not achieved by 2020 in either the EMS (2012) or CS 80; however, it is achieved in CS 95. The reduction of the final energy by 18 % in CS 80 is achieved with a very optimistic energy renovation rate of 2.4 % between 2015 and 2020. The scenarios show that a reduction in the primary energy demand by 80 % by 2050 is possible on the basis of a mix of efficiency measures and fuel substitution, if the energy renovation rate increases from the planned 2 % to 3.1 %. The remaining primary energy demand for fossil fuels amounts to 182 PJ in CS 95, i.e. approx. 5 % of the final energy demand of 2008. A further 1002 PJ are provided by renewable energies, which gives them an 85 % share of primary energy demand.
· The collection of actual renovation rates and extent of renovation entails increased efforts since the relevant data is collected locally – if at all – in different ways. One solution would be to establish a central database that is institutionally organized in such a way that this important data can be collated for all of Germany. Without reliable data, undesired developments are not detected until much later; far-reaching measures cannot usually be implemented on the basis of estimates.
· Efforts / instruments / measures must continue to be realised to move the energy renovation rate on to the target path. The minimum requirements in terms of the extent of renovation did not change with the 2014 amendment of the German Energy Saving Ordinance (EnEV).
8 In the scenarios, the term “renovation rate” refers to the full renovation of the building envelope and is determined indirectly via the
component life. 9 Primary energy including renewables, without taking into account renewables in electricity and district heating. 10 Including renewables.
However, in order to achieve the targets, a more ambitious extent of renovation on average is needed.
· Price signals are needed to bring about the necessary scope of transition to renewable energies. Otherwise natural gas remains dominant in the long term. In order to cushion social impacts and to avoid potential social hardships arising on this basis, the use of targeted instruments is recommended.
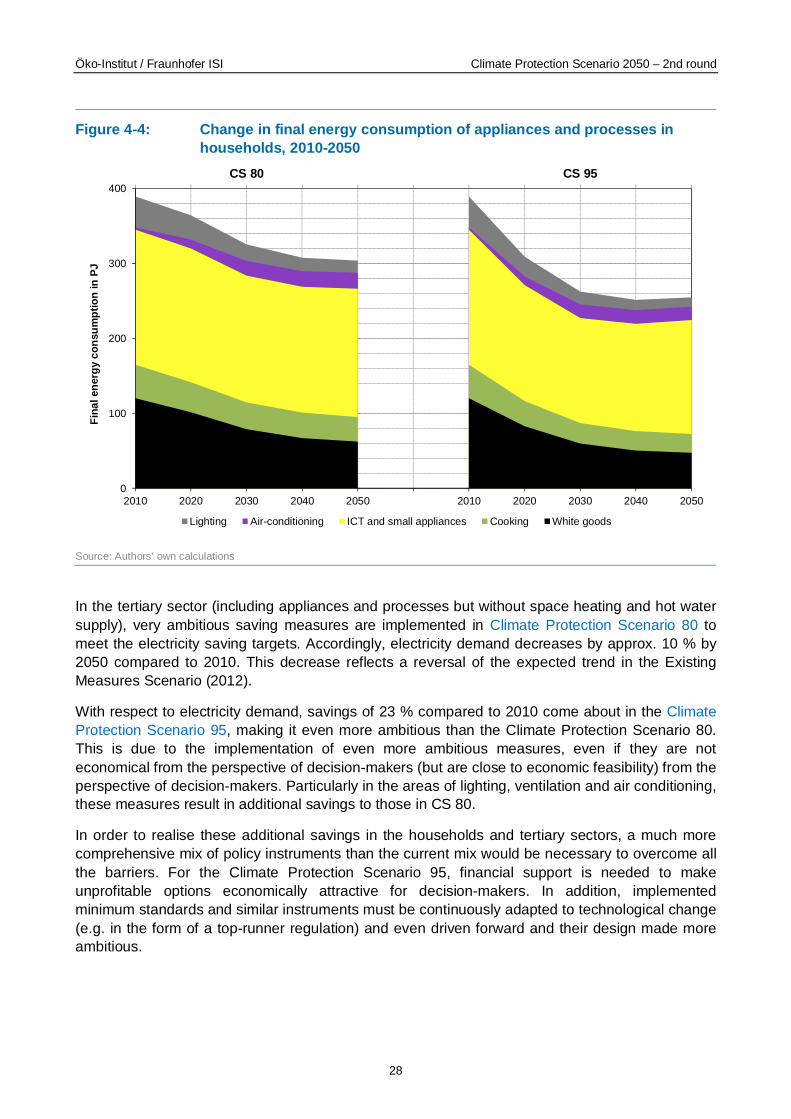
4.3. Households and the tertiary sector – appliances and processes In the households sector (appliances – without space heating and hot water supply), there is a decrease in the final energy demand of approx. 86 PJ (- 2 %) by 2050 compared to 2010 in the Climate Protection Scenario 80. The final energy demand is based almost exclusively on electricity-based applications apart from stoves, which are operated with gas. The strongest decrease in electricity demand in this time frame can be traced back to white goods (large electric household appliances) at approx. 58 PJ and lighting at 25 PJ. Active measures in CS 80 are the Ecodesign Directive (the measures of which are chosen by decision-makers based on the lowest life cycle costs), the German Ordinance on Energy Consumption Labelling and the promotion of high efficiency appliances (best on the market) in conjunction with the return of old appliances.
In the Climate Protection Scenario 95, there are additional savings of approx. 49 PJ in the households sector by 2050 compared with the Climate Protection Scenario 80. The same energy policy measures are applied in both scenarios. However, it is assumed in CS 95 that newer efficiency classifications are introduced for the individual applications. In addition, it is assumed that decision-makers always decide in favour of the most efficient application available on the market, both in terms of new investments and replacement investments. In this scenario, efficiency potentials are tapped at an early stage, with the electricity demand already decreasing dramatically by 2030.
Figure 4-4: Change in final energy consumption of appliances and processes in households, 2010-2050
Source: Authors’ own calculations
In the tertiary sector (including appliances and processes but without space heating and hot water supply), very ambitious saving measures are implemented in Climate Protection Scenario 80 to meet the electricity saving targets. Accordingly, electricity demand decreases by approx. 10 % by 2050 compared to 2010. This decrease reflects a reversal of the expected trend in the Existing Measures Scenario (2012).
With respect to electricity demand, savings of 23 % compared to 2010 come about in the Climate Protection Scenario 95, making it even more ambitious than the Climate Protection Scenario 80. This is due to the implementation of even more ambitious measures, even if they are not economical from the perspective of decision-makers (but are close to economic feasibility) from the perspective of decision-makers. Particularly in the areas of lighting, ventilation and air conditioning, these measures result in additional savings to those in CS 80.
In order to realise these additional savings in the households and tertiary sectors, a much more comprehensive mix of policy instruments than the current mix would be necessary to overcome all the barriers. For the Climate Protection Scenario 95, financial support is needed to make unprofitable options economically attractive for decision-makers. In addition, implemented minimum standards and similar instruments must be continuously adapted to technological change (e.g. in the form of a top-runner regulation) and even driven forward and their design made more ambitious.
CS 80 CS 95
0
100
200
300
400
2010 2020 2030 2040 2050 2010 2020 2030 2040 2050
Fina
l ene
rgy
cons
umpt
ion
in P
J
Lighting Air-conditioning ICT and small appliances Cooking White goods
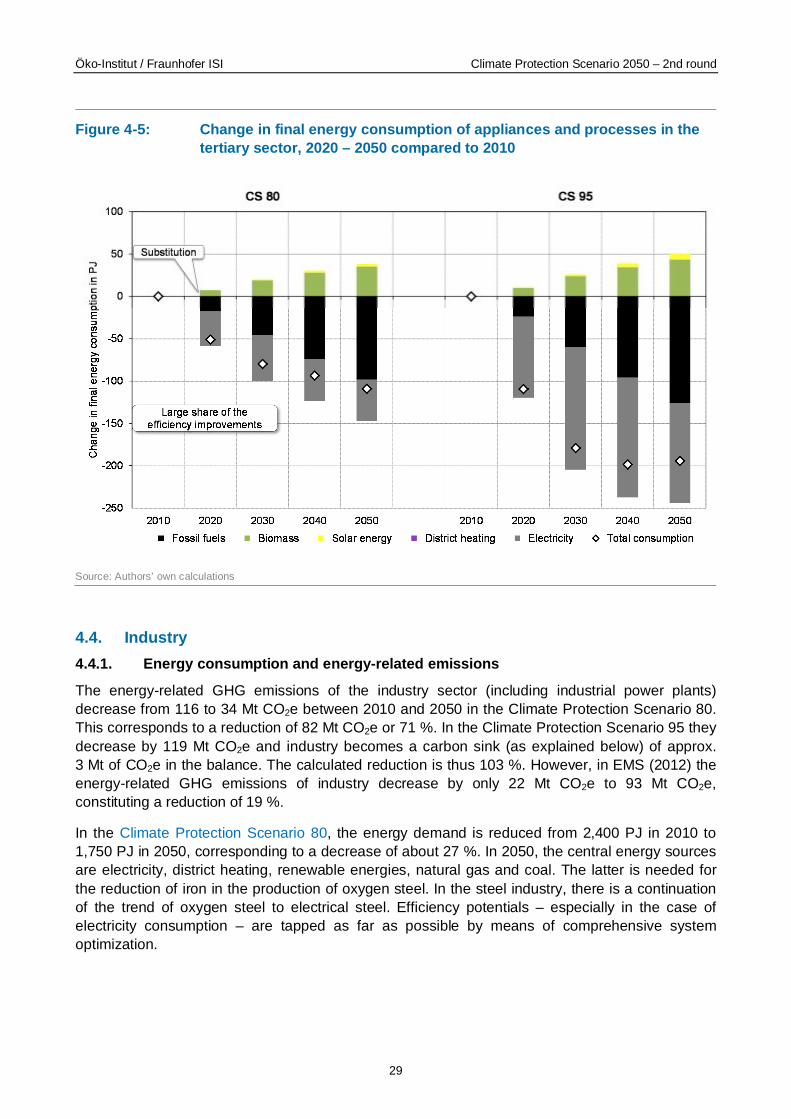
Figure 4-5: Change in final energy consumption of appliances and processes in the tertiary sector, 2020 – 2050 compared to 2010
Source: Authors’ own calculations
4.4. Industry 4.4.1. Energy consumption and energy-related emissions
The energy-related GHG emissions of the industry sector (including industrial power plants) decrease from 116 to 34 Mt CO2e between 2010 and 2050 in the Climate Protection Scenario 80. This corresponds to a reduction of 82 Mt CO2e or 71 %. In the Climate Protection Scenario 95 they decrease by 119 Mt CO2e and industry becomes a carbon sink (as explained below) of approx. 3 Mt of CO2e in the balance. The calculated reduction is thus 103 %. However, in EMS (2012) the energy-related GHG emissions of industry decrease by only 22 Mt CO2e to 93 Mt CO2e, constituting a reduction of 19 %.
In the Climate Protection Scenario 80, the energy demand is reduced from 2,400 PJ in 2010 to 1,750 PJ in 2050, corresponding to a decrease of about 27 %. In 2050, the central energy sources are electricity, district heating, renewable energies, natural gas and coal. The latter is needed for the reduction of iron in the production of oxygen steel. In the steel industry, there is a continuation of the trend of oxygen steel to electrical steel. Efficiency potentials – especially in the case of electricity consumption – are tapped as far as possible by means of comprehensive system optimization.
Figure 4-6: Change in final energy consumption and reduction of GHG emissions in the industry sector, 2020 – 2050 compared to 2010
Note: The left axis refers to the electricity production and the electricity exchange balance, which are shown by the coloured areas; the right axis refers to the GHG emissions, which are shown by the lines. Other = oil, blast furnace gas, coke oven gas, waste, hydropower, geothermal energy, pumped storage and reconversion of power-to-gas.
Source: Authors’ own calculations
The Climate Protection Scenario 95 shows even faster efficiency improvements, leading to a decrease in Germany’s final energy demand of 40 % by 2050. Additional potentials to those in the Climate Protection Scenario 80 are tapped, particularly in the areas of fuel demand for low temperature heat and the use of waste heat in combination with heat pumps. Faster progress in increasing material efficiency and the diffusion of high efficiency production processes also contribute to this. The transition from non-renewable to renewable energy sources occurs much faster due to the higher CO2 price. Even natural gas is almost completely replaced with renewable energies. From 2030 CCS is used for large point sources such as the process- and energy-related emissions of the steel and cement industry. Since the CCS technology is combined with the substitution of coal with biomass, the industry sector becomes a carbon sink in the area of energy-related emissions.
Compared to CS 80 technically more innovative solutions are comprehensively implemented in CS 95, e.g. in the areas of waste heat use and high efficiency production processes. Additionally, improvements in material efficiency are achieved. Accordingly, the fuel demand decreases significantly faster than in CS 80. With regards to electricity consumption, the potentials (system optimization, electric drive systems) are already largely tapped in CS 80 so that CS 95 shows a comparable development.
Particularly in the case of power plants with a long service life and long investment cycles (energy-intensive processes), highly efficient innovative solutions (e.g. low-emission cement production, near-net-shape casting of steel, oxygen depolarized cathode in chlorine production, innovative paper drying processes, magnetic billet heaters in aluminum processing) must be market-ready before 2030. Therefore, investments in R&D as well as pilot and demonstration power plants have to be initiated before 2020. CCS technology must also be market-ready by 2030 in order to realize the high emission reduction volumes between 2030 and 2050. In terms of the use of waste heat, market introduction programs also seem useful both within and across operations if the potentials are to be tapped.
Similarly, the fuel switching is dependent on the investment cycle for steam generators and furnaces. In a typical lifetime of 15 to 30 years, necessary financial incentives (CO2 price) must be implemented by 2030 at the latest. A price increase after 2040 comes too late and would only affect a portion of the investment portfolio. Alternatively, a reliable and predictably increasing price path could provide investment security and thereby enable necessary investments at an early stage.
Large challenges include those relating to the technical feasibility and the market introduction of highly efficient and innovative production processes and to the tapping of saving potentials in system optimization. In terms of financial incentives for the fuel switching, the enforceability of a CO2 tax (or of a subsidy) could be challenging.
Necessary instruments for achieving the transformation of the industry sector described include a price signal for the non-ETS sector (e.g. CO2 tax) and high emission allowance prices in the EU ETS prior to 2030, funding of R&D, market introduction for low-carbon industry processes (before 2020), financial promotion of efficiency technologies with long amortization periods (> 5 years), mandatory comprehensive energy management and energy consulting.
4.4.2. Industry processes
Alongside the energy-related CO2 emissions, process-related CO2 emissions also arise in energy-intensive industry from the necessary processing of raw materials in the production process. Abatement of these emissions is much more difficult than in the case of energy-related emissions. In EMS (2012) and in CS 80, industry processes therefore make disproportionately low contributions to emission reductions. In CS 95 process-related emissions can be almost completely abated using CCS (a capture rate of 95 % is assumed).
With regard to process-related CO2 emissions, three categories (in a simplified form) need to be distinguished:
· In pig iron production, process-related CO2 emissions arise from the use of coal to reduce the iron oxide content.
· In hydrogen production (as a precursor for ammonia), natural gas is used as a raw material. The emissions are considered process-related because the natural gas is not burned but rather a direct chemical reaction to hydrogen takes place.
· In cement and lime production, CO2 is released from limestone in the production process. These CO2 emissions are therefore not attributable to the use of fuels.
· For conventional cement production, CCS will probably remain the only abatement option if susbstitutes are not used (e.g. building with wood instead of concrete).11 With regard to pig iron and hydrogen, alternative abatement options are also conceivable; the characteristics of the different processes need to be considered:
· In pig iron production, electricity, hydrogen or synthetically produced methane can theoretically be used as reducing agents. New processes have to be developed for this purpose.
· In hydrogen production, electrolysis can be used. The process is technically available in principle, but is not yet being used on a large scale.
In other studies (e.g. the German Federal Environment Agency’s study “Germany in 2050 – A Greenhouse Gas-Neutral Country”) the emissions are avoided by means of such technologies. However, this study does not take into account the mitigation options because the estimated costs for industry are assessed as too high: Large volumes of renewable electricity would be necessary at low cost and the question of electricity storage needs to be clarified since renewable energies provide only approx. 2,000 to 4,000 full load hours of the electricity needed. The assessment may change if the costs of renewable energies fall more sharply or if the underground storage of carbon is considerably more expensive than currently forecast or if storage does not function technically. Further analysis is needed on the reduction of process-related emissions in industry, including anaylsis that takes into account international competitiveness.12 The question of how high the social acceptance of CCS is in the case of cement and steel should also be addressed.
The total emissions attributable to industry (energy-related emissions including industrial power plants, industrial processes and product use) decrease by 114 Mt CO2e. between 2010 and 2050 in CS 80, corresponding to a relative reduction of 74 % compared to 1990. In CS 95 the GHG emission reduction is significantly higher at 183 Mt CO2e. between 2010 and 2050, corresponding to a decrease of 99 % compared to 1990. In comparison, in EMS (2012) the GHG emission reduction is significantly lower at 54 Mt CO2e between 2010 and 2050 (-52 % compared 1990).
11 The use of fly ash from the flue gas cleaning of coal-fired power plants or the use of blast furnace slag are being discussed as
alternative production methods. These substitutes are, on the one hand, available only in limited quantities (blast furnace slag) and, on the other hand, the production of coal-fired power plants decreases significantly in a decarbonized economy. Cement substitutes like Celitement are currently still in the trial phrase.
12 In this study it was not possible to take into account the extent to which synergies may arise between the two types of technology (CCS and electrification). It would be conceivable, for example, that hydrogen is produced using electrolysis in 2000 to 4000 hours per year (if renewable energies are available). In the remaining time, hydrogen could be produced from (fossil) natural gas using CCS. With CCS the conventional operating mode can be maintained in the base load. With the huge use of renewable energies in industrial processes, the processes must be operated much more flexibly and the need for electricity storage would increase significantly if the processes continue to be operated in the base load.
4.5. Transport The GHG emissions of Germany’s transport sector can be reduced by 81 % in CS 80 and by 98.4 % in CS 95 compared to 1990.
In this way Germany’s transport sector achieves signficantly higher emission reductions than international transport: the GHG emissions of transport including international aviation and maritime transport decrease from 184.5 to 66 Mt CO2e from 2010 to 2050 (-63 % compared to 1990) in CS 80. In CS 95 these GHG emissions fall to 15 Mt CO2e (-92 % compared to 1990).
In congruence with other studies and scenarios, the following conclusion can be derived from the results: while with an overall target of 80 % over all sectors it may be sufficient for (national) transport to reduce its emissions by 60-80 %13, with an overall target of 95 % the transport sector must be almost completely decarbonized. To avoid misallocations of energy sources (e.g. biomass), the target laid down in Germany’s Energy Concept to reduce final energy consumption in 2050 to -40 % compared to 2005 should be tightened to -60 % and for 2030 an intermediate target of -30 % should be pursued.
Figure 4-7 shows the change in final energy consumption and GHG emissions compared to 2010 in CS 80. To achieve the emission reductions, measures that strengthen the use of eco-mobility and rail, thereby reducing the dependence on combustion engines, are essential up to 2030. Other key measures are efficiency improvements with regard to conventional drives and an increase in battery electric drives. In order to avoid rebound effects, this efficiency improvement is combined with an increase in fuel taxes in the scenarios.
In CS 80 the final energy demand is reduced based on these measures by 59 % by 2050 compared to 2005. Given the limited availability of sustainable biofuels and power-generated fuels, the significant reduction of final energy demand in the scenarios is necessary in order to achieve the cross-sectoral climate targets.
Figure 4-7 shows the development of final energy consumption and GHG emissions in CS 95 and the underlying assumptions. The engine downsizing rate is significantly lower in this scenario than in EMS (2012) and in CS 80 due to better alternatives to private car ownership and due to shared car use, with the share of private passenger transport on the journeys taken falling to 50 % and the cycling share increasing to 25 % by 2050. A larger increase in fuel prices than in CS 80 is necessary in order to have a suitable effect. The use of trolley trucks leads to a strong increase in the efficiency of road transport. In CS 95, this results in a 68 % reduction in Germany’s final energy demand by 2050 compared to 2005. In addition, power-generated fuels (PtX fuels) are used to a limited degree in 2040 and 2050 in order to bring about the necessary GHG emission reduction. Although it is assumed that only 50 % of these fuels are produced domestically and the remainder imported, they nevertheless result in a significant increase in electricity demand.
13 In CS 80, the transport sector is at the upper end of this range; in the 2011 study and the energy reference forecast, the emission
reduction in Germany’s transport sector amounts to 70 % within a multisectoral reduction of 80 %. The lower end of this range was derived from, for example, EU scenarios.
Figure 4-7: Change in final energy consumption and reduction of GHG emissions in transport in CS 80 and CS 95 (w/o internat. aviation and maritime transport), 2020 – 2050 compared to 2010
Note: The left axis refers to final energy consumption, which is shown by the bars (and the balance by the diamonds). The right axis refers to the GHG emission reduction, which is shown by the lines. The fields with light grey text show the measures specified in CS 80; the additional measures specified in CS 95 are shown as black text.
Overall, the results show that in order to pursue an emission reduction of at least 80 % over all sectors and to keep open the possibility of a 95 % emission reduction or more, the focus in the years and decades ahead should be on measures for strengthening efficient means of transport (public transport, cycling, rail) and for increasing vehicle efficiency. Therefore both supply- and demand-side instruments are needed (e.g. ambitious emission targets for cars in combination with adjustment of fuel taxes). Additionally, the electrification of transport is very important. In air transport, effective emissions trading must be established.
In the long term liquid fuels are likely to remain necessary in the transport sector (e.g. in air transport). The potentials of post-fossil fuels are limited and it must be possible to guarantee their sustainability. Relevant decreases in the costs of producing post-fossil, sustainable fuels also partly depend on technologies that are not yet market-ready. Post-fossil energy supply options are needed to achieve ambitious climate protection targets but should not be used, for the above reasons, as an argument for decreasing the ambition of efficiency improvements in the transport sector. Instead, the target of reducing final energy demand in transport by 2050 should be increased to at least 60 % and an intermediate target of at least 30 % should be introduced for 2030.
Furthermore, it needs to be considered whether additional (sub-)targets for the shift to environmentally-friendly modes of transport (e.g. by 2025) should be established on a national level. When defining targets for the modal split, it is necessary for them to be potentially achievable and supported by appropriate measures.
With regard to cycling, the target has been set in Germany’s National Cycling Plan to increase journeys taken by bike to 15 % by 2020. This target should be buttressed by corresponding measures and the level of ambition significantly increased for 2025 and 2030. In Germany’s sustainability strategy, there are also modal shift targets for freight transport, with targets set in 2015 amounting to 25 % and shipping on inland waterways to 18 % respectively; however, progress towards target fulfilment is clearly falling short. Moreover, there are no targets for passenger transport. To establish national targets, it would be helpful to screen existing targets on Länder and municipal levels. For example, in the state of Baden-Württemberg there are already ambitious targets for both passenger and freight transport.14
14 Baden-Württemberg targets for 2030: to increase the share of rail and shipping on inland waterways in freight transport by ten
percentage points; to increase the cycling share to 20 % and to increase pedestrian transport to 30 %; to increase passenger kilometers travelled on public transport by 100 % compared to 2004. Overall, the state is aiming to reduce the CO2 emissions of its transport sector by 40 %.
While emission reductions of up to 100 % are possible in other sectors on the basis of technical measures, agricultural production involves biological processes in which nitrous oxide and methane emissions arise. However, agricultural soils contain a large CO2 reduction potential balanced within the LULUCF sector.
There are large emission reduction potentials in the improvement of nitrogen efficiency in fertilizer use, livestock reduction and the expansion of organic farming.
In EMS (2012) the GHG emissions of the agriculture sector remain more or less constant at the 2010 level up to 2050. From 1990 to 2012 it was possible for the GHG emissions of the agriculture sector to be reduced by 22 %. In CS 80 the sector’s emissions decrease from 88 to approx. 51 Mt from 1990 to 2050, corresponding to a reduction of 42 % compared to 1990. In CS 95, the GHG emissions fall to 35 Mt CO2e, corresponding to a 59 % reduction compared to 1990.15
In both scenarios the agriculture sector becomes a major emitter: in CS 95 it has a share of 60 % of total emissions (including LULUCF and international transport) and in CS 80 a 20 % share. This is the case in spite of dietary change including a significant reduction in animal product consumption being assumed in both scenarios. Livestock reduction is based on the assumption of a decrease in animal product demand in both scenarios16. In terms of meat consumption the recommendations of the German Nutrition Society were taken as a basis, which recommends 300-600g of meat per person per week. In CS 80, a reduction in meat consumption from 760g to 450g per person per week is assumed. CS 95 assumes 300g of meat per person per week. By increasing nitrogen efficiency, the overall rate and the N-balances per hectare decrease. In CS 80, the balance of surplus nitrogen amounts to approx. 40 kg/ha in 2050. In CS 95 the balance in 2050 is only about 20 kg/ha17 (compared to approx. 100 kg N/ha at the present time). Germany’s national sustainability strategy has stipulated a target of 80 kg N/ha by 2010 while the Agricultural Expert Panel at the German Federal Environment Agency specifies a target of 50 kg N/ha. This shows that all reduction potentials in this area have been exhausted in the second round of modelling.
In CS 80, organic farming has a 20 % share of the total agricultural land in 2050. In CS 95, the share increases to 25 % in 2050 (compared to 6 % in 2012).
15 Note: The calculations were conducted on the basis of interpolations between 2010 and 2050 since the effects of emmision
reductions mostly arise in the same year (e.g. reduction of mineral fertilizer use). Statements regarding 2030 can hitherto only be made on this basis and are therefore not currently included.
16 The reduction in demand is realised as a reduction in production; for climate protection reasons, an export strategy is ruled out. There is an additional decrease in livestock based on the average productivity in (conventional) milk production increasing by 24 % by 2050.
17 The N-balances did not constitute target levels within the scenario calculations. Instead, assumptions were made on the possible reduction of N-rates. The nitrogen rates for cropland are calculated on this basis together with the reduced amount of manure production and the expansion of organic farming that forgoes the use of mineral nitrogen fertilizers.
A nitrogen balance was estimated – using simple production assumptions – only in retrospect for the comparison of the scenarios.
The reduction of agricultural emissions by approx. 50 % necessitates not only changes in consumption but also investment in research and development. Alongside the further development of technical measures, four large research areas have been identified in which more research funding should be invested.
Organic farming
If the 20-25 % organic farming targets for 2050 are to be realised, a substantial share of the funding for agricultural research must be assigned to organic farming. Without further yield increases and performance improvements, organic farming will not be able to play an instrumental role in the future. Further research on innovative and sustainable farming methods and livestock systems is essential. Additional research programs must be initiated for organic farming – above all with regard to breeding – since different breeding objectives are pursued in organic crop and animal production than in conventional breeding and cultivation. Instead of one-sided high performance breeding, the focus should be on dual-purpose breeds (e.g. of chickens) and robust, N-extensive grains as well as resistant and more tolerant fruit and vegetable varieties that can be cultivated without the use of pesticides.
In the scenarios, substantial livestock reduction is assumed up to 2050 based on changes in consumption. The use and maintenance of grassland would thereby come under threat. However, due to the assumed concurrent expansion of organic farming, which is accompanied by a strong set-side of land for livestock, a substantial portion of the grassland will be used in the future for grazing and hay production. Given the lower productivity of this economic activity, there is a need for further research on the possible reduction of GHG emissions per sustainably produced product unit in the future. The question also needs to be addressed of the extent to which an increase in milk yield or the development of dual-purpose breeds should be prioritized.
Organic farming research should be geared above all to on-farm research with model regions and pilot operations.
Nitrogen efficiency
In view of high nitrogen surpluses of approx. 100 kg N/ha in 2010, there is a significant reduction potential in the area of nitrogen efficiency. Based on current knowledge, plant production with surplus nitrogen of only 20 kg N/ha, as assumed in CS 95, is not possible without yield reductions. Further research is needed on yield stabilization and a concurrent reduction of nitrogen losses. For this, there needs to be a scientific consensus as to which varieties of, for example, autumn manure are necessary and when it can be avoided, and how nitrogen-extensive grains are to be cultivated within the scope of organic farming. Implementation must be accompanied by appropriate adjustments in current fertilizer requirement models and an increase in expert consultancy.
Food transition
A halving of emissions in the agricultural sector cannot be achieved without livestock reductions. This can only credibly occur against the background of the population’s changed diet18 – otherwise the missing products would be imported from livestock farming and entail leakage effects. For this purpose, various activities are needed in the field of R&D:
· Evidence-based research on the health impacts of “climate-optimized” food.
18 Significant reduction in the consumption of animal fats and proteins, i.e. meat, dairy products and eggs.
· Development of effective knowledge transfer of changed preparation methods/recipes and background information about important connections between food, the environment and health to personnel in catering establishments and facilities as well as directly to consumers and educational institutions (childcare facilities, schools).
4.6.2. LULUCF
Through land use, land use change and forestry (LULUCF), GHG emissions are released. On the other hand, CO2 absorption also takes place in the LULUCF sector, particularly in woodland areas. If CO2 absorption exceeds the release of greenhouse gases, the LULUCF sector takes on the function of a carbon sink overall. The largest sources of greenhouse gases in Germany’s LULUCF sector are cropland and grassland on organic soils (moor soils).
Overall, Germany’s LULUCF sector caused GHG emissions amounting to 9 Mt CO2e in 2010. Through the developments described below, LULUCF emissions decrease to 1 Mt CO2e by 2050 in CS 80. In CS 95 the LULUCF sector becomes a carbon sink overall because there is a much sharper reduction in the emissions of agricultural soils while the sink function of forestry is maintained: in 2050 net LULUCF emissions amount to approx. -23 Mt CO2e in CS 95. In contrast, the LULUCF emissions increase by 6 to 15 Mt CO2e in EMS (2012).
In the climate protection scenarios 80 and 95 it is assumed that the conversion into residential areas decreases from 119 ha/day at present to 30 ha/day. In both scenarios, it is assumed that the degradation of peatlands ceases completely from 2015 to 2020. The discontinuation of peat extraction has a 5 % reduction potential in the LULUCF sector.
In addition, the following measures for 2015 to 2030 are based on modelling which differs for the two scenarios only in terms of the extent of implementation, which is assumed to be 30 % in CS 80 and 95 % in CS 95.
· Cropland and grassland on organic soils are mainly converted into wetlands and to a lesser extent to woodland and shrubs. Other land with organic soils is no longer converted to cropland or grassland. This protection of moor soils is an efficient measure by means of which up to 80 % of the current GHG emissions in the LULUCF sector can be reduced. The GHG saving potentials are significantly higher than the GHG reduction that can be achieved in the same areas by means of, for example, bioenergy use.
· The conversion of grassland on mineral soils to cropland is stopped (reduction potential of 4 %).
Protection of moor soils
In quantitative terms the largest contribution to emission reduction in the LULUCF sector comes from ceasing to use organic soils for agricultural purposes. A conversion to wetlands and forests is assumed in the scenarios. In some areas this requires a complete restructuring of land use. Alongside the creation of acceptance, compensation payments and the sale of land, the complete restructuring of land use needs to be incorporated in regional planning. The development of model regions can be more strongly promoted for this purpose.
Further research is needed on alternative utilisation concepts to promote the conversion of agri-cultural land to wetlands and forests. Research projects are currently being conducted under the keyword “paludiculture” on the use of biomass produced on moors. More research is needed on the quantities and qualities of biomass with a view to its possible use as energy and as a material, the production of suitable tree species on wet or periodically wet sites and possible harvest technologies.
5. Need for renewable energies In the German government’s energy and climate concept, two targets have been set for increasing the share of renewable energies. On the one hand, the renewable share in gross final energy consumption is to be increased from 18 % in 2020 to 60 % in 2050. This share is to increase by 12 percentage points in the decade from 2020 to 2030 and in the subsequent decades by 15 percentage points per decade. On the other hand, the renewable share in the gross electricity consumption is to increase from 35 % in 2020 to 80 % in 2050. This also corresponds to an increase of 15 percentage points per decade.
Figure 5-1: Developments of renewable shares in energy consumption in the scenarios compared to the target paths of Germany’s energy and climate concept, 2010-2050
Note: GEC = gross electricity consumption; GFEC = gross final energy consumption. Source: Model calculations by Öko-Institut and Fraunhofer ISI
In EMS (2012), none of the targets for the renewable shares of gross final energy consumption (GFEC) is met, as Figure 5-1 shows. With a renewable share of approx. 35 % in the GFEC, only a little more than half of the 2050 target is achieved. In CS 80, by contrast, the growth of the renewable share of GFEC is initially marginally below the target path. With a greater increase between 2030 and 2040, the renewable share of GFEC overtakes the target path, reaching 64 % in 2050 – a slightly higher share than targeted. To achieve a GHG reduction of approx. 95 % in CS 95, the renewable share of GFEC must be significantly above the target path by 2030 and ultimately increase to 96 % by 2050.
Figure 5-2: Developments of renewable electricity production and gross electricity consumption, 2010-2050
Source: Model calculations by Öko-Institut and Fraunhofer ISI
In all three scenarios, the construction of new power plant capacities by 2020 is based on the technology corridor of the German Renewable Energy Sources Act (EEG). Up to 2030 the development is very similar, with the effect that the absolute renewable electricity production is similarly high up to this point in all three scenarios (Figure 5-2). Hence there are differences in the renewable shares of gross electricity consumption up to 2030 in the scenarios, which arise above all from the different developments of total gross electricity consumption. Up to 2030 the renewable share of gross electricity consumption lies above the target path in all three scenarios. Since electricity consumption inititally decreases due to efficiency measures and subsequently increases (as described in section 4.1.1) due to new electricity consumption (above all electric mobility, heat pumps/power-to-heat; in CS 95 also power-to-liquid for the production of synthetic fuels), the increase of the renewable share of electricity consumption levels off by 2030 at the latest in all three scenarios. As a result, the targets for the renewable share in gross electricity consumption for 2040 and 2050 are not met in EMS (2012). In CS 80, the 2030 target is overfulfilled by 10 percentage points while the 2050 target is overfulfilled by only 3 percentage points. To achieve the GHG reduction target in CS 95, a significantly higher renewable share of electricity production is necessary because the very high emission reduction needed leaves very little scope for fossil fuels: in 2050 the renewable share of gross electricity consumption reaches 95 % and the 2030 target is overfulfilled by 15 percentage points. Through the significantly faster achievement of very high shares of fluctuating renewable electricity sources, the challenges associated with the system integration of fluctuating electricity production arise sooner in CS 95 than in the other scenarios.
The targets for the renewable share in gross final energy consumption – at least those for 2030 and 2040 – should be regarded as much more ambitious than the targets for the renewable share
in gross electricity consumption: in EMS (2012) the 2030 target for the renewable share in gross electricity consumption is still achieved, but the target for the renewable share in gross final energy consumption is not. In CS 80 the targets for 2030 and 2040 for the renewable share of gross final energy consumption are more or less achieved, but for this a significant over-fulfillment of the targets for the renewable share of gross electricity consumption is needed. In other words, the significant over-fulfillment of the targets in the medium term for the renewable share of gross electricity consumption results not only from the GHG reduction needed in electricity production but also from the contributions needed to fulfil the targets for the renewable share in gross final energy consumption.
While in EMS (2012) the total primary energy consumption (Figure 5-3) decreases by only 33 % by 2050, the reduction is much greater in the climate protection scenarios (amounting to 51 % in CS 80 and 55 % in CS 95). In EMS (2012) 3,360 PJ of primary energy come from renewable energies while fossil primary energy consumption amounts to 5,572 PJ and there are electricity imports of 165 PJ.
In CS 80, however, renewable primary energy consumption in 2050 is almost twice as high as fossil primary energy consumption, at 4,244 PJ and 2,052 PJ respectively, with electricity imports of 220 PJ. The two most important primary energy sources are wind energy and biomass (used in all sectors) with a share of approx. 19 % each, followed by geothermal energy and environmental heat totalling approx. 15 % together and solar energy (both photovoltaics for electricity production and solar thermal energy for heat supply) totalling 11 %. Hydropower only plays a small role. Of the remaining fossil fuels, natural gas (13 %) and petroleum (10 %) are the most important. Lignite and hard coal together contribute only half as much as natural gas; other fossil fuels including waste only have a share of 2 %.
In CS 95, renewable energy sources are significantly more dominant in 2050: at 5,025 PJ they contribute at least seven times as much to primary energy consumption as the remaining 739 PJ from fossil fuels, while 24 PJ of electricity and 143 PJ of synthetic fuels are imported. Since there is a major change from fossil fuels to direct use of electricity and power-generated energy sources, wind energy alone fulfils more than a third of Germany’s total primary energy consumption. The contributions of biomass, geothermal energy/environmental heat and solar energy are all larger than the total fossil-based primary energy consumption. As in the other scenarios, only the contribution of hydropower plays a rather small role. Of the remaining fossil fuels, natural gas – which has the lowest specific emissions – is by far the most important and has a share as high as that of lignite, hard coal and petroleum combined. Other fossil fuels including the fossil portion of waste only have a very small share in primary energy consumption.
At the beginning of the second round of modelling, a detailed anaylsis was carried out with regard to biomass potentials for energy use, on the basis of which the sectoral limits for biomass were derived.19 In CS 80 and CS 95 the objective was to fulfil the need for biomass with domestic biomass as far as possible. As a result, it was possible to analyse whether the total emission reductions can also be achieved with the limited use of domestically produced biomass. A comparison of the calculated domestic biomass potentials and the biomass use of the different sectors shows that the emission reductions in 2050 can be achieved almost entirely with domestically produced biomass in EMS (2012), CS 80 and CS 95.
Figure 5-4: Comparison of biomass that is domestically available and used in 2050 in the different scenarios
Note: left bars = domestically available biomass potential; right bars = need for biomass;
SRC = wood from short rotation coppices, RB = renewable biomass. Source: Authors’ own calculations
The biomass potential comprises wood residues, industrial wood, other wood waste, other solid biogenic residues, wood from short rotation coppices (SRC), fermentable waste and stationary, fermentable renewable biomass and renewable biomass for mobile use. The renewable biomass is grown only on agricultural land and makes up approx. a third of the available biomass potential.
In 2010, approx. 2.1 million ha of renewable biomass are produced for energy use. In EMS (2012), the available land decreases to 1.9 million ha in 2050. In CS 80, 2.0 million ha of land are available
19 See the Annex Biomasspotenziale zur energetischen Nutzung sowie Allokation auf Sektoren in the long (German-language) version
for renewable biomass production for energy use while in CS 95 this total amounts to 1.5 million ha.
In 2020, 2030 and 2040 the need for biomass partly exceeds the domestically available biomass potential. In order to supply the quantity of biomass needed by the sectors, biomass can either continue to be imported or more agricultural land must be used for biomass production. In the scenarios it is assumed that additional biomass is imported to fulfil the need of the sectors.
6. Economic aspects of rigorous climate protection
6.1. Economic effects The economic analysis of CS 80 shows that the three-fold strategy of efficiency policy, renewable electricity production and product and process innovation is a no-regret strategy that would pay off for Germany in the long term. Based on the combined effects of climate protection measures, Germany’s GDP in 2050 is, in net terms, approx. 4.4 % higher than in EMS (2012), which corresponds to an increase in the yearly growth rate of approx. 0.11 percentage points between 2010 and 2050 compared to EMS (2012).
The 80 % climate target drives structural change, stimulates investment activity and has a positive effect on economic growth in Germany. In CS 80 positive job effects arise overall; these effects are especially clear in the building, real estate and consulting, energy and transport sectors. There are also positive effects in terms of imports and exports, especially in the energy markets: The net imports of fossil fuels decrease significantly, which has a positive effect on the balance of trade.
As a basis for the economic analysis, particularly information about changes in investments, operational expenditure (electricity, energy expenditures) and governmental funding from the sectoral models (industry, buildings, transport etc.) was used.
Key parameters for determining the macroeconomic effects are therefore:
· investments20,
· electricity prices21,
· energy expenditures22,
· changes in imports23 and
· governmental funding24.
These impulses entail changes in investment and consumer behaviour, the trade balance and in energy-related and governmental expenditure. They induce changes in the macroeconomic variables (e.g. in capital stock or total factor productivity) and thereby also alter long-term economic development.
20 Between 13 and 27 billion Euro a year compared to EMS (2012). 21 Electricity prices increase slightly in CS 80 and decrease in CS 90. 22 Price x quantity for electricity, heat, transport; partly moderately increasing, mostly falling sharply – on a sectoral level falling by up
to 35 % compared to EMS (2012). 23 In particular, increased biomass imports and imports of advance payments for investment goods. 24 R&D, direct subsidies, credit subsidies, infrastructure investments.
In the economic analysis conducted in this study, not only the primary changes of the parameters (the direct effects) but also the resulting second-round effects (the indirect effects) are considered.
Reciprocal financing of additional investments in climate protection measures is ensured (see Chapter 6.2), be it by means of savings in energy expenditure, of governmental support measures, of retained profits or via pass-through in product prices.25
In several of the few changes in consumption, change is also assumed in the values, e.g. lower meat consumption.
The investments for energy measures in the building sector for relevant renovations, change of heating systems, and the installation of solar systems amount to approx. 16 billion Euro on average per year in CS 80. The available and cheapest technical standard is the decisive factor in the case of energy renovations. In addition to the investments in EMS (2012) comparatively low amounts – approx. 3 billion Euro in CS 80 – are needed to realize the reorganisation of Germany’s energy system.
The implementation of climate protection measures causes a stronger growth of gross domestic product over time than is the case in EMS (2012). This effect depends, for example, on accelerator and multiplier effects arising from the additionally needed investments.26 Moreover, these investments have a positive effect on the development of productivity. Energy savings triggered by the measures free up income (compared to EMS (2012)), which can be used for additional consumption in other sectors. The changes partly have opposing effects on the governmental budget: higher indirect tax revenues are generated from the higher consumption; and higher direct tax revenues are generated by the higher national income, while the governmental financing of necessary support measures increases. Overall, however, the positive effects on the governmental budget outweigh the negative ones.
Overall, total jobs in Germany increase on the basis of climate protection measures by approx. 504,000 jobs in 2050. This corresponds to an improvement of approx. +1.3 % compared to EMS (2012). The changes in number of jobs differ sectorally: higher effects on jobs are, of course, shown in those sectors in which a lot of investments are made. This is especially the case in the buildings, transport and energy sectors. In the latter, the growth in jobs in absolute terms is one of the highest in 2050; however, the absolute number of jobs in this sector is comparatively low. Significant productivity shifts are likely due to the use of new technologies (renewable energy production).
On a macro level, Germany’s GDP and the number of jobs increase since
· the effects which slow down growth are comparatively low,
· no increase in imports is induced by the climate protection measures, which is advanta-geous to domestic production and jobs27,
· the investment stimulus induces an increase in production capacity and thus output growth and jobs in the subsequent periods and
25 To a smaller extent, new loans are also needed to finance investments; however, the scope of these is not large enough to cause
changes on the financial market (e.g. an increase in the interest rate). 26 Changes in consumption can also have an influence since the sectoral expectations and thus also the investments change
endogenous to the model. 27 Substantially due to the political framework conditions, at least in the medium term.
· the average labour productivity increases due to sectoral shifts.
The results of CS 95 on an economic level are regarded as more ambivalent. Sectorally, substantially higher investments are needed in part – above all in the energy sector but also in the production of synthetic fuels and the buildings sector. Several assumptions (e.g. with respect to the neutrality of the money market or to electricity price setting) can no longer be maintained. To ensure this scenario, there would have to be significantly stronger governmental intervention in the market, e.g. via new types of loans, infrastructure fund, etc. However, this raises the question of the displacement of other investments; the arising income effects are also more difficult to assess. This does not make an overall assessment of the economic effects of this scenario seem useful as things currently stand. It is clear however that the governmental steering effect (e.g. in terms of risk reduction through binding commitments) is even important in this scenario.
6.2. Financing climate protection The overall economic effects described above are intertwined with the question of financing the climate protection measures.
In principle, the necessary investments can be financed in various ways:
· Financing via governmental subsidies: Subsidisation is a financial payment from governmental funds to operations or companies which does not have to be paid back. In some sectors, this type of financing is necessary when pursuing rigorous climate protection targets. For example, it is assumed that compensation payments made when agricultural areas are redesignated as carbon sinks, are borne by the government. Transport infrastructure has been and will be largely borne by the public sector.
· Financing by borrowing or retaining profits: Companies and small businesses can finance measures by borrowing or by retaining profits. In both cases, the value added decreases initially. It becomes economically profitable for the investing company when the resulting costs can be fully compensated in the following years by the triggered energy savings.
· Financing by passing through costs to final consumers or supplied companies: A company can finance measures by “passing through” its investment costs to final consumers by increasing the product prices. In modelling terms, the price pass-through is incorporated through the change in the input flows received by the demand sectors from the sector in which the higher prices arise. The increased price has an effect on the sectoral consumption of final energy consumers.
· Financing via foreign capital transfers: It is conceivable that investment incentives for foreign investors are created by climate policy. However, it is necessary for policy to provide planning security for this, e.g. through long-term funding measures. This financing structure plays only a minor role in the analyses provided within this study.
With most of the financing measures it should be noted that the related financial flows temporarily arise at different times. For example, the apportionment of building renovation measures to rental costs occurs over a long period of time while the measure itself is implemented in a year. GDP effects can thereby arise that do not materialise until later on: the investment in itself initially raises the GDP in the year of the investment activity, then second-round effects of this higher GDP come
about and these cumulative effects can exceed the costs of the investment. Furthermore, investments bring about efficiency improvements and spillover effects, which entail productivity improvements that have a positive effect overall. Direct investments in climate protection show an additional productivity effect; induced investments show only a normal effect on productivity.
Assuming that the investments in energy infrastructure finance themselves through increases of the electricity price, the majority of measures in CS 80 are borne by the companies and the consumers. However, governmental subsidies and investments amounting to approx. 4 billion Euro are periodically necessary during the first decade of implementing the measures. This need for “external” investment decreases to approx. 750 million Euro a year by 2050.
The expectations of consumers and companies are an important factor in the calculation of amortisation times and are crucial to the implementation of measures. But behaviour-changing measures should also not be underestimated, as shown by the differences in the implicit interest rates for the evaluation of energy efficiency measures and real market interest rates. Additionally, investments in climate protection are often investments in long-term capital goods with amortisation periods measured in decades. As a result, investment risks and uncertainties increase. With binding targets and regulations, policy can contribute to counteracting these risks and uncertainties and thereby create a climate in which long-term investments in climate protection are worthwhile.
7. Conclusion The following three conclusions can be very clearly drawn from the scenarios:
1. From a technical and economic perspective, the ambitious targets of Germany’s Energy Concept are achievable. A lack of mitigation potentials is not, therefore, an obstacle for the Energy Concept. The measures implemented up to now are far from sufficient to meet the GHG mitigation target, as the Existing Measures Scenario (2012) clearly shows.
2. The minimum target path set out in Germany’s Energy Concept is just about sufficient for 2020 to 2040 to achieve a reduction of 80 % by 2050. However, to realise a 90 % reduction (see first round of modelling) or more by 2050 the minimum target path is not enough. The scenario analysis shows emission reductions of at least 60 % by 2030 and at least 80 % by 2040 as milestones. It becomes clear that the reduction in the first two decades must occur more quickly than between 2040 and 2050 since there are only a few cheap reduction potentials available during the later time frame.
3. With a 95 % reduction target, substantially more ambitious emission reductions have to be realised by all sectors than would be the case with an 80 % target. The interaction between the sectors is increasing. Since the reduction potential is limited in the non-energy sectors (especially in agriculture), the energy-related CO2 emissions of the energy industry, transport (including international aviation and maritime transport), industry and households/the tertiary sector have to realize above-average emission reductions of approx. 97 % in total.
It also follows that there is still a considerable need for political action in order for the climate protection targets to be fulfilled. No sector can be excluded from this. Political instruments for additional climate protection can take effect on a national level and on EU level – particularly in the
case of emissions trading. A wide range of instruments are available, which must be used as far as possible on an aggregated and a sector-specific level. The present study provides important reference points for milestones and policy instruments:
1. Energy industry:
· In the energy industry, the fulfilment of electricity demand has to be extensively (CS 80) or almost fully (CS 95) decarbonized in order to achieve the emission targets.
· It needs to be taken into account first of all that electricity demand has to decrease significantly (CS 80) or substantially (CS 95) by 2030 on the basis of very ambitious energy efficiency measures in all sectors in order for the climate protection targets to be achieved. However, in CS 80 the electricity demand increases again by 2050 based on new electricity consumption (particularly electric mobility but also, for example, heat pumps) and thereby returns to the 2010 level. In CS 95 electricity consumption even increases substantially by 2050 – in spite of the assumption of a very ambitious efficiency policy. The reason for this is the additional electricity demand (e.g. resulting from power-generated fuels) needed for decarbonization in other sectors.
· In both scenarios electricity is predominantly produced by 2050 using renewable energies. In CS 95 a substantially higher installed capacity is needed by 2050 than in CS 80 due to the higher electricity demand. Already by 2030, the electricity production mix has changed extensively in both scenarios, with wind power the most important source of electricity production followed by photovoltaics.
· In all three scenarios, the building of power plants up to 2020 is based on the technology corridors of the German Renewable Energy Sources Act (EEG) and follows a very similar path up to 2030. As a result, the absolute renewable electricity production is similarly high up to this point in all three scenarios (Figure 5-2). Differences in the renewable shares of gross electricity consumption between the scenarios up to 2030 arise primarily from the different developments of total gross electricity consumption.
· Within the decarbonization strategy, the share of fossil fuels decreases very strongly by 2050, with some natural gas and a little coal still being used in CS 80 and no electricity production from coal-fired power plants by 2050 in CS 95. Due to an ambitious coal policy, electricity production from lignite halves by 2030 in CS 80 while coal-fired electricity production hardly plays a role anymore by 2030.
· New coal-fired power plants are not needed beyond the capacities already under construction or in the planning phase. New opencast mines or expansions of existing ones are also not needed.
· Electricity imports still play an important role in 2050 in CS 80 while they are not significant in 2050 in CS 95. In 2030 no electricity (CS 80) or only low quantitites of electricity (CS 95) are imported.
· It is not sufficient to switch electricity production extensively to renewable energy sources; the rest of the energy industry must also be extensively decarbonized. An important means of achieving this is also to use renewable energies (e.g. solar thermal energy) for district heating supply.
· The following is a vision for the sustainable transport of the future: mobility is still ensured for all – but with less transport and smart multimodal interconnection of different transport modes. In cities, public transport, cycling and walking dominate. Motorized transport is based as far as possible on the direct use of renewable electricity (battery electric vehicles, rail transport and, if necessary, trolley trucks). When electrification is not an option, sustainable power-generated fuels are used after 2030 in CS 95.
· With an overall target of 80 % by 2050 across all sectors, it can be sufficient for the transport sector to reduce its emissions by 60 % to 80 %. With an overall target of 95 %, transport has to be almost completely decarbonized. To minimize the risk of misallocated use of available energy sources which have only a limited sustainability (especially biomass), it may be useful to set a target for final energy consumption at the same time as setting a CO2 target for the transport sector.
· Up to 2030 the focus of political measures is on the promotion of more efficient modes of transport (public transport, rail, cycling) and on efficiency improvements for cars and trucks. To avoid rebound effects, the per-kilometer costs in road transport that decrease based on efficiency improvements are balanced, e.g. by increasing the fuel tax and the distance-related toll.
· According to current knowledge, the use of power-generated fuels is necessary in order to achieve a 95 % emission reduction. However, power-generated fuels are expensive and involve high efficiency losses. Renewable electricity cannot be arbitrarily expanded and should be allocated efficiently. The wide use of electricity-generated fuels thus only makes sense after 2030. For this, sustainability criteria – particularly for CO2 sources used for synthesizing – must be developed at an early stage. Up to 2030 and beyond, the focus must be on the reduction of the final energy demand of transport which goes far beyond the targets of Germany's Energy Concept.
3. Buildings (households and tertiary sector):
· A reduction in primary energy demand of at least 80 % by 2050 compared to 2008 is achieved by increasing the efficiency of heat supply for buildings in the scenarios. For this, energy efficiency measures and fuel substitution measures have to be implemented and sufficiency measures stimulated.
· The presented scenarios are based on a number of institutional and organisational requirements. These requirements contribute to the renovation rate and the energy quality of the building renovations corresponding to the expectations in the scenarios. By 2030 the following requirements need to have been met:
‒ complete collection of data on full and partial renovations that have been implemented, including the energy quality after renovation;
‒ a quantifiable, standardized and thus comparable parameter for the energy quality of buildings needs to have been established;
‒ creation of incentives for energy-saving user behavior in the heating of buildings and for the change to renewable energies, e.g. through tax measures (assumed in CS 95);
‒ creation of cost- and time-saving systems and procedures in the renovation process;
‒ in the renovation market, the tensions between the different crafts and trades as well as between architects, building engineers and urban planners need to have been resolved by means of joint development, test projects and regular training with an incentive system; and
‒ the possibility of checking and possibly legally requiring a high quality of renovation needs to be assessed.
· For the buildings sector the main difference between CS 80 and CS 95 is the increase of the renovation rate by a factor of 1.4 and the 20 % increase in the extent of renovation. By 2050, 2.2 % of buildings per year are renovated on average in CS 80 and 3.1 % of buildings per year on average in CS 95.
4. Industry:
· In the industry sector there are high efficiency gains in electricity demand, new production processes and the expansion of closed-loop materials management by 2050 in CS 80.
· In CS 95, industry develops into a high efficiency sector in which new production processes quickly reach market maturity and closed-loop materials management is substantially strengthened.
· In 2050, the energy sources are electricity, biomass, some district heating and some coal (only for iron reduction). In CS 80, natural gas is also used, which is substituted by biomass due to the significantly higher CO2 price in CS 95.
· In CS 80 industry processes contribute a disproportionately low amount to the emission reductions. In CS 95 a portion of the process-related emission reduction in the industry sector is brought about by the use of CCS. The carbon is captured in, for example, the production of crude steel, cement and several chemical products. A total of 41 Mt CO2 is captured using CCS technology in 2050. If CCS technology is not available by 2050 for some reason, other strategies for reducing process-related emissions (more comprehensive substitution of processes and products) must be developed and above all the expansion of renewable energies has be significantly stronger.
· For the large efficiency gains in the industry sector it is assumed that by 2030 new production processes reach market maturity and progress has been made in the transition of the steel industry from oxygen to electric arc furnace steelmaking. Due to the long-lived capital stock, substantial progress must be made in all areas (process technology, steam generators, electric motor systems etc.) by 2030. In CS 95 instruments for tapping ambitious efficiency potentials (system optimization, waste heat, low temperature heat) must be additionally implemented and effectively used by 2030. Furthermore, it is assumed that CCS technology is market-ready by 2030.
· In CS 95 there are significantly more ambitious efficiency improvements – especially in the area of low-temperature waste heat which has potentials that are difficult to tap. The improvement in materials efficiency also occurs more quickly. Innovative high efficiency production processes reach market maturity more quickly.
· Necessary instruments for achieving the transformation of the industry sector described include a price signal for the non-ETS sector (e.g. carbon tax) and high emission allowance prices in the EU ETS by 2030, promotion of R&D and the market introduction of low-CO2 industry processes (before 2020), financial promotion of efficiency technologies with longer amortisation times (> 5 years), binding comprehensive energy management and energy consultancy.
5. Agriculture and LULUCF:
· Large challenges are involved in halving agricultural emissions by 2050 while maintaining agricultural production for a growing world population. Diverse research efforts are needed. Based on biological processes in crop production and livestock farming, it is not possible to achieve high emission reductions with technical measures (as it is in other sectors).
· The most important reduction potentials lie in the improvement of nitrogen efficiency, increasing the proportion of land used for organic farming, technical measures for handling farm manure on the supply side, consumtion reductions and the careful use of agricultural products on the demand side. Above all the reduction of consumption of animal products leads to a decrease in livestock and thus lower greenhouse gas emissions in the agricultural sector. This creates export opportunities for plant-based products ("freed-up" forage area); an export strategy for animal products should be avoided to benefit the climate balance.
· In CS 95 the measures in this area are basically the same as those used as in CS 80; however, a more rigorous implementation is assumed.
· The reduction of emissions arising from the agricultural use of organic land in particular makes a crucial contribution to emission reductions in the LULUCF sector. For this purpose, it is assumed in CS 80 that the agricultural use of organic land occurs on 30 % of the corresponding land and in CS 95 on 95 % of the land. Peat extraction is discontinued by 2030 in both scenarios.
6. Overall aspects:
· Economic effects: In CS 80 there are positive effects on jobs in Germany overall, especially in the building, property, consultancy and energy sectors. There are also positive effects for the import-export balance, particularly on the energy markets: the net imports of fossil fuels decrease substantially, which has a positive effect on the import-export balance.
· In both target scenarios CO2 prices that are continuously rising and are high to very high by 2050 or surcharges on the fossil fuel prices have a strong incentive effect for emission reductions. The question of how the appropriate incentives can be realized in practice by means of targeted tax measures or other instruments should thus be addressed when developing the climate protection strategy.
· In almost all sectors, targeted research and development on the market penetration and cost reduction of climate protection technologies plays an important role, particularly in CS 95, which assumes both a much broader penetration for market-best technologies and the long-term application of technologies that have not yet been commercially tested, e.g. CCS, large-
scale power-to-heat or the production of synthetic fuels using PtX (power-to-gas, power-to-liquid).
· Biomass: The achievement of an 80-95 % GHG reduction is thus possible with only a limited use of sustainable domestic biomass in all sectors. The land needed for biomass production is approximately the same amount of land as at present.
· Emissions and the incorporation of greenhouse gases from land use, land use change and forestry are – like the emissions of international air transport and maritime transport – not currently considered in Germany’s climate protection targets. In both target scenarios, however, the desired emission reductions can also be achieved taking into account these sectors. For this, substantial additional efforts are also needed in these areas.