45
Climate Trends and Wheat Straw Supplies Dave Sauchyn, Prairie Adaptation Research Collaborative, University of Regina North American Mushroom Conference, Vancouver, 23 June 2013
| Date post: | 30-Dec-2015 |
| Category: |
Documents |
| Upload: | aubrey-chapman |
| View: | 21 times |
| Download: | 1 times |

Climate Trends and Wheat Straw Supplies
Dave Sauchyn, Prairie Adaptation Research Collaborative, University of Regina
North American Mushroom Conference, Vancouver, 23 June 2013North American Mushroom Conference, Vancouver, 23 June 2013

Climate: from klima (ancient Greek) meaning inclination: a tendency, characteristic likelihood
• climate is the statistics of weather• “weather is what we get,
climate is what we expect”
What is climate change?
Climate change: a statistically significant variation in the mean climate or in its variability, persisting for an extended period (decades or longer).
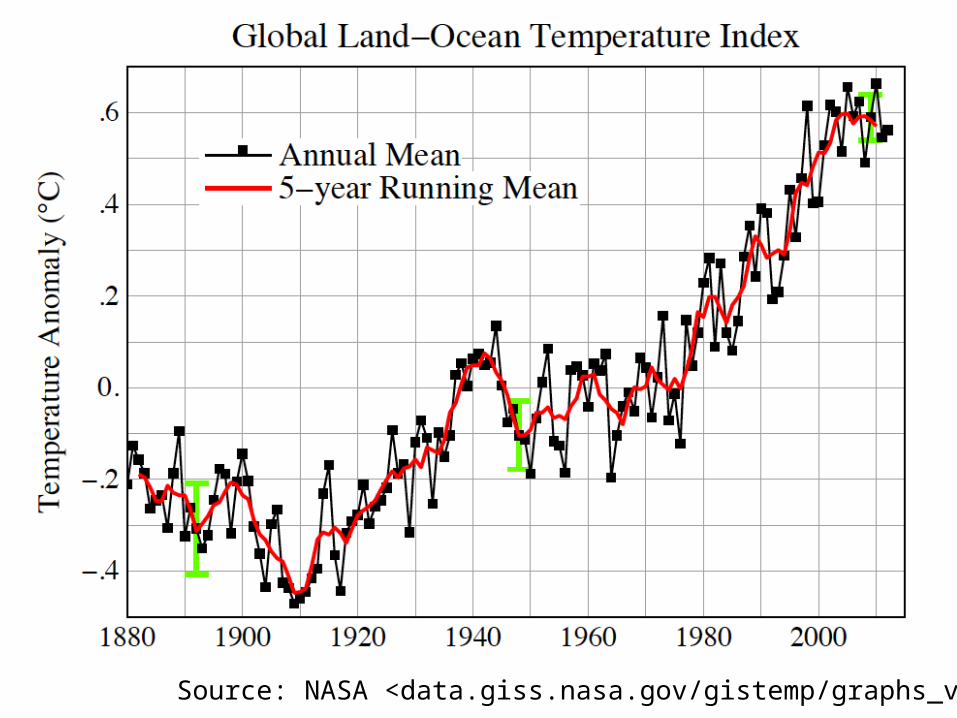
Source: NASA <data.giss.nasa.gov/gistemp/graphs_v3>

April 2013 was the 339th consecutive month (more than 28 years) with a global temperature above the 20th century average.
Every month has been warmer than average since May, 1985.

Question 1
A recent study reviewed 13,950 scientific articles on the topic of climate change. How many of these articles concluded that there was no human caused global warming? 6950209243210


Question 2
Anthropogenic (human caused) global warming is a relatively recent scientific discovery TrueFalse

Joseph Fourier (1768 –1830) – 1824Svante August Arrhenius (1859 –1927) - 1896 Guy Stewart Callendar (1898 – 1964) - 1938

Question 3
The concentration of carbon dioxide in the atmosphere currently is 300 ppm330 ppm375 ppm400 ppm

Atmospheric Carbon Dioxide
Source: NASA <climate.nasa.gov/evidence>

The level of the most important heat-trapping gas in the atmosphere, carbon dioxide, has passed a long-feared milestone, scientists reported Friday, reaching a concentration not seen on the Earth for millions of years.
Scientific monitors reported that the gas had reached an average daily level that surpassed 400 parts per million – just an odometer moment in one sense, but also a sobering reminder that decades of efforts to bring human-produced emissions under control are faltering.
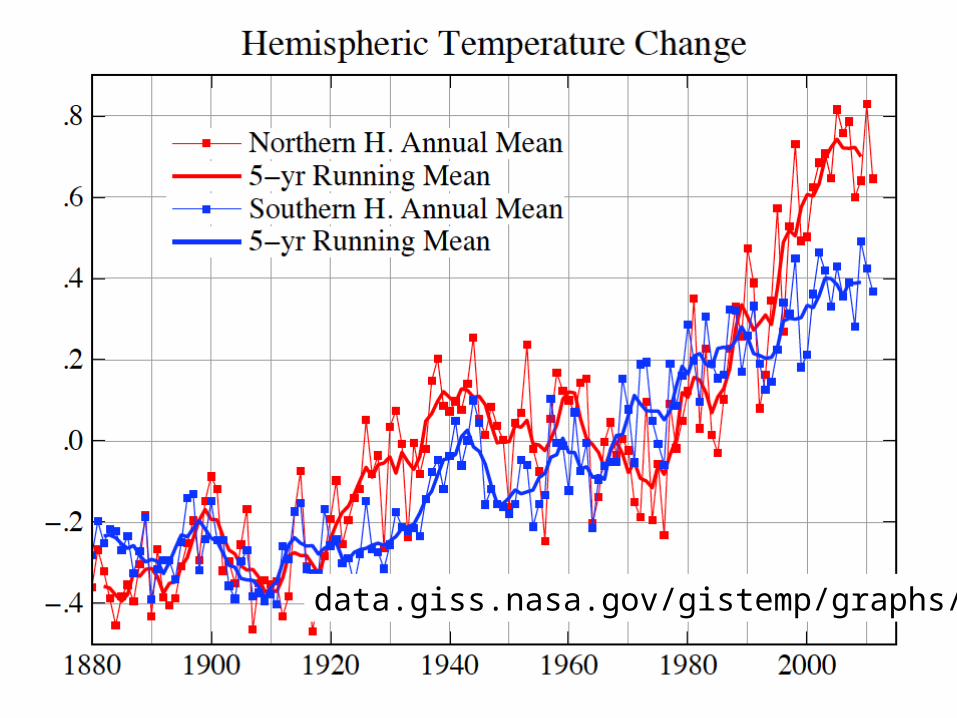
data.giss.nasa.gov/gistemp/graphs/

Average Winter Temperatures (° C), Edmonton, 1881-2010
1969: - 20° C
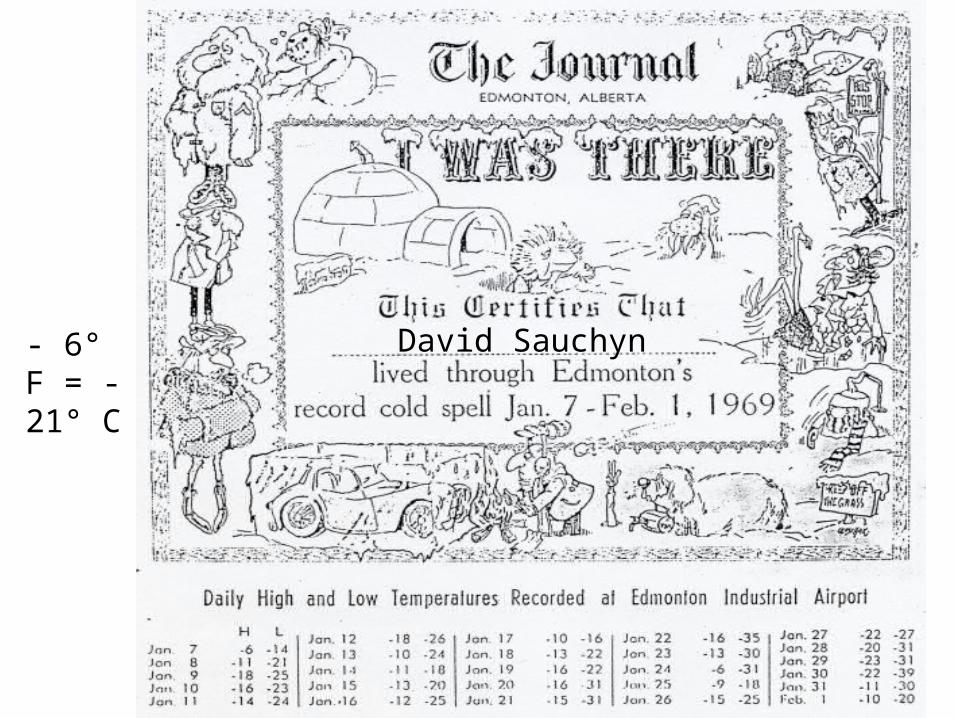
David Sauchyn- 6° F = - 21° C

Thanks to:
Lawrence Zimmermann, Highline Mushrooms (Ontario)Burton Loveday, Loveday Mushrooms (Manitoba)Mike Manion, All Seasons Mushrooms (Alberta & BC)Don Needham, Hy-Tech Compost (U.S.)
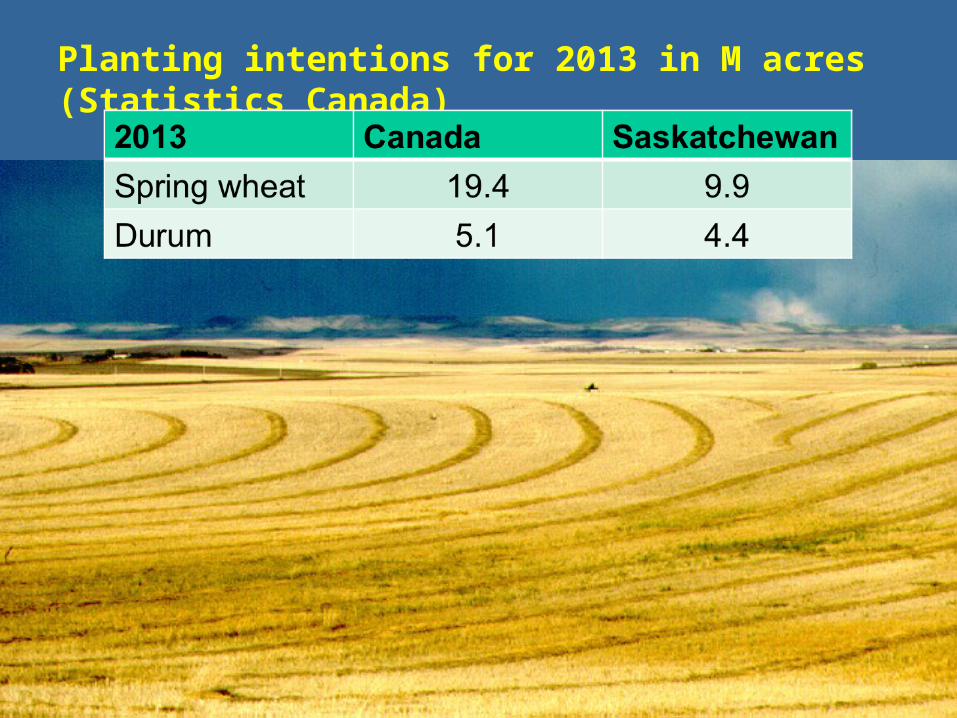
Planting intentions for 2013 in M acres (Statistics Canada)

http://storymaps.esri.com/stories/feedingtheworld/
Global Crop Production
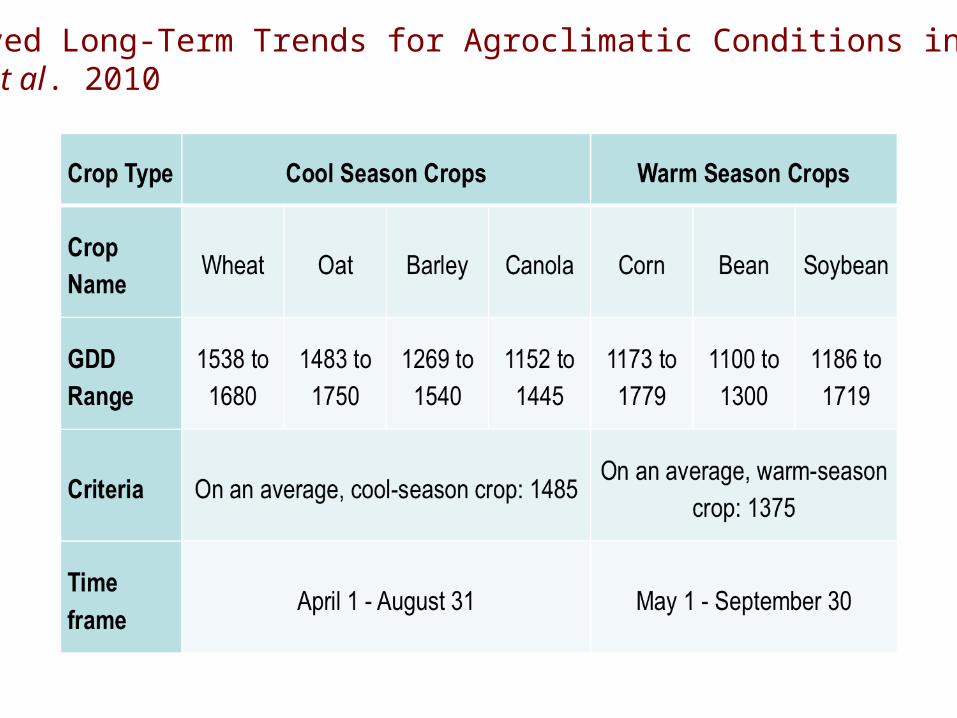
Observed Long-Term Trends for Agroclimatic Conditions in CanadaQian et al. 2010
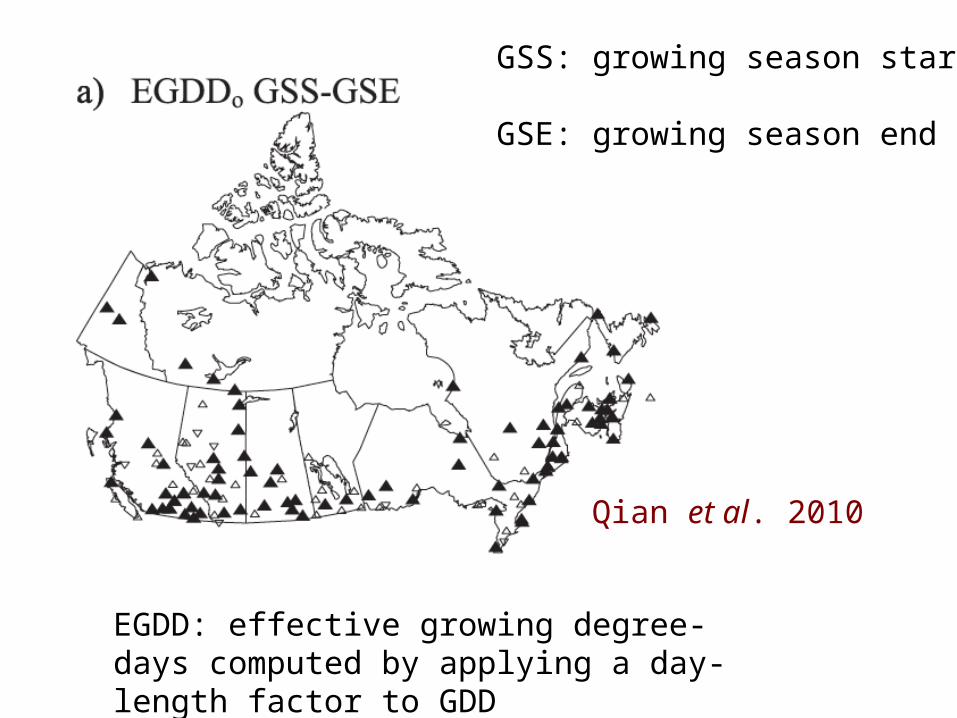
EGDD: effective growing degree-days computed by applying a day-length factor to GDD
Qian et al. 2010
GSS: growing season start
GSE: growing season end

Percentage of stations showing a significant positive trend (++) or a significant negative trend (--)
EGDD: effective growing degree-days computed by applying a day-length factor to GDD

We find a significant increasing trend in the length of the growing season and in the associated available heat. The winter temperature is less damaging and the frost-free periods are longer. We also find trends in precipitation-related indices that indicate more availability of water, though the trend in the main agriculture region is less significant.
QIAN et al. 2010
Observed Long-Term Trends for Agroclimatic Conditions in Canada

CMI is a measure of variability in the ratio of plant water demand to precipitation. It is an indicator of highly variable climates potentially vulnerable to periodic water stress.
www.unesco.orgInterannual Variation in Moisture

Inter-Annual Moisture Variability, North America

From: Sokhansanj et al. 2006. Production and distribution of cereal strawon the Canadian prairies.

Question 4
Have you ever experienced a shortage of wheat straw due poor growing conditions, too little or too rain, in a wheat producing area? YesNo
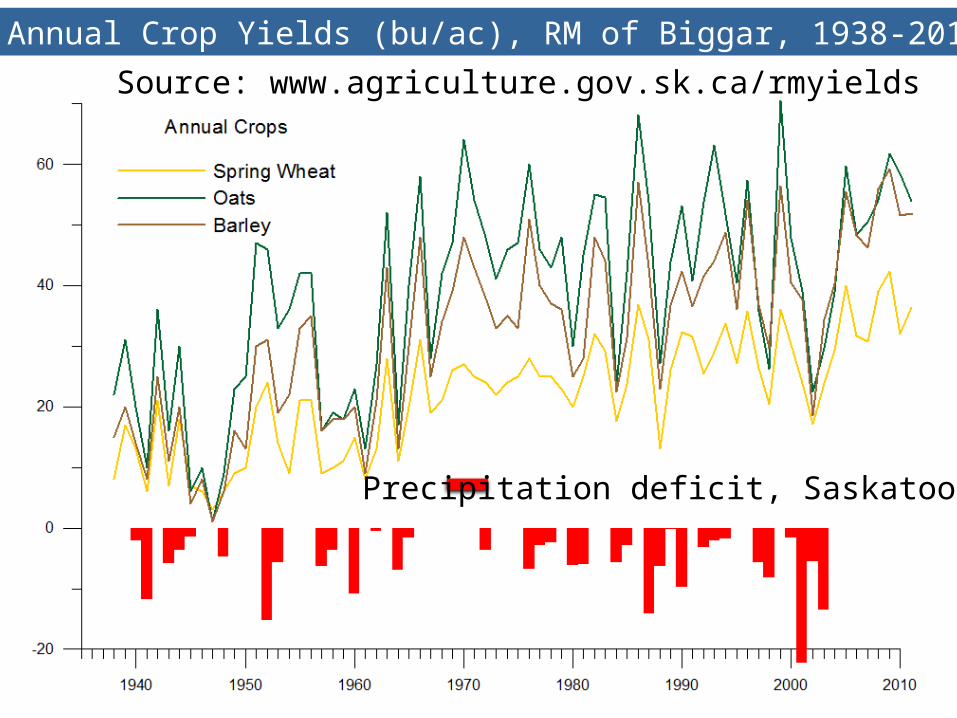
Annual Crop Yields (bu/ac), RM of Biggar, 1938-2010
Source: www.agriculture.gov.sk.ca/rmyields
Precipitation deficit, Saskatoon


October 2010
817 Natural Disasters

1. Drought: Prairie provinces, 1980
3. Drought: Prairie provinces and Central and Southern ON, Jul 5-11 1988
4. Drought: Prairie provinces, 1979
5. Drought: Prairie provinces, 1984
2. Freezing rain: Ontario to New Brunswick, Jan 6-10 1998
* Drought, Prairies, 2001-02, $.58 B

9. Drought: Prairie Provinces, 1931-193810. Drought: Prairie Provinces, 1989 12. Drought: Prairie Provinces, 1961
14. Drought: Western Canada, 1985 16. Drought: Prairie Provinces, 197717. Drought: Prairie Provinces, 199018. Drought: Prairie Provinces, 1992
11. Hailstorm: Calgary AB, Sept 7 1991
13. Flood: Assiniboine, Red and Winnipeg Rivers MB, May 1997
15. Tornado: Edmonton AB, Jul 31 1987


depa
rtur
es f
rom
the
1912
-200
7 m
ean
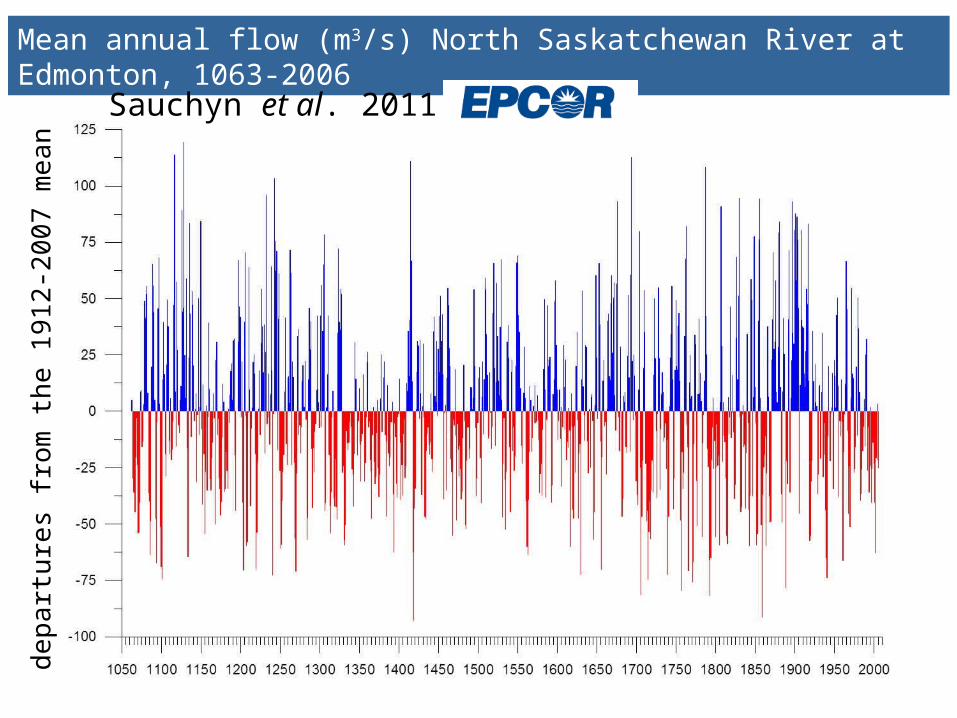
Mean annual flow (m3/s) North Saskatchewan River at Edmonton, 1063-2006
Sauchyn et al. 2011
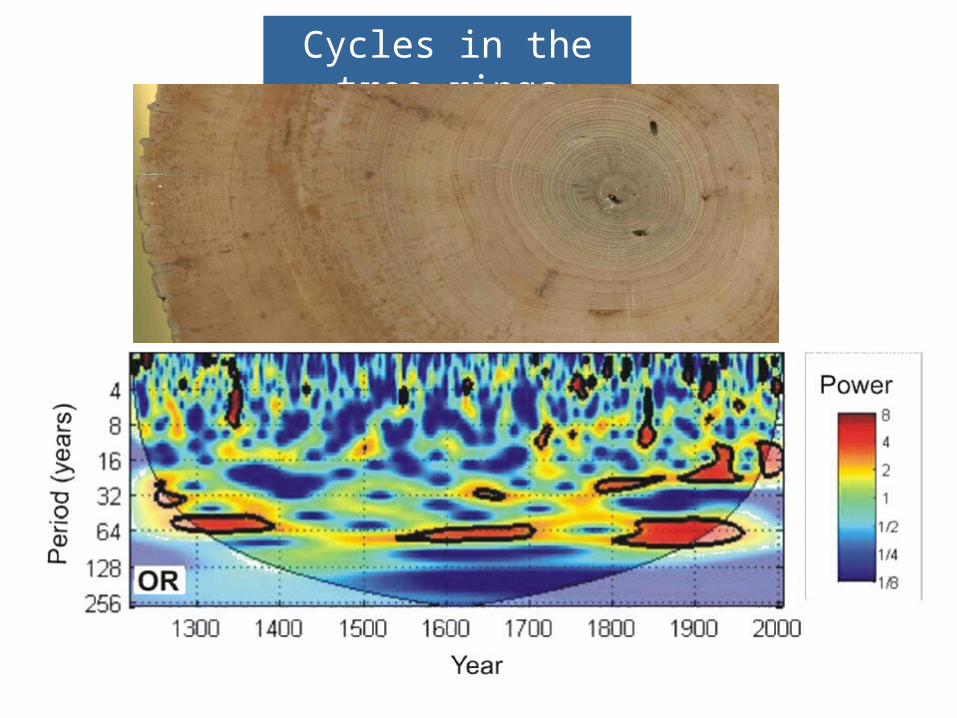
Cycles in the tree rings

El Niño remote impacts: Teleconnections
La Niña teleconnections have the opposite effect
Neelin, 2011. Climate Change and Climate Modeling, Cambridge UP


Munich Reinsurance (2012) Severe weather in North America

"Best Management Practices: For the Agricultural Climate of Tomorrow”
Vegreville, AB, March 26, 2009


THANKS!
aaog.blogspot.ca


