Page 1
Climate variability, trends Climate variability, trends and and scenariosscenarios for Mexico and for Mexico and
ArgentinaArgentina..Cecilia Conde, Marta Vinocur, Carlos Cecilia Conde, Marta Vinocur, Carlos
Gay, Roberto Seiler. Gay, Roberto Seiler.
AIACC LA-29AIACC LA-29Integrated Assessment of Social Vulnerability and
Adaptation to Climate Variability and Change Among Farmers in Mexico and Argentina
Page 2
Uribe, 2002.
Douglas, 1993.
Douglas, 1993.
Palma, 2004
Page 3
4.5
5.5
6.5
7.5
8.5
9.5
10.5
11.5
Pcp
(mm
/da
y)
1 4 71013161922252831343740434649525558616467707376798285889194
year
Observed Pcp. Veracruz.JJA. 1901- 1995http://ipcc-ddc.cru.uea.ac.uk/
wr 1961-1990
17
17.5
18
18.5
19
19.5
20
20.5
21
21.5
22
22.5
23 T
(°C
)
1 4 7 1013161922252831343740434649525558616467707376798285889194
year
Observed T. Veracruz. JJA. 1901- 1995http://ipcc-ddc.cru.uea.ac.uk/
wr 1961-1990
Central Region Veracruz12 Events > +1 std
3 events <-1std
1 event > +1 std
8 events <-1std
7 events > +1 std 1 event > +1 std
6 events<-1std7 events<-1std
Page 4
O n c a t i v o
L a b o u la y e
R í o C u a r t o
M a r c o J u á r e z
ArgentinaArgentina
Study areaStudy area
Córdoba Córdoba ProvinceProvince
Page 5
IPCC vs Observed data (3 stations)IPCC vs Observed data (3 stations)Southern CórdobaSouthern Córdoba
1961 1967 1973 1979 1985 1991 1997 2003
160
250
340
430
520
610
DJF
pre
cipi
tatio
n (m
m)
Years
pcp_djf
avr_djf
r = 0.86 Pcp. Obs. DEF.
Page 6
Pcp Laboulaye, 1961 -2003Pcp Laboulaye, 1961 -2003
1961 1967 1973 1979 1985 1991 1997 2003
-1.8
-0.9
0.0
0.9
1.8
2.7
ISP
3 -
Feb
ruar
y
Years
base
ISP3_lb
p_is3lb_m
p_is3lb_p
Page 7
Risk spaceRisk space. Veracruz. JJA. Veracruz. JJA
-110
-80
-50
-20
10
40
70
100
An
om
. P
CP
(%
)
-3 -2.5 -2 -1.5 -1 -0.5 0 0.5 1 1.5 2 2.5 3 3.5 Anom. T (°C)
61
6263
64 6566
6768
69
70
71
72
73
74
75
76
77
78
79
80
81
8283
84
85
86
8788
89 90
91 92
93
9495
96
9798
99
00
LAS VIGAS, VER.JJA. 1961-2000
PCP vs. TMAX
N
NN N
N
N
N
N N
Na
Na
Na
Na
Na
Na
Na Na
Page 8
-60
-40
-20
0
20
40
60
80
100
Pcp a
nom
alies (
%)
-3 -2 -1 0 1 2 3 4
Tmax anomalies (ºC)
61+62+63+
64+
65+
66+
67
68-69
70
71-
7273+
74
75-76+
77+
78 79-
80
81+82
83+
84-
85
86
87+
8889-
9091+
92+
93+
94+
95+
96-
97+
98
99+
00+
Laboulaye, Córdoba. DEF
Risk spaceRisk space. Laboulaye, Cba. . Laboulaye, Cba.
Page 9
• Relation between climate – specific crops• Allows us to differentiate seasonal climatic
impacts from other stressors • Relation to current governmental programs
(example: FAPRACC, Mexico). • Helps communication. Decision makers and
regional experts. • Helps to decide between climate change
scenarios.
Some advantages of these Climatic Some advantages of these Climatic Risk SpacesRisk Spaces
Page 10
Uncertainties Uncertainties
• Spatial: Regional, local?
• Temporal: annual, seasonal, monthly, daily data (frost, hail, strong winds)? Future?
• “Risk” to whom? to what? Different crop sensitivity
Page 11
Climate Change scenariosClimate Change scenarios
• Magicc /ScengenMagicc /Scengen outputs– SRES: A2 and B2– Medium and High Sensitivity– Echam, Hadley, GFDL– 2020, 2050 (monthly and seasonal)– Temperature and Precipitation
• Simple interpolation in 1ºx1º grid (Mexico).• For study sites: scatter plots (simple interpolation)• Downscaling techniques for Veracruz (Mexico).
No SRES. 2xCO2
C. Conde, A. Tejeda, C. Gay, O. Sánchez*, R. Araujo, B. Palma, Vinocur.
Page 12
Selected GCMsSelected GCMs
• ECHAMECHAM model: model: Lowest differences with observed data. México (Magaña, 2003;Conde, 2003).
• GFDL (and CC) models: GFDL (and CC) models: used in Country Study: Mexico (1994 – 1996)
• HADLEY model: HADLEY model: used in LA
• These models are used also for Córdoba, Córdoba, Argentina, Argentina, as suggested by LA-26
Page 13
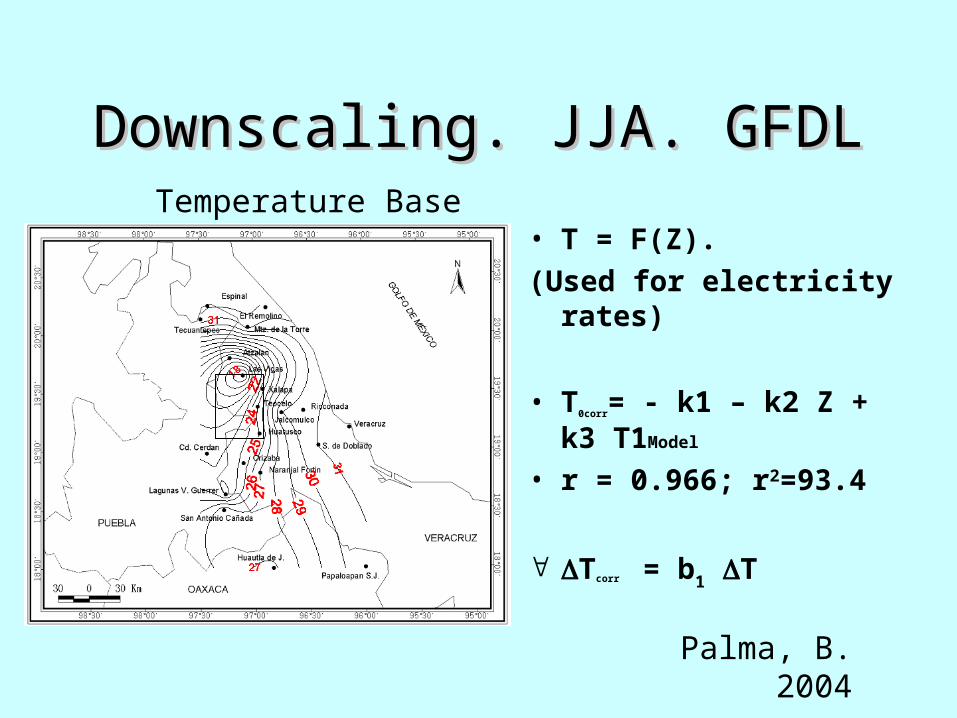
Downscaling. JJA. GFDL Downscaling. JJA. GFDL
• T = F(Z).
(Used for electricity rates)
• T0corr= - k1 – k2 Z + k3 T1Model
• r = 0.966; r2=93.4
Tcorr = b1 T
Temperature Base Scenario
Palma, B. 2004
Page 14
Examples for Mexico.Examples for Mexico.
ECHAM98. A2 MES. 2020.
PRECIPITATION. JULY
(-8,-2)
(12%,- 8%)
(16%, 8%)
“user friendly”
Sánchez, Araujo, Conde
Page 15
MEXICO. Temperature Climate Change MEXICO. Temperature Climate Change Scenarios. A2, B2. 2020, 2050. 3 GCMs. JulyScenarios. A2, B2. 2020, 2050. 3 GCMs. July
0.5
1
1.5
2
2.5
3
Cha
ng
es in
Te
mp
era
ture
(ºC
)
2020 2050
hadcm3 a2
gfdl30 a2echam4 a2hadcm3b2
echam4 b2
gfdl30 b2
T(ºC) Change Scenarios.2020,2050
Central Region. Veracruz. July
Page 16
0
0.4
0.8
1.2
1.6
2020 2050
ecA2
ecB2
gfA2
gfB2
hdA2
hdB2
T(ºC) Change Scenarios.2020,2050Central-Southern Region. Cordoba. JAN
ARGENTINA. Temperature Climate Change ARGENTINA. Temperature Climate Change Scenarios. A2, B2. 2020, 2050. 3 GCMs. Jan.Scenarios. A2, B2. 2020, 2050. 3 GCMs. Jan.
Page 17
MEXICO. Precipitation Climate Change MEXICO. Precipitation Climate Change Scenarios. A2, B2. 2020, 2050. 3 GCMs. JulyScenarios. A2, B2. 2020, 2050. 3 GCMs. July
-40
-20
0
20
40
60
Pre
cip
itation c
hange (
%)
2020 2050
hadcm3 a2
echam4 a2
gfdl30 a2
hadcm3b2
echam4 b2
gfdl30 b2
Pcp Change Scenarios. JulyCentral Region. Veracruz. 2020,2050
Page 18
Argentina. Precipitation Climate Change Argentina. Precipitation Climate Change
Scenarios.Scenarios. A2, B2. 2020, 2050. 3 GCMs. A2, B2. 2020, 2050. 3 GCMs. Jan.Jan.
-2
0
2
4
6
8
changes in p
cp (
%)
2020 2050
ECA2
ECB2GFA2
GFB2HDA2HDB2
Precipitation Climate Change ScenariosJanuary. Central -Southern Córdoba
Page 19
Decisions?Decisions?
-40
-20
0
20
40
60
Pre
cip
ita
tio
n c
ha
nge
(%
)
2020 2050
hadcm3 a2
echam4 a2
gfdl30 a2
hadcm3b2
echam4 b2
gfdl30 b2
Pcp Change Scenarios. JulyCentral Region. Veracruz. 2020,2050
Pcp: -35% to +40%
T: 1.5ºC to 3.8ºC
Which of the multiple
combinations represent
future climatic risk?
Or an opportunity?
Page 20
““Risk Space”. Veracruz. 2020Risk Space”. Veracruz. 2020
-30
-20
-10
0
10
20
0.9 1 1.1 1.2 1.3 1.4 1.5 1.6
hadcm3 a2
hadcm3b2
echam4 a2echam4 b2
gfdl30 a2
gfdl30 b2
Scenarios A2,B2. 2020. 3 GCMs
July
Page 21
Summer Temperature 1969-2050E=Echam, H=Hadley, sm=Clim Sen. Med., sa=Clim.
Sen. High, trend=tendency (aleatory numeric generator).
What about changes in variability?What about changes in variability?
Gay,C., F. Estrada, C. Conde, 2004
Page 22
ConclusionsConclusions• Regional climatic variability and trends analysis
helps defining climatic risk• Climatic “risk spaces” can be use as a tool to
communicate risk, related to crops and defining other stressors.
• Regional climate change scenarios can be compared to “risk spaces” to define future climatic risk and/or opportunities.
• Changes in climate variability are fundamental for agriculture


![SEILER John SL414 - E. C. Saylor · John "Hans" SEILER and Elizabeth BLOUGH 1. John "Hans"1 SEILER [SL414+], born i, 26 Aug 1768 in Pennsylvania; died i 4 Mar 1855, son of John SEILER](https://static.documents.pub/doc/80x56/5b5cba237f8b9a3a718cdb1f/seiler-john-sl414-e-c-john-hans-seiler-and-elizabeth-blough-1-john-hans1.jpg)


