ARTICLE Clinical and molecular cross-sectional study of a cohort of adult type III spinal muscular atrophy patients: clues from a biomarker study Francesco D Tiziano* ,1 , Rosa Lomastro 1 , Lorena Di Pietro 1 , Maria Barbara Pasanisi 2 , Stefania Fiori 1 , Carla Angelozzi 1 , Emanuela Abiusi 1 , Corrado Angelini 3 , Gianni Soraru ` 3 , Alessandra Gaiani 3 , Tiziana Mongini 4 , Liliana Vercelli 4 , Gessica Vasco 5 , Giuseppe Vita 6 , Gian Luca Vita 6 , Sonia Messina 6 , Luisa Politano 7 , Luigia Passamano 7 , Grazia Di Gregorio 7 , Cristina Montomoli 8 , Chiara Orsi 8 , Angela Campanella 2 , Renato Mantegazza 2 and Lucia Morandi 2 Proximal spinal muscular atrophy (SMA) is an autosomal recessive neuromuscular disorder caused by mutations of the SMN1 gene. Based on severity, three forms of SMA are recognized (types I–III). All patients usually have 2–4 copies of a highly homologous gene (SMN2), which produces insufficient levels of functional survival motor neuron (SMN) protein due to the alternative splicing of exon 7. The availability of potential candidates to the treatment of SMA has raised a number of issues, including the availability of biomarkers. This study was aimed at evaluating whether the quantification of SMN2 products in peripheral blood is a suitable biomarker for SMA. Forty-five adult type III patients were evaluated by Manual Muscle Testing, North Star Ambulatory Assessment scale, 6-min walk test, myometry, forced vital capacity, and dual X-ray absorptiometry. Molecular assessments included SMN2 copy number, levels of full-length SMN2 (SMN2-fl) transcripts and those lacking exon 7 and SMN protein. Clinical outcome measures strongly correlated to each other. Lean body mass correlated inversely with years from diagnosis and with several aspects of motor performance. SMN2 copy number and SMN protein levels were not associated with motor performance or transcript levels. SMN2-fl levels correlated with motor performance in ambulant patients. Our results indicate that SMN2-fl levels correlate with motor performance only in patients preserving higher levels of motor function, whereas motor performance was strongly influenced by disease duration and lean body mass. If not taken into account, the confounding effect of disease duration may impair the identification of potential SMA biomarkers. European Journal of Human Genetics advance online publication, 17 October 2012; doi:10.1038/ejhg.2012.233 Keywords: spinal muscular atrophy; SMN; biomarker; outcome measure; real-time PCR INTRODUCTION Proximal spinal muscular atrophies (SMAs) are a group of clinically variable motor neuron disorders characterized by degeneration of spinal cord anterior horn cells. SMAs are generally classified into types I to III according to age at onset and highest motor milestone achieved. 1,2 SMA type III is the most clinically variable form, with symptoms onset before (type IIIa) or after (type IIIb) age 3 years, 3 normal achievement of motor milestones, variable severity of scoliosis, tendon retractions and joint contractures, and eventual loss of walking ability. Type I–III SMAs are autosomal recessive conditions caused by loss of function of the survival motor neuron (SMN1) gene. 4 Irrespective of phenotypic severity, both copies of the SMN1 gene are absent in about 95% of cases, whereas 2–3% of patients are compound heterozygotes typically with one allele deleted and subtle mutations in the other. 5 Complete loss of the SMN protein is embryonically lethal, 6 but SMA patients obtain reduced amounts of the protein from a nearly identical gene copy, SMN2, present (with SMN1) in a duplicated and inverted region of 5q13. 4 Because of alternative splicing, most SMN2 transcripts lack exon 7 (SMN-del7) so that insufficient amounts of functional protein are produced. In fact, SMN protein levels are reduced in spinal cord and cell cultures from SMA patients, and correlate inversely with phenotypic severity. 7–9 SMN2 copy number can also vary, and patients with high copy number often have a milder phenotype. 10–12 At present, there is no effective treatment for SMA. Some therapeutic approaches aim to increase the amount of SMN protein produced by SMN2 through promoter activation, reduction of exon 7 alternative splicing, or both. 13–22 Some of these approaches are being investigated in ongoing or planned clinical trials, and great efforts have been done to identify the most appropriate clinical outcome measures for patients affected from various severities. 23 In this view, 1 Medical Genetics Institute, Catholic University, Rome, Italy; 2 Muscle Pathology and Neuroimmunology Unit, Foundation Neurological Institute Carlo Besta, Milan, Italy; 3 Department of Neurosciences, University of Padua, Padova, Italy; 4 Neuromuscular Disorders, Molinette Hospital, Turin, Italy; 5 Department of Pediatric Neurology, Catholic University, Rome, Italy; 6 Department of Neurosciences, Psychiatry, Anesthesiology, University of Messina, Messina, Italy; 7 Cardiomyology Genetics Section, Second University of Naples, Naples, Italy; 8 Department of Public Health, Neuroscience, Experimental and Forensic Medicine – Section of Biostatistics and Clinical Epidemiology, University of Pavia, Pavia, Italy *Correspondence: Dr FD Tiziano, Institute of Medical Genetics, Catholic University, Largo Francesco Vito, 1, 00168 Rome, Italy. Tel: +39 0630154606; Fax: +39 0630157223; E-mail: [email protected]Received 1 May 2012; revised 22 August 2012; accepted 18 September 2012 European Journal of Human Genetics (2012), 1–7 & 2012 Macmillan Publishers Limited All rights reserved 1018-4813/12 www.nature.com/ejhg
Transcript
ARTICLE
Clinical and molecular cross-sectional study of acohort of adult type III spinal muscular atrophypatients: clues from a biomarker study
Francesco D Tiziano*,1, Rosa Lomastro1, Lorena Di Pietro1, Maria Barbara Pasanisi2, Stefania Fiori1,Carla Angelozzi1, Emanuela Abiusi1, Corrado Angelini3, Gianni Soraru3, Alessandra Gaiani3,Tiziana Mongini4, Liliana Vercelli4, Gessica Vasco5, Giuseppe Vita6, Gian Luca Vita6, Sonia Messina6,Luisa Politano7, Luigia Passamano7, Grazia Di Gregorio7, Cristina Montomoli8, Chiara Orsi8,Angela Campanella2, Renato Mantegazza2 and Lucia Morandi2
Proximal spinal muscular atrophy (SMA) is an autosomal recessive neuromuscular disorder caused by mutations of the SMN1
gene. Based on severity, three forms of SMA are recognized (types I–III). All patients usually have 2–4 copies of a highly
homologous gene (SMN2), which produces insufficient levels of functional survival motor neuron (SMN) protein due to the
alternative splicing of exon 7. The availability of potential candidates to the treatment of SMA has raised a number of issues,
including the availability of biomarkers. This study was aimed at evaluating whether the quantification of SMN2 products in
peripheral blood is a suitable biomarker for SMA. Forty-five adult type III patients were evaluated by Manual Muscle Testing,
North Star Ambulatory Assessment scale, 6-min walk test, myometry, forced vital capacity, and dual X-ray absorptiometry.
Molecular assessments included SMN2 copy number, levels of full-length SMN2 (SMN2-fl) transcripts and those lacking
exon 7 and SMN protein. Clinical outcome measures strongly correlated to each other. Lean body mass correlated inversely
with years from diagnosis and with several aspects of motor performance. SMN2 copy number and SMN protein levels were
not associated with motor performance or transcript levels. SMN2-fl levels correlated with motor performance in ambulant
patients. Our results indicate that SMN2-fl levels correlate with motor performance only in patients preserving higher levels
of motor function, whereas motor performance was strongly influenced by disease duration and lean body mass. If not taken
into account, the confounding effect of disease duration may impair the identification of potential SMA biomarkers.
European Journal of Human Genetics advance online publication, 17 October 2012; doi:10.1038/ejhg.2012.233
Proximal spinal muscular atrophies (SMAs) are a group of clinicallyvariable motor neuron disorders characterized by degeneration ofspinal cord anterior horn cells. SMAs are generally classified into typesI to III according to age at onset and highest motor milestoneachieved.1,2 SMA type III is the most clinically variable form, withsymptoms onset before (type IIIa) or after (type IIIb) age 3 years,3
normal achievement of motor milestones, variable severity ofscoliosis, tendon retractions and joint contractures, and eventualloss of walking ability.
Type I–III SMAs are autosomal recessive conditions caused by lossof function of the survival motor neuron (SMN1) gene.4 Irrespectiveof phenotypic severity, both copies of the SMN1 gene are absent inabout 95% of cases, whereas 2–3% of patients are compoundheterozygotes typically with one allele deleted and subtle mutationsin the other.5 Complete loss of the SMN protein is embryonically
lethal,6 but SMA patients obtain reduced amounts of the protein froma nearly identical gene copy, SMN2, present (with SMN1) in aduplicated and inverted region of 5q13.4 Because of alternativesplicing, most SMN2 transcripts lack exon 7 (SMN-del7) so thatinsufficient amounts of functional protein are produced. In fact,SMN protein levels are reduced in spinal cord and cell cultures fromSMA patients, and correlate inversely with phenotypic severity.7–9
SMN2 copy number can also vary, and patients with high copynumber often have a milder phenotype.10–12
At present, there is no effective treatment for SMA. Sometherapeutic approaches aim to increase the amount of SMN proteinproduced by SMN2 through promoter activation, reduction of exon 7alternative splicing, or both.13–22 Some of these approaches are beinginvestigated in ongoing or planned clinical trials, and great effortshave been done to identify the most appropriate clinical outcomemeasures for patients affected from various severities.23 In this view,
1Medical Genetics Institute, Catholic University, Rome, Italy; 2Muscle Pathology and Neuroimmunology Unit, Foundation Neurological Institute Carlo Besta, Milan, Italy;3Department of Neurosciences, University of Padua, Padova, Italy; 4Neuromuscular Disorders, Molinette Hospital, Turin, Italy; 5Department of Pediatric Neurology, CatholicUniversity, Rome, Italy; 6Department of Neurosciences, Psychiatry, Anesthesiology, University of Messina, Messina, Italy; 7Cardiomyology Genetics Section, Second University ofNaples, Naples, Italy; 8Department of Public Health, Neuroscience, Experimental and Forensic Medicine – Section of Biostatistics and Clinical Epidemiology, University of Pavia,Pavia, Italy*Correspondence: Dr FD Tiziano, Institute of Medical Genetics, Catholic University, Largo Francesco Vito, 1, 00168 Rome, Italy. Tel: +39 0630154606; Fax: +39 0630157223;E-mail: [email protected]
Received 1 May 2012; revised 22 August 2012; accepted 18 September 2012
European Journal of Human Genetics (2012), 1–7& 2012 Macmillan Publishers Limited All rights reserved 1018-4813/12
it would be very useful to have reliable biomarkers of disease severityand response to treatment.23
In the present study, we investigated associations between clinicalphenotype and molecular characteristics in adult patients with typeIII SMA, with the aim of evaluating available molecular biomarkersfor possible use as surrogate endpoints in clinical trials on SMA.Clinical phenotype was assessed by tests of muscle strength andfunction. Molecular evaluation comprised determination of SMN2copy number, SMN transcript levels (full length and del7), and SMNprotein levels.
MATERIALS AND METHODS
Patients and clinical evaluationA total of 45 patients (29 male, 16 female, Table 1), mean age 36.8 years (range
18–56 years) with diagnosis confirmed by molecular analysis were recruited to
an ongoing double-blind placebo-controlled multicenter trial to assess the
safety of salbutamol (EudraCT No. 2007-001088-32). All patients enrolled in
the double-blind trial were included in the present study. At clinical evaluation,
26 were ambulant and 19 were wheelchair bound (mean age at loss of walking,
20 years). Based on age of onset, 15 were type IIIa and 30 were type IIIb. No
patients reported onset of symptoms over 18 years of age. Written informed
consent was obtained from all patients, and the study was approved by the
Ethics Committee of each participating Centre.
Patients were comprehensively evaluated at baseline. Only selected variables
are reported here as potential outcome measures. Muscle strength was assessed
by manual muscle testing of 18 muscle groups (elbow flexors and extensors,
finger flexors and extensors, thigh flexors and extensors, leg flexors and
extensors, foot dorsiflexors) and graded from 0 to 5 according to the Medical
Research Council (MRC) scale.24 The force of maximum voluntary isometric
contraction (Newtons, N) was assessed in elbow flexor, handgrip, three-point
pinch, knee flexor, and knee extensor25 for 30 of the 45 patients, using a hand-
held myometer (CIT Technics, Groningen, The Netherlands).
In ambulant patients, motor function was assessed by the North Star
Ambulatory Assessment (NSAA) scale.26 Ambulant patients also performed
the 6-Min walk test (6MWT) recently shown to be reliable for assessing type
III SMA patients.27,28
Forced vital capacity (FVC, % of predicted) was measured in all patients
using a standard spirometer in the sitting position. Lean body mass (grams)
was assessed by dual X-ray absorptiometry (DXA)29,30 and normalized to
height (expressed in cm); this evaluation was performed in 20 patients only, in
those neuromuscular Centres where the tool was available. Furthermore, DXA
was feasible only for patients who did not have severe contractures preventing
the access to the examination bed of the instrument.
Molecular assessmentsBlood samples were collected into EDTA tubes for DNA extraction, sodium
citrate tubes for protein extraction, and PAX blood RNA tubes (BD
Biosciences, San Jose, CA, USA) for RNA. The samples were analysed at the
Institute of Medical Genetics of Catholic University in Roma.
Genomic DNA was extracted by standard salting out, and conventional
RFLP-PCR used to verify SMA diagnosis.31 For patients testing negative for
SMN1 mutation by RFLP-PCR, SMN1 copy number was determined (same
method as SMN2 copy number); for patients with a single SMN1 copy,
sequence analysis of exons 1–7 and exon–intron boundaries was performed
(sequence of primers and PCR conditions are available on request).
SMN1 and SMN2 copy number was determined by relative real-time PCR as
reported elsewhere.14 SMN2 copy number was determined in all patients.
The presence of the p.G287R (c.G859C)32 variant in SMN2 was determined
in all patients by RFLP-PCR. Briefly, 50 ng of genomic DNA were amplified
with R1114 as forward primer and G287RDdeR: 50-ATTTAAGGAA
TGTGAGCACCTTA-30 as reverse primer. The latter contains a mismatch
(bold) that introduces a restriction site for DdeI in the variant allele.
Amplification conditions were: 30 cycles of 94 1C for 1 min, 55 1C for 1 min,
721C for 1 min. The PCR products were digested with 3U of restriction
enzyme DdeI overnight at 37 1C. Next day, the digestion products were
separated by electrophoresis on 4% agarose gels. If the G287R variant was
present, two bands (208 and 185 bp) were obtained.
RNA was extracted by PAX blood RNA extraction kit (Qiagen, Dusseldorf,
Germany), according to the manufacturer’s instructions. SMN2 full length
(SMN2-fl), lacking exon 7 (SMN-del7) and total (SMN-fl plus SMN-del7,
SMN-tot) transcript levels were assessed by absolute real-time PCR (Tiziano
et al33 and Angelozzi et al, in preparation). In patients with the G287R variant,
full-length transcripts were determined by an alternative set of Taqman MGB
probe and primers.33 GAPDH transcript levels were determined as quality
control for RT-PCR and real-time PCR.
For SMN protein analysis, time between blood collection and preparation of
samples ranged from a few hours to 2 days. Samples from 43 patients were
analyzable. PBMCs were separated through Lympholyte M medium
(Macherey-Nagel, Duren, Germany). The pellet was washed in PBS and frozen
in fetal calf serum containing 10% DMSO. After thawing, PBMCs were
counted by NucleoCounter (Chemometec, Allerod, Denmark) and resus-
pended in lysis buffer at 2� 106 cells/ml (instead of 108 cells/ml, as in ELISA
protocol, Enzo Life Science, Farmingdale, NY, USA); 2� 105 cells were loaded
onto each ELISA plate. The ELISA kits were kindly provided by the SMA
Foundation. SMN protein concentrations were expressed as pg of protein/106
cells.
Statistical analysisMeans, medians, and SD for continuous variables and proportions for
categorical variables were calculated. Associations of SMN2-fl, SMN-del7,
SMN-tot transcript levels, and SMN protein levels, with clinical characteristics
were assessed by linear regression models. A multivariate model was used to
take account of the influence of other covariates. Because of small sample size
and non-normal distribution of SMN transcript levels,33 the non-parametric
Kruskal–Wallis ‘ANOVA’ by ranks (KW) and Mann–Whitney U-test (MW)
Table 1 Selected clinical and molecular characteristics in a cohort of
type III adult SMA patients
Characteristic
No. of
patients Mean Median Range SD
Clinical features
Age (years) 45 36.8 38 18–56 25.8
MRC total score 45 58.6 58 21–89 16.8
MRC upper limb score 45 31 32 18–40 6.4
MRC lower limb score 45 27.6 29 3–18 11.3
Forced vital capacity (% of
predicted)
36 86.5 84.5 43–121 18.9
Elbow flexion (Newtons) 30 60.2 51 3–222 53.5
Handgrip (Newtons) 30 54.7 42 4–187 50.0
Three-point pinch (Newton) 30 38.3 30 3–110 30.3
Knee flexion (Newtons) 30 42.3 31 0–127 37.1
Knee extensor (Newtons) 30 19.8 10 1–88 22.2
NSAA score (ambulatory
patients)
26 19.8 20 7–31 6.9
6-min walk test (meters) 26 363.5 362.8 85.9–543 116.6
Lean body mass/height (g/cm) 20 210.3 197.7 146.6–305.1 47.1
Molecular findings
SMN2 copy number 45 3.7 4 1–5 0.7
SMN2-fl transcripts (mol/ng
RNA)
45 67.5 64.9 28.5–138.9 20.7
SMN-delta7 transcripts (mol/
ng RNA)
45 235.3 222.4 74.3 534.8
SMN-tot transcripts (mol/ng
RNA)
45 304.0 282.1 131.1–628.9 117.8
SMN protein (pg/106 cells) 43 230.5 155.3 13.4–1076.7 238.0
Adult SMA biomarker studyFD Tiziano et al
2
European Journal of Human Genetics
were used to compare transcript levels between groups (ambulant vs non-
ambulant; type IIIa vs type IIIb). Correlations between clinical characteristics
were evaluated by Pearson’s r (R) test. The t-test for paired samples was used to
compare the performance of groups at different time-points of the 6MWT.
Statgraphics (Centurion XV.II, Statpoint Technologies, Warrenton, VA, USA)
and SPSS 18.0 (SPSS, Inc., Chicago, IL, USA) were used to carry out the
analyses. Differences associated with Po0.05 or, after Bonferroni correction for
multiple testing, with Po0.016 were considered significant.
RESULTS
Genotypic characterization of patients at the SMN locusIn 43 of the 45 patients, SMN1 exon 7 was absent. The remaining twopatients were compound heterozygotes, missing one copy of SMN1,and with the W102X mutation34 in one case, and the S262Imutation35 in the other (Supplementary Figure 1a).
SMN2 gene copy number was determined in all patients. Therewere five SMN2 copies in 2 patients, 4 in 29 patients, three in 13patients and a single copy in the patient with the S262I mutation.Among type IIIa patients, 7 out of 15 (46.7%) had three SMN2copies, the others had 4 genes. Of the 30 type III b subjects, 21 had 4SMN2 genes (70%).
The G287R variant (Supplementary Figure 1b) of SMN2 was foundin 4/45 (8.9%) patients, all type IIIb with three SMN2 copies. One ofthese patients was homozygous for the G287R variant, being presentin both parents.
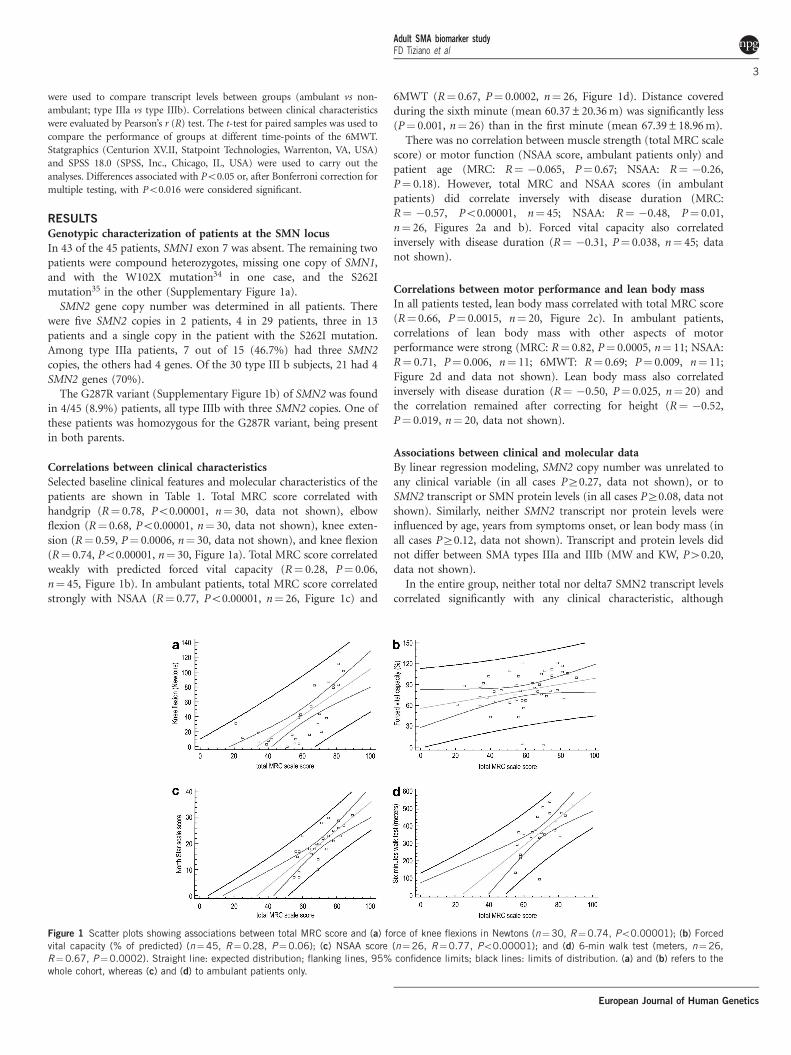
Correlations between clinical characteristicsSelected baseline clinical features and molecular characteristics of thepatients are shown in Table 1. Total MRC score correlated withhandgrip (R¼ 0.78, Po0.00001, n¼ 30, data not shown), elbowflexion (R¼ 0.68, Po0.00001, n¼ 30, data not shown), knee exten-sion (R¼ 0.59, P¼ 0.0006, n¼ 30, data not shown), and knee flexion(R¼ 0.74, Po0.00001, n¼ 30, Figure 1a). Total MRC score correlatedweakly with predicted forced vital capacity (R¼ 0.28, P¼ 0.06,n¼ 45, Figure 1b). In ambulant patients, total MRC score correlatedstrongly with NSAA (R¼ 0.77, Po0.00001, n¼ 26, Figure 1c) and
6MWT (R¼ 0.67, P¼ 0.0002, n¼ 26, Figure 1d). Distance coveredduring the sixth minute (mean 60.37±20.36 m) was significantly less(P¼ 0.001, n¼ 26) than in the first minute (mean 67.39±18.96 m).
There was no correlation between muscle strength (total MRC scalescore) or motor function (NSAA score, ambulant patients only) andpatient age (MRC: R¼ �0.065, P¼ 0.67; NSAA: R¼ �0.26,P¼ 0.18). However, total MRC and NSAA scores (in ambulantpatients) did correlate inversely with disease duration (MRC:R¼ �0.57, Po0.00001, n¼ 45; NSAA: R¼ �0.48, P¼ 0.01,n¼ 26, Figures 2a and b). Forced vital capacity also correlatedinversely with disease duration (R¼ �0.31, P¼ 0.038, n¼ 45; datanot shown).
Correlations between motor performance and lean body massIn all patients tested, lean body mass correlated with total MRC score(R¼ 0.66, P¼ 0.0015, n¼ 20, Figure 2c). In ambulant patients,correlations of lean body mass with other aspects of motorperformance were strong (MRC: R¼ 0.82, P¼ 0.0005, n¼ 11; NSAA:R¼ 0.71, P¼ 0.006, n¼ 11; 6MWT: R¼ 0.69; P¼ 0.009, n¼ 11;Figure 2d and data not shown). Lean body mass also correlatedinversely with disease duration (R¼ �0.50, P¼ 0.025, n¼ 20) andthe correlation remained after correcting for height (R¼ �0.52,P¼ 0.019, n¼ 20, data not shown).
Associations between clinical and molecular dataBy linear regression modeling, SMN2 copy number was unrelated toany clinical variable (in all cases PZ0.27, data not shown), or toSMN2 transcript or SMN protein levels (in all cases PZ0.08, data notshown). Similarly, neither SMN2 transcript nor protein levels wereinfluenced by age, years from symptoms onset, or lean body mass (inall cases PZ0.12, data not shown). Transcript and protein levels didnot differ between SMA types IIIa and IIIb (MW and KW, P40.20,data not shown).
In the entire group, neither total nor delta7 SMN2 transcript levelscorrelated significantly with any clinical characteristic, although
Figure 1 Scatter plots showing associations between total MRC score and (a) force of knee flexions in Newtons (n¼30, R¼0.74, Po0.00001); (b) Forced
vital capacity (% of predicted) (n¼45, R¼0.28, P¼0.06); (c) NSAA score (n¼26, R¼0.77, Po0.00001); and (d) 6-min walk test (meters, n¼26,
R¼0.67, P¼0.0002). Straight line: expected distribution; flanking lines, 95% confidence limits; black lines: limits of distribution. (a) and (b) refers to the
whole cohort, whereas (c) and (d) to ambulant patients only.
Adult SMA biomarker studyFD Tiziano et al
3
European Journal of Human Genetics
SMN2-fl levels correlated weakly with total MRC score (R¼ 0.29;P¼ 0.052, n¼ 45, data not shown), as well as with lower limb MRCscore (R¼ 0.29; P¼ 0.049, n¼ 45, data not shown). In ambulantpatients only, SMN2-fl levels correlated with total MRC score(R¼ 0.46, P¼ 0.02, n¼ 26, Figure 3a), and with lower limb MRCscore (R¼ 0.49, P¼ 0.01, n¼ 26, Figure 3b), and weakly with 6MWT(R¼ 0.37), although this correlation was not significant (P¼ 0.07,n¼ 26, Figure 3c). SMN protein levels did not correlate with motorperformance (PZ0.31, data not shown) or with SMN2-fl levels(R¼ 0.23, P¼ 0.18, n¼ 43, Figure 4a); however protein levels didcorrelate with the SMN2-fl/SMN2-delta7 ratio (R¼ 0.40, P¼ 0.016,n¼ 43, Figure 4b).
DISCUSSION
Several potential therapeutic approaches to SMA are undergoingdevelopment or have been tested in recent years.36 Reliable clinicaloutcome measures and biomarkers are essential to effectively evaluatethese approaches. Different motor function measures have been usedand validated in SMA patients,23,26 but some of them are too long toadminister, include tasks unbearable for adult patients, or may beused only for patients with moderate phenotypes due to floor orceiling effects. Moreover, some complications related to the disease,such as scoliosis, retractions, and weight gain, can further impairmotor function. Thus, the identification of reliable biomarkers assurrogate endpoints of disease progression and response to treatmenthas become a matter of urgency.23 The aim of our study was toevaluate the applicability of SMN transcript and protein levels, assurrogate outcome measures in adult type III SMA patients, byrelating clinical and molecular data. The clinical variables chosen havebeen previously validated or used in other SMA studies.23 Themolecular techniques we used (absolute real time for transcriptanalysis, ELISA for protein quantification) are currently consideredthe most suitable tools for SMN quantification, as they do not makeuse of normalization against endogenous controls and are therefore
unaffected by possible variations in the expression levels ofhousekeeping genes.
We found that clinical measures correlated strongly with eachother, as expected. Similarly, Glanzman et al37 recently found thatmodified Hammersmith scale score correlated strongly withmyometry-measured muscle strength. The motor performance wassignificantly affected by disease duration but not by age at evaluation,suggesting that in the design of clinical trials this variable could beuseful to enroll more homogenous cohorts of patients, rather thanage.
Montes et al28 recently evaluated the 6MWT in type III SMApatients spanning a wide age range and found that they showedprogressive motor fatigue. We observed similar fatigability in thepresent series, so it may be also worth investigating whether increasedresistance to motor fatigue can be used as a marker of treatmentefficacy.
In the present study, we found no correlation between motorperformance and SMN2 copy number. However, similar to our ownprevious data11 and those of others,10,12,37 a higher number of SMN2genes was found in type IIIb patients, but was not predictive of theclinical phenotype in individual subjects. In the patient bearing theS262I mutation in exon 6, we found a single SMN2 copy, suggestingthat this point mutation determines only a mild reduction in SMNprotein function. This hypothesis is supported by the previous reportof the same mutation in another patient,35 affected by SMA type III aswell; however, in that patient, SMN2 gene copy number was notassessed. Also, the frequency of the G287R variant in our cohort wasmuch higher than previously reported (about 9% vs 1%38). Thisvariant has a positive effect in the inclusion of exon 7 in SMN2transcripts.32,38 All our patients bearing the G287R variant were typeIIIb subjects, thus raising the prevalence of the mutation in this groupof patients up to 16% (4/25 individuals). Because of the positive effectof this variant in exon 7 inclusion in SMN2 transcripts, this finding isnot unexpected. It is noteworthy that these four subjects had three
Figure 2 Scatter plots showing associations between time from diagnosis and (a) total MRC score (n¼45, R¼ �0.57, Po0.00001) and (b) NSAA score
(n¼26, R¼ �0.48, P¼0.01); associations between lean body mass/height and (c) total MRC (n¼20, R¼0.66, P¼0.0015), and (d) NSAA (n¼11,
R¼0.71, P¼0.006). Straight line, expected distribution; flanking lines, 95% confidence limits; black lines: limits of distribution. (a) and (c) refers to the
whole cohort, whereas (b) and (d) to ambulant patients only.
Adult SMA biomarker studyFD Tiziano et al
4
European Journal of Human Genetics
SMN2 copies, supporting the positive modulating effect of the G287Rvariant on SMA severity.
We also found a weak correlation between motor performance andSMN2-fl transcript levels, when considering all patients, which wasmuch stronger in ambulant patients. It is likely that in non-ambulantpatients, the presence of long-term complications of the conditionfurther worsened motor performance. An alternative hypothesis isthat SMN2-fl levels in blood do not reflect those found in targettissues of the disease, such as spinal cord and/or skeletal muscle.
However, in our opinion, this hypothesis is less likely, as thecorrelation of transcript levels with motor function is stronger inthe less severely affected patients. As no other transcript assessed(SMN2-del7, total SMN2 transcripts, or SMN2-fl/ del7 ratio)correlated with any baseline clinical characteristic, even in ambulantpatients, SMN2-fl appears to have the strongest relation to phenotype.Very recently, some of us (FDT and LR) have collaborated to theBforSMA study.39,40 Also in that large cohort of young patientsspanning the whole phenotypic spectrum of the disease, SMN2-fllevels were significantly higher in the less severely affected subjects,although they were not predictive of the motor performance of singleindividuals. We found similar results also in our previous study.33 Themain difference with the cohort included in the present study isrelated to the long duration of the disease of our patients and to theassociated complications, which may impair the clinical evaluation.Moreover, to our knowledge, longitudinal data regarding SMN levelvariations with age are not available.
We also found that SMN protein levels were unrelated to baselineclinical characteristics and SMN mRNA levels, except for a weakcorrelation with the SMN2-fl/SMN-del7 ratio, whose biologicalsignificance remains unclear. Lack of correlation between SMNprotein levels and motor performance was also found in the studyof Crawford et al39 and remains unexplained. It is possible that SMNprotein levels do not reflect those found in target tissues of thedisease, or that the ELISA method we used requires optimization. It is
Figure 3 Scatter plots showing associations of SMN2-fl transcript levels in
ambulant patients with (a) total MRC score (n¼26, R¼0.46, P¼0.02),
(b) lower limb MRC score (n¼26, R¼0.49, P¼0.01), and (c) 6-min walk
test (n¼26, R¼0.37, P¼0.07). Straight line: expected distribution;
flanking lines: 95% confidence limits; black lines: limits of distribution.
Figure 4 Scatter plots showing associations of levels of SMN protein in
peripheral blood with (a) SMN2-fl transcript levels (n¼43, R¼0.23,
P¼0.18), and (b) the SMN2-fl/SMN2-delta7 ratio (n¼43, R¼0.40,
confidence limits; black lines: limits of distribution.
Adult SMA biomarker studyFD Tiziano et al
5
European Journal of Human Genetics
noteworthy that stabilization buffers are not available for proteinsamples. On the other hand, for RNA extraction, these buffers allowto preserve samples for relatively long time and provide a ‘snapshot’of gene expression at the time of sampling. As time between bloodsampling and protein extraction (in the context of a multicenterclinical trial) varied considerably, levels of SMN protein could beaffected by different variables, such as cell death, sample preservation,higher extractability of SMN protein over time, or post-translationalmodifications. Indeed, putative loss or increase in SMN protein levelshypothetically related to the factors above cannot be ruled out.
Our finding of strong correlations between several aspects of motorperformance and lean body mass is potentially important andsuggests that lean body mass, as measured by DXA, might be worthfurther investigation as an outcome measure in clinical trials onpotential therapeutic agents in SMA. On the other side, DXA is noteasily feasible in patients with severe contractures, the longitudinalvariation of lean body mass in relation to age and disease course is atpresent unavailable, and the time required to observe a lean bodymass increase in response to a potentially effective intervention is alsounknown.
To conclude, the results of our study suggest that, in adults withtype III SMA, SMN2 copy number, SMN2-del7 transcripts, and SMNprotein levels in blood cells are not suitable as markers of phenotypicseverity and hence as indicators of response to treatment. SMN2-fltranscript levels appear potentially more useful, as they correlatesatisfactorily with motor performance in ambulant patients. Impor-tantly we found that lean body mass shows promise as marker ofdisease severity and possibly also response to treatment. Thesefindings require verification in larger series patients, of wider rangeof disease severity and age range (including children). Finally, ourdata suggest that if not taken into account, the confounding effect ofdisease duration may impair the identification of potential SMAbiomarkers.
CONFLICT OF INTEREST
The authors declare no conflict of interest.
ACKNOWLEDGEMENTSThe present study is dedicated to the memory of Christina Brahe. We are
grateful to the SMA Foundation for kindly providing SMN ELISA kits, and to
Dr Dione Kobayashi, Professor Eugenio Mercuri, and Dr Enrico Bertini for
critical comments on the manuscript. We are extremely grateful to the patients
and their families. The study was funded by the Agenzia Italiana del Farmaco
(AIFA). Carla Angelozzi has been granted by ASAMSI.
DISCLAIMERFDT and LM had full access to all study data and take responsibility for the
integrity of the data and the accuracy of the analyses.
1 Pearn J: Classification of spinal muscular atrophies. Lancet 1980; 1: 919–922.2 Munsat TL, Davies KE: International SMA consortium meeting (26–28 June 1992,
Bonn, Germany). Neuromuscul Disord 1992; 2: 423–428.3 Zerres K, Rudnik-Schoneborn S, Forrest E et al: A collaborative study on the natural
history of childhood and juvenile onset proximal spinal muscular atrophy (type II andIII SMA): 569 patients. J Neurol Sci 1997; 146: 67–72.
4 Lefebvre S, Burglen L, Reboullet S et al: Identification and characterization of a spinalmuscular atrophy-determining gene. Cell 1995; 80: 155–165.
5 Wirth B: An update of the mutation spectrum of the survival motor neuron gene(SMN1) in autosomal recessive spinal muscular atrophy (SMA). Hum Mut 2000; 15:228–237.
6 Frugier T, Tiziano FD, Cifuentes-Diaz C et al: Nuclear targeting defect of SMN lackingthe C-terminus in a mouse model of spinal muscular atrophy. Hum Mol Genet 2000; 9:849–858.
7 Lefebvre S, Burlet P, Liu Q et al: Correlation between severity and SMN protein level inspinal muscular atrophy. Nat Genet 1997; 16: 265–269.
8 Coovert DD, Le TT, McAndrew PE et al: The survival motor neuron protein in spinal
muscular atrophy. Hum Mol Genet 1997; 6: 1205–1214.9 Patrizi AL, Tiziano F, Zappata S et al: SMN protein analysis in fibroblast, amniocyte,
and CVS cultures from spinal muscular atrophy patients and its relevance fordiagnosis. Eur J Hum Genet 1999; 7: 301–309.
10 Feldkotter M, Schwarzer V, Wirth R et al: Quantitative analysis of SMN1 and SMN2
based on real-time LightCycler PCR: fast and highly reliable carrier testingand prediction of severity of spinal muscular atrophy. Am J Hum Genet 2002; 70:
358–368.11 Tiziano FD, Bertini E, Messina S et al: The Hammersmith functional score correlates
with the SMN2 copy number: a multicentric study. Neuromuscul Disord 2007; 17:
400–403.12 Wirth B, Brichta L, Schrank B et al: Mildly affected patients with spinal muscular
atrophy are partially protected by an increased SMN2 copy number. Hum Genet 2006;
119: 422–428.13 Brichta L, Hofmann Y, Hahnen E et al: Valproic acid increases the SMN2 protein level:
a well-known drug as a potential therapy for spinal muscular atrophy. Hum Mol Genet
in vitro: relevance for treatment of spinal muscular atrophy. Eur J Hum Genet 2004;
12: 59–65.15 Brahe C, Vitali T, Tiziano FD et al: Phenylbutyrate increases SMN gene expression in
spinal muscular atrophy patients. Eur J Hum Genet 2005; 13: 256–259.16 Jarecki J, Chen X, Bernardino A et al: Diverse small-molecule modulators of SMN
expression found by high-throughput compound screening: early leads towards a
therapeutic for spinal muscular atrophy. Hum Mol Genet 2005; 14: 2003–2018.17 Angelozzi C, Borgo F, Tiziano FD et al: Salbutamol increases SMN mRNA and protein
levels in spinal muscular atrophy cells. J Med Genet 2008; 45: 29–31.18 Pane M, Staccioli S, Messina S et al: Daily salbutamol in young patients with SMA
type II. Neuromuscul Disord 2008; 18: 536–540.19 Mercuri E, Bertini E, Messina S et al: Randomized, double-blind, placebo-controlled
trial of phenylbutyrate in spinal muscular atrophy. Neurology 2007; 68: 51–55.20 Tiziano FD, Lomastro R, Pinto AM et al: Salbutamol increases SMN transcript levels in
leukocytes of spinal muscular atrophy patients: relevance for clinical trial design.J Med Genet 2010; 47: 856–858.
21 Hua Y, Sahashi K, Hung G et al: Antisense correction of SMN2 splicing in theCNS rescues necrosis in a type III SMA mouse model. Genes Dev 2010; 24:
1634–1644.22 Singh NN, Shishimorova M, Cao LC et al: A short antisense oligonucleotide masking a
unique intronic motif prevents skipping of a critical exon in spinal muscular atrophy.
RNA Biol 2009; 6: 341–350.23 Kaufmann P, Muntoni F: Issues in SMA clinical trial design. The International
Coordinating Committee (ICC) for SMA Subcommittee on SMA Clinical Trial Design.
Neuromuscul Disord 2007; 17: 499–505.24 Florence JM, Pandya S, King WM et al: Intrarater reliability of manual muscle test
(Medical Research Council scale) grades in Duchenne’s muscular dystrophy. Phys Ther
1992; 72: 115–122.25 Merlini L, Mazzone ES, Solari A et al: Reliability of hand-held dynamometry in spinal
muscular atrophy. Muscle Nerve 2002; 26: 64–70.26 Mercuri E, Mayhew A, Muntoni F et al: Towards harmonisation of outcome measures
for DMD and SMA within TREAT-NMD; Report of three expert workshops: TREAT-NMD/
ENMC workshop on outcome measures, 12th–13th May 2007, Naarden, The Nether-lands; TREAT-NMD workshop on outcome measures in experimental trials for DMD,
30th June–1st July 2007, Naarden, The Netherlands; Conjoint Institute of Myology
TREAT-NMD Meeting on physical activity monitoring in neuromuscular disorders, 11thJuly 2007, Paris, France. Neuromuscul Disord 2008; 18: 894–903.
27 Takeuchi Y, Katsuno M, Banno H et al: Walking capacity evaluated by the 6-minute
walk test in spinal and bulbar muscular atrophy. Muscle Nerve 2008; 38: 964–971.28 Montes J, McDermott MP, Martens WB et al: Muscle Study Group and the Pediatric
Neuromuscular Clinical Research Network. Six-Minute Walk Test demonstrates motorfatigue in spinal muscular atrophy. Neurology 2010; 74: 833–838.
29 Khatri IA, Chaudhry US, Seikaly MG et al: Low bone mineral density in spinal muscular
atrophy. J Clin Neuromuscul Dis 2008; 10: 11–17.30 Kinali M, Banks LM, Mercuri E et al: Bone mineral density in a paediatric spinal
muscular atrophy population. Neuropediatrics 2004; 35: 325–328.31 van der Steege G, Grootscholten PM, van der Vlies P et al: PCR-based DNA test
to confirm clinical diagnosis of autosomal recessive spinal muscular atrophy. Lancet
1995; 345: 985–986.32 Prior TW, Krainer AR, Hua Y et al: A positive modifier of spinal muscular atrophy in the
SMN2 gene. Am J Hum Genet 2009; 85: 408–413.33 Tiziano FD, Pinto AM, Fiori S et al: SMN transcript levels in leukocytes of SMA
patients determined by absolute real time PCR. Eur J Hum Genet 2010; 18: 52–58.34 Sossi V, Giuli A, Vitali T et al: Premature termination mutations in exon 3 of the
SMN1 gene are associated with exon skipping and a relatively mild SMA phenotype.
Eur J Hum Genet 2001; 9: 113–120.35 Hahnen E, Schonling J, Raschke H et al: Missense mutations in exon 6 of the survival
motor neuron gene in patients with spinal muscular atrophy. Hum Mol Genet 1997; 6:
37 Glanzman AM, O’Hagen JM, McDermott MP et al: Pediatric Neuromuscular ClinicalResearch Network for Spinal Muscular Atrophy (PNCR); Muscle Study Group (MSG).Validation of the Expanded Hammersmith Functional Motor Scale in Spinal MuscularAtrophy Type II and III. J Child Neurol 2011; 26: 1499–1507.
38 Vezain M, Saugier-Veber P, Goina E et al: A rare SMN2 variant in a previouslyunrecognized composite splicing regulatory element induces exon 7 inclusion andreduces the clinical severity of spinal muscular atrophy. Hum Mutat 2010; 31:E1110–E1125.
39 Finkel RS, Crawford TO, Swoboda KJ et al: Pilot Study of Biomarkers for SpinalMuscular Atrophy Trial Group. Candidate proteins, metabolites and transcripts in theBiomarkers for Spinal Muscular Atrophy (BforSMA) clinical study. PLoS One 2012; 7:e35462.
40 Crawford TO, Paushkin SV, Kobayashi DT et al: Pilot Study of Biomarkers for SpinalMuscular Atrophy Trial Group. Evaluation of SMN protein, transcript, and copy numberin the biomarkers for spinal muscular atrophy (BforSMA) clinical study. PLoS One2012; 7: e33572.
Supplementary Information accompanies the paper on European Journal of Human Genetics website (http://www.nature.com/ejhg)