+ All Categories
Home > Health & Medicine > Clinical data analytics

Clinical data analytics

Date post: 18-Jan-2017
Category:
Upload: sb-bhattacharyya
View: 219 times
Download: 0 times
Share this document with a friend
40
CLINICAL DATA ANALYTICS Dr SB Bhattacharyya MBBS, MBA, FCGP Member, IMA Standing Committee on IT, IMA Hqrs Member, EHR Standards Committee, MoH&FW, GoI Hony. State Secretary (2015), IMA Haryana President (2010 – 2011), IAMI
Transcript

CLINICAL DATA ANALYTICS

Dr SB Bhattacharyya

MBBS, MBA, FCGP

Member, IMA Standing Committee on IT, IMA Hqrs

Member, EHR Standards Committee, MoH&FW, GoI

Hony. State Secretary (2015), IMA Haryana

President (2010 – 2011), IAMI

“If you can measure that of which you speak and can

express it by a number, you know something of your

subject; but when you cannot measure it, when you

cannot express it in numbers, your knowledge is meagre

and unsatisfactory.”Lord Kelvin

Dr SB Bhattacharyya© 2

“You can only manage what you can

measure.”Peter Drucker

Dr SB Bhattacharyya© 3

“If it were not for the great variability among individuals, medicine might as well be a science and not an art”

“The good physician treats the disease; the great physician treats the patient who has the disease.”

Sir William Osler, 1892

Dr SB Bhattacharyya© 4

Patient with Acute Fever (Europe)

Diagnosis was fever

Treat with white benedicta (blessed thistle) taken on empty stomach while reciting Pater Noster and Ave Maria three times

Dr SB Bhattacharyya© 5

In the 13th Century…

Patient with Acute Fever (Europe)

Dr SB Bhattacharyya© 6

In the 19th Century…

• Diagnosis was pneumonia by using the newly invented stethoscope

• Treat by blood letting, restricted diet and blistering induced by dried,

pulverized Spanish fly

Patient with Acute Fever (Europe)

In the 20th Century

• Diagnosis is pneumonia using CXR PA View

• Treat with antibiotics (penicillin) administration

• Lumbar Puncture if signs of meningitis is present or develops

Dr SB Bhattacharyya© 7

Nelson’s Data to Wisdom

Dr SB Bhattacharyya© 8

Com

ple

xit

y

Interactions & Inter-relationships

Hertfordshire Records :: DOHAD

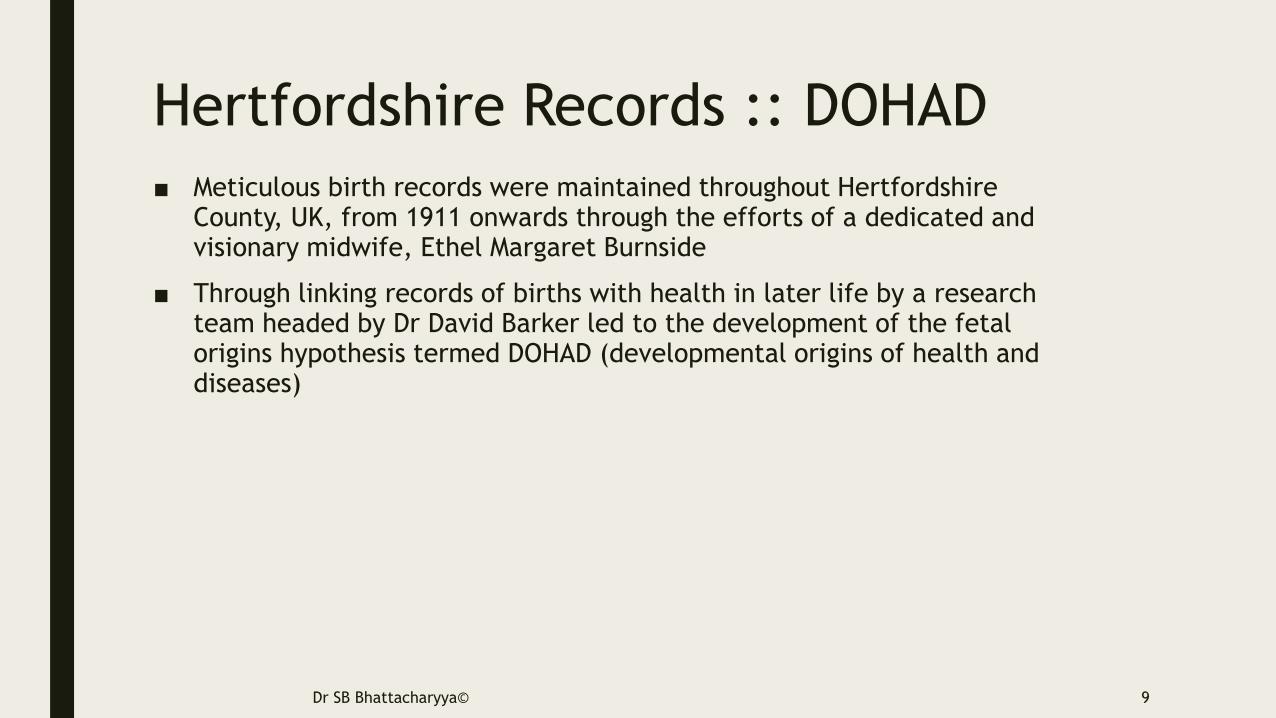
■ Meticulous birth records were maintained throughout Hertfordshire County, UK, from 1911 onwards through the efforts of a dedicated and visionary midwife, Ethel Margaret Burnside

■ Through linking records of births with health in later life by a research team headed by Dr David Barker led to the development of the fetal origins hypothesis termed DOHAD (developmental origins of health and diseases)

Dr SB Bhattacharyya© 9

Clinical Science is Empirical

■ The word empirical denotes information gained by means of observation, experience, or experiment.

■ Empirical data is data that is produced by an experiment or observation.

■ As opposed to theoretical that depends on hypotheses

Dr SB Bhattacharyya© 10

Medical Records Data Volume & Costs

■ On an average, around 80 MB of data (4 MB text & 76 MB imaging) per patient per year is generated

■ Storage costs < US$ 2.00 per patient for 7 years

– Dr John Halamka, MD, MSCIO, Beth Israel Deaconess Medical Center

Dr SB Bhattacharyya© 11

“Statistics are like bikinis. What they reveal is suggestive but what they conceal is vital”

- Aaron Levenstein

Dr SB Bhattacharyya© 12

Statistical Significance ≠ Clinical Significance

Dr SB Bhattacharyya© 13

Nota Bene

■ Statistics is confusing unless one understands the numbers and what they actually mean making them open to misinterpretation

■ There is always a chance of over-analysis leading to analysis paralysis

■ It is important to ask the right questions and re-frame them intelligently

Dr SB Bhattacharyya© 14

Nota Bene

■ Running the analytics is all science – mostly mathematics

■ Interpreting the results is all art derived from knowledge and wisdom

■ It is possible to predict with a reasonable degree of accuracy (~95%) the most likely outcome under a given set of circumstances

Dr SB Bhattacharyya© 15

Nota Bene

■ One must continuously strive to avoid overfitting

■ Likelihood ratio is the best indicator, while p-Value is the worst

■ Hindsight is 6/6 vision, foresight is 0/0

Dr SB Bhattacharyya© 16

Clinical data is…

■ Highly multivariate with many important predictors and response variables

■ Temporally correlated (longitudinal, survival studies)

■ Costly and difficult to obtain

■ Historical in nature

Dr SB Bhattacharyya© 17

Few Indices

■ Sensitivity

■ Specificity

■ Likelihood Ratio (+/-)

■ Predictive Value (+/-)

■ Prevalence

■ Pre-test/Post-test Odds

■ Post-test Probability (+/-)

■ Kaplan-Meier Survival Curves / Cox’s Hazard Ratio

■ Relative Risk

■ Relative Risk Reduction

■ Absolute Risk Reduction

■ Odds Ratio

■ Numbers Needed to Treat (or Harm)

■ Quality of Life Year Adjusted

■ Receiver Operator Characteristic (ROC) Curve

■ Total Cost of Treatment

Dr SB Bhattacharyya© 18

Outcomes

■ Patient better, same or worse

■ Cost less, same or more

■ Needs lesser time, same time, longer time to recover/for relief

■ Needs lesser time, same time, longer time to cure

■ Cure vs. Recover/Relief

Dr SB Bhattacharyya© 19

5 C’s of Analytics

■ Curiosity – figure out what one wishes to figure out

■ Capture – the data

■ Cure – clean and transform the data

■ Crunch – run the chosen analytical model

■ Create – reports and graphs

Dr SB Bhattacharyya© 20

Steps of Performing Analytics

1. Construct query

2. Data acquisition (70 – 80% of effort)

1. Data pre-processing and visualisation

2. ETL

3. Algorithm modelling

4. Run model

5. Study results

6. Repeat from step # 3 above till the most appropriate answer is derived –occasionally the data may have to be re-processed, which most analytical tools are capable of performing

Dr SB Bhattacharyya© 21

The Process of Analytics

■ Several alternative models may need to be run before the “right” model is discovered.

■ With experience, the number of alternative models required to be studied before finding the “right” one will diminish.

Dr SB Bhattacharyya© 22

Schematic Process

Dr SB Bhattacharyya© 23

EHRClinical

Analytics

Analytic

Reports

Analytic

Reports

Data Analytic Reports

■ Data Management: ETL

– Acquire Data

– Clean Data

– Prepare Data (incl. anonymisation)

■ Query Preparation

– Formulate Null Hypothesis

– Determine Data Requirements

■ Analytics Management

– Prepare Analysis

– Run Analysis

– Review Results

– Review Analytical Steps

■ Repeat Cycle

– Analytics Management Onwards

– Query Management Onwards

– Data Management Onwards

Dr SB Bhattacharyya© 24

Dr SB Bhattacharyya© 25

Sensitivity

Proportion of truly diseased persons in the screened population who are identified as diseased by the screening test (i.e. they have high scores).

Sensitivity indicates the probability that the test will correctly diagnose a case, or the probability that any given case will be identified by the test.

Does positive really mean positive?

That is, confidence level of a positive finding.

To help you remember the term, being sensitive implies being able to react to something.

Dr SB Bhattacharyya© 26

Specificity

Proportion of persons without the disease who have low scores on the screening test: the probability that the test will correctly identify a non-diseased person.

Does negative really mean negative?

That is, confidence level of a negative finding.

To help you remember the term, a specific test is one that picks up only the disease in question,

so it has a narrow focus, which explains the term 'specific'.

Dr SB Bhattacharyya© 27

Likelihood Ratio

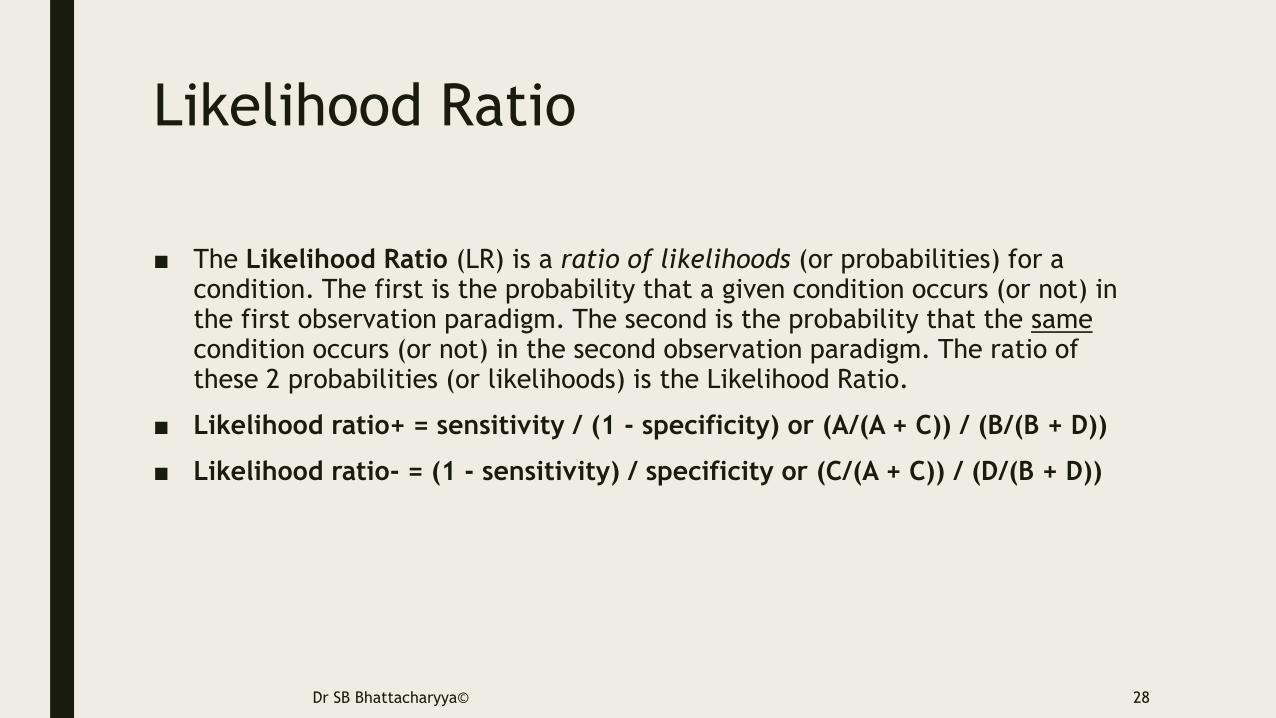
■ The Likelihood Ratio (LR) is a ratio of likelihoods (or probabilities) for a condition. The first is the probability that a given condition occurs (or not) in the first observation paradigm. The second is the probability that the samecondition occurs (or not) in the second observation paradigm. The ratio of these 2 probabilities (or likelihoods) is the Likelihood Ratio.

■ Likelihood ratio+ = sensitivity / (1 - specificity) or (A/(A + C)) / (B/(B + D))

■ Likelihood ratio- = (1 - sensitivity) / specificity or (C/(A + C)) / (D/(B + D))

Dr SB Bhattacharyya© 28

Likelihood Ratio

■ Thus, LR is a way to incorporate the sensitivity and specificity of a test into a single measure. Since sensitivity and specificity are fixed characteristics of the test itself within the clinical sciences paradigm, the likelihood ratio is independent of the prevalence in the population.

■ The LR basically measures the power of a test to change the pre-test into the post-test probability of a particular outcome happening.

Dr SB Bhattacharyya© 29

LR Value Interpretation

LRs greater than 10 or less than 0.1 (LR > 10 or LR

< 0.1)

causes large

changes

LRs 5 - 10 or 0.1 - 0.2 (LR > 5 & < 10 or LR > 0.1 &

< 0.2)

causes moderate

changes

LRs 2 - 5 or 0.2 - 0.5 (LR > 2 & < 5 or LR > 0.2 & <

0.5)

causes small

changes

LRs less than 2 or greater than 0.5 (LR < 2 or LR >

0.5)causes tiny changes

LRs equal to 1 (LR = 1)causes no change at

all

Dr SB Bhattacharyya© 30

Dr SB Bhattacharyya© 31

Big Data in Healthcare

■ High Volume

– Data from all sorts of sources in electronic format

■ High Velocity

– Data from devices, monitors and variety of systems continuously streaming in 24x7

■ High Variety

– Data is in almost all types

■ High Veracity

– Data sources are dependable as they are mostly known

Dr SB Bhattacharyya© 32

Big Data in Healthcare

■ Sources of data

– Wi-Fi/Bluetooth/NCF-enabled personal healthcare monitoring devices

– Smartphones/smart devices (iPod, iPad, etc.)

– Radio-diagnostic imaging devices

– Electronic medical records/health records

– Social media

Dr SB Bhattacharyya© 33

Big Data in Healthcare

■ Data Types

– Textual: EHR and clinical and nursing informatics systems

– Numeric: lab systems and devices

– Coded: EHR and devices

– Audio: EHR and lab systems

– Image: EHR and radio-diagnostic systems

– Video: EHR and radio-diagnostic systems

– Waveform: devices and monitors

– Streamed binary data: wearables, bio-sensors, monitors

Dr SB Bhattacharyya© 34

Types of Data Analysis

■ Prediction

– Classification

– Regression

– Latent Knowledge Estimation

■ Structure Discovery

– Clustering

– Factor Analysis

– Domain Structure Discovery

– Network Analysis

■ Relationship mining

– Association rule mining

– Correlation mining

– Sequential pattern mining

– Causal data mining

■ Distillation of data for human judgment

■ Discovery with models

Dr SB Bhattacharyya© 35

Dr SB Bhattacharyya© : Images are copyrighted by the respective vendors 36

Machine Learning Techniques Used

Dr SB Bhattacharyya© 37

Algorithm Application Areas

Linear Regression Cost predictions

Logistic Regression Likely outcomes (treatment/intervention)

Neural Networks Likely outcomes (treatment/intervention)

Support Vector Machines In place of linear / logistic regression

Classification (Decision Tree,

OneR) and Clustering (K-Means,

Cobweb)

Finding groups (clusters) of similar

observations like clinical outcomes

Principal Component Analysis Data and image compression

Anomaly Detection (Signal

Detection)

Any significant observation (signal)

amongst a ton of observations (noise)

Recommender Systems

(Collaborative Filtering & Market

Basket Analysis)

Drug & treatment suggestions based on

care provider/patient/peer preferences -

personalised medicine

Predictive Analytics

■ Data pre-processing and visualisation

■ Attribute selection

■ Classification (OneR, Decision trees)

■ Prediction (Nearest neighbour)

■ Clustering (K-means, Cobweb)

■ Association rules

Dr SB Bhattacharyya© 38

Application Areas

■ Operational

– Administrative

– Clinical

– Nursing

■ Predictive

– Clinical decision support

– Outcomes (prognostics) assessment

– Readmission prevention

– Adverse event avoidance

– Disease management

– Patient matching

– Personalised medicine

Dr SB Bhattacharyya© 39

THANKS!

Dr SB Bhattacharyya© 40


Recommended