Clinical StudyThermographic Patterns of the Upper and Lower Limbs:Baseline Data
Alfred Gatt,1,2 Cynthia Formosa,1,2 Kevin Cassar,3 Kenneth P. Camilleri,4
Clifford De Raffaele,4 Anabelle Mizzi,1 Carl Azzopardi,4 Stephen Mizzi,1 Owen Falzon,4
Stefania Cristina,4 and Nachiappan Chockalingam1,2
1Faculty of Health Sciences, University of Malta, Msida MSD 2080, Malta2Faculty of Health Sciences, Staffordshire University, Stoke-on-Trent ST4 2DF, UK3Faculty of Medicine and Surgery, University of Malta, Msida MSD 2080, Malta4Centre for Biomedical Cybernetics, University of Malta, Msida MSD 2080, Malta
Correspondence should be addressed to Alfred Gatt; [email protected]
Received 19 August 2014; Accepted 22 December 2014
Objectives. To collect normative baseline data and identify any significant differences between hand and foot thermographic dis-tribution patterns in a healthy adult population. Design. A single-centre, randomized, prospective study.Methods. Thermographicdata was acquired using a FLIR camera for the data acquisition of both plantar and dorsal aspects of the feet, volar aspects of thehands, and anterior aspects of the lower limbs under controlled climate conditions. Results. There is general symmetry in skintemperature between the same regions in contralateral limbs, in terms of both magnitude and pattern. There was also minimalintersubject temperature variation with a consistent temperature pattern in toes and fingers. The thumb is the warmest digit withthe temperature falling gradually between the 2nd and the 5th fingers. The big toe and the 5th toe are the warmest digits with the2nd to the 4th toes being cooler. Conclusion. Measurement of skin temperature of the limbs using a thermal camera is feasible andreproducible. Temperature patterns in fingers and toes are consistent with similar temperatures in contralateral limbs in healthysubjects. This study provides the basis for further research to assess the clinical usefulness of thermography in the diagnosis ofvascular insufficiency.
1. Introduction
Physiological processes produce heat. Since body tempera-ture is an indicator of normal or abnormal function, alteredbody temperature is a natural indicator of disease [1]. Severalstudies report that an increase >2.2∘C (4∘F) may requirefurther investigation [2]. The core temperature of the humanbody is normallymaintained at 37∘C.Changes in temperatureat the peripheries can occur as a result of environmentalchanges with the body’s response to this being peripheralvasoconstriction or vasodilatation to control core tempera-ture, together with other physiological mechanisms such assweating, to encourage or prevent heat loss.
This normal thermoregulatory responsemay be altered bycertain pathologies such as peripheral arterial disease whichcan cause changes in peripheral temperatures, resulting in
cooler extremities. Furthermore, in certain inflammatoryconditions, such as local infection and gout, the peripheraltemperature will increase as a result of local vasodilatationmediated by cytokines elicited by the inflammatory process.In autonomic neuropathy, these normal thermoregulatoryprocesses are impaired, resulting in altered peripheral tem-peratures due to impaired neurovascular function [3].
Areas of increased temperature in the foot are predictiveof the development of ulceration [4]. Presently, the commonclinical practice of temperature assessment involves manualpalpation of the foot. However, the temperature changesare typically too small to be reliably determined using thistechnique. This practice does not rely on quantitative andrepeatable methods and is unlikely to be reliable in assessingmultiple temperature readings in various parts of the foot. Areduction in peripheral perfusion to one or more lower limbs
Hindawi Publishing CorporationInternational Journal of Vascular MedicineVolume 2015, Article ID 831369, 9 pageshttp://dx.doi.org/10.1155/2015/831369
2 International Journal of Vascular Medicine
may lead to a subtle reduction in temperature compared toa normally perfused upper limb, which will not be detectablethrough manual palpation, as opposed to thermographictechniques which can detect temperature variation with amuch higher resolution. Using thermographic techniques,which are noninvasive, skin temperature may be measuredwithout direct contact, thus providing quantification of cuta-neous heat radiation [5].
Thermography is an imaging technique used to detectinfrared radiation emitted from the surface of an object. Sincethe radiated infrared energy emitted is related to the object’stemperature, with the use of thermography it is possible todetermine the temperature and temperature variations of thisobject of interest. The technology is widely employed for arange of applications within both commercial and industrialenvironments. In the medical field thermography has beenused in oncology, dentistry, urology, and dermatology [1].
In this work, the primary interest is in the applicationof thermography for the physiological imaging of peripheralcirculatory function of hands and feet and for its use as aclinical tool for the diagnosis and prognosis of peripheralvascular disease and neurological disorders [6]. A thermalimaging system makes it possible to obtain an accuratemeasure of skin temperature in a noncontactmanner throughcutaneous heat radiation. Every material has an associatedemissivity value which represents the material’s effectivenessin emitting thermal radiation. This value can range from0 to 1, where 1 refers to the emissivity of an ideal blackbody which radiates the highest amount of thermal energythat can be emitted at a specific temperature. Materialswith an emissivity close to 1 are particularly adequate forthermographic imaging because the radiated heat is closelyrelated to the actual surface temperature. With an emissivityvalue of approximately 0.98, human skin is thus particularlysuitable for temperature measurement using thermography[1, 5]. In fact the use of noncontact infrared thermography canprovide a more accurate reading than contact methods [7].The interested reader is referred to Lahiri et al. [1] and Ringet al. [8] for further literature which discusses the physicalconcepts behind thermographic imaging and a review of itsapplication to medical problems.
The use of thermography in the context of the highrisk foot has been reported in prevention strategies andin predicting skin breakdown, impending ulceration [4, 9],and predicting optimum level for amputation. Objectivemeasurement of skin temperature has been shown to predictamputation healing with an accuracy of 80 to 90% [10].Beyond these areas however the use of thermography islimited and has not been adoptedwidely in the clinical settingdespite early promise of its potential clinical application [11].
One of the main reasons for the limited use of ther-mography is the present prohibitive expense of high-endthermography equipment. However, beyond cost, use ofthermography in the context of the high risk foot, namely,the diabetic foot, has been problematic because of the lack ofaccurate reporting of thermographic findings both in healthysubjects and in diabetic patients. Thermographic data fromdiabetic feet has tended to be interpreted in isolation from
the rest of the body apart from some studies where data fromthe contralateral limb has been used.
Currently the ankle-brachial pressure index (ABPI) isone of the most common physiological tests for perfusion ofthe lower limbs. The patient’s own upper limbs serve as thedenominator in the ABPIs. This is necessary since the abso-lute systolic pressure is highly variable between individualsand in the same individual at different times of the day andin different circumstances. As a result isolated measurementof systolic pressure at the ankle would yield unreliable andhugely variable results from the same individual. Comparingthe ankle systolic pressure to the brachial pressure howevereliminates the problemof variability in absolute pressures andyields a reliable and cheap tool for assessment of perfusion.The same principle could prove useful if thermographicpatterns in the lower limbs are compared to those in theupper limbs which are relatively spared of arterial diseaseeven in the context of severe peripheral arterial disease.Before this is possible, however, it was necessary to investigatethermographic data and patterns in the upper limbs inhealthy controls. This was the basis for including assessmentof thermographic patterns in the upper limbs in this study.
The major advantage provided by the use of thermogra-phy over currently employed clinical vascular measurementtechniques of ABPIs, toe pressures and spectral waveforms,is that this technique involves no direct contact with theskin, thus reducing risks of infection, and it is relativelyquick. It also has the potential of assessing the effects of bothneuropathy and arteriopathy on the foot in one test.Themainadvantage would be in the completeness of the assessment.Current tools such as ABPIs only provide information aboutperfusion to the level of the ankle and are limited in the case ofdiabetes, chronic kidney disease, and old age where calcifiedarteries may yield artifactually elevated results, implyingunreliability of the ABPI test itself [12]. Toe brachial pressureindices are only taken from the big toe or occasionally thesecond toe and do not provide information about perfusionto the remaining part of the foot which may be very differentas newer concepts of angiosomes have shown.
Thermography has the potential of providing an assess-ment of the whole foot by looking at different parts of the footseparately and comparing them to the contralateral foot andmore proximal parts of the limb as well as the upper limb. Itis also repeatable and noninvasive allowing the tool to followpatients over time and assess the effects of intervention suchas surgical or endovascular revascularisation, as well as theeffect of antibiotic treatment in diabetic foot infections.
One of the disadvantages of infrared imaging is that it canprovide physiological information; however, it cannot defineaetiologies and local anatomy [13].
Although various studies [14–16] have attempted to quan-tify skin temperature as a measure of pathological vascularchanges in the diabetic foot, Sun et al. [17] report limitedusefulness of this technique because of poor measurementmethodology and procedures. On the other hand, variousauthors concluded that thermography could be regarded asan emergent potential diagnostic tool [18–20] that assessescirculatory status both in routine foot assessment and beforeand after vascular interventions.
International Journal of Vascular Medicine 3
Previous work, albeit limited, has been carried out toestablish some normative baselines in terms of temperaturemeasurements of different body areas using thermography[21–24]. These studies have assessed the mean temperaturesat different sites and, in certain cases, evaluated thermalsymmetry between contralateral sides of the same body parts.
In view of the paucity of evidence in this field, theobjectives of this research were to determine the normativeheat pattern distribution in feet and hands in a populationof healthy adults, to identify any possible differences inheat pattern distribution between both the contralateral andipsilateral feet and hands, from which a clinical protocolfor the acquisition of reliable thermographic and visual datafor the feet, legs, and palms of a recruited sample could bedeveloped.
2. Materials and Methods
Ethical approval was sought and granted by the University ofMalta Ethics Research Committee. All participants providedinformed consent to participate in this study. The reportedinvestigations were carried out in accordance with the Decla-ration of Helsinki as revised in 2000 [25].
This single-centre, randomized, prospective study wasconducted on 63 healthy adults without a history of sig-nificant medical, surgical, vascular, or neurological disease.Those with an ABPI <1 or >1.3 were excluded, since this isthe most widely used test for diagnosing peripheral arterialdisease (PAD) [12], having been reported as being 100%specific in identifying healthy individuals [26]. Participantswith a history of smoking or alcohol abusewere also excluded.All included participants demonstrated normal triphasicwaveforms as reported by a hand-held Doppler.
Demographic data was recorded for each participant,together with anthropometric measurements which includedweight and height. The testing modalities and examinationmethods were carried out by the same two clinicians withover 10 years of experience in the field to ensure uniformity.Testing was performed in the same examination room ata controlled mean temperature of 22.6∘C (SD 0.39) (at55%–60% relative humidity), which was monitored using acalibrated thermometer.
2.1. Testing Protocol. Measurement of ABPI was performedusing a portable hand-held Doppler and blood pressure cuffs.Additionally, quantitative pedal waveform analysis of thedorsalis pedis and posterior tibial artery was obtained fromall recruited subjects utilizing the continuous wave Doppler.These waveforms and the measurement of the resting ABPIwere obtained using the Huntleigh Dopplex Assist VascularPackage (Cardiff, UK) as the principal study tool. The 8MHzprobe was held steadily on the anatomical artery location atan angle between 45 and 60 degrees against the flowof arterialblood. Interpretation of arterial pressure waveforms resultswas based on standards from the literature [18]. Waveformswere classified as triphasic, biphasic, monophasic discontin-uous, andmonophasic continuous. Triphasicwaveformswereconsidered normal, whereas the biphasic and monophasicdiscontinuous and monophasic continuous waveforms were
interpreted as abnormal and indicative of PAD. As triphasicwaveforms were essential criteria for inclusion, participantswith other waveforms were excluded. Measurements werecarried out after a 5-minute rest in a supine position withthe upper body as flat as possible. Patients were also askedto undo all tight clothing around the waist and the arm.A blood pressure cuff was applied to the arm (to measurethe brachial systolic pressure) and the ankle (to measure thedorsalis pedis and posterior tibial pressures) to determine theankle pressure. The cuff was inflated to occlude the arterialpressure. The systolic pressure was obtained by listeningto and noting the pressure on the manometer. The highervalues of the brachial and the ankle pressures were used tocalculate the ABPI. Values were interpreted according to thecriteria proposed by the American Heart Association and theAmerican Diabetes Association [19].
All participants underwent a standard neurologicalexamination which included a 10-gram Semmes Weinsteinmonofilament test performed on both feet to ensure theabsence of peripheral sensory neuropathy [27]. The plantaraspect of the hallux and the 3rd digit, together with the 1st,3rd, and 5th metatarsal heads, were used for testing. With theeyes closed, the participant related to the investigatorwhetherhe or she could feel the monofilament. The ability to feel allthe 5 points tested was considered to be indicative of normalneural function and was a prerequisite for inclusion into thestudy.
For the purpose of data analysis, each foot was scoredseparately. All data was recorded on a spreadsheet designedinMicrosoftExcel to group together the information requiredfor interpretation of the results.
2.2.ThermographicDataAcquisition. Prior to thermographicdata acquisition, participants were allowed to acclimatize totheir ambient temperature for a period of 20 minutes, inconcordancewith standard recommendations followed in theliterature [1, 4, 18, 21]. During this period of time, clinicalexaminations took place, while the participants were alsomonitored using the thermography camera to confirm thatthe acclimatization process was taking place. Participantswere also asked to avoid using deodorants, antiperspirants, orother cosmetics that could affect the acquired thermographicpattern.
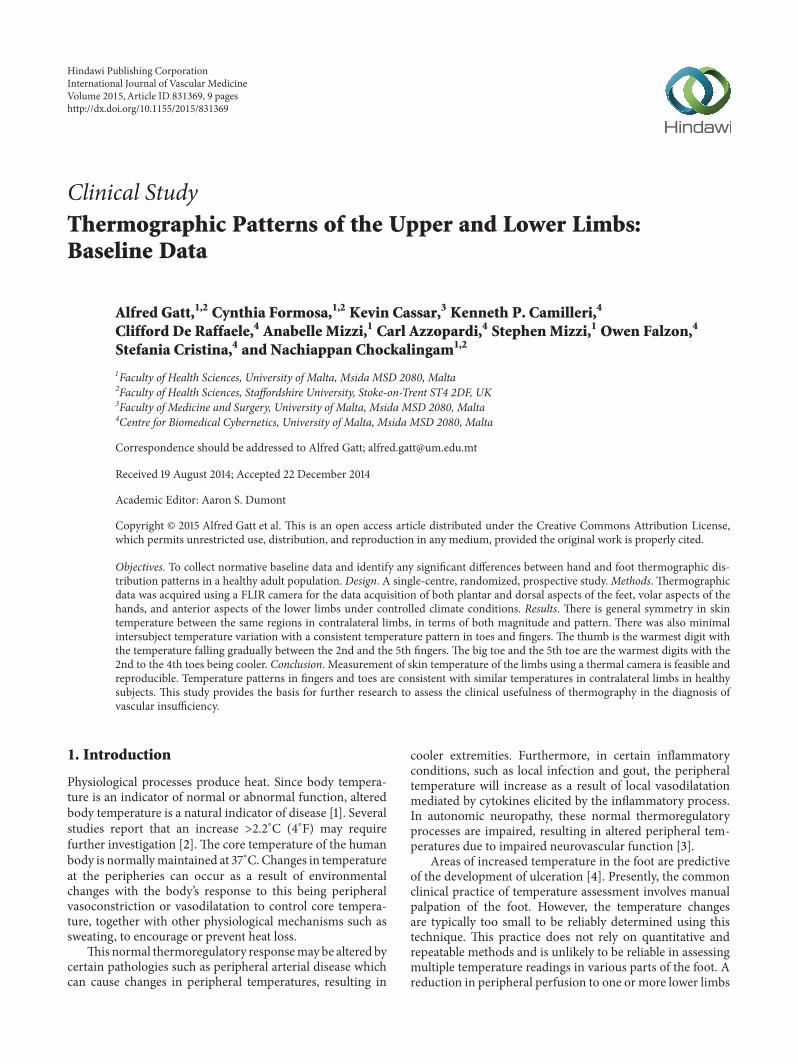
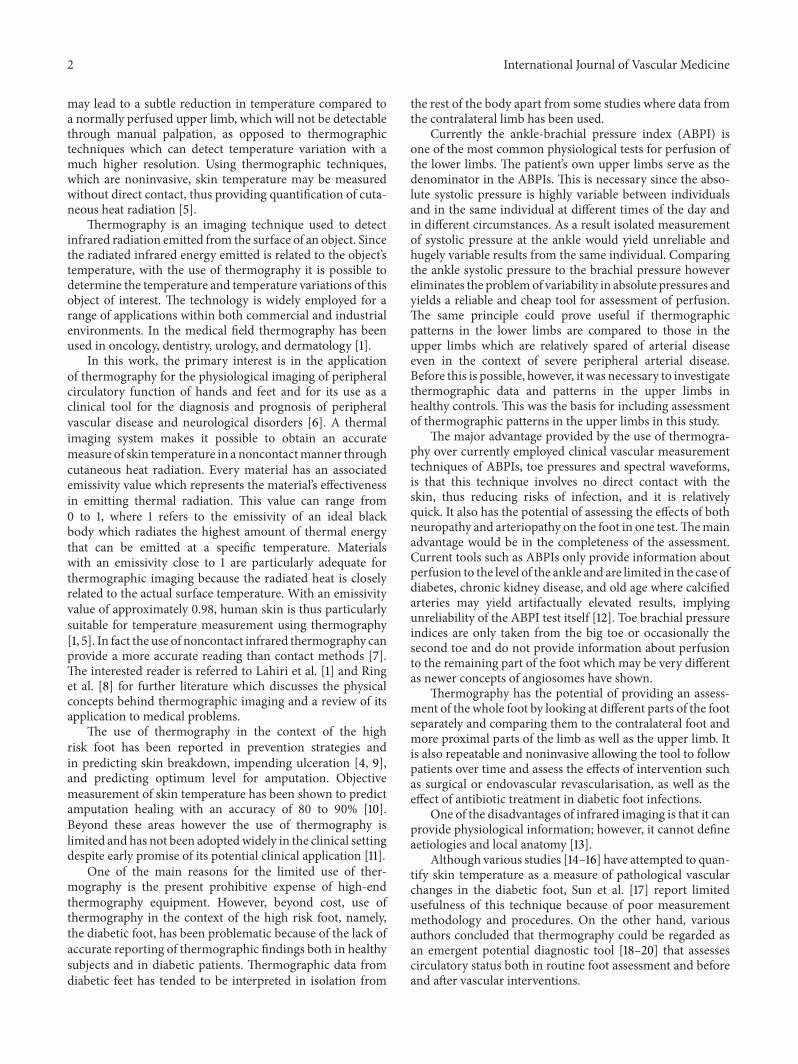
Following the said acclimatization period, images weretaken with participants lying down, barefoot, on a couchin the supine position. A thermal camera (FLIR Model SC7000; FLIR Systems, Inc., Oregon, USA) and a digital camera(CASIO Exilim) were mounted on separate tripods at adistance of 1.5 metres away from the end of the couch. Thecameras were kept as close to each other as possible in orderto retain a similar viewing angle. The thermal camera waskept perpendicular to the plane of acquisition, as shown inFigure 1. Literature states that during thermographic imagingangles of measurement of up to 20 degrees have a negligibleeffect on the acquired temperatures [28]. Participants wereinstructed to keep their feetmomentarily inslightdorsiflexionand pointing vertically upwards, while a thermal image and avisual image of the plantar aspect of the foot were taken withboth cameras, respectively, as shown in Figures 2(a) and 2(b).
4 International Journal of Vascular Medicine
Figure 1: A diagram showing data capture, with the participant lying supine while a thermographic image of the plantar surface was taken.The angle of measurement was kept approximately perpendicular to the plane of acquisition.
123
4
5
6 78
9
1011
14
15 16
1719
20
22
(a) (b)
Figure 2: Participants were asked to keep their feet momentarily in slight dorsiflexion and pointing vertically upwards, while a thermal image(a) and a visual image (b) were acquired. Measurement regions were then annotated on the thermal image (a) for further analysis.
1
2
3
4
5
6
(a) (b)
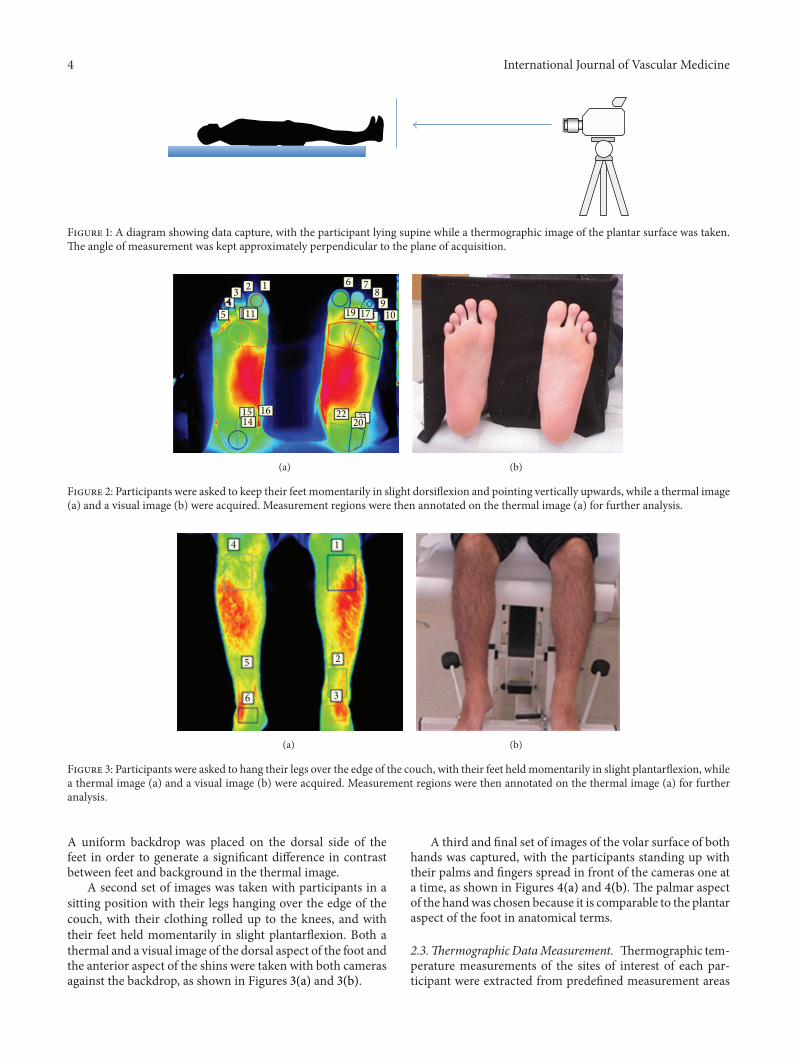
Figure 3: Participants were asked to hang their legs over the edge of the couch, with their feet heldmomentarily in slight plantarflexion, whilea thermal image (a) and a visual image (b) were acquired. Measurement regions were then annotated on the thermal image (a) for furtheranalysis.
A uniform backdrop was placed on the dorsal side of thefeet in order to generate a significant difference in contrastbetween feet and background in the thermal image.
A second set of images was taken with participants in asitting position with their legs hanging over the edge of thecouch, with their clothing rolled up to the knees, and withtheir feet held momentarily in slight plantarflexion. Both athermal and a visual image of the dorsal aspect of the foot andthe anterior aspect of the shins were taken with both camerasagainst the backdrop, as shown in Figures 3(a) and 3(b).
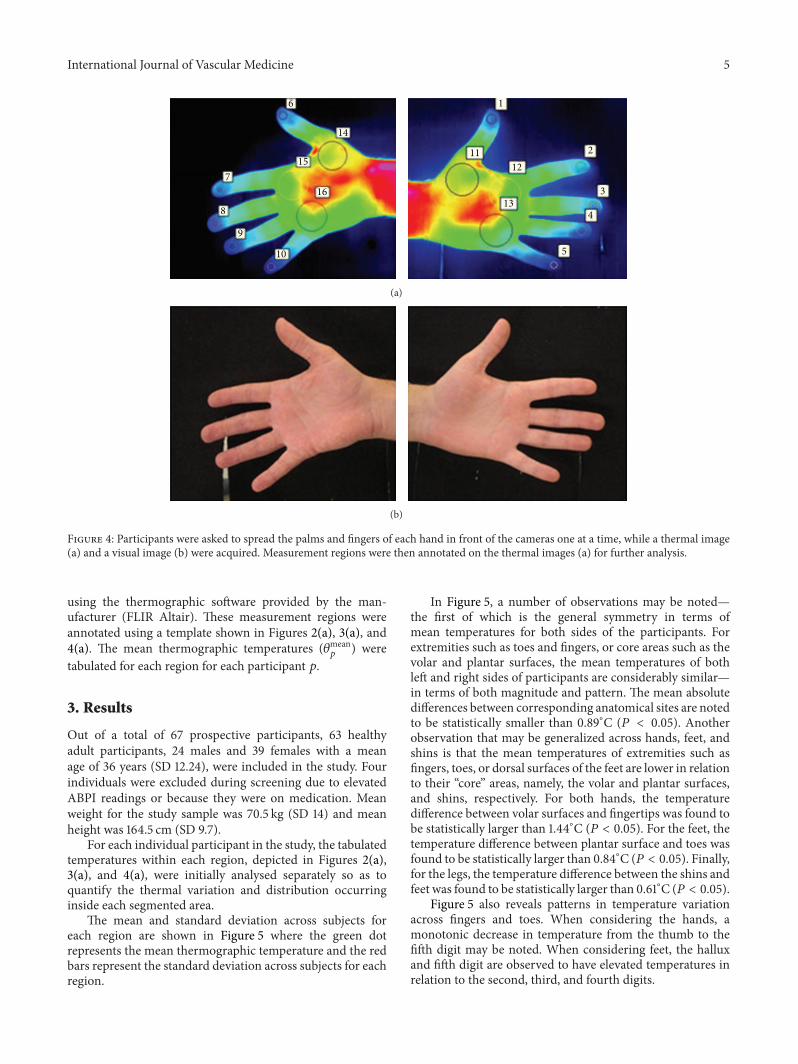
A third and final set of images of the volar surface of bothhands was captured, with the participants standing up withtheir palms and fingers spread in front of the cameras one ata time, as shown in Figures 4(a) and 4(b). The palmar aspectof the handwas chosen because it is comparable to the plantaraspect of the foot in anatomical terms.
2.3.Thermographic DataMeasurement. Thermographic tem-perature measurements of the sites of interest of each par-ticipant were extracted from predefined measurement areas
International Journal of Vascular Medicine 5
1
2
3
4
5
6
7
8
9
10
11
12
13
14
15
16
(a)
(b)
Figure 4: Participants were asked to spread the palms and fingers of each hand in front of the cameras one at a time, while a thermal image(a) and a visual image (b) were acquired. Measurement regions were then annotated on the thermal images (a) for further analysis.
using the thermographic software provided by the man-ufacturer (FLIR Altair). These measurement regions wereannotated using a template shown in Figures 2(a), 3(a), and4(a). The mean thermographic temperatures (𝜃mean
𝑝
) weretabulated for each region for each participant 𝑝.
3. Results
Out of a total of 67 prospective participants, 63 healthyadult participants, 24 males and 39 females with a meanage of 36 years (SD 12.24), were included in the study. Fourindividuals were excluded during screening due to elevatedABPI readings or because they were on medication. Meanweight for the study sample was 70.5 kg (SD 14) and meanheight was 164.5 cm (SD 9.7).
For each individual participant in the study, the tabulatedtemperatures within each region, depicted in Figures 2(a),3(a), and 4(a), were initially analysed separately so as toquantify the thermal variation and distribution occurringinside each segmented area.
The mean and standard deviation across subjects foreach region are shown in Figure 5 where the green dotrepresents the mean thermographic temperature and the redbars represent the standard deviation across subjects for eachregion.
In Figure 5, a number of observations may be noted—the first of which is the general symmetry in terms ofmean temperatures for both sides of the participants. Forextremities such as toes and fingers, or core areas such as thevolar and plantar surfaces, the mean temperatures of bothleft and right sides of participants are considerably similar—in terms of both magnitude and pattern. The mean absolutedifferences between corresponding anatomical sites are notedto be statistically smaller than 0.89∘C (𝑃 < 0.05). Anotherobservation that may be generalized across hands, feet, andshins is that the mean temperatures of extremities such asfingers, toes, or dorsal surfaces of the feet are lower in relationto their “core” areas, namely, the volar and plantar surfaces,and shins, respectively. For both hands, the temperaturedifference between volar surfaces and fingertips was found tobe statistically larger than 1.44∘C (𝑃 < 0.05). For the feet, thetemperature difference between plantar surface and toes wasfound to be statistically larger than 0.84∘C (𝑃 < 0.05). Finally,for the legs, the temperature difference between the shins andfeet was found to be statistically larger than 0.61∘C (𝑃 < 0.05).
Figure 5 also reveals patterns in temperature variationacross fingers and toes. When considering the hands, amonotonic decrease in temperature from the thumb to thefifth digit may be noted. When considering feet, the halluxand fifth digit are observed to have elevated temperatures inrelation to the second, third, and fourth digits.
6 International Journal of Vascular Medicine
32
31
30
29
28
27
26
25
24
23
22
21
20
19
0 5 10 15 20 25 30 35 40 45
Measured thermal segment
Aver
aged
tem
pera
ture
(∘C)
Figure 5: The mean thermographic temperature of each region (green dot) and the standard deviation across subjects for each region (redbars).
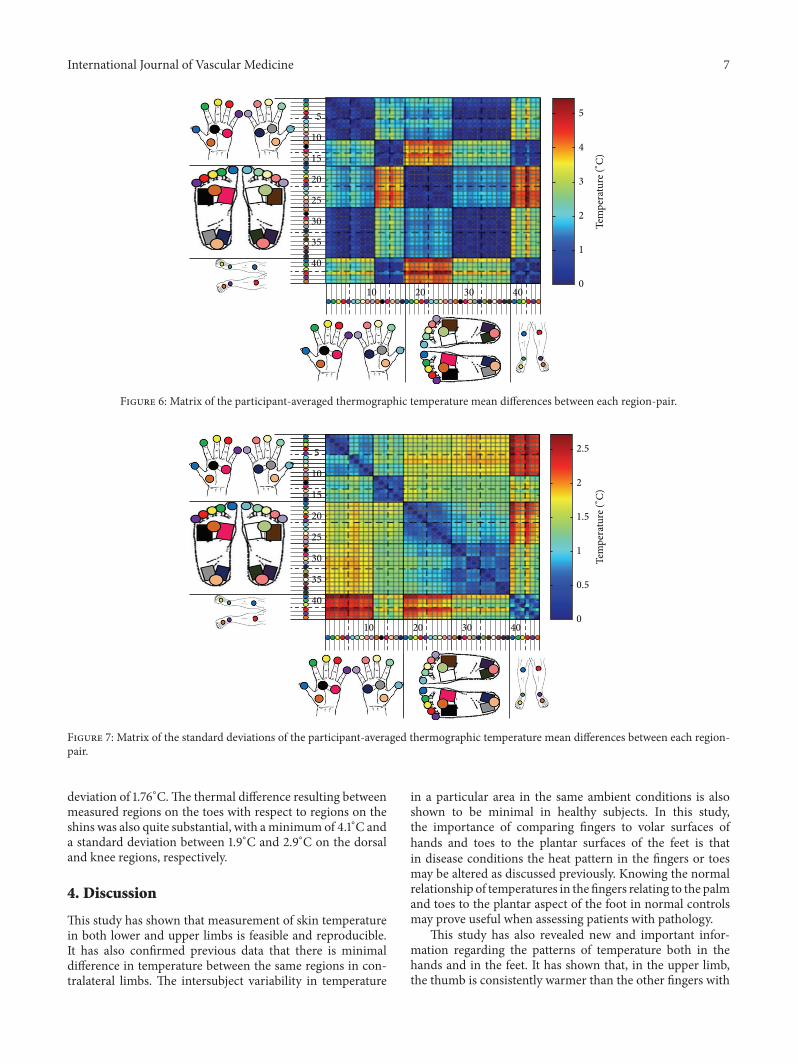
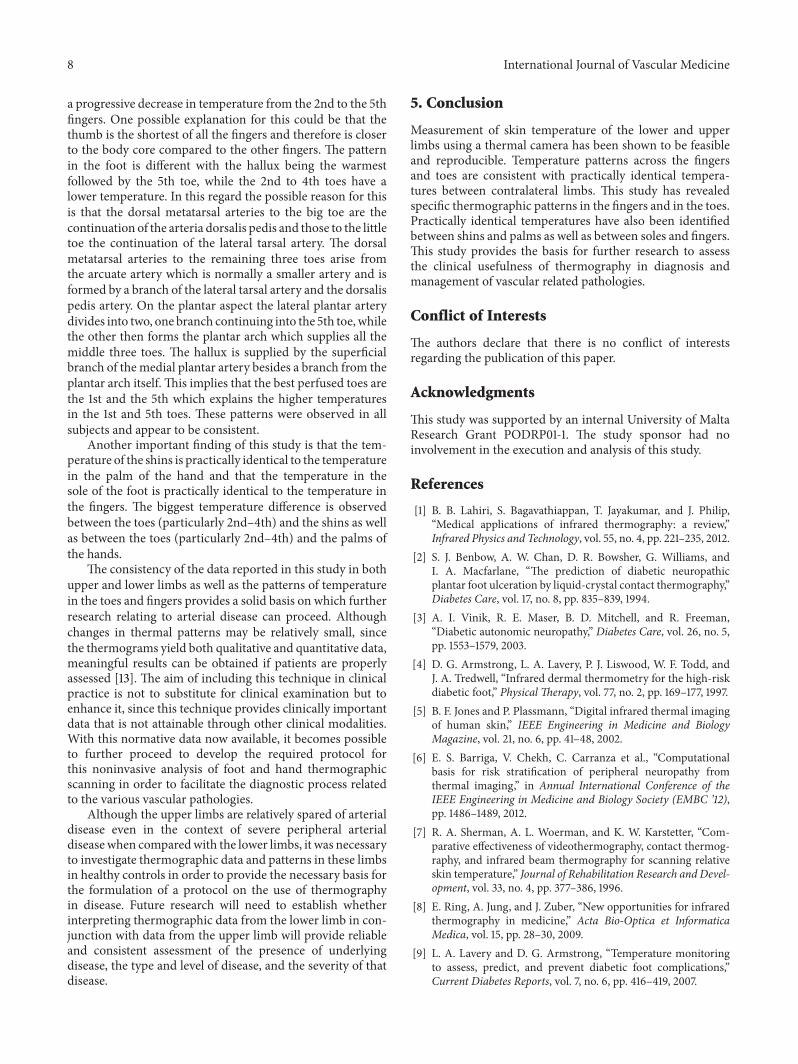
An investigative analysis was also performed on thedifference in temperature between each region. This wasdone by calculating the average difference between the meanthermographic temperature of each region and that of otherregions within the same participant. This was repeated foreach participant to obtain the participant-averaged temper-ature difference between each region-pair. A colour-codedmatrix was generated for visual analysis, illustrated in Figures6 and 7, which depict the average absolute temperaturedifference of each region-pair and its standard deviation,respectively.
3.1. Interpretation of Results. The “block-like” pattern evi-dent in the thermographic temperature difference matrix ofFigure 5 shows that the thermal differences between regionsinside a unique anatomical area (specifically the fingers,volar, toes, plantar, and shin areas) are very minimal whencompared to the difference exhibited between regions fromdifferent anatomical areas. This categorisation into separateareas is further corroborated by the fact that the diagonalsections of Figure 5, representing the temperature similaritybetween neighbouring regions of the same anatomical area,have a mean temperature difference of less than 0.86∘C. Thisis statistically consistent across participants as depicted bythe very low standard deviation shown on the diagonal ofFigure 6. This result enables simplification of the interpre-tation of the thermographic temperature difference matrixby considering similar regions as elements of disjoint setsrepresenting unique anatomical segments which can thenbe more significantly compared for temperature differencesbetween them as shown in Table 1.
Table 1: Mean thermal difference and standard deviation betweensets of measured regions corresponding to anatomical segments.
Anatomical segment-pairsdifference region
Range of the mean thermographicthermal difference (∘C)
It can be deduced from this data that the average tem-perature difference between plantar regions and fingers variesonly by a maximum of 0.94∘C within an individual patientwith a standard deviation of 2∘C. A similar temperaturedifference is also observed between the volar and the shinsregionswith a temperature difference ranging only up to 1.2∘C(SD 1.6∘C).
Conversely, anatomical segments which exhibited largetemperature differences between them, illustrated in redregions in Figure 5, include the toes-volars segment-pair andthe toes-shins segment-pair. For the former case, regionsbetween both anatomical segments showed a thermographicthermal difference between 4.17∘C and 5.12∘Cwith a standard
International Journal of Vascular Medicine 7
Tem
pera
ture
(∘C)
5
4
3
2
1
010
10
20
20
30
30
40
40
5
15
25
35
Figure 6: Matrix of the participant-averaged thermographic temperature mean differences between each region-pair.
Tem
pera
ture
(∘C)
2.5
2
1.5
1
0.5
0
10
10
20
20
30
30
40
40
5
15
25
35
Figure 7: Matrix of the standard deviations of the participant-averaged thermographic temperature mean differences between each region-pair.
deviation of 1.76∘C.The thermal difference resulting betweenmeasured regions on the toes with respect to regions on theshins was also quite substantial, with aminimumof 4.1∘C anda standard deviation between 1.9∘C and 2.9∘C on the dorsaland knee regions, respectively.
4. Discussion
This study has shown that measurement of skin temperaturein both lower and upper limbs is feasible and reproducible.It has also confirmed previous data that there is minimaldifference in temperature between the same regions in con-tralateral limbs. The intersubject variability in temperature
in a particular area in the same ambient conditions is alsoshown to be minimal in healthy subjects. In this study,the importance of comparing fingers to volar surfaces ofhands and toes to the plantar surfaces of the feet is thatin disease conditions the heat pattern in the fingers or toesmay be altered as discussed previously. Knowing the normalrelationship of temperatures in the fingers relating to the palmand toes to the plantar aspect of the foot in normal controlsmay prove useful when assessing patients with pathology.
This study has also revealed new and important infor-mation regarding the patterns of temperature both in thehands and in the feet. It has shown that, in the upper limb,the thumb is consistently warmer than the other fingers with
8 International Journal of Vascular Medicine
a progressive decrease in temperature from the 2nd to the 5thfingers. One possible explanation for this could be that thethumb is the shortest of all the fingers and therefore is closerto the body core compared to the other fingers. The patternin the foot is different with the hallux being the warmestfollowed by the 5th toe, while the 2nd to 4th toes have alower temperature. In this regard the possible reason for thisis that the dorsal metatarsal arteries to the big toe are thecontinuation of the arteria dorsalis pedis and those to the littletoe the continuation of the lateral tarsal artery. The dorsalmetatarsal arteries to the remaining three toes arise fromthe arcuate artery which is normally a smaller artery and isformed by a branch of the lateral tarsal artery and the dorsalispedis artery. On the plantar aspect the lateral plantar arterydivides into two, one branch continuing into the 5th toe,whilethe other then forms the plantar arch which supplies all themiddle three toes. The hallux is supplied by the superficialbranch of the medial plantar artery besides a branch from theplantar arch itself. This implies that the best perfused toes arethe 1st and the 5th which explains the higher temperaturesin the 1st and 5th toes. These patterns were observed in allsubjects and appear to be consistent.
Another important finding of this study is that the tem-perature of the shins is practically identical to the temperaturein the palm of the hand and that the temperature in thesole of the foot is practically identical to the temperature inthe fingers. The biggest temperature difference is observedbetween the toes (particularly 2nd–4th) and the shins as wellas between the toes (particularly 2nd–4th) and the palms ofthe hands.
The consistency of the data reported in this study in bothupper and lower limbs as well as the patterns of temperaturein the toes and fingers provides a solid basis on which furtherresearch relating to arterial disease can proceed. Althoughchanges in thermal patterns may be relatively small, sincethe thermograms yield both qualitative and quantitative data,meaningful results can be obtained if patients are properlyassessed [13]. The aim of including this technique in clinicalpractice is not to substitute for clinical examination but toenhance it, since this technique provides clinically importantdata that is not attainable through other clinical modalities.With this normative data now available, it becomes possibleto further proceed to develop the required protocol forthis noninvasive analysis of foot and hand thermographicscanning in order to facilitate the diagnostic process relatedto the various vascular pathologies.
Although the upper limbs are relatively spared of arterialdisease even in the context of severe peripheral arterialdiseasewhen comparedwith the lower limbs, it was necessaryto investigate thermographic data and patterns in these limbsin healthy controls in order to provide the necessary basis forthe formulation of a protocol on the use of thermographyin disease. Future research will need to establish whetherinterpreting thermographic data from the lower limb in con-junction with data from the upper limb will provide reliableand consistent assessment of the presence of underlyingdisease, the type and level of disease, and the severity of thatdisease.
5. Conclusion
Measurement of skin temperature of the lower and upperlimbs using a thermal camera has been shown to be feasibleand reproducible. Temperature patterns across the fingersand toes are consistent with practically identical tempera-tures between contralateral limbs. This study has revealedspecific thermographic patterns in the fingers and in the toes.Practically identical temperatures have also been identifiedbetween shins and palms as well as between soles and fingers.This study provides the basis for further research to assessthe clinical usefulness of thermography in diagnosis andmanagement of vascular related pathologies.
Conflict of Interests
The authors declare that there is no conflict of interestsregarding the publication of this paper.
Acknowledgments
This study was supported by an internal University of MaltaResearch Grant PODRP01-1. The study sponsor had noinvolvement in the execution and analysis of this study.
References
[1] B. B. Lahiri, S. Bagavathiappan, T. Jayakumar, and J. Philip,“Medical applications of infrared thermography: a review,”Infrared Physics and Technology, vol. 55, no. 4, pp. 221–235, 2012.
[2] S. J. Benbow, A. W. Chan, D. R. Bowsher, G. Williams, andI. A. Macfarlane, “The prediction of diabetic neuropathicplantar foot ulceration by liquid-crystal contact thermography,”Diabetes Care, vol. 17, no. 8, pp. 835–839, 1994.
[3] A. I. Vinik, R. E. Maser, B. D. Mitchell, and R. Freeman,“Diabetic autonomic neuropathy,” Diabetes Care, vol. 26, no. 5,pp. 1553–1579, 2003.
[4] D. G. Armstrong, L. A. Lavery, P. J. Liswood, W. F. Todd, andJ. A. Tredwell, “Infrared dermal thermometry for the high-riskdiabetic foot,” Physical Therapy, vol. 77, no. 2, pp. 169–177, 1997.
[5] B. F. Jones and P. Plassmann, “Digital infrared thermal imagingof human skin,” IEEE Engineering in Medicine and BiologyMagazine, vol. 21, no. 6, pp. 41–48, 2002.
[6] E. S. Barriga, V. Chekh, C. Carranza et al., “Computationalbasis for risk stratification of peripheral neuropathy fromthermal imaging,” in Annual International Conference of theIEEE Engineering in Medicine and Biology Society (EMBC ’12),pp. 1486–1489, 2012.
[7] R. A. Sherman, A. L. Woerman, and K. W. Karstetter, “Com-parative effectiveness of videothermography, contact thermog-raphy, and infrared beam thermography for scanning relativeskin temperature,” Journal of Rehabilitation Research and Devel-opment, vol. 33, no. 4, pp. 377–386, 1996.
[8] E. Ring, A. Jung, and J. Zuber, “New opportunities for infraredthermography in medicine,” Acta Bio-Optica et InformaticaMedica, vol. 15, pp. 28–30, 2009.
[9] L. A. Lavery and D. G. Armstrong, “Temperature monitoringto assess, predict, and prevent diabetic foot complications,”Current Diabetes Reports, vol. 7, no. 6, pp. 416–419, 2007.
International Journal of Vascular Medicine 9
[10] V. A. Spence, W. F. Walker, I. M. Troup, and G. Murdoch,“Amputation of the ischemic limb: selection of the optimum siteby thermography,” Angiology, vol. 32, no. 3, pp. 155–169, 1981.
[11] S. Bagavathiappan, J. Philip, T. Jayakumar et al., “Correlationbetween plantar foot temperature and diabetic neuropathy: acase study by using an infrared thermal imaging technique,”Journal of Diabetes Science and Technology, vol. 4, no. 6, pp.1386–1392, 2010.
[12] C. Formosa, K. Cassar, A. Gatt et al., “Hidden dangers revealedby misdiagnosed peripheral arterial disease using ABPI mea-surement,” Diabetes Research and Clinical Practice, vol. 102, no.2, pp. 112–116, 2013.
[13] C. Hildebrandt, C. Raschner, and K. Ammer, “An overview ofrecent application of medical infrared thermography in sportsmedicine in Austria,” Sensors, vol. 10, no. 5, pp. 4700–4715, 2010.
[14] M. Bharara, J. E. Cobb, and D. J. Claremont, “Thermographyand thermometry in the assessment of diabetic neuropathicfoot: a case for furthering the role of thermal techniques,” TheInternational Journal of Lower Extremity Wounds, vol. 5, no. 4,pp. 250–260, 2006.
[15] L. A. Lavery, K. R. Higgins, D. R. Lanctot et al., “Home mon-itoring of foot skin temperatures to prevent ulceration,”DiabetesCare, vol. 27, no. 11, pp. 2642–2647, 2004.
[16] D. G. Armstrong, K. Holtz-Neiderer, C. Wendel, M. J. Mohler,H. R. Kimbriel, and L. A. Lavery, “Skin temperature monitor-ing reduces the risk for diabetic foot ulceration in high-riskpatients,”The American Journal of Medicine, vol. 120, no. 12, pp.1042–1046, 2007.
[17] P.-C. Sun, S.-H. E. Jao, and C.-K. Cheng, “Assessing foottemperature using infrared thermography,” Foot and AnkleInternational, vol. 26, no. 10, pp. 847–853, 2005.
[18] F. Ring, “Thermal imaging today and its relevance to diabetes,”Journal of Diabetes Science and Technology, vol. 4, no. 4, pp. 857–862, 2010.
[19] N. Bouzida, A. Bendada, and X. P. Maldague, “Visualizationof body thermoregulation by infrared imaging,” Journal ofThermal Biology, vol. 34, no. 3, pp. 120–126, 2009.
[20] B. G. Vainer, “FPA-based infrared thermography as applied tothe study of cutaneous perspiration and stimulated vascularresponse in humans,” Physics in Medicine and Biology, vol. 50,no. 23, pp. R63–R94, 2005.
[21] H.-H. Niu, P.-W. Lui, J. S. Hu et al., “Thermal symmetry ofskin temperature: normative data of normal subjects in Taiwan,”Zhonghua Yi Xue Za Zhi, vol. 64, no. 8, pp. 459–468, 2001.
[22] S.Uematsu, “Symmetry of skin temperature comparing one sideof the body to the other,”Thermology International, vol. 1, pp. 4–7, 1985.
[23] S.Uematsu, “Thermographic imaging of cutaneous sensory seg-ment in patients with peripheral nerve injury. Skin temperaturestability between sides of the body,” Journal of Neurosurgery, vol.62, no. 5, pp. 716–720, 1985.
[24] S. Uematsu, D. H. Edwin, W. R. Jankel, J. Kozikowski, and M.Trattner, “Quantification of thermal asymmetry. Part 1: normalvalues and reproducibility,” Journal of Neurosurgery, vol. 69, no.4, pp. 552–555, 1988.
[25] World Medical Association, Declaration of Helsinki—EthicalPrinciples for Medical Research Involving Human Subjects, 2013,http://www.wma.net/en/30publications/10policies/b3/.
[26] L. Norgren, W. R. Hiatt, J. A. Dormandy, M. R. Nehler, K. A.Harris, and F. G. R. Fowkes, “Inter-society consensus for themanagement of peripheral arterial disease (TASC II),” Journalof Vascular Surgery, vol. 45, no. 1, supplement, pp. S57–S67, 2007.
[27] V. Aboyans, R. L. McClelland, M. A. Allison et al., “Lowerextremity peripheral artery disease in the absence of tradi-tional risk factors. The Multi-Ethnic Study of Atherosclerosis,”Atherosclerosis, vol. 214, no. 1, pp. 169–173, 2011.
[28] S.Westermann,H.H. F. Buchner, J. P. Schramel, A. Tichy, andC.Stanek, “Effects of infrared camera angle and distance on mea-surement and reproducibility of thermographically determinedtemperatures of the distolateral aspects of the forelimbs inhorses,” Journal of the American VeterinaryMedical Association,vol. 242, no. 3, pp. 388–395, 2013.