Clinical Trials 1. Learning Objectives After reviewing this chapter readers should be able to: • Identify and classify different types of trial designs when reading a trial report; • Understand the essential design issues of randomized clinical trials; • Appreciate three possible sources of errors that could lead to erroneous trial results; • Understand the basic statistical principles, concepts, and methods for clinical data analysis and reporting; and • Understand some frequently used terms in clinical trials.
Transcript
Clinical Trials
1. Learning Objectives After reviewing this chapter readers should be able to:
• Identify and classify different types of trial designs when reading a trial report;
• Understand the essential design issues of randomized clinical trials;
• Appreciate three possible sources of errors that could lead to erroneous trial results;
• Understand the basic statistical principles, concepts, and methods for clinical data
analysis and reporting; and
• Understand some frequently used terms in clinical trials.
2. Introduction
Randomized clinical trials are scientific investigations that examine and evaluate the safety and
efficacy of new drugs, devices, tests, or lifestyle interventions using human subjects.
The results that these clinical trials generate are considered to be the most robust data in the
era of evidence-based medicine. Ideally, clinical trials should be performed in a way that isolates
the effect of treatment on the study outcome and provides results that are free from study bias.
A common approach by which to achieve this aim is through randomization, whereby patients
are assigned to a treatment group by random selection. Patients and trial personnel are
deliberately kept unaware of which patient is on the new drug. This minimizes bias in the later
evaluation so that the initial blind random allocation of patients to one or other treatment group
is preserved throughout the trial.
Clinical trials must be designed in an ethical manner so that patients are not denied the benefit
of usual treatments. Patients must give their voluntary consent that they appreciate the purpose
of the trial. Several key guidelines regarding the ethics, conduct, and reporting of clinical trials
have been constructed to ensure that a patient’s rights and safety are not compromised by
participating in clinical trials (Declaration of Helsinki, 2005; Altman et al., 2001).
The primary aim of most clinical trials is to provide an unbiased
evaluation of the merits of using one or more treatment options for a
given disease or condition of interest.
Exercise 1: Importance of Clinical Trials
2. Introduction
A large proportion of clinical trials are sponsored by pharmaceutical or biotechnology companies
that are developing a new disease management intervention: drug, device, or diagnostic
strategy. Disease specific charities may also fund investigators to conduct studies and large
central government bodies interested in health care will also sponsor scientifically valid studies.
Clinical trials usually involve a program of studies from initial exploratory studies on a handful of
subjects to large trials involving hundreds or thousands of subjects, requiring considerable
financial investment usually into the millions of dollars over several years. Given this
investment, there is often an expectation of a return from this investment. The more
commercial the source of funding, the greater the expectation for financial success and the
greater the pressure on those involved to produce positive results. In the last 20 years however,
researchers have recognized the need to disconnect funding from the design and conduct of
trials and many pharmaceutical companies now employ independent research organizations to
undertake such studies.
Important clinical questions without immediate apparent commercial
value but improving the delivery of care to patients or studies using
older drugs in new disease areas will often be funded by health-related
government agencies, or through charitable grants.
3. Classification
Clinical trials vary depending on who initiates the trial:
• Clinicians;
• Pharmaceutical or other health care companies;
• Government bodies; or
• Health providers, who may all initiate trials depending on their interest.
Typically pharmaceutical
companies conduct trials involving
new drugs or established drugs in
disease areas where their drug
may gain a new license.
Device manufacturers use trials to
prove the safety and efficacy of
their new device. Clinical trials
initiated by clinical investigators
may ask questions of when or how
best to administer a specific
therapy or when to withdraw a
therapy and they may use
established or older drugs with
little commercial value in new
disease areas.
Government bodies or health care
providers may trial vaccines or best
ways of organizing care delivery (e.
g., availability of contraception
methods or uptake of the measles
vaccine).
Appropriate uses of clinical trials
A clinical trial is appropriate to evaluate
which is the most cost effective drug
choice. Clinical trials are also appropriate
for evaluating whether a new device
achieves a certain goal as effectively and
safely as standard devices.
However, investigating the causes of
Parkinson's disease, for example, is better
suited by a cohort study or case-control
study because cohort studies are able to
observe groups to determine frequency of
new incidence of disease and case-control
studies observe patients with diseases to
better understand disease characteristics.
Exercise 2: Reasons for Clinical Trials
3. Classification
Phases
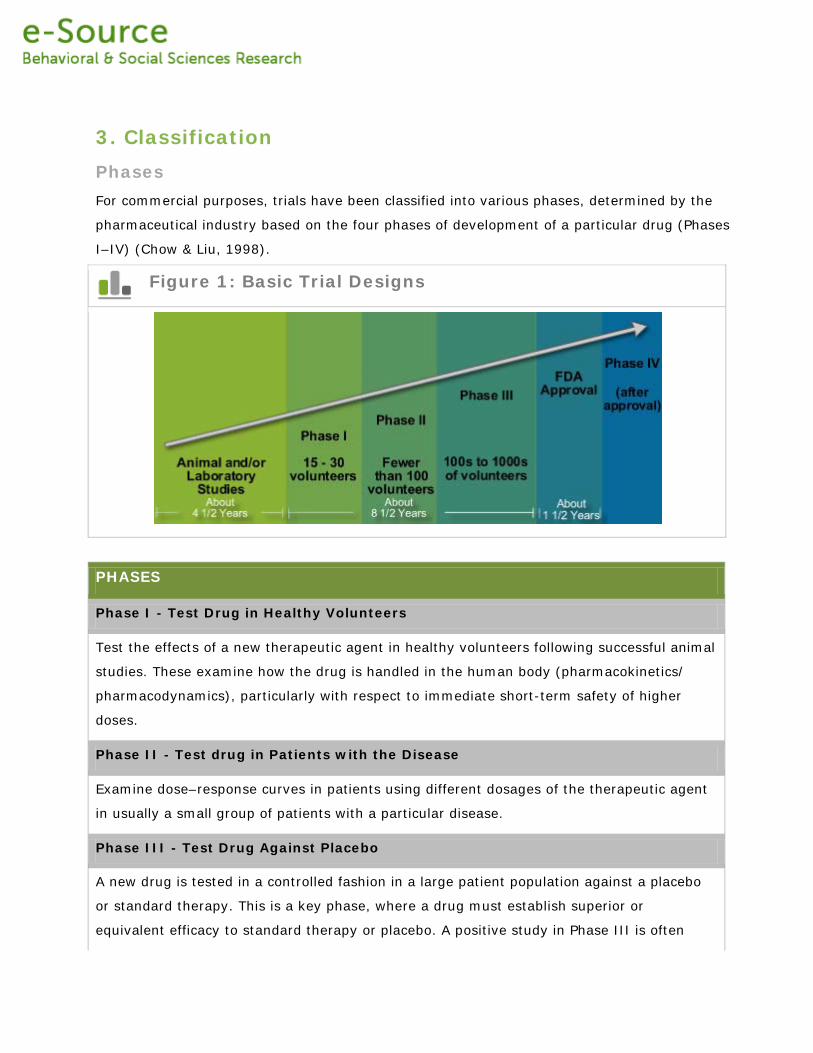
For commercial purposes, trials have been classified into various phases, determined by the
pharmaceutical industry based on the four phases of development of a particular drug (Phases
I–IV) (Chow & Liu, 1998).
Figure 1: Basic Trial Designs
PHASES
Phase I - Test Drug in Healthy Volunteers
Test the effects of a new therapeutic agent in healthy volunteers following successful animal
studies. These examine how the drug is handled in the human body (pharmacokinetics/
pharmacodynamics), particularly with respect to immediate short-term safety of higher
doses.
Phase II - Test drug in Patients with the Disease
Examine dose–response curves in patients using different dosages of the therapeutic agent
in usually a small group of patients with a particular disease.
Phase III - Test Drug Against Placebo
A new drug is tested in a controlled fashion in a large patient population against a placebo
or standard therapy. This is a key phase, where a drug must establish superior or
equivalent efficacy to standard therapy or placebo. A positive study in Phase III is often
known as a landmark study.
Phase IV - Test Drug While in the Marketplace
A postmarketing study as the drug has already been granted regulatory approval/license.
These later studies are crucial for gathering additional safety information from a larger
group of patients with respect to the long-term safety of the drug or for establishing a drug
in a new or wider group of patients.
3. Classification
Trial design
Trials can be further classified by design. This classification is more descriptive in terms of how
patients are randomized to treatment.
Parallel-Group trials are the most common design (Pocock, 1983; Friedman, 1998). Patients are
randomized to the new treatment or the standard treatment and followed-up to determine the
effect of each treatment in parallel groups.
Crossover trials randomize patients to different sequences of treatments, but all patients
eventually get all treatments in varying order, i.e., the patient is his/her own control (Senn,
2002; Jones & Kenward, 2003; Wang et al., 2006g).
Factorial trials assign patients to more than one treatment-comparison group that are
randomized in one trial at the same time; i.e., while drug A is being tested against placebo,
patients are re-randomized to drug B or placebo, making four possible treatment combinations
in total (Fox et al., 2006).
Cluster randomized trials are performed when larger groups (e.g., patients of a single
practitioner or hospital) are randomized instead of individual patients (Mallick et al., 2006b).
Cluster trials can be any of the previously mentioned designs.
Figure 2: Basic Trial Designs
3. Classification
Number of centers
Clinical trials can also be classified as single-center or multicenter studies according to the
number of sites involved. While single-site studies are mainly used for Phase I and II studies,
multicenter studies can be carried out at any stage of clinical development.
Multicenter studies are necessary for two major reasons (Truesdale et al., 2006; Matthews,
2000):
• To evaluate a new medication or procedure more efficiently in terms of accruing
sufficient subjects over a shorter period of time; and
• To provide a better basis for the subsequent generalization of the trial’s findings, i.e.,
the effects of the treatment are likely to be similar in a wider setting across centers
not involved in the trial.
Other classifications
Trials can also be described as superiority studies, equivalence studies, or noninferiority studies
in terms of what the study was designed to prove.
• A superiority study aims to show that a new drug is more effective than the
comparative treatment (placebo or current best treatment) (Pocock, 1983; Chow et
al., 2003). Most clinical trials belong to this category.
• On the other hand, an equivalence trial is designed to prove that two drugs have the
same clinical benefit. Hence, the trial should demonstrate that the effect of the new
drug differs from the effect of the current treatment by a margin that is clinically
unimportant (Bakhai et al., 2006c; Wang et al., 2006a).
• A noninferiority trial aims to show that the effect of a new treatment cannot be said to
be significantly weaker than that of the current treatment.
In the latter two trials the new treatment might still turn out to be more effective than the
comparative treatment, but this is not the prior assumption of the trial (Miller et al., 2006).
Exercise 3: Patient Study Design
3. Classification
Clinical trials can also be classified by whether the trial is:
• The first to compare a specific treatment (exploratory); or
• A further trial trying to confirm a previous observation (confirmatory) (Day, 1999).
An exploratory study might also seek to identify key issues rather than to confirm or challenge
existing results regarding the treatment effect. For example, it might look at the impact of a
new drug in a specific subset of patients who have additional diseases to the main disease of
interest, such as diabetic patients with heart disease. On occasions, a study can have both
confirmatory and exploratory aspects. For instance, in a confirmatory trial evaluating a specific
treatment, the data can also be used to explore further hypotheses, i.e., subgroup effects that
have to be confirmed by later research.
Exercise 4: Study Design Descriptions
4. Endpoints
Endpoints
A clinical trial endpoint is defined as a measure that allows us to decide whether the null
hypothesis of a clinical trial should be accepted or rejected (Bakhai et al., 2006a). In a clinical
trial, the null hypothesis states that there is no statistically significant difference between two
treatments or strategies being compared with respect to the endpoint measure chosen.
Primary endpoints measure outcomes that will answer the primary (or most important) question
being asked by a trial, such as whether a new treatment is better at preventing disease-related
death than the standard therapy. In this case, the primary endpoint would be based on the
occurrence of disease-related deaths during the duration of the trial. The size of a trial is
determined by the power needed to detect a difference in this primary endpoint.
Secondary endpoints ask other relevant questions about the same study; for example, whether
there is also a reduction in disease measures other than death, or whether the new treatment
reduces the overall cost of treating patients. When secondary endpoints are also important the
trial must be powered sufficiently to detect a difference in both endpoints, and expert statistical
and design advice may be needed.
Types of Endpoints
An endpoint could take different forms:
• A quantitative (or continuous or numerical) measurement representing a specific
measure or count (e.g., quality of life, blood pressure, or heart rate). These endpoints
can be summarized by means and medians (Wang et al., 2006f).
• A binary clinical outcome indicating whether an event has occurred (e.g., death from
any cause, the occurrence of disease signs or symptoms, the relief of symptoms). The
proportions, odds ratios and risk ratios can be used to compare these endpoints
(Wang et al., 2006d).
Clinical trial endpoints can be classified as primary or secondary.
• The time to occurrence of an event of interest or survival time (e.g., the time from
randomization of patient to death). Kaplan-Meier plot is often used to compare the
survival experience graphically and Cox model is frequently used to estimate the
treatment effect (Cox, 1984; Wang et al., 2006b).
• The use of healthcare resources (e.g. the number of hospital admissions).
Ideally, a trial should have a single endpoint based on just one
outcome measure. However, as the art of trial design has evolved,
most large trials have a primary (composite) endpoint consisting of
multiple outcome measures. An endpoint can also be the time taken for
an event to occur. For such an endpoint, the events of interest for
which a time is to be recorded—such as stroke or heart attack—must
be predefined. Trial endpoints can also be a quantitative measurement
of a biochemical or socioeconomic parameter such as cholesterol level
or quality-of-life.
4. Endpoints
Composite Endpoints
While some guidelines—such as the guidance on trial design in the International Conference on
Harmonization Guideline for Good Clinical Practice —generally prefer a primary endpoint based
on a single outcome that will be defined before the study begins, many recent studies include
multiple outcomes as part of a composite endpoint. Exploratory clinical investigations or early-
phase studies are more likely to have multiple outcomes, with some of these being developed
during the study.
When multiple outcomes can be experienced by any of the patients it is often best to present
both the total number of outcomes per patient and hierarchical counts of outcomes. In the
latter, only one outcome can be counted for each patient, and it is usually the most serious
outcome that is recorded. The rules for the hierarchy of outcomes are usually established in
advance of the trial, with a fatal outcome taking precedence over a nonfatal one. Another way of
combining outcomes would be to compare the number of recurrences of identical outcomes,
such as the number of seizures experienced by patients with epilepsy during a follow-up period.
An example of a clinical trial with a composite endpoint of multiple
outcomes is the CURE (Clopidogrel in Unstable Angina to Prevent
Recurrent Events) study (Yusuf, Zhao, Mehta et al., 2001). This study
looked at the effects of clopidogrel in patients with acute coronary
syndromes without ST-segment elevation. In this trial, the primary
endpoint was a composite of the following clinical outcomes:
• Death from cardiovascular causes;
• Stroke; and
• Nonfatal myocardial infarction.
Exercise 5: Not a Trial Endpoint
5. Design Issues
Patient Selection
The aim of a clinical trial is sometimes to investigate the efficacy of an intervention in patients
with a particular disease or condition. When performing a trial, it is impossible to enroll every
patient with the particular disease or condition – instead, a sample of patients is selected that
represents the population of interest. Essentially, the findings from the trial should have
relevance to patients in future clinical practice, i.e., the study should have external validity or
generalizability.
In order to ensure generalizability:
• It is essential to have an understanding of
the disease and its current treatment
options.
• The selected sample must truly reflect the
population it represents, and the eligibility
criteria must not be so restrictive that they
hamper recruitment or limit the
generalizability of the findings.
However, eligibility criteria also serve the function of
choosing a sample who can tolerate being in a trial
and those in whom there are less co-morbidities that
might dilute the effect of the intervention.
Some of the basic
considerations for design
in clinical trials are:
• Patient
selection
• Protocol
• Randomization
• Blinding
• Sample size
determination
Exercise 6: Lowering Blood Pressure Trial
5. Design Issues
Protocol
The trial protocol is a formal document that specifies how a clinical trial is to be conducted. It
describes the:
• Objective(s);
• Design;
• Methodology;
• Statistical considerations; and
• Administrative structure of the trial (Mallick et al., 2006a; ICH, 2005).
We can also regard the protocol as a scientific, administrative, and organizational project
guideline that may be the basis of a contractual relationship between an investigator and a trial
sponsor.
Different trial protocols will retain very similar key components. However, adaptations may be
necessary for each trial’s particular circumstances.
In scientific research, the first step is to set up a hypothesis, and then to construct an
appropriate study design to test that hypothesis. In clinical trials, the hypothesis is usually
related to one form of therapeutic intervention that is expected to be superior or equal to
another in terms of specific outcomes. Once this hypothesis is developed, the study’s aims,
design, methodology, statistical methods, and analyses should be formulated.
The protocol should clearly address issues related to:
• The study’s conduct;
• Set up;
• Organization;
Well-designed protocols are important for conducting clinical trials
safely and in a cost-effective manner.
• Monitoring;
• Administrative responsibilities;
• Publication policy; and
• Timelines in appropriate sections.
Trial guidelines and regulatory requirements, such as the International
Conference on Harmonization guidelines for Good Clinical Practice
(ICH–GCP, 2005), the Declaration of Helsinki (Declaration of Helsinki,
2005), the EU Clinical Trials Directive (EUCTD, 2001), and the US Food
and Drug Administration (FDA) Regulations Relating to Good Clinical
Practice and Clinical Trials (FDA, 2005), should be followed as
appropriate.
5. Design Issues
Randomization
Why should patients in a clinical trial be randomized? The randomized controlled trial (RCT) is
considered the gold standard for testing the efficacy of medical treatments (Pocock, 1983).
This assumption is the basis of all comparative statistical tests performed in the trial. To achieve
this balance we randomly assign the patients (hence the term randomized in an RCT) to each
treatment strategy so that, for example, men have an equal chance of being given treatment A
or B, people aged over 60 years have an equal chance of being given treatment A or B, and so
on. Simple randomization is one way of performing this balancing function, but other methods
are needed when the number of patients is small.
Minimizing bias
A further requirement of randomization is that it must not be predictable by the person
assigning patients to the treatment strategies; otherwise there is a chance that the groups will
contain bias. To prevent this, certain methods of blinding or masking are used so that patients
and staff (with the usual exception of the data and safety monitoring board) are not aware
whether treatment A or B is the new treatment, or even which group patients are in (active or
placebo/standard treatment), until the end of the trial. Physicians and study coordinators
providing the treatments to the patients use a randomization code to find out which treatment
pack has been assigned to each patient (A or B), but the code provides no information about
which treatment is which (active or placebo/standard treatment). Randomization must be
protected by blinding so that it remains unpredictable.
Determining randomization codes
A fundamental assumption that forms the basis of the RCT is that
patients in different groups are similar for characteristics such as age,
gender, social class, time of year of presentation, country of
presentation, and type of hospital.
A randomization code is a list of which treatment a subject should receive. It is usually
determined by a statistician using computer-generated random numbers or a random-number
table.
Some trials use methods for assigning subjects according to:
• Date of birth (odd or even years);
• Hospital record number; or
• Date of screening for the study (odd or even days).
However, these randomization methods have a level of predictability, so strictly speaking they
are not acceptable methods of randomization.
Common randomization methods
The generation of a randomization code can be achieved using one of a variety of procedures.
Once a code and method of allocation are decided on, their rules must be adhered to throughout
the study.
Common types of randomization methods are (Wang & Bakhai, 2006a):
• Simple randomization;
• Block randomization;
• Stratified randomization; or
• Minimization or adaptive randomization.
A combination of these methods can also be used, and other special methods have also been
used (Chow & Liu, 1998).
5. Design Issues
Blinding
Randomization can minimize the influence of bias in clinical trials by balancing groups for
various characteristics. Bias can still occur, however, if study personnel and patients know the
identity of the treatment, due to preconceptions and subjective judgment in reporting,
evaluation, data processing, and statistical analysis. To minimize these biases, studies should be
blinded, or masked, so that all participants are unaware of whether the subjects are assigned to
the new or standard therapy during a trial.
Open / Unblinded Studies
On some occasions it might not be possible to use blinding. For example, if the new intervention
is a surgical treatment and is being compared with tablets then the difference between the two
is difficult to hide. Such studies might need to be unblinded as far as the patients and caregivers
are concerned, and are known as open or unblinded studies. The main problem with this type is
that patients may underreport adverse effects of the new treatment.
Single-Blinded Studies
In single-blinded studies, the patient should be unaware of which treatment they are taking,
while the investigators are aware of whether the treatment is new, standard, or placebo. The
disadvantage is that patients might under- or over-report treatment effects and side-effects,
based on some influence or response from the investigators. Investigators may give advice or
prescribe additional therapy to the control group if they feel that these patients are
disadvantaged in comparison to the active group, and so a number of subtle biases could be
There are four general types of blinded studies in clinical trials (Bakhai
et al., 2006b):
• Open/unblinded;
• Single blinded;
• Double blinded; and
• Triple blinded.
introduced either in favor of or against the new treatment depending on the investigators’
opinions.
Double-Blinded Studies
In double-blinded studies, neither the patient nor the investigator knows the identity of the
assigned intervention (Chow & Liu, 1998). A number of biases are thus reduced, such as
investigators’ preconceptions of the treatments used in the study. This reduces the ability of the
investigators to monitor the safety of treatments, so a Data Safety Monitoring Committee
(DSMC) must regularly review the rate of adverse events in each arm of the trial.
Operating these committees is difficult, as they must meet regularly enough to be able to detect
differences promptly, avoiding needless further harm to patients, while avoiding early
termination of a trial due to a chance difference.
Triple-Blinded Studies
In triple-blinded studies, in addition to the investigators and participants, all members of the
sponsor’s project team (e.g., the project clinician, statistician, and data manager), and even the
DSMC are blinded (Chow & Liu, 1998). This lessens the chance that the DSMC will stop the trial
early in favor of either treatment, and makes evaluations of the results more objective.
However, this hampers the DSMC’s ability to monitor safety and efficacy endpoints, and some
investigators might feel uncomfortable when participating because there is no one to oversee
the results as they accrue. Triple blinding is appropriate for studies in which the risk of adverse
events due to the new or standard treatment is low, and should not be used for treatments
where safety is a critical issue. Due to the reduced ability of the DSMC to see trends early,
recruitment might need to continue until statistical significance is reached for either clinical
effects or adverse events.
5. Design Issues
Exercise 7: Blinding Methods
5. Design Issues
Sample Size Determination
What is the sample size for a randomized clinical trial?
The sample size of a randomized controlled trial is the number of subjects that are to be
enrolled in the study (Wang & Bakhai, 2006b; Chow at al., 2007). Choosing the right sample
size is critical for a study, and is based on two key assumptions:
• The size of the benefit we anticipate with the new treatment compared to
standard (or placebo) treatment (the ‘expected treatment effect’); and
• The amount of certainty we wish to have with which to capture the treatment
benefit (the ‘power’ of the study).
The larger the sample size, the better the power with which to detect a treatment effect, which
means that smaller treatment effects can be detected as statistically significant. In the same
way, the smaller the sample size, the less power we have with which to detect a treatment
effect, meaning that the effect must be greater in order to be detected as significant. The
calculation used to find the required sample size for a trial is also influenced by the trial’s
design, so the method by which the primary outcome is to be determined must also be clarified
in advance of determining the sample size.
Why do we have to choose a sample size?
When resources are limited we must decide how best to invest those in order to maximize the
benefits received. For example, should we use treatment X or treatment Y? To answer this
question, we need to decide how hard we will look for the answer. Until we do, people will
continue to be given or refused a treatment without evidence. We might decide that it is only
worth looking at the question if we are fairly likely to detect a 10% improvement with the new
treatment. To improve the chance that such a difference is detected (if it exists) we have to
choose the sample size wisely, based on realistic initial assumptions. More importantly, it is
unethical to carry out a study that is unlikely to capture a real difference since we will have
spent precious resources on performing a study for no gain. From this, we can appreciate that
choosing an appropriate sample size for a study is dependent on good judgment, which is critical
to a trial’s success.
Are negative trials due to small sample sizes?
A negative clinical trial is a trial in which the observed differences between the new and
standard treatments are not large enough to satisfy a specified significance level (Type I error
threshold), so the results are declared to be not statistically significant (Wang et al., 2006e).
With the benefit of hindsight, analyses of negative clinical trials have shown that the
assumptions chosen by investigators often lead them to choose a sample size that is too small
to offer a reasonable chance of avoiding a false-negative error (a Type II error).
Not all negative trials are due to insufficient power. In some cases it might be that the event
rate in the control group was lower than expected or that there were confounding factors, such
as changes to routine treatment methods during the duration of the study. A branch of medical
statistics known as meta-analysis combines the results from many such small studies to try to
estimate a true mean effect more closely. If this analysis shows that the new treatment has a
favorable benefit, then this should be verified by performing a larger, definitive RCT. However,
one must always take into consideration the outlay of resources required to realize the potential
benefit, and even then, large RCTs might produce unexpected results.
6. Erroneous Trial Results
In a clinical trial, the observed treatment effect regarding the safety and efficacy of a new drug
may represent the ‘true’ difference between the new drug and the comparative treatment or it
may not. This is to say that if the trial were to be repeated with all the available patients in the
world then the outcome would either be the same as the trial (a true result) or different (making
the trial result a chance event, or an erroneous false result). Understanding the possible sources
of erroneous results is critical in the appreciation of clinical trials.
Example 1: Potential Biases
A cinnamon-based herbal oil reduced breast pain in women compared to evening primrose
oil. Commercial oils were used for the study. The new cinnamon oil was provided free to all
participants, while the primrose oil needed a prescription to be filled by the patient.
In this example, there are several sources of potential bias, including:
• Trial not blinded;
• New medications are appealing;
• False safety impression;
• Impressions based on age;
• Patient drop out; and
• Self-fulfilling prophecy.
The first source is not blinding the trial. This could result in bias because if the trial is not
blinded, it is easy to know which oil women were on, resulting in observer bias and volunteer
bias in terms of recording and reporting breast pain. New medications can be a source of bias
Reasons for erroneous results fall into three main categories.
• The trial may have been biased in some predictable fashion.
• It could have been contaminated (confounded) by an
unpredictable factor.
• The result may simply have occurred by random chance.
because they are appealing and they usually attract positive attitudes from patients and, more
importantly, physicians, especially those in a trial. This is often referred to as observer’s bias.
Side effects of newer medications are not as extensively known or documented often giving a
false impression of safety. This can be referred to as information bias. Impressions based on
age can be a source of bias because younger, healthier patients are more likely to participate in
the study and appreciate new products rather than the skepticism of new products that is often
found in older patients. This is an example of selection bias. A confounding treatment effect
can be caused by imbalances in subject distribution by treatment group. Non-blinded studies
may not have balanced groups if people drop out if chosen for the prescription therapy arm.
Another source is known as the self fulfilling prophecy effect. This is when physicians
themselves may influence patients if they know which therapy a patient is receiving and may
capture or record patient experiences during the trial with their own “pre-judgement” biases.
This is also an example of observer’s bias.
6. Erroneous Trial Results
Bias/systematic errors
Bias can influence a trial by the occurrence of systematic errors that are associated with the
design, conduct, analysis, and reporting of the results of a clinical trial. Bias can also make the
trial-derived estimate of a treatment effect deviate from its true value (Arezina & Wang, 2006;
Chow & Liu, 1998; Jadad, 1998). The most common types of bias in clinical trials are those
related to subject selection and outcome measurement. For example, if the investigator is aware
of which treatment a patient is receiving, it could affect the way he/she collects information on
the outcome during the trial or he/she might recruit patients in a way that could favor the new
treatment, resulting in a selection bias.
In addition, exclusion of subjects from statistical analysis because of noncompliance or missing
data could bias an estimate of the true benefit of a treatment, particularly if more patients were
removed from analysis in one group than the other (Everitt & Pickles, 1999). Much of the
advanced design strategies seek to reduce these systematic errors.
Confounding
Confounding represents the distortion of the true relationship between treatment and outcome
by another factor, e.g., the severity of disease (Wang et al., 2006c). Confounding occurs when
an extra factor is associated with both the outcome of interest and treatment group assignment.
Confounding can both obscure an existing treatment difference and create an apparent
difference that does not exist.
If we divided patients into treatment groups based on inherent differences (such as mean age)
at the start of a trial then we would be very likely to find the benefit of the new treatment to be
influenced by those pre-existing differences. For example, if we assign only smokers to get
treatment A, only nonsmokers to get treatment B, and then assess which treatment protects
better against cardiovascular disease, we might find that the benefit seen with treatment B is
due to the lack of smoking in this group. The effect of treatment B on cardiovascular disease
development would therefore be confounded by smoking.
Randomization in conjunction with a large sample size is the most effective way to restrict such
confounding, by evenly distributing both known and unknown confounding factors between
treatment groups. If, before the study begins, we know which factors may confound the trial
then we can use randomization techniques that force a balance of these factors (stratified
randomization). In the analysis stage of a trial, we might be able to restrict confounding using
special statistical techniques such as stratified analysis and regression analysis (Steele & Wang,
2006).
Random error
Even if a trial has an ideal design and is conducted to minimize bias and confounding, the
observed treatment effect could still be due to random error or chance (Wang et al., 2006). The
random error can result from sampling, biologic, or measurement variation in outcome
variables. Since the patients in a clinical trial are only a sample of all possible available patients,
the sample might yet show a chance false result compared to the overall population. This is
known as a sampling error. Sampling errors can be reduced by choosing a very large group of
patients. Other causes of random error are described elsewhere (Chow & Liu, 1998).
7. Statistics
Statistics play a very important role in any clinical trial from design, conduct, analysis, and
reporting in terms of controlling for and minimizing biases, confounding factors, and measuring
random errors. The statistician generates the randomization code, calculates the sample size,
estimates the treatment effect, and makes statistical inferences, so an appreciation of statistical
methods is fundamental to understanding randomized trial methods and results. Statistical
analyses deal with random error by providing an estimate of how likely the measured treatment
effect reflects the true effect (Wang et al., 2006). Two statistical approaches are often used for
clinical data analysis: hypothesis testing and statistical estimate.
Statistics in Clinical Trials
Hypothesis Testing
Hypothesis testing or inference involves an assessment of the probability of obtaining an
observed treatment difference or more extreme difference for an outcome assuming that
there is no difference between two treatments (Altman, 1999; Kirkwood & Sterne, 2003;
Wang et al., 2006). This probability is often called the P-value or false-positive rate. If the P-
value is less than a specified critical value (e.g., 5%), the observed difference is considered
to be statistically significant. The smaller the P-value, the stronger the evidence is for a true
difference between treatments. On the other hand, if the P-value is greater than the
specified critical value then the observed difference is regarded as not statistically
significant, and is considered to be potentially due to random error or chance. The
traditional statistical threshold is a P-value of 0.05 (or 5%), which means that we only
accept a result when the likelihood of the conclusion being wrong is less than 1 in 20, i.e.,
we conclude that only one out of a hypothetical 20 trials will show a treatment difference
when in truth there is none.
Statistical Estimate
Statistical estimates summarize the treatment differences for an outcome in the forms of
point estimates (e.g., means or proportions) and measures of precision (e.g., confidence
intervals [CIs]) (Altman, 1999; Kirkwood & Sterne, 2003; Wang et al., 2006). A 95% CI for
a treatment difference means that the range presented for the treatment effect contains
(when calculated in 95 out of 100 hypothetical trials assessing the same treatment effect)
the true value of treatment difference, i.e., the value we would obtain if we were to use the
entire available patient population is 95% likely to be contained in the 95% CI.
Alpha (Type I) and Beta (Type II) Errors
When testing a hypothesis, two types of errors can occur. To explain these two types of errors,
we will use the example of a randomized, double-blind, placebo-controlled clinical trial on a
cholesterol-lowering drug ‘A’ in middle-aged men and women considered to be at high risk for a
heart attack. The primary endpoint is the reduction in the total cholesterol level at 6 months
from randomization.
Table 1: Alpha (Type I and Beta (Type II) Errors
The null hypothesis is that there is no difference in mean cholesterol reduction level at 6 months
postdose between patients receiving drug A (μ1) and patients receiving placebo (μ2) (H0: μ1 =
μ2); the alternative hypothesis is that there is a difference (Ha: μ1 ≠ μ2). If the null hypothesis
is rejected when it is in fact true, then a Type I error (or false-positive result) occurs. For
example, a Type I error is made if the trial result suggests that drug A reduced cholesterol levels
when in fact there is no difference between drug A and placebo. The chosen probability of
committing a Type I error is known as the significance level. As discussed above, the level of
significance is denoted by α. In practice, α represents the consumer’s risk, which is often chosen
to be 5% (1 in 20).
On the other hand, if the null hypothesis is not rejected when it is actually false, then a Type II
error (or false-negative result) occurs. For example, a Type II error is made if the trial result
suggests that there is no difference between drug A and placebo in lowering the cholesterol level
when in fact drug A does reduce the total cholesterol. The probability of committing a Type II
error, denoted by β, is sometimes referred to as the manufacturer’s risk (Chow & Liu, 1998).
The power of the test is given by 1 – β, representing the probability of correctly rejecting the
null hypothesis when it is in fact false. It relates to detecting a pre-specified difference.
Relationship Between Significant Testing and Confidence Interval
When comparing, for example, two treatments, the purpose of significance testing is to assess
the evidence for a difference in some outcome between the two groups, while the CI provides a
range of values around the estimated treatment effect within which the unknown population
parameter is expected to be with a given level of confidence.
There is a close relationship between the results of significance testing and CIs. This can be
illustrated using the previously described cholesterol reduction trial. If H0: μ1 = μ2 is rejected at
the α% significance level, the corresponding (1 – α)% CI for the estimated difference (μ1 - μ2)
will not include 0. On the other hand, if H0: : μ1 = μ2 is not rejected at the α% significance
level, then (1 – α)% CI will include 0.
7. Statistics
Let us assume that four randomized, double-blind, placebo-controlled trials are conducted to
establish the efficacy of two weight-loss drugs (A and B) against placebo, with all subjects,
whether on a drug or placebo, receiving similar instructions as to diet, exercise, behavior
modification, and other lifestyle changes. The primary endpoint is the weight change (kg) at 2
months from baseline.
The difference in the mean weight change between an active drug and placebo groups can be
considered as weight reduction for the active drug against placebo. Table 2 presents the results
of hypothesis tests and CIs for the four hypothetical trials. The null hypothesis for each trial is
that there is no difference between the active drug treatment and placebo in mean weight
change.
In trial 1 of drug A, the reduction of drug A over placebo was 6 kg with only 40 subjects in each
group. The P-value of 0.074 suggests that there is no evidence against the null hypothesis of no
effect of drug A at the 5% significance level. The 95% CI shows that the results of the trial are
consistent with a difference ranging from a large reduction of 12.6 kg in favor of drug A to a
reduction of 0.6 kg in favor of placebo.
Table 2: Point Estimate and 95% CI
Point estimate and 95% confidence interval (CI) for the difference in mean weight change from
baseline between the active drug and placebo groups in four hypothetical trials of two weight
reduction drugs.
The results for trial 2 among 400 patients, again for drug A, suggest that mean weight was
again reduced by 6 kg. This trial was much larger, and the P-value (P < 0.001) shows strong
evidence against the null hypothesis of no drug effect. The 95% CI suggests that the effect of
drug A is a greater reduction in mean weight over placebo of between 3.9 and 8.1 kg. Because
this trial was large, the 95% CI was narrow and the treatment effect was therefore measured
more precisely.
In trial 3, for drug B, the reduction in weight was 4 kg. Since the P-value was 0.233, there was
no evidence against the null hypothesis that drug B has no statistically significant benefit effect
over placebo. Again this was a small trial with a wide 95% CI, ranging from a reduction of 10.6
kg to an increase of 2.6 kg for the drug B against the placebo.
The fourth trial on drug B was a large trial in which a relatively small, 2-kg reduction in mean
weight was observed in the active treatment group compared with the placebo group. The P-
value (0.008) suggests that there is strong evidence against the null hypothesis of no drug
effect. However, the 95% CI shows that the reduction is as little as 0.5 kg and as high as 3.5
kg. Even though this is convincing statistically, any recommendation for its use should consider
the small reduction achieved alongside other benefits, disadvantages, and cost of this
treatment.
7. Statistics
Table 3: Key Points from Table 2 Trials
Summary of the key points from the results described in Table 2
CI: confidence interval.
7. Statistics
Exercise 8: P-values and CI
8. Summary
There has been an increasing number of randomized clinical trials conducted and published
which provide the cornerstone of evidence-based medicine. More and more people from a broad
range of professional backgrounds need to understand the essentials of clinical trials regarding
their design, statistical analysis, and reporting. In this chapter, we provided an introduction to
the area of clinical trials covering some of the key issues to be considered in their design,
analysis and interpretation. Firstly, we described the general aims of clinical trials and their
classifications according to different criteria. Secondly, we introduced some essential design
issues in clinical trials, including endpoints, patient selection, protocol development,
randomization, blinding, and sample size determination. Thirdly, we discussed three possible
sources of errors that may influence trial results: bias/systematic errors, confounding, and
random error. Next, we described some basic statistical concepts and methods frequently used
in the analysis of randomized trials. These included descriptive statistics, statistical inferences,
techniques for the comparison of means or proportions from two samples, and survival analysis.
To facilitate understanding of the concepts, we also provided frequently used statistical terms
and their meanings. In conclusion, readers should have sufficient knowledge, via the concepts
discussed in this chapter, to appreciate the essential elements of most clinical trial reports.
9. Glossary of Terms
GLOSSARY
Bias
Systematic errors associated with the inadequacies in the design, conduct, or analysis of a
trial on the part of any of the participants of that trial (patients, medical personnel, trial
coordinators or researchers), or in publication of its the results, that make the estimate of a
treatment effect deviate from its true value. Systematic errors are difficult to detect and
cannot be analyzed statistically but can be reduced by using randomization, treatment
concealment, blinding, and standardized study procedures.
Confidence Intervals
A range of values within which the "true" population parameter (e.g. mean, proportion,
treatment effect) is likely to lie. Usually, 95% confidence limits are quoted, implying that
there is 95% confidence in the statement that the "true" population parameter will lie
somewhere between the lower and upper limits.
Confounding
A situation in which a variable (or factor) is related to both the study variable and the
outcome so that the effect of the study variable on the outcome is distorted. For example, if
a study found that coffee consumption (study variable) is associated with the risk of lung
cancer (outcome), the confounding factor here would be cigarette smoking, since coffee is
often drunk while smoking a cigarette which is the true risk factor for lung cancer. Thus we
can say that the apparent association of coffee drinking with lung cancer is due to
confounding by cigarette smoking (confounding factor). In clinical trials, confounding occurs
when a baseline characteristic (or variable) of patients is associated with the outcome, but
unevenly distributed between treatment groups. As a result, the observed treatment
difference from the unadjusted (univariate) analysis can be explained by the imbalanced
distribution of this variable.
Covariates
This term is generally used as an alternative to explanatory variables in the regression
analysis. However, more specifically refer to variables that are not of primary interest in an
investigation. Covariates are often measured at baseline in clinical trials because it is
believed that they are likely to affect the outcome variable, and consequently need to be
included to estimate the adjusted treatment effect.
Descriptive/Inferential Statistics
Descriptive statistics are used to summarize and describe data collected in a study. To
summarize a quantitative (continuous) variable, measures of central location (i.e. mean,
median, and mode) and spread (e.g. range and standard deviation) are often used, whereas
frequency distributions and percentages (proportions) are usually used to summarize a
qualitative variable. Inferential statistics are used to make inferences or judgments about a
larger population based on the data collected from a small sample drawn from the
population. A key component of inferential statistics is hypothesis testing. Examples of
inferential statistical methods are t-test and regression analysis.
Endpoint
Clearly defined outcome associated with an individual subject in a clinical research.
Outcomes may be based on safety, efficacy, or other study objectives (e.g. pharmacokinetic
parameters). An endpoint can be quantitative (e.g. systolic blood pressure, cell count),
qualitative (e.g. death, severity of disease), or time-to-event (e.g. time to first
hospitalization from randomization).
Hazard Ratio
In survival analysis, hazard (rate) represents instantaneous event rate (incidence rate) at
certain time for an individual who has not experienced an event at that time. Hazard ratio
compares two hazards of having an event between two groups. If the hazard ratio is 2.0,
then the hazard of having an event in one group is twice the hazard in the other group. The
computation of the hazard ratio assumes that the ratio is consistent over time (proportional
hazards assumption).
Hypothesis Testing or Significance Testing
Statistical procedure for assessing whether an observed treatment difference was due to
random error (chance) by calculating a P-value using the observed sample statistics such as
mean, standard deviation, etc. The P-value is the probability that the observed data or
more extreme data would have occurred if the null hypothesis (i.e. no true difference) were
true. If the calculated P-value is a small value (like <0.05), the null hypothesis is then
rejected, and we state that there is a statistically significant difference.
Intention-to-Treat Analysis
A method of data analysis on the basis of the intention to treat a subject (i.e. the treatment
regimen a patient was assigned at randomization) rather than the actual treatment regimen
he received. It has the consequence that subjects allocated to a treatment group should be
followed up, assessed, and analyzed as members of that group regardless of their
compliance to that therapy or the protocol, irrespective of whether they later crossed over
to the other treatment group or not or whether they discontinued treatment.
Kaplan-Meier Estimate and Survival Curve
A survival curve shows an estimate of the fraction of patients who survive over the follow
up period of the study without an event of interest (e.g. death). The Kaplan-Meier estimate
is a simple way of computing the survival curve taking into account patients who were lost
to follow up or any other reasons for incomplete results (known as censored observations).
It usually provides a staircase graph of the fraction of patients remaining free of event over
time.
Meta-Analysis
The systematic review and evaluation of the evidence from two or more independent
studies asking the same clinical question to yield an overall answer to the question.
Number needed to treat (NNT)
This term is often used to describe how many patients would need to be given a treatment
to prevent one event. It is determined from the absolute difference between one treatment
and another. In a randomized study the group receiving treatment A had a death rate of
12.5%, and the group receiving treatment B had a death rate of 15.0%. Both groups are
matched for size and length of follow-up. Comparing the two treatments there was an
absolute risk reduction of 15% - 12.5% = 2.5% for treatment A. From this we can derive
that the NNT (= 1/0.025) is 40. This means 40 patients need to be given treatment A rather
than B to prevent 1 additional death.
Odds Ratio (OR) and Risk Ratio (RR)
These terms compare the probability of having an event between two groups exposed to a
risk factor or treatment. The risk ratio (RR) is the ratio of the probability of occurrence of an
event between two groups. The odds ratio (OR) is the ratio of the ratio of patients with and
without an event in each group. If the number of deaths in the treatment and control arms
(both of sample size 100) of a randomized study are 50 and 25 respectively, the RR =
(50/100) / (25/100) = 2. The treatment group has a 2- fold relative risk of dying compared
with the control group. The OR = (50/50) / (25/75) = 3 indicates that the odds of death in
the treatment arm is 3-fold of the control arm.
Per-Protocol Analysis
A method of analysis in which only the subset of subjects who complied sufficiently with the
protocol are included. Protocol compliance includes exposure to treatment, availability of
measurements, correct eligibility, and absence of any other major protocol violations. This
approach contrasts with the more conservative and widely accepted "intention-to-treat"
analysis.
Power
The probability of rejecting the null hypothesis (e.g. no treatment difference) when it is
false. It is the basis of procedures for calculating the sample size required to detect an
expected treatment effect of a particular magnitude.
Random Error
An unpredictable deviation of an observed value from a true value resulting from sampling
variability. It is a reflection of the fact that the sample is smaller than the population; for
larger samples, the random error is smaller, as opposed to systematic errors (bias) that
keep adding up because they all go in the same direction.
Regression Analyses
Methods of explaining or predicting outcome variables using information from explanatory
variables. Regression analyses are often used in clinical trials to estimate the adjusted
treatment effect taking into account of differences in baseline characteristics, and in
epidemiological studies to identify prognostic factors while controlling for potential
confounders. Commonly used regression models include linear, logistic, and Cox regression
methods.
Treatment Effect
An effect attributed to a treatment in a clinical trial, often measured as the difference in a
summary measure of an outcome variable between treatment groups. Commonly expressed
as difference in means for a continuous outcome, a risk difference, risk ratio, or odds ratio
for a binary outcome, and hazard ratio for a time-to-event outcome.
10. References
Altman DG. (1999). Practical Statistics for medical research. London: Chapman and Hall.
Altman DG, Schulz KF, Moher D, et al. (2001). The revised CONSORT statement for reporting
randomized trials: Explanation and elaboration. Ann Intern Med;134: 663–94.
Arezina R, Wang D. (2006). Source and control of bias. In: D Wang & A Bakhai, (Ed.s). Clinical
Trials: A practical guide to design, analysis and reporting. London: Remedica. 55-64.
Bakhai A, Chhabra A, Wang D. (2006a). Endpoints. In: D Wang & A Bakhai, (Ed.s). Clinical
Trials: A practical guide to design, analysis and reporting. London: Remedica. 37-45.
Bakhai A, Patel S, Wang D. (2006b). Blinding. In: D Wang & A Bakhai, (Ed.s). Clinical Trials: A
practical guide to design, analysis and reporting. London: Remedica. 75-80.
Bakhai A, Sudhir R, Wang D. (2006c). Equivalence Trials.In: D Wang & A Bakhai, (Ed.s). Clinical
Trials: A practical guide to design, analysis and reporting. London: Remedica. 113-118.
Chow SC, Liu JP. (1998). Design and analysis of clinical trials: Concept and methodologies.
Chichester: John Wiley & Sons.
Chow SC, Shao J, Wang H. (2003). Sample size calculation in clinical research. New York:
Marcel.
Chow SC, Shao J, and Wang, H (2007). Sample size calculations in clinical research. 2nd edition.
Chapman Hall/CRC Press, Taylor & Francis: New York.
Cox DR, Oakes D. (1984). Analysis of survival data. London: Chapman and Hall.
Day S. (1999). Dictionary of clinical trials. Chichester: John Wiley & Sons.
Declaration of Helsinki. Ethical Principles for Medical Research Involving Human Subjects.
Available from: http://www.wma.net/en/30publications/10policies/b3/index.html. Accessed May
6, 2005.
Directive 2001/20/EC of the European Parliament and of the Council of 4 April 2001 on the
approximation of the laws, regulations and administrative provisions of the Member States
relating to the implementation of good clinical practice in the conduct of clinical trials on
medicinal products for human use. Official Journal of the European Union 2001;121:34.
Everitt BS, Pickles A. (1999). Statistical aspects of the design and analysis of clinical trials.
London: Imperial College Press.
FDA, Regulations Relating to Good Clinical Practice and Clinical Trials. Available from:
http://www.fda.gov/oc/gcp/regulations.html. Accessed May 6, 2005.
FDA, Section 5.8 of the International Conference on Harmonization: Guidance on Statistical


![SK9822 REV.01 EN [兼容模张] · 2016. 3. 18. · 3/ 12 SK9822 SK9822: The default is RGB chips with IC integration 6. General Information](https://static.documents.pub/doc/80x56/60c8dd7214333e138a661027/sk9822-rev01-en-fafff-2016-3-18.jpg)


