19


A CLONE is something that is identical to something else – remember Dolly the
sheep? She was genetically modified so that she was a clone of her mother. It follows
therefore that a CLONE TOWN is a town which is identical to another town. A few
years ago people started to notice that towns up and down the country were starting to
look very much like one another. Towns had more and more CHAIN STORES (shops
of which there are many branches, e.g. Tesco, The Carphone Warehouse, Gap) and
fewer INDEPENDENT STORES (privately owned individual shops).
Another way that we can determine whether a town is a clone is by comparing
statistics for things like the type or cost of housing and levels of crime with other
towns and with the national average. In England and Wales, statistics are collected
every ten years through the POPULATION CENSUS. Every household has to complete
a detailed survey about their home, their family and their income (amongst many other
things!) The last census was in 2001. The results of the census are available to look at
online.
Today you are going to conduct some fieldwork and look at census data to find out
whether GUILDFORD is a clone town.
There are three sections to your fieldwork booklet:
SECTION ONE: Tasks you have to complete BEFORE you go to Guildford.
SECTION TWO: Tasks you have to complete DURING the fieldwork in Guildford.
SECTION THREE: Tasks you have to complete AFTER the fieldwork, back at
school.

There are two tasks that you need to complete before you go to Guildford.
Discuss these tasks in your small groups and then fill in the relevant sections of your
booklet.
Read the Guardian article on the next page about clone towns (“Retail chains „cloning‟
UK towns”), and decide whether you think Guildford fits the description of a clone
town. Fill in the section below:
I think we will find today that Guildford is a clone town Yes No
I think this because _________________________________________________________________
____________________________________________________________________________________
____________________________________________________________________________________
____________________________________________________________________________________
____________________________________________________________________________________
____________________________________________________________________________________
On the page after the article, you will find a section called „Higher or Lower‟. In this
section, you have to predict how you think Guildford compares to the rest of England
and Wales for four different statistics:
1. Housing type
2. House prices
3. Crime levels
4. Satisfaction with the local area
Think very carefully and fill in your predictions using your own knowledge of Guildford.
Source: www.guardianunlimited.co.uk
Retail chains 'cloning' UK towns Global brands are swamping the individuality of the high streets John Carvel, social affairs editor Monday June 6, 2005 The Guardian
Britain's town centres are rapidly becoming indistinguishable, losing all sense of local identity as they are taken over by global and national chain stores, economists warned today.
A report from the New Economics Foundation estimated how far the nation's high streets had been taken over by a phenomenon it called "clone town Britain".
It found 42 of the 103 towns it surveyed in England, Scotland and Wales had become clones. In these towns, independent butchers, greengrocers, pet shops and dry cleaners had been driven out by national supermarket retailers, fast food chains, mobile phone shops and global fashion outlets.
The most extreme example of a clone town was Exeter in Devon, the foundation said. On a scale awarding points for the number of independent outlets and range of specialist shops, it scored 6.9 out of 60.
At the other end of the scale, Hebden Bridge in West Yorkshire scored 48.6. This was the best example of what the foundation called a "home town" - one retaining its individual character. Others included Peebles, Lewes, Whitley Bay and Monmouth.
The foundation said 34 of the 103 high streets it surveyed could still be described as home towns. Another 37 were "border towns" where colonisation by the clones was not fully established.
Andrew Simms, the foundation's policy director, said: "Clone stores have a triple whammy on communities. They bleed the local economy of money, destroy the social glue provided by real local shops and steal the identity of our towns and cities. Then we are left with soulless clone towns.”
He added: "Banality has taken root like a relative from abroad invited to stay because their foreignness seemed interesting, before realising they were tiresome and refused to leave."

Below are some for England and Wales. They were collected
during the Census of 2001. They show the average results for the country in four
categories. You are going to be collecting data for these four categories in Guildford
today. How do you think Guildford will compare to the nation as a whole?
Write your prediction under each box.
I think the figures for Guildford will be __________________________________________________
___________________________________________________________________________________________
___________________________________________________________________________________________
I think this because ______________________________________________________________________
___________________________________________________________________________________________
____________________________________________________________________________________
____________________________________________________________________________________
I think the figures for Guildford will be _____________________________________________
__________________________________________________________________________________
__________________________________________________________________________________
I think this because _______________________________________________________________
__________________________________________________________________________________
__________________________________________________________________________________
__________________________________________________________________________________
1. Housing type in England & Wales:
22.8% Detached
31.6% Semi-detached
26% Terraced
18.8% Flats
0.4% Other (e.g. caravans, mobile homes)
Source: www.statistics.gov.uk/glance/ ( “Population” “Census 2001: Housing Type”)
2. Average house prices in England & Wales:
£292,773 Detached
£173,760 Semi-detached
£148,282 Terraced
£175,599 Flats
£189,983 Overall average of all property types
Source: (www.neighbourhood.statistics.gov.uk Enter Guildford postcode Select “housing” tab

I think the figures for Guildford will be _____________________________________________
__________________________________________________________________________________
__________________________________________________________________________________
I think this because _______________________________________________________________
__________________________________________________________________________________
__________________________________________________________________________________
__________________________________________________________________________________
4. Satisfaction with the local area in England & Wales:
77% Felt that rubbish collection was good or very good
71% Rated local health care services as good or very good
46% Said that they know most or many people in their neighbourhood
58% Felt they could trust most or many people in their neighbourhood.
Source: www.statistics.gov.uk/glance/ ( “Society” “About Neighbours”)
3. Crime in England & Wales:
3.0 per 1,000 people Burglaries
5.6 per 1,000 people Criminal damage
0.5 per 1,000 people Robberies
9.0 per 1,000 people Vehicle thefts
4.5 per 1,000 people Violence against the person
Source: www.crimestatistics.org.uk ( “Statistics by region and area” “England & Wales”)
Additional notes: _____________________________________________________________________
______________________________________________________________________________________
______________________________________________________________________________________
______________________________________________________________________________________
______________________________________________________________________________________

(It doesn‟t matter what order you collect your data in, but make sure all sections are
completed before the end of the day.)
PART ONE: THE HIGH STREET
(a) The top of the High Street: HOUSE PRICES
At the top of Guildford High Street there are several estate agents. Pick two… one that
looks really expensive from the outside, and one that you think sells the cheapest
houses.
How do these house prices compare to the predictions you made before you set out? _____________________________________________________________________________________
_____________________________________________________________________________________
_____________________________________________________________________________________
Estate Agent 1… …the most expensive!
Name: ________________________________ What made you think that this was the most expensive Estate Agent?
Record house prices from the window of the Estate Agent here:
Detached house £ _________
Semi-detached house £ ______
Terraced house £ _________
Flat £ _________
Estate Agent 2… …the cheapest!
Name: _________________________________
What made you think that this was the cheapest Estate Agent?
Record house prices from the window of the Estate Agent here:
Detached house £ _________
Semi-detached house £ ______
Terraced house £ _________
Flat £ _________

(b) The length of the High Street: CLONE TOWN?
You are going to complete a survey to find out whether Guildford is a clone town in
terms of the shops it has on the High Street.
Read the instruction sheet carefully.
Record your findings on the survey sheet (remember only 50 shops required).
Add up your totals.
Now you can use the formula given on the sheet to work out whether Guildford is a
CLONE TOWN (indistinguishable from dozens of others around the country), a
HOME TOWN (distinctive and recognisable as a unique place) or a BORDER TOWN
(somewhere between the two!).
Your scores for Guildford: Route 1 Route 2
What do your findings make Guildford? CLONE TOWN / BORDER TOWN / HOME TOWN
Did your findings match your prediction? Yes No
Why? _______________________________________________________________________________
_____________________________________________________________________________________
_____________________________________________________________________________________
_____________________________________________________________________________________
_____________________________________________________________________________________
_____________________________________________________________________________________
_____________________________________________________________________________________
(c) Shopper Survey
To find out more about whether Guildford is a clone town, you are going to seek the
opinion of some shoppers on the High Street. On the following page is a questionnaire
with six questions. Four of these have been completed; the two blanks are for you to
think up some questions of your own… What else would you like to find out about
shoppers‟ opinions of Guildford? Do they think it is a clone town? Discuss this with
your group and add your questions to the grid.
Try to ask as many shoppers as you can in the allocated time – you will need to divide
up the space on your survey grid.
Don‟t forget, if they are not in Guildford to shop, you don‟t have to ask them any
further questions. Thank them, and move on to the next person.
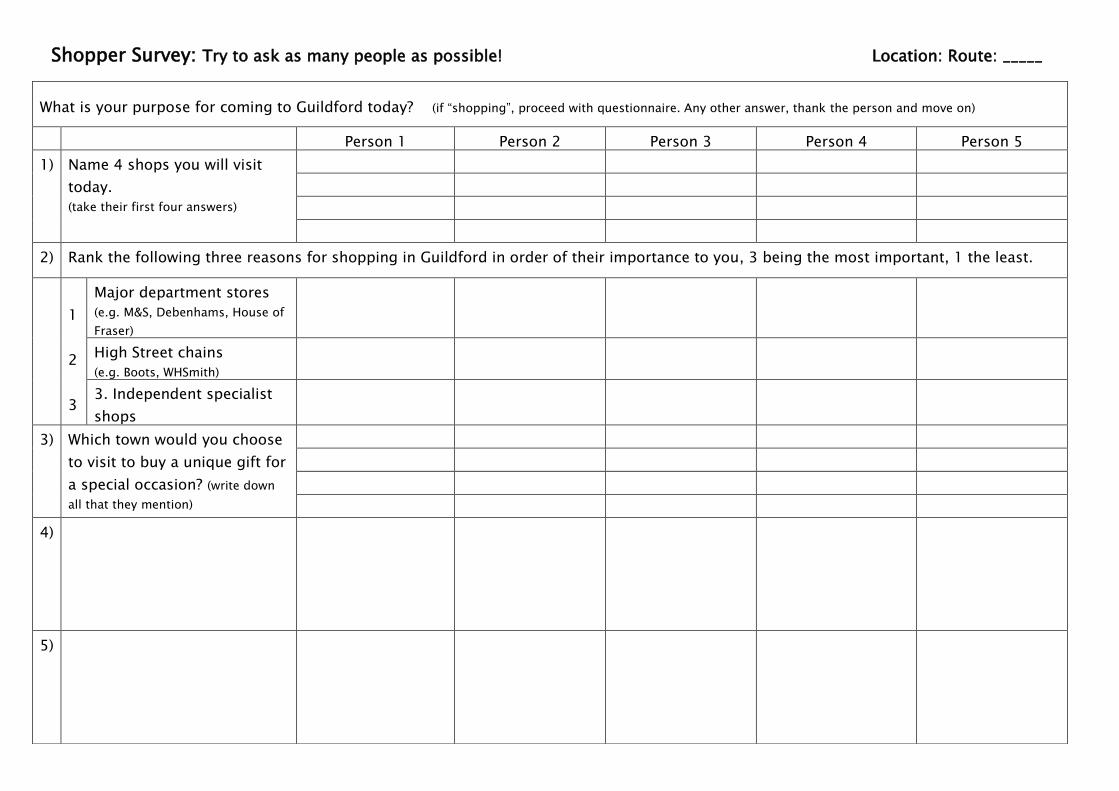
Shopper Survey: Try to ask as many people as possible! Location: Route: _____
What is your purpose for coming to Guildford today? (if “shopping”, proceed with questionnaire. Any other answer, thank the person and move on)
Person 1 Person 2 Person 3 Person 4 Person 5
1) Name 4 shops you will visit
today.
(take their first four answers)
2) Rank the following three reasons for shopping in Guildford in order of their importance to you, 3 being the most important, 1 the least.
1
2
3
Major department stores
(e.g. M&S, Debenhams, House of
Fraser)
High Street chains
(e.g. Boots, WHSmith)
3. Independent specialist
shops
3) Which town would you choose
to visit to buy a unique gift for
a special occasion? (write down
all that they mention)
4)
5)

PART TWO: GUILDFORD‟S HOUSING AREAS
You will visit two different areas of Guildford to study the housing and environment.
This is to collect data to compare with the national census.
In each of the two areas you need to complete 4 TASKS:
1. Housing types
Record the first 50 houses in your area:
(a) Area 1: _________________________
Type of Housing Tally Total/50
Detached
Semi-detached
Terraced
Flat
Other
(b) Area 2: _________________________
Type of Housing Tally Total/50
Detached
Semi-detached
Terraced
Flat
Other
How do your findings compare with your earlier predictions for Guildford?
____________________________________________________________________________________
____________________________________________________________________________________
____________________________________________________________________________________
____________________________________________________________________________________
1. A tally of the different housing types.
2. A photo environmental quality assessment.
3. A survey of any evidence of crime.
4. A questionnaire about people‟s satisfaction with the local area.
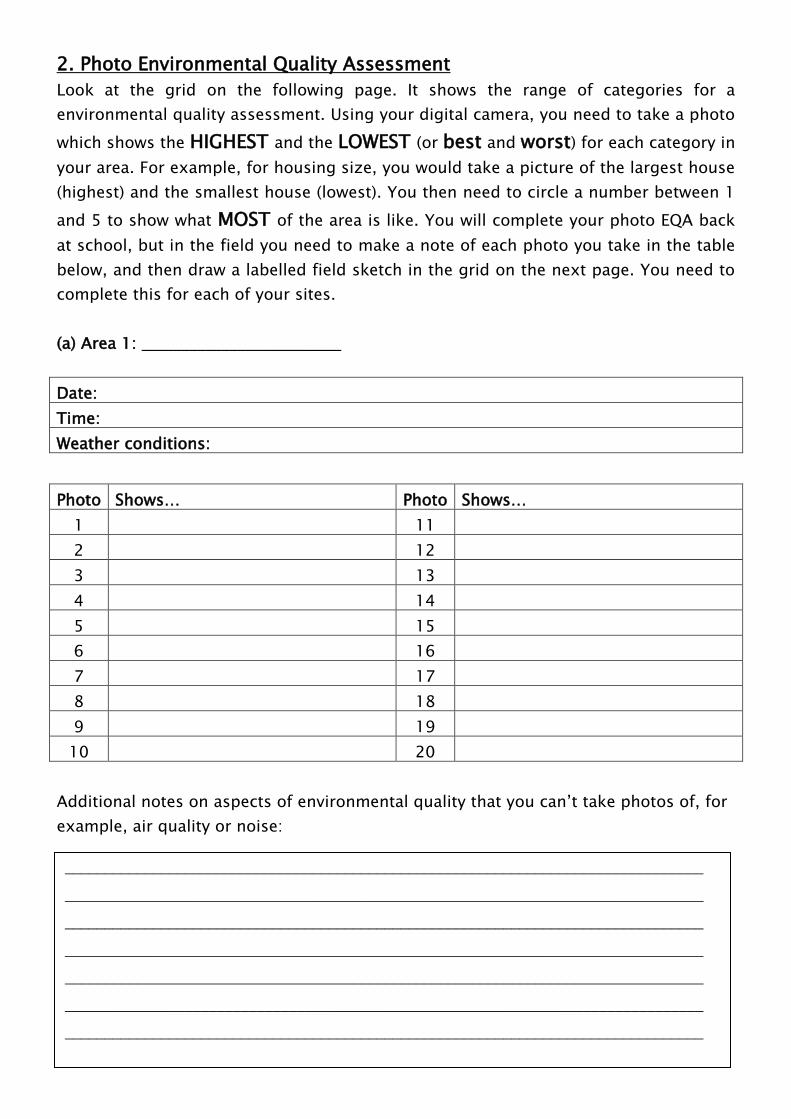
2. Photo Environmental Quality Assessment
Look at the grid on the following page. It shows the range of categories for a
environmental quality assessment. Using your digital camera, you need to take a photo
which shows the HIGHEST and the LOWEST (or best and worst) for each category in
your area. For example, for housing size, you would take a picture of the largest house
(highest) and the smallest house (lowest). You then need to circle a number between 1
and 5 to show what MOST of the area is like. You will complete your photo EQA back
at school, but in the field you need to make a note of each photo you take in the table
below, and then draw a labelled field sketch in the grid on the next page. You need to
complete this for each of your sites.
(a) Area 1: _________________________
Date:
Time:
Weather conditions:
Photo Shows… Photo Shows…
1 11
2 12
3 13
4 14
5 15
6 16
7 17
8 18
9 19
10 20
Additional notes on aspects of environmental quality that you can‟t take photos of, for
example, air quality or noise:
________________________________________________________________________________
________________________________________________________________________________
________________________________________________________________________________
________________________________________________________________________________
________________________________________________________________________________
________________________________________________________________________________
________________________________________________________________________________
________________________________________________________________________________

Photo Environmental Quality Assessment Draw a field sketch of each photo that you take in the table below. Remember to label the
key features of your sketch.
Street Furniture (e.g. benches, bins)
1 – 2 – 3 – 4 – 5
Traffic Congestion
1 – 2 – 3 – 4 – 5
Litter
1 – 2 – 3 – 4 – 5
House size (how many floors / windows?)
1 – 2 – 3 – 4 – 5
House quality (i.e. state of repair)
1 – 2 – 3 – 4 – 5
Pedestrian numbers
1 – 2 – 3 – 4 – 5
Evidence of crime (e.g. graffiti, vandalism)
1 – 2 – 3 – 4 – 5
Greenery (trees, gardens, open space)
1 – 2 – 3 – 4 – 5
Photo EQA idea from Field Studies Council www.field-studies-council.org

(b) Area 2: _________________________
Date:
Time:
Weather conditions:
Photo Shows… Photo Shows…
1 11
2 12
3 13
4 14
5 15
6 16
7 17
8 18
9 19
10 20
Additional notes on aspects of environmental quality that you can‟t take photos of, for
example, air quality or noise:
________________________________________________________________________________
________________________________________________________________________________
________________________________________________________________________________
________________________________________________________________________________
________________________________________________________________________________
________________________________________________________________________________
________________________________________________________________________________
________________________________________________________________________________
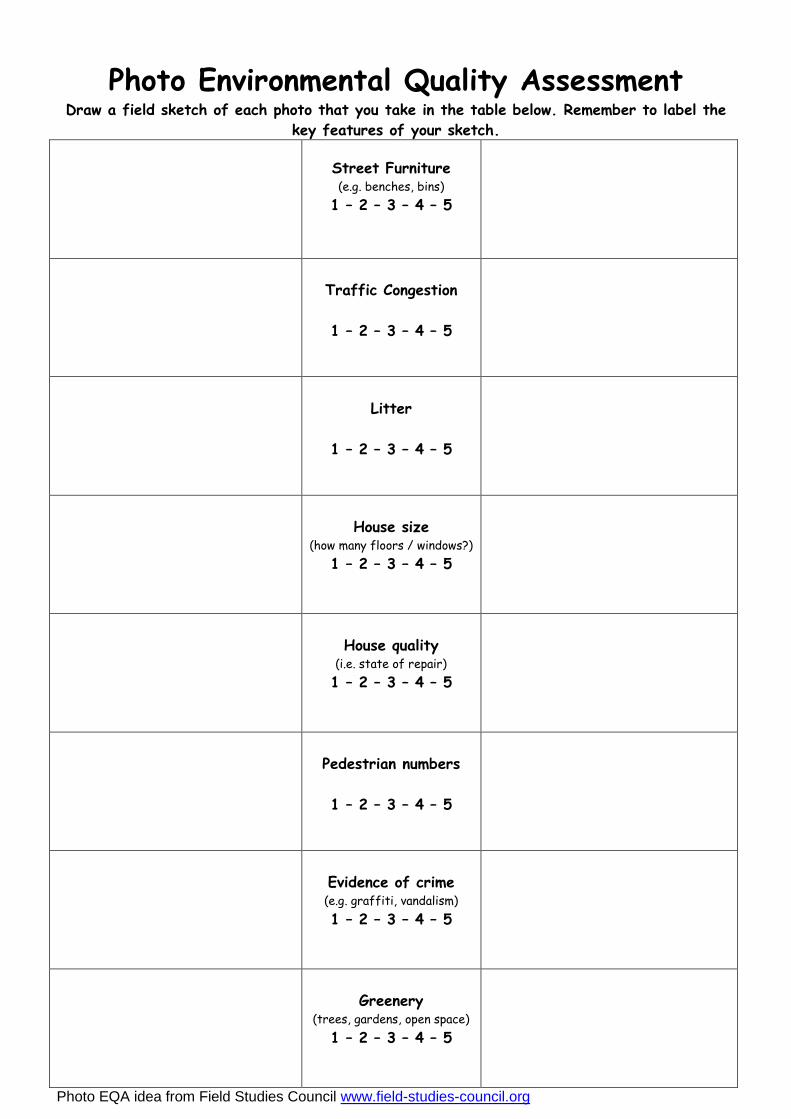
Photo Environmental Quality Assessment Draw a field sketch of each photo that you take in the table below. Remember to label the
key features of your sketch.
Street Furniture (e.g. benches, bins)
1 – 2 – 3 – 4 – 5
Traffic Congestion
1 – 2 – 3 – 4 – 5
Litter
1 – 2 – 3 – 4 – 5
House size (how many floors / windows?)
1 – 2 – 3 – 4 – 5
House quality (i.e. state of repair)
1 – 2 – 3 – 4 – 5
Pedestrian numbers
1 – 2 – 3 – 4 – 5
Evidence of crime (e.g. graffiti, vandalism)
1 – 2 – 3 – 4 – 5
Greenery (trees, gardens, open space)
1 – 2 – 3 – 4 – 5
Photo EQA idea from Field Studies Council www.field-studies-council.org

3. A survey of any evidence of crime
Jot down any evidence of graffiti or damage you see in each area.
(a) Area 1: _________________________
(b) Area 2: _________________________
How do these findings compare with your earlier predictions for the amount of crime
in Guildford?
____________________________________________________________________________________
____________________________________________________________________________________
____________________________________________________________________________________
____________________________________________________________________________________
____________________________________________________________________________________
Notes – any evidence of crime? I think crime rates will be HIGH / LOW in this area because __________________________
________________________________________________________________________________
________________________________________________________________________________
________________________________________________________________________________

4. Survey of people‟s satisfaction with the local area
Now is your chance to find out whether local people are happy with their local area.
Select a person to interview who looks typical of the area! Explain what you are doing
politely, and ask whether they would mind participating in a short survey.
There are three questions that you must ask them, these are shown below. Try to come
up with two other questions of your own. For some ideas of what you might ask them,
look back at your predictions page – what do you want to need to find out about how
people feel about their local area so that you can compare Guildford with other places?
(a) Area 1: _____________________
Question Response
1. On a scale of 1
(unsatisfied) to 5 (very
satisfied), how happy
are you with your local
area?
1 2 3 4 5
2. What do you like most
about your local area?
3. What do you like least
about your local area?
4.
5.

(b) Area 2: _____________________
Question Response
1. On a scale of 1
(unsatisfied) to 5 (very
satisfied), how happy
are you with your local
area?
1 2 3 4 5
2. What do you like most
about your local area?
3. What do you like least
about your local area?
4.
5.
TO DO LIST:
1. Create your photo environmental quality assessment using the template provided,
and save it in the class folder.
2. Input your data to the class Excel spreadsheet.
3. Analyse your class findings: compare them to your predictions, to the actual census
data for Guildford and to national statistics.
4. Create your group presentation: IS GUILDFORD A CLONE TOWN? using Google Earth
or Google Maps. Don‟t forget to include lots of evidence to support your answer.
Websites you will need to use:
www.neighbourhood.statistics.gov.uk Type the school postcode (GU1 1SJ) into the
“Neighbourhood Summary” section on the right
for comparisons between Guildford and
England & Wales. Gives housing type and price
(under “Housing”) and data for the extension
task.
To search for more data, type Guildford into
the “Find Statistics for an Area” box on the left,
and select Local Authority as the type of area.
You can then search the census data to your
heart‟s content!
www.statistics.gov.uk This is the site for UK summary data. Click on
the “UK Snapshot” tab and selection
“Population” then “Census 2001: Housing” for
more information on housing type. Going back
and selecting “Society” and then “About
Neighbours” will tell you about satisfaction
with the local area.
www.crimestatistics.org.uk Click on “Statistics by region and area” and
type the school postcode into the search
engine at the top right hand corner. You can
then search for crime figures by type, and
compare Guildford with England & Wales.

Extension tasks:
Ideas for extra research you could do to impress your teachers!
1. Compare your results for Guildford to other towns of a similar size in England &
Wales. Guildford had a population of 129,701 at the last census. Why not try some
of these:
Norwich 121,550 people
Preston 129,633 people
Windsor 133,626 people
Middlesbrough 134,855 people
To find out about these towns, enter their names into the “Find Statistics for an
Area” box on the Neighbourhood Statistics website
(www.neighbourhood.statistics.gov.uk), and select “Local Authority” as the type of
area.
Where are these towns? Why might they have different results to Guildford?
2. What other statistics from the census could you use to compare Guildford with the
national average? There are plenty on the websites! To start you off, why not look at
Life Expectancy (under „Health‟), Ethnic Diversity (under „People‟) or Indices of
Deprivation (under „Deprivation‟). What do these tell you about how Guildford
compares to the rest of the country?


