41
The Clorox Company Strategic Opportunities Discussion Materials | December 17, 2014
| Date post: | 21-Jan-2017 |
| Category: |
Documents |
| Upload: | robert-j-liu |
| View: | 926 times |
| Download: | 0 times |

The Clorox Company Strategic Opportunities
Discussion Materials | December 17, 2014
Our Team
Grant Sternberg
Aamani Paturi
Alexander Roesch
Robert Liu
• Indiana University, Kelley School of Business, 2016• Majors: Finance & Accounting • Investment Banking Workshop, 2016
• Indiana University, Kelley School of Business, 2016• Majors: Finance & Accounting• Investment Banking Workshop, 2016
• Indiana University, Kelley School of Business, 2017• Majors: Finance & Economic Consulting• Investment Banking Club, Co-President
• Indiana University, Kelley School of Business and College of Arts & Sciences, 2017• Majors: Finance, Accounting & Mathematics• Investment Banking Club, Co-President
2

Table of Contents
I. Executive Summary
II. Macroeconomic Outlook & Industry Analysis
III. Company Positioning
IV. Strategic Options
V. Financial Analysis
VI. Execution
VII. Appendix
3
4
6
10
14
23
33
36

I. Executive Summary

Limited growth because of broad category exposure and elevated risk due to commodity exposure In recent years, inorganic growth has been stimulated through the purchase of professional medical healthcare companies to
strengthen product offerings and expand industry expertise Lofty valuation given flat historical sales growth Cleaning and household, the two largest segments are struggling but forecasted to recover Lastly, operating challenges in Venezuela and Argentina from currency devaluation, coupled with price controls, have had a
significant impact on several household product manufacturers
Executive Summary
Overview
Current Positioning
Management temperament appears to run counter to a sale – a 15x offer from an undisclosed competitor was recently rejected A leveraged buy out runs counter to historical debt tolerance levels, the industry is moving away from large public-to-private
transactions, and the required return for a financial sponsor requires too low of a purchase multiple Low organic growth, especially in comparison to competitors, makes the status quo less than ideal A divestiture unlocks liquidity for Clorox to return proceeds to shareholders, pivot into emerging markets, and provides capital for
future investment opportunities and growth initiatives
Strategic Alternatives Assessment
We recommend the CLX Board of Directors divest the Kingsford brand for 16.0x EV/EBITDA through a targeted auction process
Discretionary spending is projected to increase resulting in greater consumer purchasing power moving forwards Emerging markets are not growing as fast as they have been projected to in past years Emerging markets outside of the US provide better growth opportunities, organic sales growth is projected to be slightly better in 2014 Cost of debt is cheap and projected to increase in coming years Growth in the consumer durables industry will be driven by innovation and a focus on core competencies
5

II. Macroeconomic Outlook & Industry Analysis

Macroeconomic Outlook
1031210373
1044810497
10541 1058510644
1069210744
10832 1084410913
Q3 Q4 Q1 Q2 Q3 Q4 Q1 Q2 Q3 Q4 Q1 Q2
USD
Bill
ion
2011
United States Consumer Spending
2012 2013 2014
Domestic
International
With 2014 coming to a close, economic outlook for the U.S. is positive overall
The U.S. economy shows strong signs of recovery while still driving for more growth
Discretionary spending is projected to increase resulting in greater consumer purchasing power moving forward
Cost of debt is cheap and projected to increase Low cost of oil will reduce inputs costs and drive profitability Emerging markets outside of the US provide better growth
opportunities although organic sales growth is projected to be slightly better in 2014
Economic growth in East Asia is projected to slow modestly to 7.0% by 2016
Rising societal tensions in Middle East and North Africa Widening income disparities Expanding middle class in Asia The International Monetary Fund called global growth
“mediocre” in October in its latest outlook Chief Economist Olivier Blanchard wrote that “secular
stagnation in advanced economies remains a concern” Emerging markets are not growing as fast as they have been
projected to in past years-3%
-2%
-1%
0%
1%
2%
3%
4%
5%
6%
2005 2006 2007 2008 2009 2010 2011 2012 2013
Perc
enta
ge (%
)
GDP Growth (Annual Percentage)
7

Consumer Nondurables Industry Overview
Slow growth in income levels, and tighter purchasing power has continued the emphasis on value products
Private labels continuing to gain popularity because of their emphasis on value
Unilever NV’s sale of its global Skippy business to Hormel Foods in November 2013 for about $700 million; P&G focusing on its core brands; Energizer planning to split into two firms; and Kimberly-Clark planning a spin-off of its healthcare business in 2014
Emphasis on Value Products
Increasing Number of Divestitures
Innovation
Restructuring
General Outlook
Consumer nondurables are generally less sensitive to economic conditions, however the challenge is in battling for a limited share of consumer spending. Slow growth in the US population and the number of households means that the development of new products and categories remains important to growth in the industry. Emerging markets outside of the US provide better growth opportunities although organic sales growth is projected to be slightly better in 2014.
Trends
New products can lift profits: innovation keeps consumers from defecting to less expensive private label products that do not have the same features and may benefit from the historical consumer trend of trading up to better products that cost more
Because of high input costs, most of the household and personal care companies began significant restructuring programs in 2011–2012 to cut costs and slim product lines
Companies that have done this include: Kimberly Clark, P&G, and Colgate
8
Industry Analysis By Segment
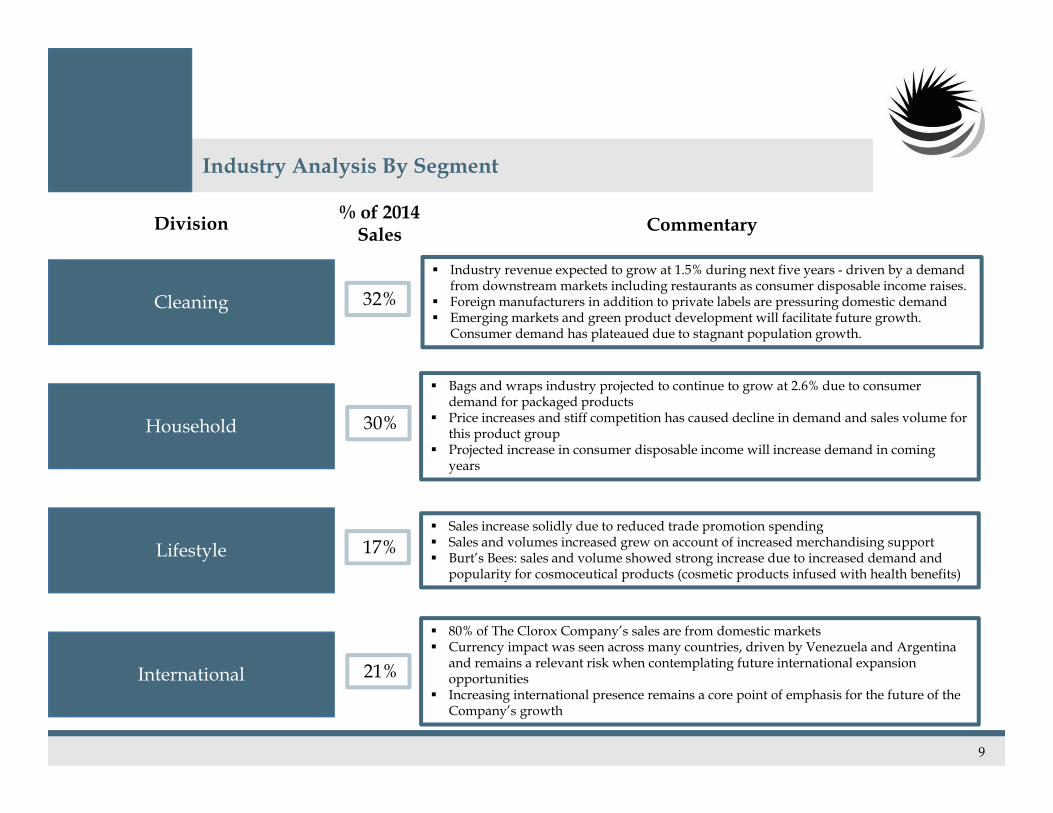
Cleaning
Household
Lifestyle
International
32%
21%
17%
30%
Industry revenue expected to grow at 1.5% during next five years - driven by a demand from downstream markets including restaurants as consumer disposable income raises.
Foreign manufacturers in addition to private labels are pressuring domestic demand Emerging markets and green product development will facilitate future growth.
Consumer demand has plateaued due to stagnant population growth.
Bags and wraps industry projected to continue to grow at 2.6% due to consumer demand for packaged products
Price increases and stiff competition has caused decline in demand and sales volume for this product group
Projected increase in consumer disposable income will increase demand in coming years
Sales increase solidly due to reduced trade promotion spending Sales and volumes increased grew on account of increased merchandising support Burt’s Bees: sales and volume showed strong increase due to increased demand and
popularity for cosmoceutical products (cosmetic products infused with health benefits)
80% of The Clorox Company’s sales are from domestic markets Currency impact was seen across many countries, driven by Venezuela and Argentina
and remains a relevant risk when contemplating future international expansion opportunities
Increasing international presence remains a core point of emphasis for the future of the Company’s growth
% of 2014 Sales CommentaryDivision
9
III. The Clorox Company Positioning

The Clorox Co. is a leading manufacturer and marketer of consumer and professional products.
Produces primarily premium products in mid-sized categories but have progressively been expanding into niche markets
Strong brands and high margins (>17% EBIT margins) Solid and stable cash flow Strong relationship with shareholders through payouts
(60+% payout ratio) Can accelerate profit growth with productivity gains
In recent years, inorganic growth has been stimulated through the purchase of professional medical healthcare companies to strengthen product offerings and expand industry expertise
• Acquired Caltech Industries in 2010, whose core product was DISPATCH hospital disinfectant spray, for $23M to enhance ability to create presence in this space
• Aplicare Inc. and Healthlink in 2012, combined purchase price of $80-90M
• In 2011, Acquired Barrow Riddell & Associates Inc. –provider of healthcare products as a bolt-on strategy
Company Positioning
Key Brands
OVERVIEW
Business Description
Acquisitions and Growth Sales Profile By Segment (FY 2014)
The majority (80%) of Clorox’s Brands are
#1 or #2 in their respective categories
Clorox’s weighted-average category growth is pulled
downwards, at 4.2%, since most sales are from Cleaning or
Household Products which are inherently slower-growth
categories
In recent years, the Lifestyle segment has
been the strongest
11
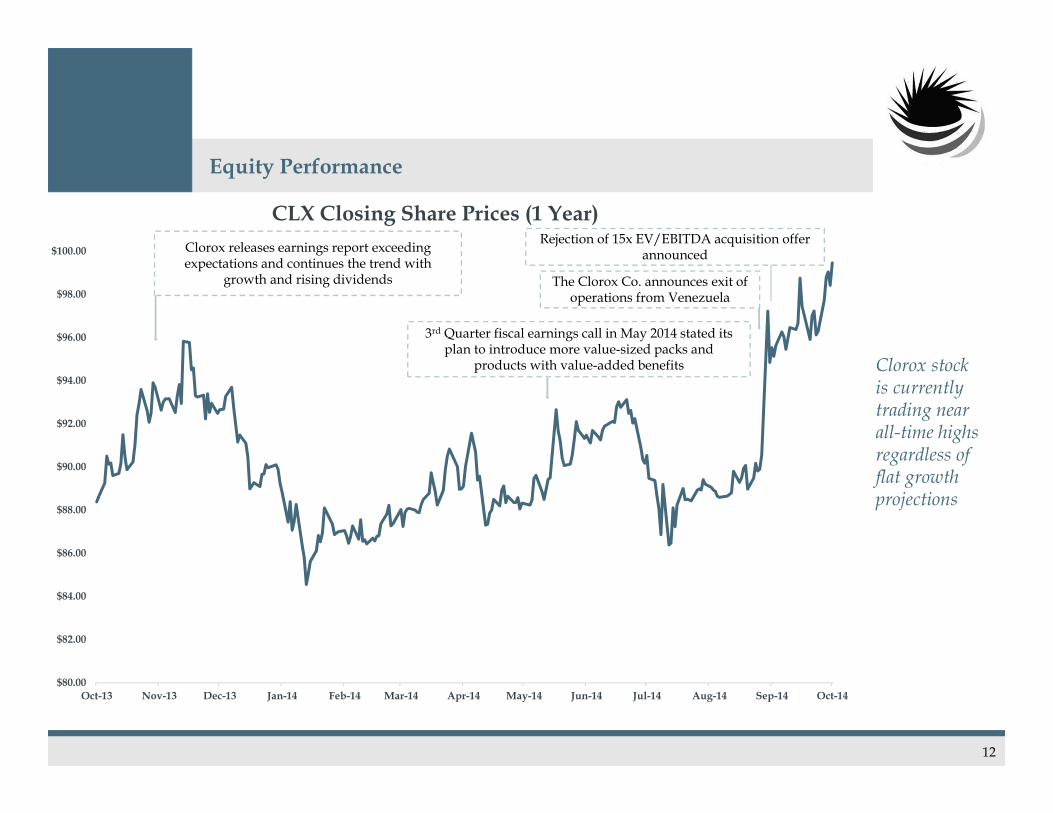
Equity Performance
$80.00
$82.00
$84.00
$86.00
$88.00
$90.00
$92.00
$94.00
$96.00
$98.00
$100.00
Oct-13 Nov-13 Dec-13 Jan-14 Feb-14 Mar-14 Apr-14 May-14 Jun-14 Jul-14 Aug-14 Sep-14 Oct-14
CLX Closing Share Prices (1 Year)Rejection of 15x EV/EBITDA acquisition offer
announcedClorox releases earnings report exceeding expectations and continues the trend with
growth and rising dividends The Clorox Co. announces exit of operations from Venezuela
3rd Quarter fiscal earnings call in May 2014 stated its plan to introduce more value-sized packs and
products with value-added benefits Clorox stock is currently trading near all-time highs regardless of flat growth projections
12
Corporate Strategy
2020 Strategy
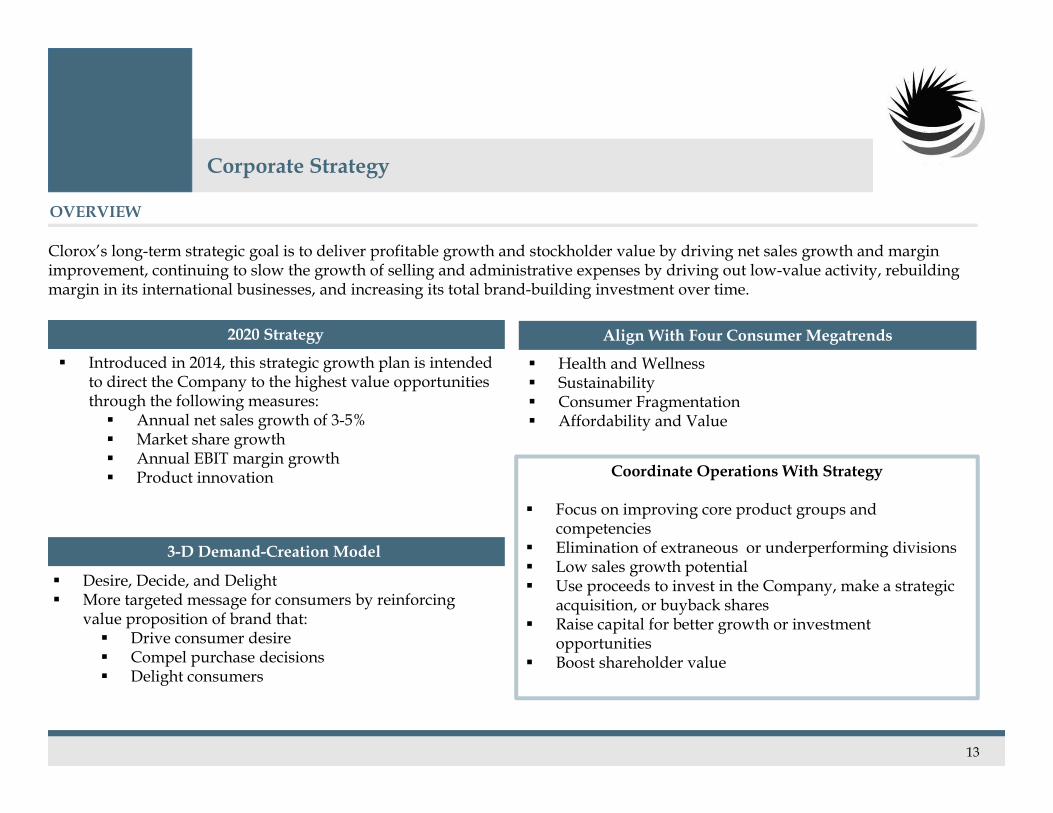
Introduced in 2014, this strategic growth plan is intended to direct the Company to the highest value opportunities through the following measures: Annual net sales growth of 3-5% Market share growth Annual EBIT margin growth Product innovation
Desire, Decide, and Delight More targeted message for consumers by reinforcing
value proposition of brand that: Drive consumer desire Compel purchase decisions Delight consumers
3-D Demand-Creation Model
Align With Four Consumer Megatrends
Health and Wellness Sustainability Consumer Fragmentation Affordability and Value
Clorox’s long-term strategic goal is to deliver profitable growth and stockholder value by driving net sales growth and margin improvement, continuing to slow the growth of selling and administrative expenses by driving out low-value activity, rebuilding margin in its international businesses, and increasing its total brand-building investment over time.
OVERVIEW
Coordinate Operations With Strategy
Focus on improving core product groups and competencies
Elimination of extraneous or underperforming divisions Low sales growth potential Use proceeds to invest in the Company, make a strategic
acquisition, or buyback shares Raise capital for better growth or investment
opportunities Boost shareholder value
13

IV. Strategic Options
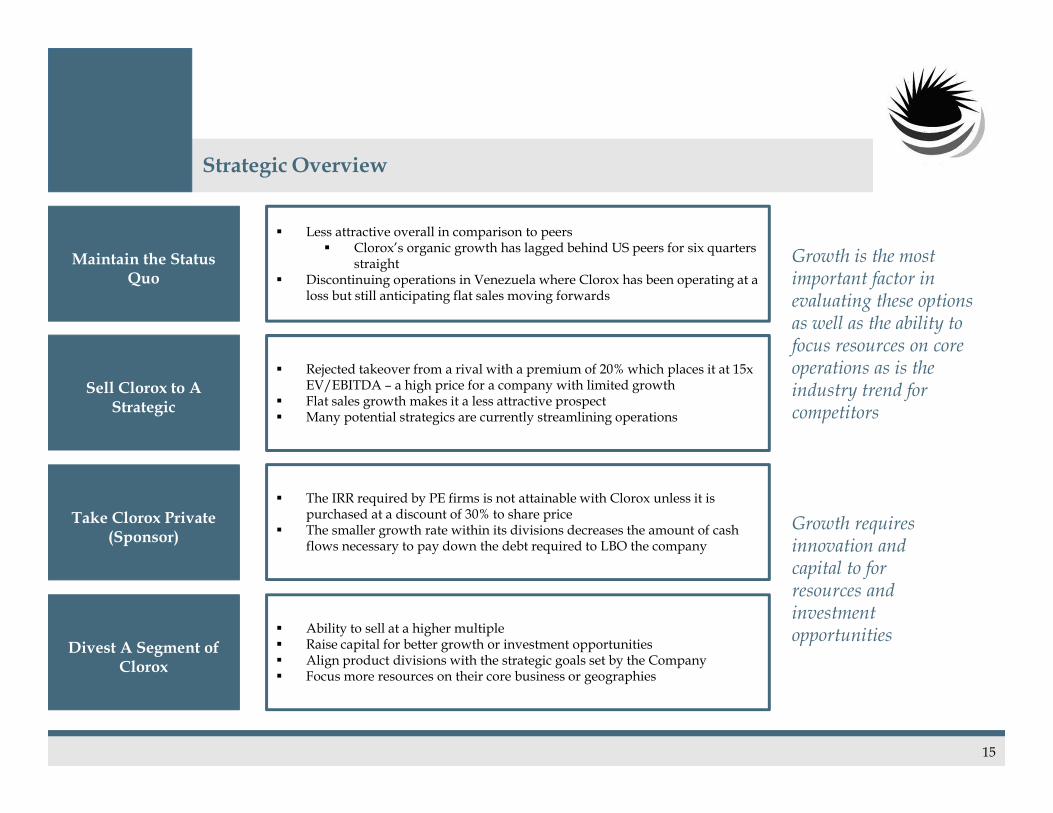
Less attractive overall in comparison to peers Clorox’s organic growth has lagged behind US peers for six quarters
straight Discontinuing operations in Venezuela where Clorox has been operating at a
loss but still anticipating flat sales moving forwards
Rejected takeover from a rival with a premium of 20% which places it at 15x EV/EBITDA – a high price for a company with limited growth
Flat sales growth makes it a less attractive prospect Many potential strategics are currently streamlining operations
The IRR required by PE firms is not attainable with Clorox unless it is purchased at a discount of 30% to share price
The smaller growth rate within its divisions decreases the amount of cash flows necessary to pay down the debt required to LBO the company
Maintain the Status Quo
Strategic Overview
Sell Clorox to A Strategic
Take Clorox Private (Sponsor)
Divest A Segment of Clorox
Ability to sell at a higher multiple Raise capital for better growth or investment opportunities Align product divisions with the strategic goals set by the Company Focus more resources on their core business or geographies
Growth is the most important factor in evaluating these options as well as the ability to focus resources on core operations as is the industry trend for competitors
Growth requires innovation and capital to for resources and investment opportunities
15

Strategic Proposal: Divestiture of Kingsford
The former Vice President of Investor Relations of Clorox said in the company’s earningscall in August, “We delivered three percentage points of top-line growth from innovationfor the third consecutive fiscal year, consistent with our long-term strategic target.”
Raise capital for future investment opportunities and growth initiatives
Streamline operations for increased focus on core competencies
Anticipate trends and align operations to acquire full possible value
Coordinate operations with managerial vision to accomplish financial and strategic objectives
the development of new products and categories remains important to growth in the consumer products industry
Operational Rationale Strategic RationaleFinancial Rationale
Potential for high multiple because Kingsford has the highest market share in the sector Anticipated increase of margins
due to lower input prices as a result of the decreasing price of oil
High expected synergies with the companies involved in the targeted auction process
Brand name value Anticipated Selling Multiple:
16.0x Anticipated Selling Price: $1.5
Billion
Innovation keeps consumers from defecting to less expensive private label products that do not have the same features and may benefit from the consumer trend of trading up to better products that cost more
Increase value to company through the following measures: Return proceeds to
shareholders Buyback shares Acquire company to continue
expansion of lifestyle segment which has the highest projected growth
16
We recommend The Clorox Company divest the Kingsford brand due to the rich multiple to raise capital to pursue additional growth opportunities and to better align the Company with the four consumer megatrends.
Note: DCF Valuation of Kingsford on page 32

17
Recommended Acquirers of Kingsford
Energy and manufacturing conglomerate based in Wichita, KA Manufactures a wide variety of products including: transportation fuels, building and
consumer products, electronic connectors, membrane filtration and more Although Koch is a private company, it has underwent a recent string of acquisitions
(PetroLogistics, Buckeye Technologies, Molex) and has demonstrated interest in continuing the trend and turning the company into a privately held version of Berkshire Hathaway
Koch will be able to utilize the acquisition of Kingsford to further penetrate the consumer space
2013 EBITDA: $9,695.0M Leverage Ratio: 1.8x Debt/EBITDA Recent acquisitions of Duracell and and Heinz indicate a strong appetite for consumer
goods brands Historically has a strong preference for brands with a strong market share in shrinking
overall markets
Berkshire is looking into penetrating the consumer space further and would benefit from Kingsford’s market dominance
BDT Capital acquired Weber for $65 million equity and $150 debt for a majority stake in the company
BDT has also advised on the Alberto Culver sale to Unilever (significant experience in the consumer products industry)
An attractive staple-on to the Weber acquisition
Weber will reap the natural synergies of the of vertical integration in the niche charcoal market
Infeasibility of Maintaining the Status Quo
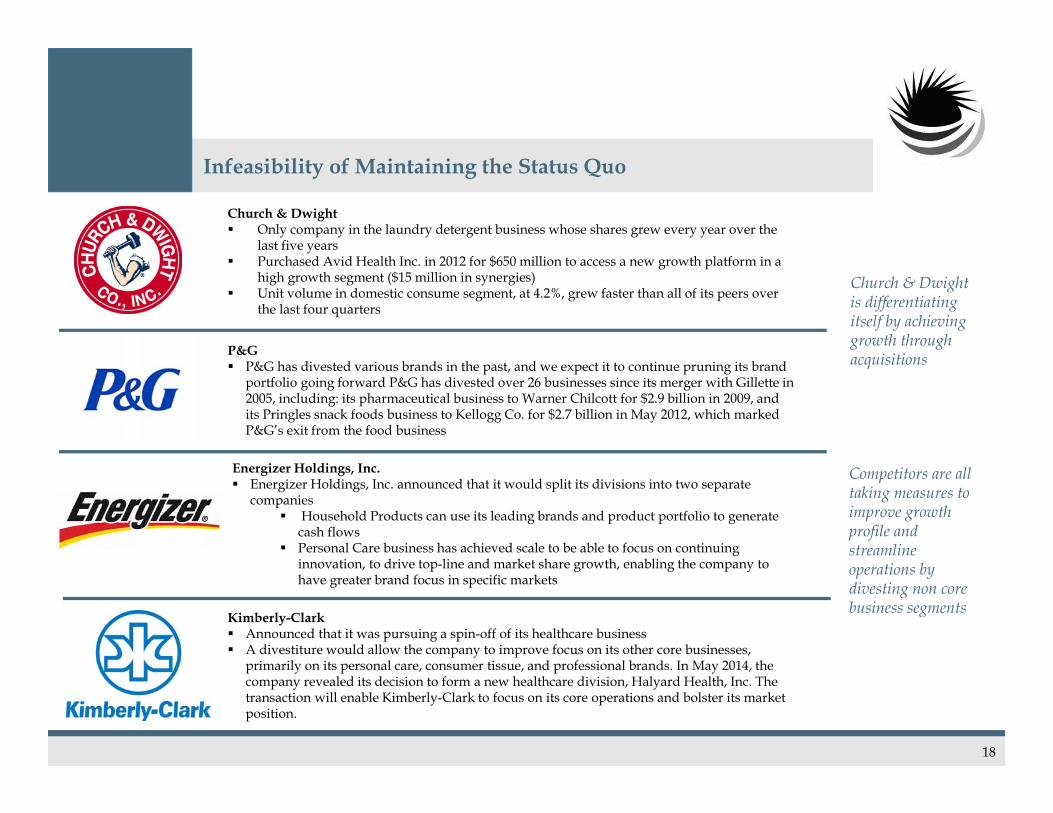
Church & Dwight Only company in the laundry detergent business whose shares grew every year over the
last five years Purchased Avid Health Inc. in 2012 for $650 million to access a new growth platform in a
high growth segment ($15 million in synergies) Unit volume in domestic consume segment, at 4.2%, grew faster than all of its peers over
the last four quarters
P&G P&G has divested various brands in the past, and we expect it to continue pruning its brand
portfolio going forward P&G has divested over 26 businesses since its merger with Gillette in 2005, including: its pharmaceutical business to Warner Chilcott for $2.9 billion in 2009, and its Pringles snack foods business to Kellogg Co. for $2.7 billion in May 2012, which marked P&G’s exit from the food business
Kimberly-Clark Announced that it was pursuing a spin-off of its healthcare business A divestiture would allow the company to improve focus on its other core businesses,
primarily on its personal care, consumer tissue, and professional brands. In May 2014, the company revealed its decision to form a new healthcare division, Halyard Health, Inc. The transaction will enable Kimberly-Clark to focus on its core operations and bolster its market position.
Competitors are all taking measures to improve growth profile and streamline operations by divesting non core business segments
Energizer Holdings, Inc. Energizer Holdings, Inc. announced that it would split its divisions into two separate
companies Household Products can use its leading brands and product portfolio to generate
cash flows Personal Care business has achieved scale to be able to focus on continuing
innovation, to drive top-line and market share growth, enabling the company to have greater brand focus in specific markets
18
Church & Dwight is differentiating itself by achieving growth through acquisitions

Divergence of Clorox from the Ideal Strategic Target
Revenue Synergies Cost Synergies
Enhanced Growth Initiatives
Consolidation of overlapping facilities and headcount reduction
Ability to sell products through distribution channels without cannibalizing the original product base
Ability to buy key inputs at lower prices due to increased purchasing power
Ability to Leverage target’s technology, geographic presence, or know-how to enhance or expand its existing product or
service offering
Seek to acquire a target that sells through the professional or contractor channel so as to expand its paths to market
Increased size enhances a company’s ability to leverage its fixed cost base across existing and new products
Better Terms from suppliers due to larger volume orders -“purchasing synergies”
Value Creation
19
Buyer MotivationThe Clorox Company is experiencing flat sales growth and has already implemented effective cost minimizing measures so the prospect of revenue and cost synergies are reduced
Diverse product base and sheer size make The Clorox Company a difficult acquisition target in terms of integration and purchase
price

Strategic Buyers
Consumer Products Company focused on food and healthcare 30% + Market Share in margarine 14 Brands over $1 Billion – Axe, Dove, Lipton, etc. Divesting itself of food under current management
A Consumer Products company, maintains segments as diverse as food and outdoor goods.
Focus on four segments: Outdoor Solutions, Branded Consumables, Consumer solutions, and Adio Footwear
Largest Consumer Products company in the world 26 Brands over $1 Billion – Bounty, Tide, Crest, etc. Currently divesting itself of 100 of its 180 brands to refocus on revenue
generating lines
Household goods company specializing in cleaners and personal care 26 Brands over $1 Billion – Bounty, Tide, Crest, etc. Currently divesting itself of 100 of its 180 brands to refocus on revenue
generating lines
20
Share Price: $45.76LTM Revenue: $8,065Enterprise Value: $13,193
Share Price: $89.55LTM Revenue: $82,649Enterprise Value: $268,439
Share Price: $71.22LTM Revenue: $3,218Enterprise Value: $10,360
Share Price: $3,233.75LTM Revenue: $61,481Enterprise Value: $127,124
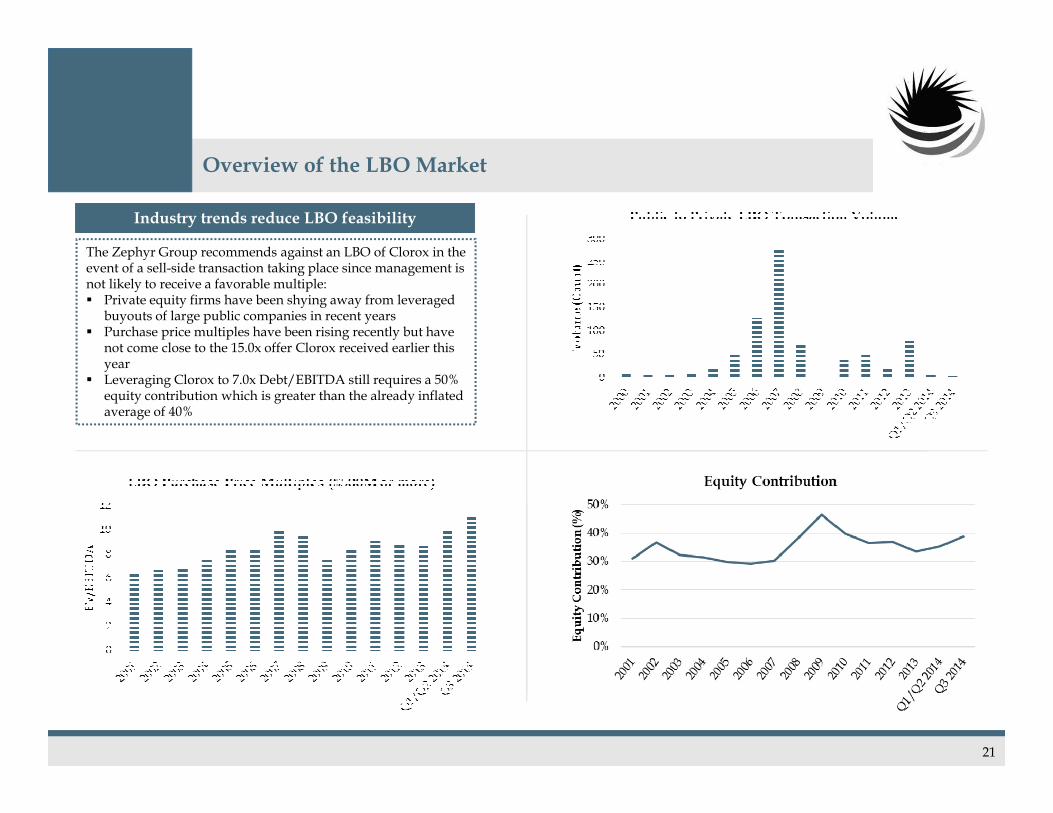
Overview of the LBO Market
The Zephyr Group recommends against an LBO of Clorox in the event of a sell-side transaction taking place since management is not likely to receive a favorable multiple: Private equity firms have been shying away from leveraged
buyouts of large public companies in recent years Purchase price multiples have been rising recently but have
not come close to the 15.0x offer Clorox received earlier this year
Leveraging Clorox to 7.0x Debt/EBITDA still requires a 50% equity contribution which is greater than the already inflated average of 40%
Industry trends reduce LBO feasibility
21
Financial Sponsors
They strive to create value by investing in great businesses where their capital, strategic insight, global relationships and operational support can drive transformation and realize the company’s potential.
The resulting improvements in growth and global competitiveness benefit not only investors, but also workers, communities and all stakeholders.
Contains strong relationships with potential strategic partners. Well positioned to invest with families and founders who built businesses and seeking partial liquidity /
transition to new ownership and management to allow for accelerated growth. Several unique resources: Global presence, footprint, tight sector focus, expertise, strategic advice to
accelerate growth partnership approach - allow management team to operate business as significant shareholders
The Carlyle Group is a global asset manager with more than $203 billion in assets under management Operating in 40 offices in North America, South America, Europe, the Middle East, North Africa, Sub-
Saharan Africa, Japan, Asia and Australia. Through an array of products and geographic specific-funds, we work to meet the dynamic needs of the
world’s most sophisticated investors. Expertise and deep industry knowledge - Invest in sectors we know, and value depth over breadth
Opportunity to utilize expertise across multiple geographical regions. partnering with management to grow the company.
Currently growing both organically and through acquisitions Can utilize the seasoned M&A team. In-house operations will be able to help create a more efficient process in the United States. Good amount
of industry experts that will be able to help management increase effectiveness and restructure their team.
22

V. Financial Analysis
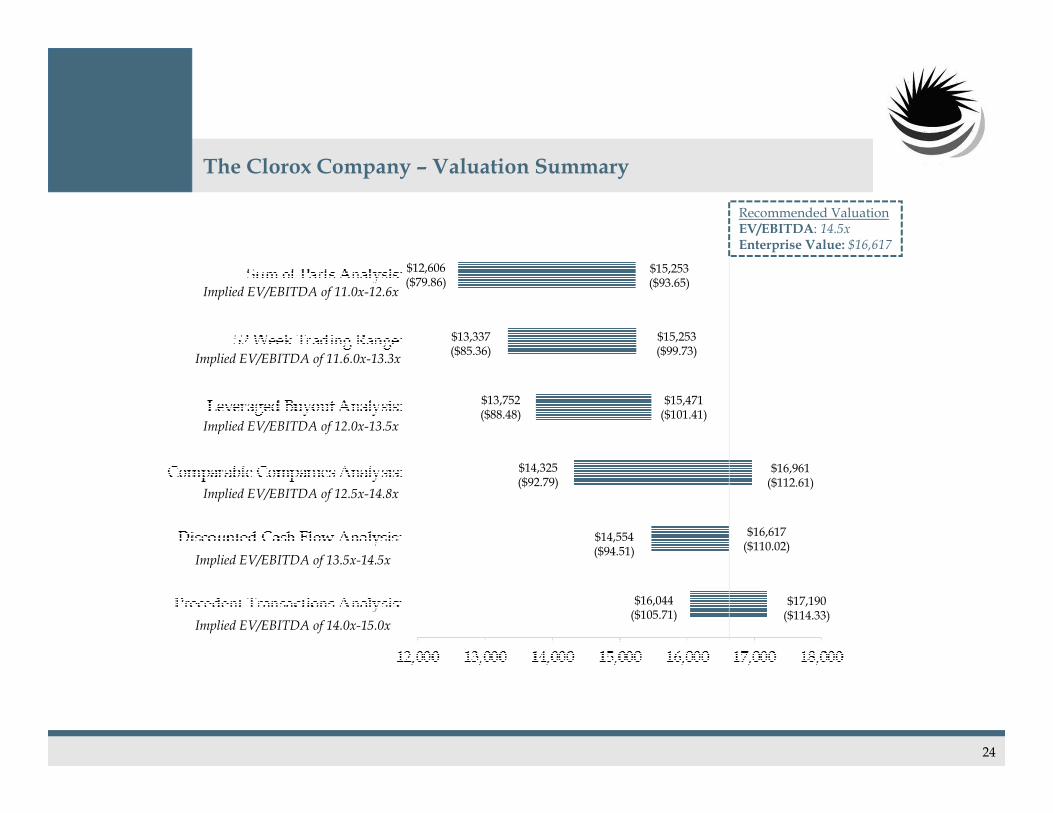
The Clorox Company – Valuation Summary
Implied EV/EBITDA of 14.0x-15.0x
Implied EV/EBITDA of 13.5x-14.5x
Implied EV/EBITDA of 11.6.0x-13.3x
Implied EV/EBITDA of 12.5x-14.8x
Implied EV/EBITDA of 12.0x-13.5x
Implied EV/EBITDA of 11.0x-12.6x
$15,253($93.65)
$13,337($85.36)
$15,253($99.73)
$15,471($101.41)
$16,961($112.61)
$16,617($110.02)
$17,190($114.33)
$16,044 ($105.71)
$14,554($94.51)
$14,325($92.79)
$13,752($88.48)
$12,606($79.86)
Recommended ValuationEV/EBITDA: 14.5xEnterprise Value: $16,617
24

The Clorox Company - Discounted Cash Flow Analysis
2012A 2013A 2014A 2015E 2016E 2017E 2018E 2019ESales $5,468.0 $5,263.0 $5,591.0 $5,561.0 $5,727.0 $5,898.0 $6,074.9 $6,257.1 % Growth N/A (3.7%) 5.9% (0.5%) 3.0% 3.0% 3.0% 3.0%Cost of Sales 3001.0 3038.0 3231.0 3180.0 3262.0 3361.8 3462.7 3566.6 % of Sales 54.9% 57.7% 57.8% 57.2% 57.0% 57.0% 57.0% 57.0%Gross Profit $2,467.0 $2,225.0 $2,360.0 $2,381.0 $2,465.0 $2,536.1 $2,612.2 $2,690.6SG&A 1401.0 1437.0 1394.0 1402.0 1432.0 1474.7 1519.0 1564.6 % of Sales 25.6% 27.3% 24.9% 25.2% 25.0% 25.0% 25.0% 25.0%EBITDA $1,244.0 $970.0 $1,146.0 $0.0 $1,157.0 $1,216.0 $1,256.0 $1,293.7 $1,332.5 % Margin 19.5% 15.0% 17.3% 17.6% 18.0% 18.0% 18.0% 18.0%Depreciation & Amortization 178.0 182.0 180.0 178.0 183.0 194.6 200.5 206.5EBIT $1,066.0 $788.0 $966.0 $979.0 $1,033.0 $1,061.4 $1,093.2 $1,126.0Taxes/(Benefit) 35.0% 248.0 279.0 299.0 342.7 361.6 371.5 382.6 394.1EBIAT $818.0 $509.0 $667.0 $0.0 $636.4 $671.5 $689.9 $710.6 $731.9Plus: Depreciation & Amortization 178.0 182.0 180.0 178.0 183.0 194.6 200.5 206.5Less: Capex 192.0 194.0 138.0 166.8 171.8 176.9 182.2 187.7 % of Sales 3.5% 3.7% 2.5% 3.0% 3.0% 3.0% 3.0% 3.0%Less: Increase/(Decrease) in NWC 20.6 -1.5 -28.4 -3.9 -4.0Unlevered Free Cash Flow $626.9 $684.1 $736.0 $732.7 $754.7WACC 6.0% 6.0% 6.0% 6.0% 6.0%Discount Period 0.5 1.5 2.5 3.5 4.5Discount Factor 0.97 0.92 0.86 0.81 0.77Present Value of Free Cash Flows $608.8 $626.6 $635.8 $597.0 $580.0
Historical Period Projection Period Enterprise ValuePresent Value of FCF $3,048.2
Terminal ValueTerminal Year EBITDA 1,126.0Exit Multiple 14.0x Terminal Value 15,764.2Discount Factor 0.77 Present Value of Terminal Value 12,114.4 % of Enterprise Value 79.9%
Enterprise Value $15,162.6
Implied EV / EBITDAEnterprise Value 15,162.62014A EBITDA 1,146.0
Implied EV / EBITDA 13.2x
The calculation of the implied share price of The Clorox Company illustrates that it is currently trading at a
price reflecting its intrinsic value.
Implied Equity Value and Share PriceEnterprise Value $15,162.6Less: Total Debt 2,313.0Less: Preferred Stock 0.0Less: Noncontrolling Interest 0.0Plus: Cash and Cash Equivalents 329.0
Implied Equity Value 13,178.6Fully Diluted Shares Outstanding 133.000 Implied Share Price $99.09
Implied Perpetuity Growth RateTerminal Year Free Cash Flow 754.7WACC 6.0%Terminal Value 15,764.2
Implied Perpetuity Growth Rate 1.0%
25

The Clorox Company - Comparable Companies Analysis
Tier 1 peers represent the comprehensive consumer products companies who compete directly with The Clorox Company for shelf space and consumer loyalty
Tier 2 peers are large blue-chip companies that share slots in the major indices with The Clorox Company
Share % of 52wk Equity EnterprisePrice High Value Value 2015E 2016E 2015E 2016E 2015E 2016E
Clorox $99.47 99.7% $13,256 $15,240 13.5x 12.6x 22.5x 21.2x 3.5x 3.3x
P/E PEGEV/EBITDA
Tier 1 PeersProcter & Gamble $85.16 99.1% $245,942 $269,439 14.2x 12.9x 19.4x 17.9x 2.3x 2.1xUnilever $38.69 87.6% $112,640 $127,400 12.4x 13.5x 23.0x 21.4x 2.9x 2.7xColgate-Palmolive $65.35 93.2% $60,508 $65,518 14.7x 12.8x 21.5x 19.7x 2.5x 2.3xReckitt Benckiser $80.10 89.9% $58,567 $62,069 14.4x 13.7x 18.9x 18.2xKimblerly-Clark $113.10 98.8% $42,514 $48,015 11.5x 10.6x 18.6x 17.7x 2.8x 2.6xChurch & Dwight $71.22 99.9% $9,779 $10,360 14.8x 12.7x 22.4x 20.3x 2.2x 2.0xEnergizer $120.60 95.9% $7,525 $8,778 11.0x 9.6x 16.3x 15.3x 2.6x 2.4x
Mean 94.9% 13.3x 12.3x 20.0x 18.6x 2.5x 2.4xMedian 95.9% 14.2x 12.8x 19.4x 18.2x 2.5x 2.3xHigh 99.9% 14.8x 13.7x 23.0x 21.4x 2.9x 2.7xLow 87.6% 11.0x 9.6x 16.3x 15.3x 2.2x 2.0x
Tier 2 PeersCoca-Cola $41.03 91.4% $182,378 $190,132 14.4x 14.0x 19.8x 18.9x 5.5x 5.3xPepsico $94.60 98.3% $144,265 $162,134 9.7x 11.7x 19.9x 18.5x 2.5x 2.3xKraft $56.83 93.0% $34,098 $42,736 9.2x 10.6x 17.3x 16.1x 2.1x 2.0xGeneral Mills $51.03 91.7% $32,103 $40,555 12.1x 10.8x 17.0x 15.9x 2.5x 2.3xEstee Lauder $74.35 95.7% $29,004 $28,732 13.0x 11.7x 24.9x 20.8x 2.7x 2.2xKellogg $61.94 89.1% $22,422 $29,687 8.4x 10.6x 15.5x 14.8x 2.7x 2.6xHershey $94.13 86.6% $21,177 $22,574 14.3x 11.9x 22.1x 20.1x 2.2x 2.0xCampbell Soup $43.17 92.5% $13,642 $17,413 11.2x 10.8x 17.4x 16.6x 4.7x 4.5xMolson Coors $73.23 94.2% $13,613 $14,284 17.1x 9.5x 17.0x 16.5x 3.0x 2.9xAvon $11.48 50.2% $4,989 $6,830 14.9x 6.8x 13.3x 11.6x 3.4x 3.0x
Mean 88.3% 12.4x 10.8x 18.4x 17.0x 3.1x 2.9xMedian 92.1% 12.5x 10.8x 17.4x 16.6x 2.7x 2.5xHigh 98.3% 17.1x 14.0x 24.9x 20.8x 5.5x 5.3xLow 50.2% 8.4x 6.8x 13.3x 11.6x 2.1x 2.0x
26
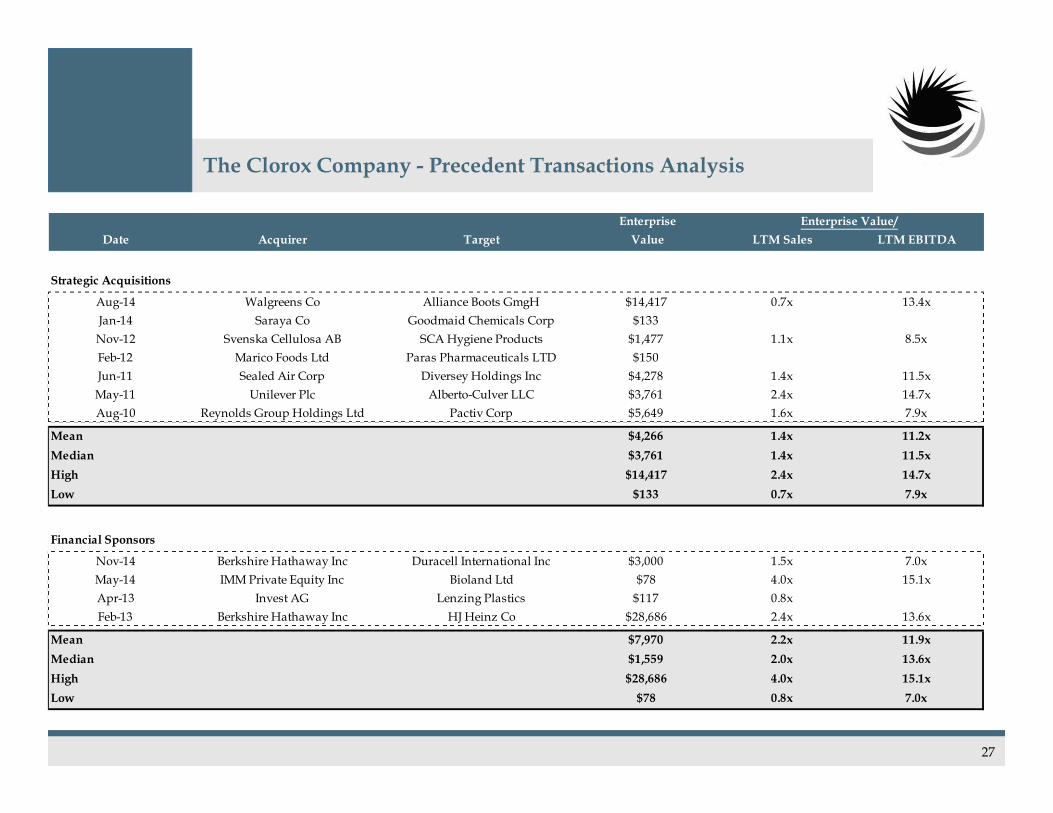
The Clorox Company - Precedent Transactions Analysis
Enterprise Enterprise Value/Date Acquirer Target Value LTM Sales LTM EBITDA
Strategic Acquisitions
Aug-14 Walgreens Co Alliance Boots GmgH $14,417 0.7x 13.4xJan-14 Saraya Co Goodmaid Chemicals Corp $133Nov-12 Svenska Cellulosa AB SCA Hygiene Products $1,477 1.1x 8.5xFeb-12 Marico Foods Ltd Paras Pharmaceuticals LTD $150Jun-11 Sealed Air Corp Diversey Holdings Inc $4,278 1.4x 11.5xMay-11 Unilever Plc Alberto-Culver LLC $3,761 2.4x 14.7xAug-10 Reynolds Group Holdings Ltd Pactiv Corp $5,649 1.6x 7.9x
Mean $4,266 1.4x 11.2xMedian $3,761 1.4x 11.5xHigh $14,417 2.4x 14.7xLow $133 0.7x 7.9x
Financial Sponsors
Nov-14 Berkshire Hathaway Inc Duracell International Inc $3,000 1.5x 7.0xMay-14 IMM Private Equity Inc Bioland Ltd $78 4.0x 15.1xApr-13 Invest AG Lenzing Plastics $117 0.8xFeb-13 Berkshire Hathaway Inc HJ Heinz Co $28,686 2.4x 13.6x
Mean $7,970 2.2x 11.9xMedian $1,559 2.0x 13.6xHigh $28,686 4.0x 15.1xLow $78 0.8x 7.0x
27

The Clorox Company - Sum of Parts Analysis
Product Division EBITDA EV/EBITDA Division ValuationGlad Global $231.0 12.6x $2,907.1Food Global $198.0 10.0x $1,972.9Burt's Bees $38.0 12.6x $478.4Brita Global $97.0 12.5x $1,214.6Miscellaneous $598.0 13.3x $7,937.4
Enterprise Value $14,510.37
20%
14%
3%8%
55%
Glad Global
Food Global
Burt's Bees
Brita Global
Miscellaneous
Analysis of significance
Weight of Division Valuation
Based on average EV/EBITDA segment multiples, the combined enterprise value of The Clorox Company is $14,510.37
28
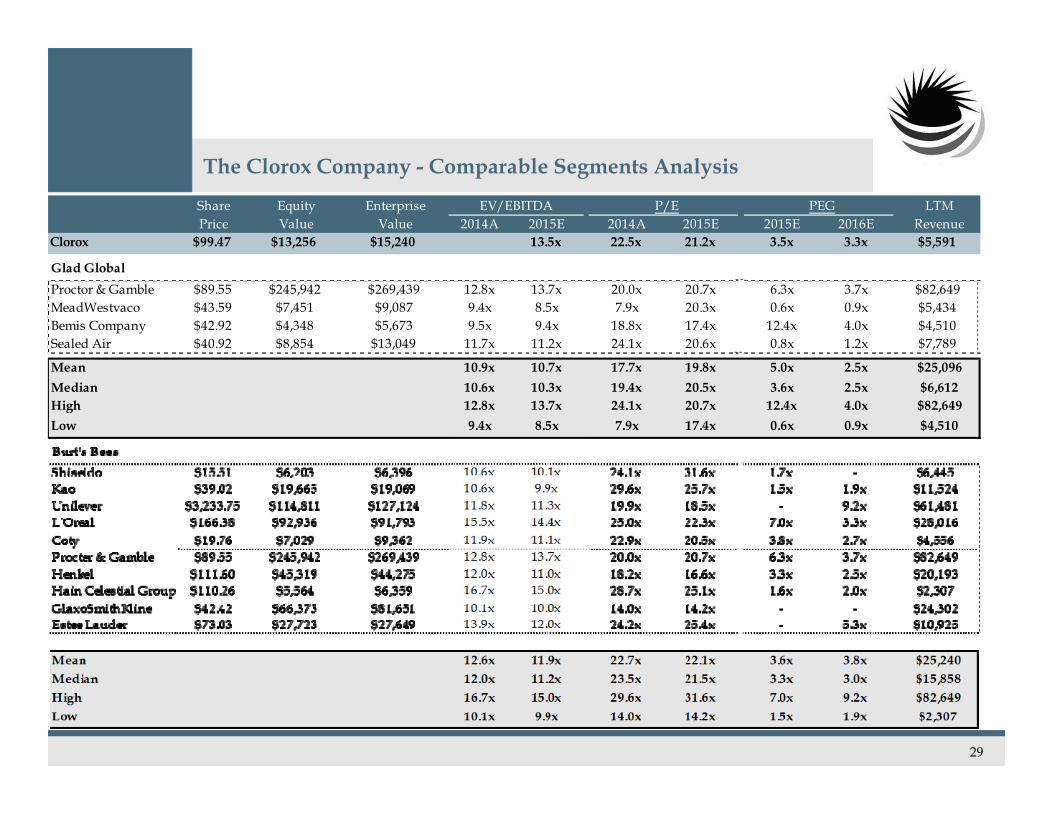
The Clorox Company - Comparable Segments Analysis
Share Equity Enterprise P/E PEG LTMPrice Value Value 2014A 2015E 2014A 2015E 2015E 2016E Revenue
Clorox $99.47 $13,256 $15,240 13.5x 22.5x 21.2x 3.5x 3.3x $5,591
EV/EBITDA
Glad GlobalProctor & Gamble $89.55 $245,942 $269,439 12.8x 13.7x 20.0x 20.7x 6.3x 3.7x $82,649MeadWestvaco $43.59 $7,451 $9,087 9.4x 8.5x 7.9x 20.3x 0.6x 0.9x $5,434Bemis Company $42.92 $4,348 $5,673 9.5x 9.4x 18.8x 17.4x 12.4x 4.0x $4,510Sealed Air $40.92 $8,854 $13,049 11.7x 11.2x 24.1x 20.6x 0.8x 1.2x $7,789
Mean 10.9x 10.7x 17.7x 19.8x 5.0x 2.5x $25,096Median 10.6x 10.3x 19.4x 20.5x 3.6x 2.5x $6,612High 12.8x 13.7x 24.1x 20.7x 12.4x 4.0x $82,649Low 9.4x 8.5x 7.9x 17.4x 0.6x 0.9x $4,510
29
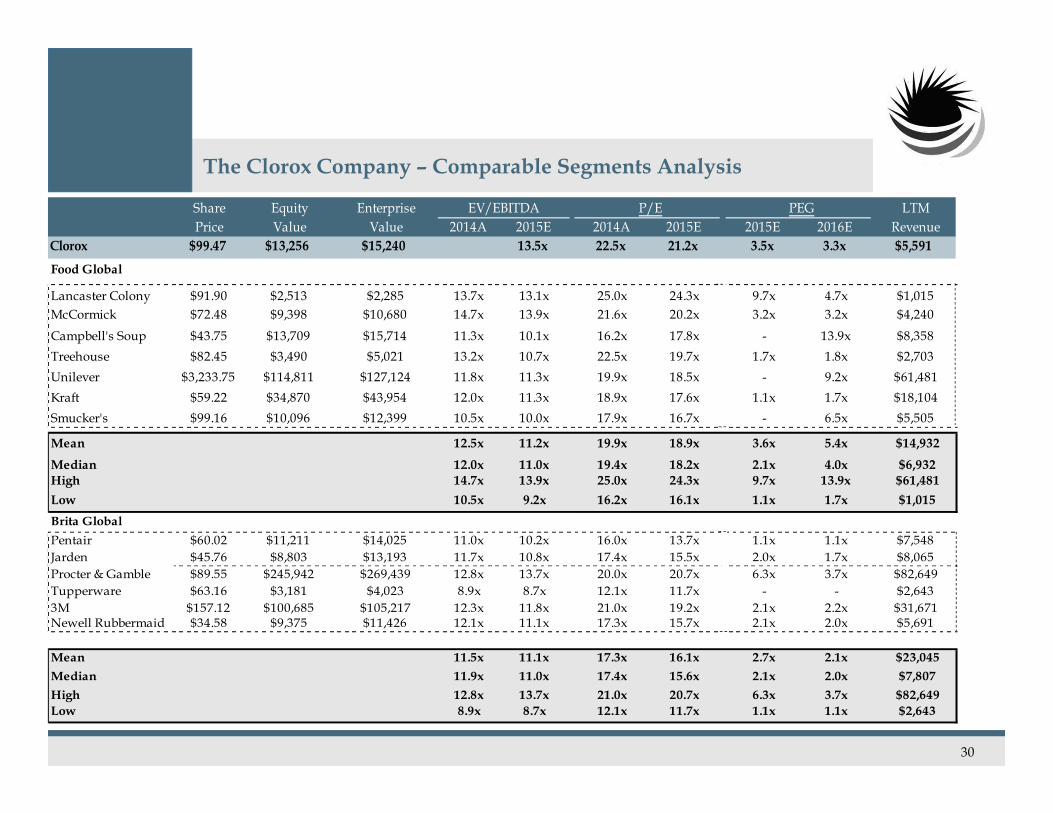
The Clorox Company – Comparable Segments Analysis
Share Equity Enterprise P/E PEG LTMPrice Value Value 2014A 2015E 2014A 2015E 2015E 2016E Revenue
Clorox $99.47 $13,256 $15,240 13.5x 22.5x 21.2x 3.5x 3.3x $5,591
EV/EBITDA
Brita GlobalPentair $60.02 $11,211 $14,025 11.0x 10.2x 16.0x 13.7x 1.1x 1.1x $7,548Jarden $45.76 $8,803 $13,193 11.7x 10.8x 17.4x 15.5x 2.0x 1.7x $8,065Procter & Gamble $89.55 $245,942 $269,439 12.8x 13.7x 20.0x 20.7x 6.3x 3.7x $82,649Tupperware $63.16 $3,181 $4,023 8.9x 8.7x 12.1x 11.7x - - $2,6433M $157.12 $100,685 $105,217 12.3x 11.8x 21.0x 19.2x 2.1x 2.2x $31,671Newell Rubbermaid $34.58 $9,375 $11,426 12.1x 11.1x 17.3x 15.7x 2.1x 2.0x $5,691
Mean 11.5x 11.1x 17.3x 16.1x 2.7x 2.1x $23,045Median 11.9x 11.0x 17.4x 15.6x 2.1x 2.0x $7,807High 12.8x 13.7x 21.0x 20.7x 6.3x 3.7x $82,649Low 8.9x 8.7x 12.1x 11.7x 1.1x 1.1x $2,643
Food Global
Lancaster Colony $91.90 $2,513 $2,285 13.7x 13.1x 25.0x 24.3x 9.7x 4.7x $1,015McCormick $72.48 $9,398 $10,680 14.7x 13.9x 21.6x 20.2x 3.2x 3.2x $4,240
Campbell's Soup $43.75 $13,709 $15,714 11.3x 10.1x 16.2x 17.8x - 13.9x $8,358Treehouse $82.45 $3,490 $5,021 13.2x 10.7x 22.5x 19.7x 1.7x 1.8x $2,703Unilever $3,233.75 $114,811 $127,124 11.8x 11.3x 19.9x 18.5x - 9.2x $61,481Kraft $59.22 $34,870 $43,954 12.0x 11.3x 18.9x 17.6x 1.1x 1.7x $18,104Smucker's $99.16 $10,096 $12,399 10.5x 10.0x 17.9x 16.7x - 6.5x $5,505
Mean 12.5x 11.2x 19.9x 18.9x 3.6x 5.4x $14,932Median 12.0x 11.0x 19.4x 18.2x 2.1x 4.0x $6,932High 14.7x 13.9x 25.0x 24.3x 9.7x 13.9x $61,481Low 10.5x 9.2x 16.2x 16.1x 1.1x 1.7x $1,015
30
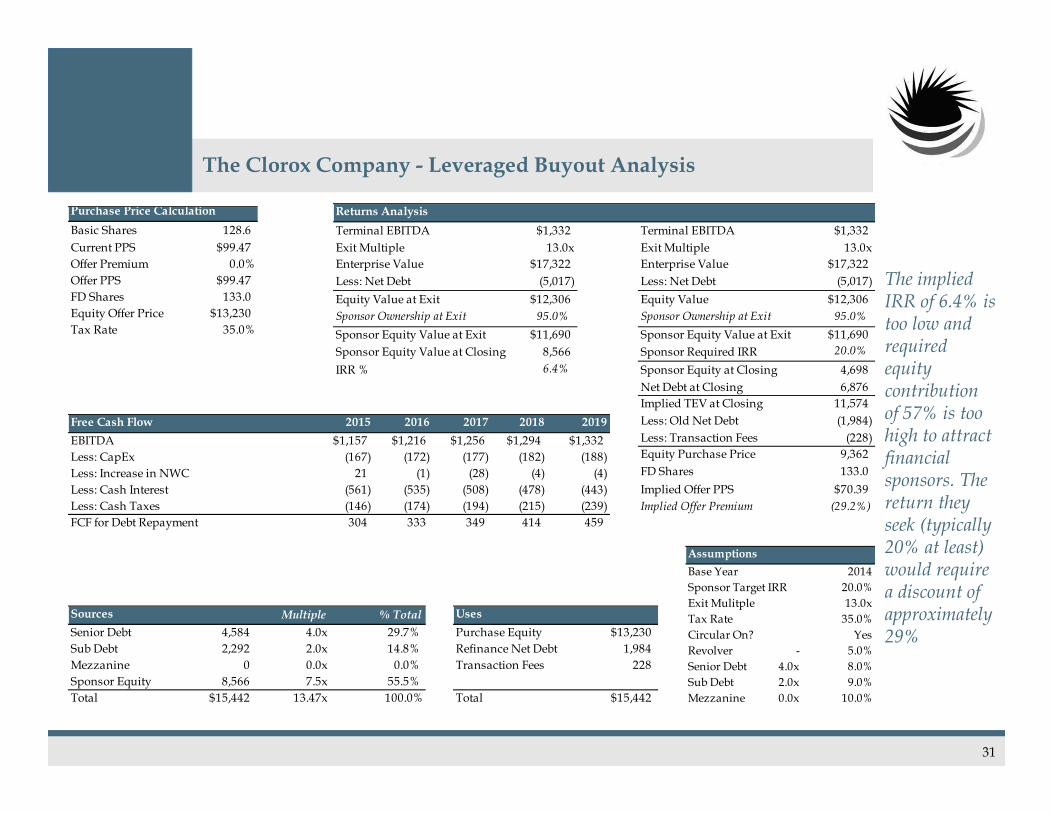
The Clorox Company - Leveraged Buyout Analysis
Free Cash Flow 2015 2016 2017 2018 2019EBITDA $1,157 $1,216 $1,256 $1,294 $1,332Less: CapEx (167) (172) (177) (182) (188)Less: Increase in NWC 21 (1) (28) (4) (4)Less: Cash Interest (561) (535) (508) (478) (443)Less: Cash Taxes (146) (174) (194) (215) (239)FCF for Debt Repayment 304 333 349 414 459
Sources Multiple % TotalSenior Debt 4,584 4.0x 29.7%Sub Debt 2,292 2.0x 14.8%Mezzanine 0 0.0x 0.0%Sponsor Equity 8,566 7.5x 55.5%Total $15,442 13.47x 100.0%
UsesPurchase Equity $13,230Refinance Net Debt 1,984Transaction Fees 228
Total $15,442
Purchase Price CalculationBasic Shares 128.6Current PPS $99.47Offer Premium 0.0%Offer PPS $99.47FD Shares 133.0Equity Offer Price $13,230Tax Rate 35.0%
AssumptionsBase Year 2014Sponsor Target IRR 20.0%Exit Mulitple 13.0xTax Rate 35.0%Circular On? YesRevolver - 5.0%Senior Debt 4.0x 8.0%Sub Debt 2.0x 9.0%Mezzanine 0.0x 10.0%
Returns AnalysisTerminal EBITDA $1,332 Terminal EBITDA $1,332Exit Multiple 13.0x Exit Multiple 13.0xEnterprise Value $17,322 Enterprise Value $17,322Less: Net Debt (5,017) Less: Net Debt (5,017)Equity Value at Exit $12,306 Equity Value $12,306Sponsor Ownership at Exit 95.0% Sponsor Ownership at Exit 95.0%Sponsor Equity Value at Exit $11,690 Sponsor Equity Value at Exit $11,690Sponsor Equity Value at Closing 8,566 Sponsor Required IRR 20.0%IRR % 6.4% Sponsor Equity at Closing 4,698
Net Debt at Closing 6,876Implied TEV at Closing 11,574Less: Old Net Debt (1,984)Less: Transaction Fees (228)Equity Purchase Price 9,362FD Shares 133.0Implied Offer PPS $70.39Implied Offer Premium (29.2%)
The implied IRR of 6.4% is too low and required equity contribution of 57% is too high to attract financial sponsors. The return they seek (typically 20% at least) would require a discount of approximately 29%
31

Charcoal Division – Discounted Cash Flow Analysis
Projection Period2014A 2015E 2016E 2017E 2018E 2019E
Revenue $559.1 $556.1 $572.7 $589.8 $607.5 $625.7 % Growth N/A (0.5%) 3.0% 3.0% 3.0% 3.0%Cost of Sales 323.1 318.0 326.2 336.2 346.3 356.7 % of Sales 57.8% 57.2% 57.0% 57.0% 57.0% 57.0%Gross Profit $236.0 $238.1 $246.5 $253.6 $261.2 $269.1SG&A 139.4 140.2 143.2 147.5 151.9 156.5 % of Revenue 24.9% 25.2% 25.0% 25.0% 25.0% 25.0%EBITDA $96.6 $97.9 $103.3 $106.1 $109.3 $112.6 % Margin 17.3% 17.6% 18.0% 18.0% 18.0% 18.0%Depreciation & Amortization 18.0 17.8 18.3 19.5 20.0 20.6EBIT $78.6 $80.1 $85.0 $86.7 $89.3 $92.0Taxes/(Benefit) 35.0% 29.9 28.0 29.8 30.3 31.2 32.2EBIAT $48.7 $52.1 $55.3 $56.3 $58.0 $59.8Plus: Depreciation & Amortization 18.0 17.8 18.3 19.5 20.0 20.6Less: Capex 13.8 16.7 17.2 17.7 18.2 18.8Less: Increase/(Decrease) in NWC 2.1 (0.1) (2.8) (0.4) (0.4)Unlevered Free Cash Flow $51.1 $56.5 $60.9 $60.2 $62.0WACC 6.0% 6.0% 6.0% 6.0% 6.0%Discount Period 0.5 1.5 2.5 3.5 4.5Discount Factor 0.97 0.92 0.86 0.81 0.77Present Value of Free Cash Flows $49.6 $51.8 $52.7 $49.1 $47.7
Enterprise ValuePresent Value of FCF $250.8
Terminal ValueTerminal Year EBITDA 92.0Exit Multiple 14.0x Terminal Value 1,287.3Discount Factor 0.77 Present Value of Terminal Value 989.3 % of Enterprise Value 79.8%
Enterprise Value $1,240.1
Implied Equity Value and Share PriceTerminal Year Free Cash Flow 62.0WACC 6.0%Terminal Value 1,287.3
Implied Perpetuity Growth Rate 1.0%
Implied EV / EBITDAEnterprise Value 1,240.12014A EBITDA 96.6
Implied EV / EBITDA 12.8x
We believe, although the exit multiple of comparable companies is approximately 14.0x, Kingsford can be sold for 16.0x due to its market domination, a control premium, and brand name.
32

VI. Execution

Execution Timeline
Q4 2014 Q1 2015 Q2 2015 Q3 2015 Q4 2015
Prepare marketing materials and confidentiality agreement for selected strategic and financial buyers to begin targeted auction process of Kingsford
Strategic Buyers: Western Refinery CVR Energy Koch Industries
Unilever P&G Jarden Church & Dwight
Financial Sponsors: The Blackstone
Group The Gores Group The Carlyle Group AEA
Contact prospective buyers
Negotiate and execute confidentiality agreements with interested buyers
Distribute confidential information memorandum and initial bid procedures
Prepare management presentation
Set up data room Receive initial bids
and select buyers to proceed to second round
Obtain necessary regulatory approval
Finance and close deal
Conduct management presentations with second round bidders
Set up visits to company headquarters in Oakland, CA
Provide data room access to bidders
Distribute final bid procedures letter and draft definitive agreement
Receive final bids
Evaluate final bids Negotiate deal terms
with preferred buyers Select winning bidder Receive board
approval and execute definitive agreement
34
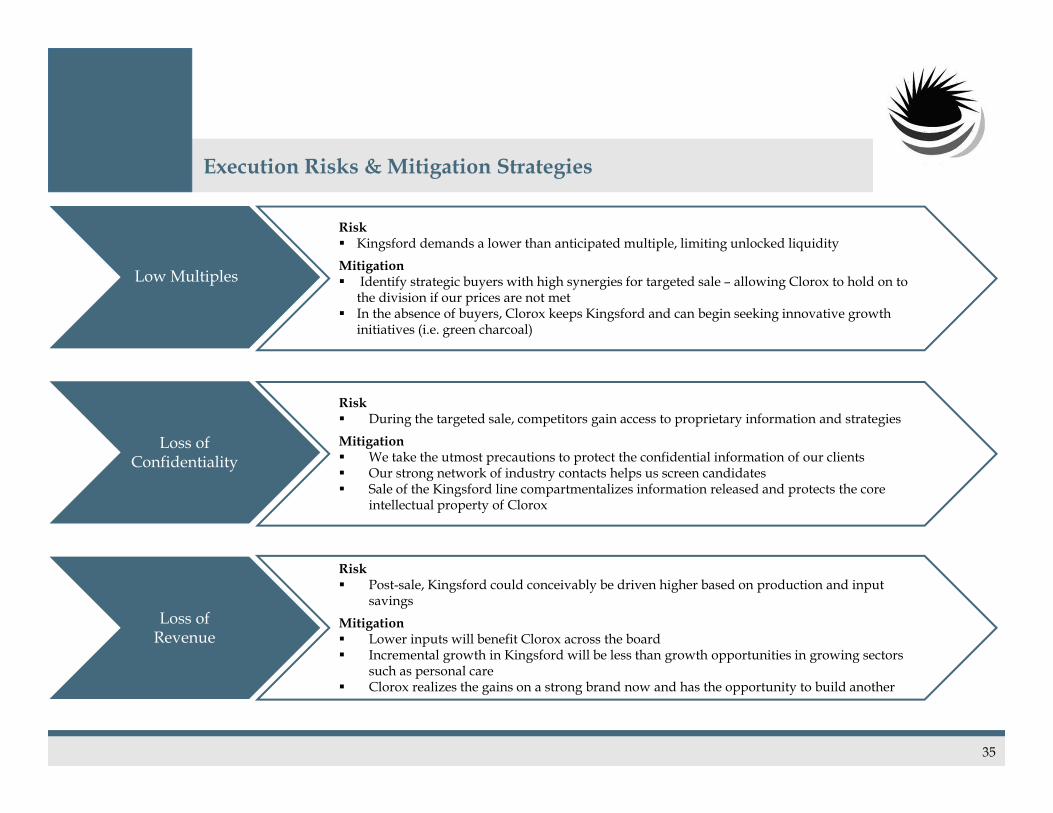
Execution Risks & Mitigation Strategies
35
Low Multiples
Loss of Confidentiality
Loss of Revenue
Risk Kingsford demands a lower than anticipated multiple, limiting unlocked liquidityMitigation Identify strategic buyers with high synergies for targeted sale – allowing Clorox to hold on to
the division if our prices are not met In the absence of buyers, Clorox keeps Kingsford and can begin seeking innovative growth
initiatives (i.e. green charcoal)
Risk Post-sale, Kingsford could conceivably be driven higher based on production and input
savingsMitigation Lower inputs will benefit Clorox across the board Incremental growth in Kingsford will be less than growth opportunities in growing sectors
such as personal care Clorox realizes the gains on a strong brand now and has the opportunity to build another
Risk During the targeted sale, competitors gain access to proprietary information and strategiesMitigation We take the utmost precautions to protect the confidential information of our clients Our strong network of industry contacts helps us screen candidates Sale of the Kingsford line compartmentalizes information released and protects the core
intellectual property of Clorox

VII. Appendix

37
Acquisition Possibilities – Betting on Global Personal Care
Acquisition Target: Shiseido
Asian Consumer Discretionary Trends Global Cosmetics and Cosmeceuticals
Strategic Rationale: Acquisition of Shiseido would bolt on 3.3% of the world’s
cosmetics market share Provides CLX with the platform to bring its products into Asia,
starting with Burt’s Bees and with potential expansion of other products
Shiseido is looking to bring its products into America and CLX provides the platform for them to do so
Company Overview: Has been Japan’s largest cosmetics manufacturer since 1956, with
2014 sales of $8.3 billion Commands the loyalty of Chinese women, providing future cross
selling opportunities Markets its products worldwide in 89 countries under various
brand names such as Shiseido, White Lucent, BareMinerals, Narsand Za
Overseas sales accounted for 47.5% of 2014 revenue as a result of globalization initiatives
Despite being a mature industry, competition remains high among nimble brands searching for trends
A growing emphasis on sustainability and natural ingredients drives sourcing
Product innovation remains a key driver of growth within the industry Price of inputs, including oil expected to fall
Consumer discretionary spending is expected to double from 4,000 per capita to 8,000 by the end of this decade
Within this trend, households purchasing premium branded products will increase by a 26% CAGR
Middle class Chinese consumers show a clear preference for international brands
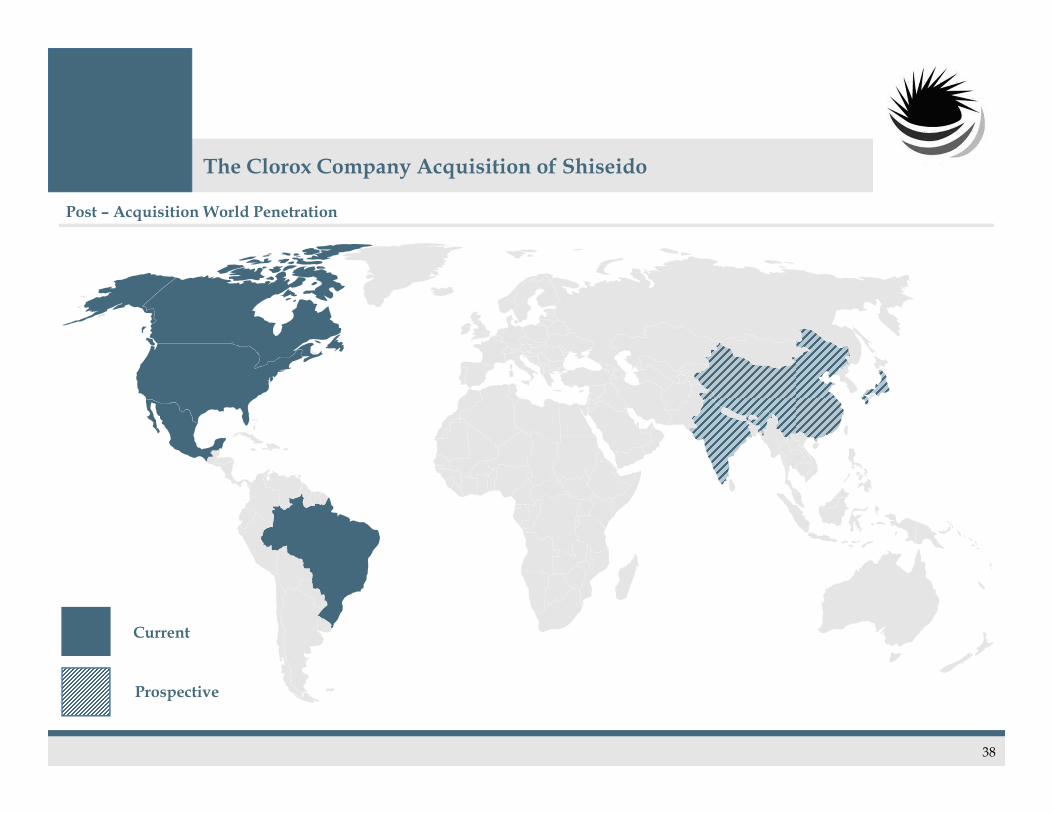
The Clorox Company Acquisition of Shiseido
Post – Acquisition World Penetration
38
Current
Prospective

DCF and LBO Analysis Sensitivity Analyses
1.0% 13 13.5 14 14.5 155.0% -0.3% -0.1% 0.1% 0.3% 0.4%5.5% 0.2% 0.4% 0.6% 0.7% 0.9%6.0% 0.7% 0.9% 1.0% 1.2% 1.4%6.5% 1.1% 1.3% 1.5% 1.7% 1.8%
7.0% 1.6% 1.8% 2.0% 2.1% 2.3%
Implied Perpetuity Growth Rate
Exit Multiple
79.9% 13.0x 13.5x 14.0x 14.5x 15.0x5.0% 79.0% 79.6% 80.2% 80.8% 81.3%5.5% 79.2% 79.8% 80.4% 80.9% 81.4%6.0% 78.7% 79.3% 79.9% 80.5% 81.0%
6.5% 78.5% 79.1% 79.7% 80.3% 80.8%7.0% 78.2% 78.8% 79.4% 80.0% 80.5%
PV of Terminal Value % of Enterprise Value
Exit Multiple
1323.1% 13.0x 13.5x 14.0x 14.5x 15.0x
5.0% 13.0x 13.4x 13.8x 14.2x 14.6x5.5% 12.7x 13.1x 13.5x 13.9x 14.3x
6.0% 12.5x 12.9x 13.2x 13.6x 14.0x
6.5% 12.3x 12.6x 13.0x 13.4x 13.7x
7.0% 12.0x 12.4x 12.7x 13.1x 13.5x
Implied EV/EBITDA
Exit Multiple1516258.5% 13.0x 13.5x 14.0x 14.5x 15.0x
5.0% 14,875$ 15,327$ 15,779$ 16,231$ 16,683$ 5.5% 14,590$ 15,033$ 15,475$ 15,917$ 16,360$
6.0% 14,297$ 14,730$ 15,163$ 15,595$ 16,028$
6.5% 14,041$ 14,465$ 14,889$ 15,313$ 15,737$
7.0% 13,776$ 14,192$ 14,607$ 15,022$ 15,437$
Enterprise Value
Exit Multiple
1317858.5% 13.0x 13.5x 14.0x 14.5x 15.0x5.0% $12,891 $13,343 $13,795 $14,247 $14,699
5.5% $12,606 $13,049 $13,491 $13,933 $14,3766.0% $12,313 $12,746 $13,179 $13,611 $14,044
6.5% $12,057 $12,481 $12,905 $13,329 $13,753
7.0% $11,792 $12,208 $12,623 $13,038 $13,453
Implied Equity Value
Exit Multiple
WA
CC
WA
CC
WA
CC
WA
CC
WA
CC
Implied Offer Price Per ShareExit Multiple
12.0x 12.5x 13.0x 13.5x 14.0x12.0% $82.13 $84.83 $87.53 $90.23 $92.93
9.5% 86.73 89.75 92.77 95.80 98.827.0% 92.00 95.39 98.78 102.18 105.574.5% 98.06 101.88 105.70 109.52 113.332.0% 105.06 109.37 113.68 117.99 122.30
IRR
39
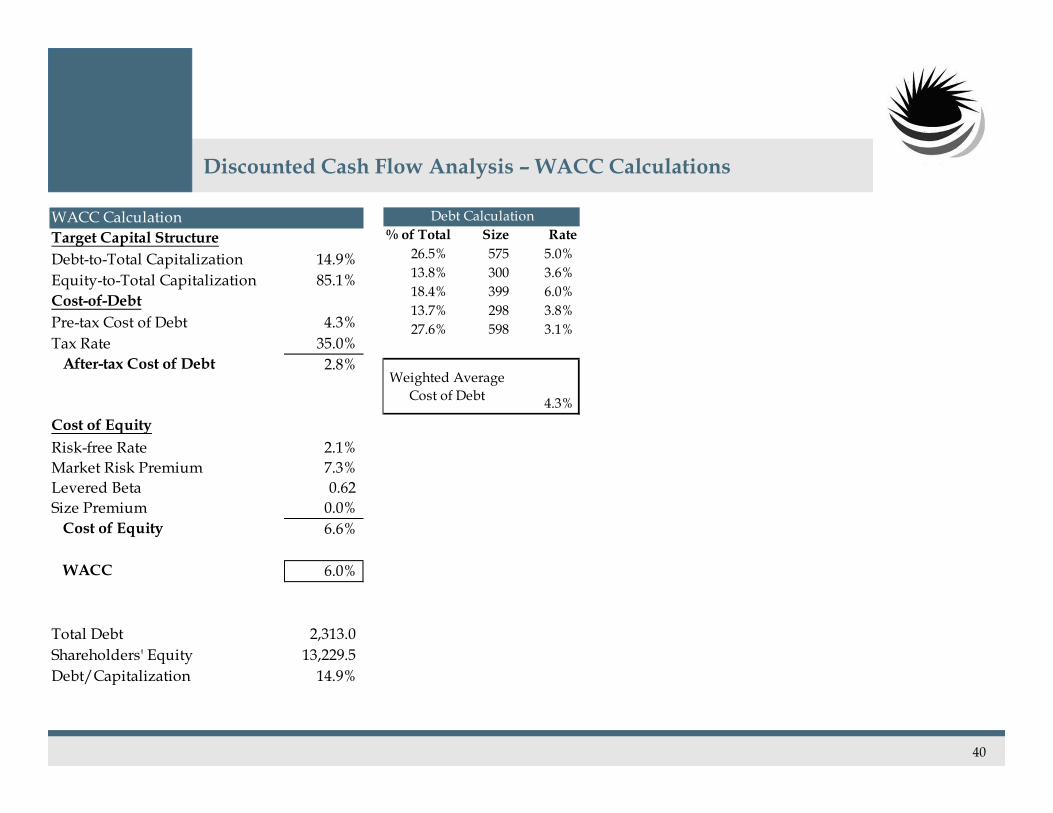
Discounted Cash Flow Analysis – WACC Calculations
WACC CalculationTarget Capital StructureDebt-to-Total Capitalization 14.9%Equity-to-Total Capitalization 85.1%Cost-of-DebtPre-tax Cost of Debt 4.3%Tax Rate 35.0% After-tax Cost of Debt 2.8%
Cost of EquityRisk-free Rate 2.1%Market Risk Premium 7.3%Levered Beta 0.62Size Premium 0.0% Cost of Equity 6.6%
WACC 6.0%
Total Debt 2,313.0Shareholders' Equity 13,229.5Debt/Capitalization 14.9%
Debt Calculation% of Total Size Rate
26.5% 575 5.0%13.8% 300 3.6%18.4% 399 6.0%13.7% 298 3.8%27.6% 598 3.1%
Weighted Average Cost of Debt 4.3%
40

Discounted Cash Flow Analysis – Net Working Capital Calculations
Historical Period Projection Period2013A 2014A 2015E 2016E 2017E 2018E 2019E
Revenue $5,263.0 $5,591.0 $5,561.0 $5,727.0 $5,898.0 $6,074.9 $6,257.1COGS 3,001.0 3,231.0 3,180.0 3,262.0 3,361.8 3,462.7 3,566.6
Current AssetsAccounts Receivable 580.0 546.0 543.0 559.0 589.8 607.5 625.7Inventory 394.0 386.0 380.0 390.0 412.9 425.2 438.0Other Current Assets 109.7 109.2 108.7 111.9 115.2 118.7 122.3
Accounts Receivable Days Outstanding 40.2 35.6 35.6 35.6 36.5 36.5 36.5 Inventory Turns 7.6 8.4 8.4 8.4 8.1 8.1 8.1 Inventory Days Outstanding 47.9 43.6 43.6 43.6 44.8 44.8 44.8 Other Current Assets % of Revenue 2.1% 2.0% 2.0% 2.0% 2.0% 2.0% 2.0%
Current LiabilitiesAccounts Payable 413.0 440.0 433.8 446.7 460.0 473.8 488.1Income Tax Liabilities 29.0 8.0 27.8 28.6 29.5 30.4 31.3Other Current Liabilities 490.0 472.0 469.5 483.5 497.9 512.9 528.2
Days Payables Outstanding 50.2 49.7 49.8 50.0 49.9 49.9 49.9 Income Tax Liabilities as % of Revenue 0.6% 0.1% 0.5% 0.5% 0.5% 0.5% 0.5% Other Current Liabilities % of Revenue 9.3% 8.4% 8.4% 8.4% 8.4% 8.4% 8.4%
Net Working Capital 151.8 121.3 100.7 102.2 130.5 134.5 138.5
(Increase)/Decrease in Net Working Capital n/a $30.5 $20.6 ($1.5) ($28.4) ($3.9) ($4.0)
41


