http://pen.sagepub.com/ Nutrition Journal of Parenteral and Enteral http://pen.sagepub.com/content/11/2/129.1 The online version of this article can be found at: DOI: 10.1177/014860718701100206 1987 11: 129 JPEN J Parenter Enteral Nutr C. Lawrence Kien and Bruce M. Camitta Leukemia Breakdown) and Energy Expenditure in Children with Newly Diagnosed Acute Lymphocytic Close Association of Accelerated Rates of Whole Body Protein Turnover (Synthesis and Published by: http://www.sagepublications.com On behalf of: The American Society for Parenteral & Enteral Nutrition can be found at: Journal of Parenteral and Enteral Nutrition Additional services and information for http://pen.sagepub.com/cgi/alerts Email Alerts: http://pen.sagepub.com/subscriptions Subscriptions: http://www.sagepub.com/journalsReprints.nav Reprints: http://www.sagepub.com/journalsPermissions.nav Permissions: http://pen.sagepub.com/content/11/2/129.1.refs.html Citations: What is This? - Mar 1, 1987 Version of Record >> at MCGILL UNIVERSITY LIBRARY on March 6, 2013 pen.sagepub.com Downloaded from
Transcript
http://pen.sagepub.com/Nutrition
Journal of Parenteral and Enteral
http://pen.sagepub.com/content/11/2/129.1The online version of this article can be found at:
DOI: 10.1177/014860718701100206
1987 11: 129JPEN J Parenter Enteral NutrC. Lawrence Kien and Bruce M. Camitta
LeukemiaBreakdown) and Energy Expenditure in Children with Newly Diagnosed Acute Lymphocytic
Close Association of Accelerated Rates of Whole Body Protein Turnover (Synthesis and
Published by:
http://www.sagepublications.com
On behalf of:
The American Society for Parenteral & Enteral Nutrition
can be found at:Journal of Parenteral and Enteral NutritionAdditional services and information for
Copyright 0 1987 by the American Society for Parenteral and Enteral Nutrition JOURNAL OF PARENTERAL AND ENTERAL NUTRITION Vol. 11, No. 2
Printed in U. S. A.
Close Association of Accelerated Rates of Whole Body Protein Turnover (Synthesis and Breakdown) and Energy Expenditure in Children with
Newly Diagnosed Acute Lymphocytic Leukemia
C. LAWRENCE KIEN, M.D., PH.D., AND BRUCE M. CAMITTA, M.D.
From the Section of Clinical Nutrition, Department of Medicine, Pediatrics and Biochemistry, West Virginia University School of Medicine, Morgantown, West Virginia, and The Department of Pediatrics, Medical College of Wisconsin, Znc., The Midwest Children’s Cancer Center, and
the Milwaukee Children’s Hospital, Milwaukee, Wisconsin
ABSTRACT. Using a single-dose [“N]glycine turnover tech- nique, we studied protein metabolism in 15 children with newly diagnosed acute lymphocytic leukemia (ALL). As in our pre- vious study, we observed increased rates of whole body protein synthesis (S) and breakdown (B) in comparison to healthy controls. In eight patients, we assessed basal metabolic rate (BMR). There was a significant linear regression between BMR (kcal/d) (Y) and S (g protein/d) (X): y = 3.7 X + 850 (R = 0.925, p < 0.001). There was also a significant linear correlation between BMR, expressed as a percentage of the normal value, and S expressed as a percentage of the mean value in the
healthy children ( r = 0 . 7 9 , ~ < 0.05). There were also significant positive correlations between BMR and body weight ( r = 0.75, p < 0.05) or age ( r = 0.83, p < 0.05) and between S and weight or age (both, r = 0.86, p < 0.01). BMR (kcal/d) also correlated with B (g protein/d) ( r = 0.91, p < 0.01). Multiple regression analysis revealed that BMR was much more highly related to S than to weight. These data suggest that increased rates of S are closely related to increased energy requirements in patients with ALL. Furthermore, these data provide evidence for the biological relevance of whole body protein kinetics. (Journal of Parenteral and Enteral Nutrition 11:129-134, 1987)
The determination of the optimal energy intake in sick cancer patients requires that a balance be established between presumed beneficial nutritional or clinical out- comes and possible adverse effects of hyperalimentation such as increased tumor growth or excessive hepatic fat synthesis. In patients who are in negative energy balance, energy supplementation might have several putative ben- efits including: an increased rate of protein accretion, improved muscle function,’ and higher rates of protein synthesis and breakdown which could, in theory, provide more metabolic flexibility to meet changing enzymic needs during Each of these benefits of hyper- alimentation could be associated with an absolute in- crease in the rate of protein synthesis in muscle and other tissues with a concomitant rise in energy expendi- ture. Thus, in sick patients, mere determination of en- ergy expenditure, whether by actual measurement or by prediction using published formulas, does not necessarily indicate whether the energy intake should be increased. We have previously suggested that a study of the rela- tionship between energy expenditure and protein syn- thesis may permit more insight into how to judge the adequacy of the energy intake and the intensity of energy metabolism.6 In the present study, we sought to extend our previous observations on the relationship between protein synthesis and basal metabolic rate (BMR) to a different population, namely, children with acute lym- phocytic leukemia (ALL). Measurement of the rates of whole body protein turnover (synthesis and breakdown phases of the exchange) could be used to assess the
Received for publication, December 31, 1985. Accepted for publication, August 14, 1986. Reprint requests: Dr. C. Lawrence Kien, Department of Medicine,
West Virginia University, Morgantown, WV 26506.
adequacy of both protein and energy intake in sick pa- tients. However, whole body protein turnover is an ab- stract concept that does not have fundamental signifi- cance equivalent to BMR. Thus, regardless of the com- plexity or theoretical validity of the tracer model used,’ determination of the true biological significance of such measurements depends on correlations with other fun- damental biological phenomena such as BMR or with clinical status. Thus, our second reason for exploring the relationship of protein metabolism and BMR in our patients was to externally validate the tracer model which we had used previously to study protein turnover in children with cancer.2
MATERIALS AND METHODS
Subjects Fifteen pediatric patients with newly diagnosed ALL
were the subjects of this study, as well as eight healthy control subjects. The ALL subtype was common cell in 11, T-cell in 3, and null cell in 1. The ages of the ALL patients were 3-15 yr (median 5), while controls were 4 to 17 yr (median 9). The mean age (mean f SD) of the ALL patients (7.1 f 3.7 yr) was not significantly different from the controls (9.5 f 4.3 yr).
Experimental Design All of the subjects were studied using a previously
described, single dose, [l5N]glycine t e c h n i q ~ e ? , ~ , ~ This technique provides comparable results in our controls to that seen with similarly aged controls using a repeated dose t e c h n i q ~ e . ~ ~ ~ The ALL patients were all studied in
129
at MCGILL UNIVERSITY LIBRARY on March 6, 2013pen.sagepub.comDownloaded from
the Chemotherapy Unit of Milwaukee Children's Hos- pital where metabolic ward conditions exist. Clinical problems existing at the time of study are discussed under Results. Seven of the patients received no chemo- therapy before or during the protein turnover study. Eight children received a single dose of prednisone before or during the protein turnover study, and one of these also received a dose of vincristine. Healthy children, recruited from families of faculty and staff, were studied in their own homes.
Whole body protein turnover was evaluated in each subject during the period from 1630 to 0700 hr. During this period, the subject received one carefully measured meal shortly after a dose of [15N]glycine (d) (1.0 mg 15N/ kg) was administered at 1630 hr. The composition and amount of the meal was based on individual needs. Urine specimens were collected individually during the subse- quent 14.5-hr period (t, expressed as a fraction of the 24- hr period) and analyzed for 15N enrichment of ammonia and for ammonia nitrogen. We described previously the method used for determining the average 15N enrichment (s) weighted over time.* Although the 15N enrichment of urea nitrogen in these samples was also determined, these data are not included in the present results. In our previous paper: we demonstrated that we reached simi- lar conclusions, using each of the two different end products or using an average of the two. Whole body nitrogen flux (Q) was calculated from s, d, and t: Q = d/ st. Rates of whole body protein synthesis (S) and break- down (B) were calculated from &, the nitrogen intake during the 14.5-hr study period (I), and the rate of urinary total N excretion during the N turnover study (E): S + E = Q = B + I. As previously noted,' conclusions about rates of S and B in these patients are not affected by whether we calculated I and E during the study period or during the entire 24-hr period following the [15N] glycine dose.
Two consecutive 24-hr urine samples were collected from each subject to ensure that the collections were complete. The second 24-hr urine covered the period after the 15N turnover study. As in the previous study,' a urine collection was suspected of being incomplete if the coefficient of variation in daily creatinine excretion exceeded 20% and if there was no specific reason to discount the results on the second 24-hr urine. In those subjects with suspected incomplete urine collections, the protein turnover data simply were not reported. In ad- dition, in each subject, we examined in detail the isotope excretion in urine to exclude any aberrant urine collec- tions. The consumption of protein and energy intake in each of the subjects was carefully measured for the 24- hr period commencing with the [15N]glycine dose. Except for the period during the tracer study, these data were used only to characterize the nutritional status.
Analyses The 15N enrichment of urinary ammonia was assessed
using emission spectroscopy.' Urinary ammonia was measured using a modification of the Berthelot reac- tion." Urine creatinine and nitrogen were measured us- ing automated methods.l'~''
Basal Oxygen Consumption and Estimation of Basal Metabolic Rate
In eight subjects with ALL, in whom protein kinetics were assessed, basal oxygen consumption also was meas- ured using an open-circuit, flow-through technique. In three additional subjects, we attempted to assess simul- taneously protein kinetics and oxygen consumption, but the results were technically unsatisfactory. In two of the subjects, urine collections during the tracer study were incomplete, and in one study, the subject cried continu- ously, resulting in a very high level of oxygen consump- tion.
The subjects were approached while still sleeping and were aroused only to place the hood over their head and to place them in the supine position. After a 1-min stabilization period, continuous measurements of oxygen consumption were made over an approximate 5-min pe- riod. Since values were integrated and displayed every 30 sec, we were able to detect marked variations between these intervals. In general, the values were stable over 5 min, and we found no evidence that the oxygen con- sumption tended to decrease with time under the hood. Longer periods of measurement were not acceptable in the majority of children. The children generally then returned to sleep during the 5-min measurement period. The instrument used employs a polarographic 0 2 sensor (MRM-2, Waters Instrument, Inc., Rochester, MN). The instrument, owned and routinely operated by our Car- diology Department, was calibrated with standard gases by Service Engineers. As a check on the accuracy of the instrument, we compared the results obtained (ml O,/ min) with this instrument to those obtained with a closed-circuit Benedict-Roth apparatus. Eight hospital workers were assessed in the mid-afternoon first with the Waters instrument and then with the Benedict-Roth apparatus. The results were highly correlated ( r = 0.92, p = 0.01). We employed a constant (4.83 kcal/liter 0') to convert measurements of basal oxygen consumption to estimates of basal energy expenditure.13
Data Analysis
test were used to evaluate the data. Linear regression (correlation) and the two-sample t-
RESULTS
Clinical Status of the Patients at the Time of Study
Table I summarizes much of the individual metabolic and clinical data. Ten of the 15 patients were febrile (237.8"C). Five patients had a core temperature in the range associated with septicemia (>39"C). Two patients had documented septicemia, and two had local infection. In eight of the patients, the serum albumin concentration was below normal (3.8 g/dl). Only two patients had documented weight loss. Nine of the patients had hepa- tosplenomegaly.
Nutritional Status of the Patients and Controls (Table I) The protein intake of the patients (mean f SD, 1.9 k
1.0) was more than adequate but still significantly ( p <
at MCGILL UNIVERSITY LIBRARY on March 6, 2013pen.sagepub.comDownloaded from
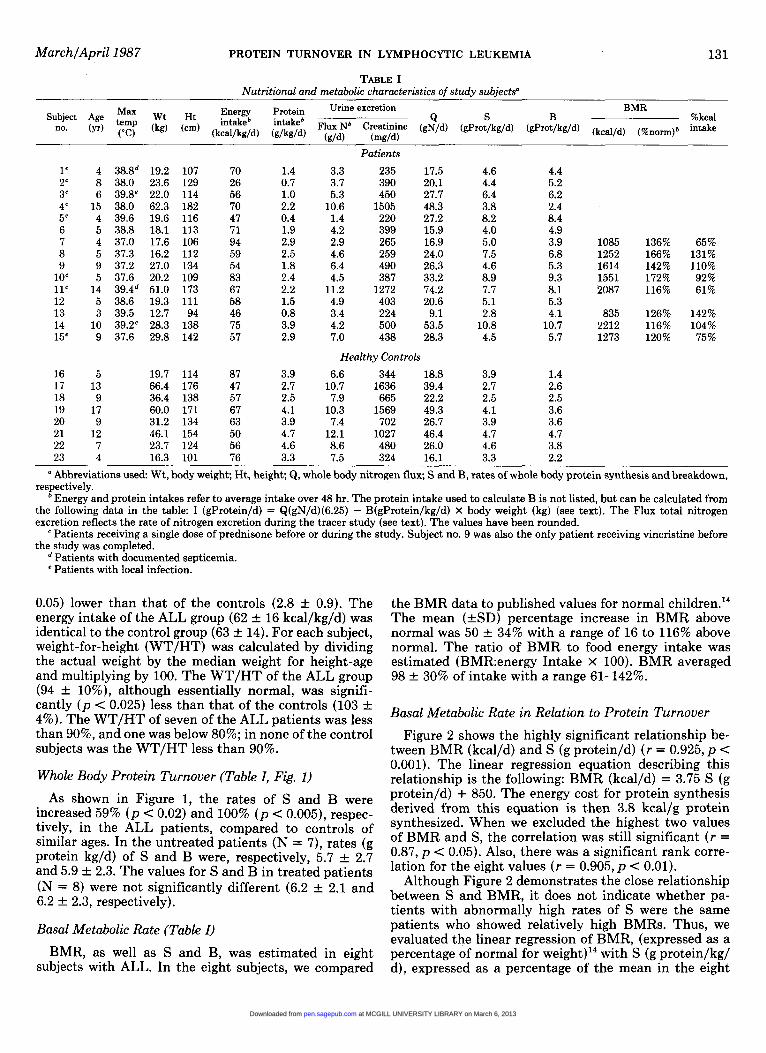
23 4 16.3 101 76 3.3 7.5 324 16.1 3.3 2.2 a Abbreviations used: Wt, body weight; Ht, height; Q, whole body nitrogen flux; S and B, rates of whole body protein synthesis and breakdown,
respectively. Energy and protein intakes refer to average intake over 48 hr. The protein intake used to calculate B is not listed, but can be calculated from
the following data in the table: I (gProtein/d) = Q(gN/d)(6.25) - B(gProtein/kg/d) X body weight (kg) (see text). The Flux total nitrogen excretion reflects the rate of nitrogen excretion during the tracer study (see text). The values have been rounded.
Patients receiving a single dose of prednisone before or during the study. Subject no. 9 was also the only patient receiving vincristine before the study was completed.
Patients with documented septicemia. Patients with local infection.
0.05) lower than that of the controls (2.8 rt 0.9). The energy intake of the ALL group (62 rt 16 kcal/kg/d) was identical to the control group (63 rt 14). For each subject, weight-for-height (WT/HT) was calculated by dividing the actual weight by the median weight for height-age and multiplying by 100. The WT/HT of the ALL group (94 rt lo%), although essentially normal, was signifi- cantly ( p < 0.025) less than that of the controls (103 rt 4%). The WT/HT of seven of the ALL patients was less than 90%, and one was below 80%; in none of the control subjects was the WT/HT less than 90%.
Whole Body Protein Turnover (Table I, Fig. 1)
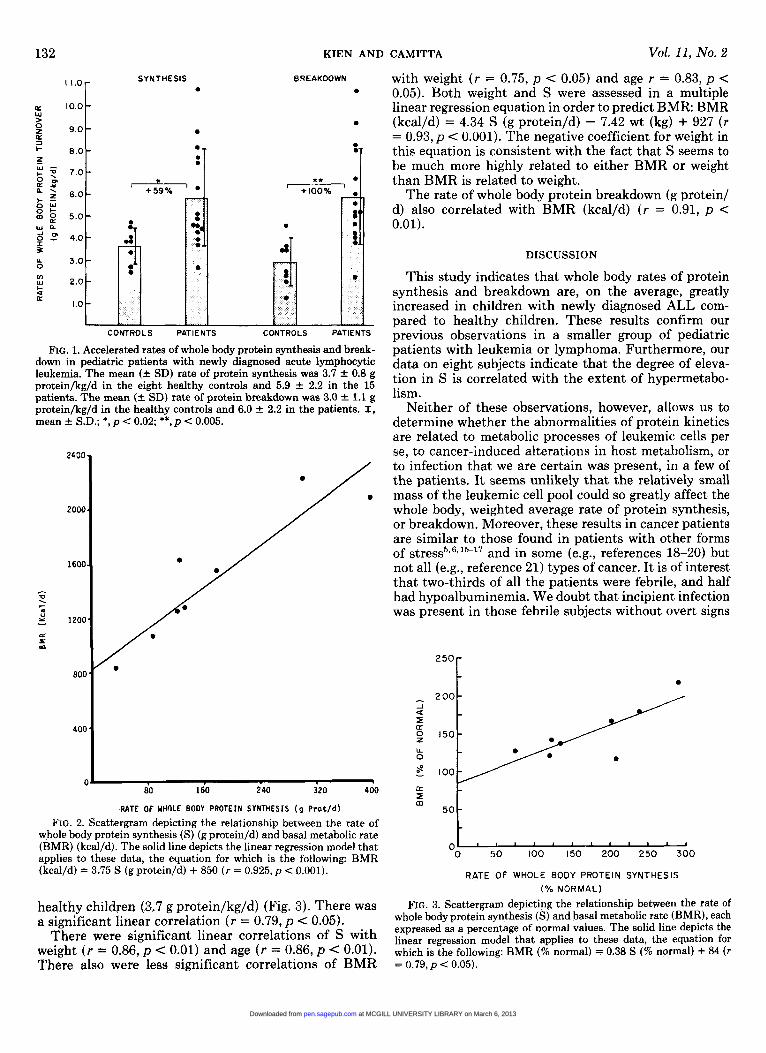
As shown in Figure 1, the rates of S and B were increased 59% ( p < 0.02) and 100% ( p < 0.005), respec- tively, in the ALL patients, compared to controls of similar ages. In the untreated patients (N = 7), rates (g protein kg/d) of S and B were, respectively, 5.7 f 2.7 and 5.9 f 2.3. The values for S and B in treated patients (N = 8) were not significantly different (6.2 f 2.1 and 6.2 f 2.3, respectively).
Basal Metabolic Rate (Table I) BMR, as well as S and B, was estimated in eight
subjects with ALL. In the eight subjects, we compared
the BMR data to published values for normal ~hi1dren.l~ The mean (fSD) percentage increase in BMR above normal was 50 f 34% with a range of 16 to 116% above normal. The ratio of BMR to food energy intake was estimated (BMR:energy Intake x 100). BMR averaged 98 f 30% of intake with a range 61-142%.
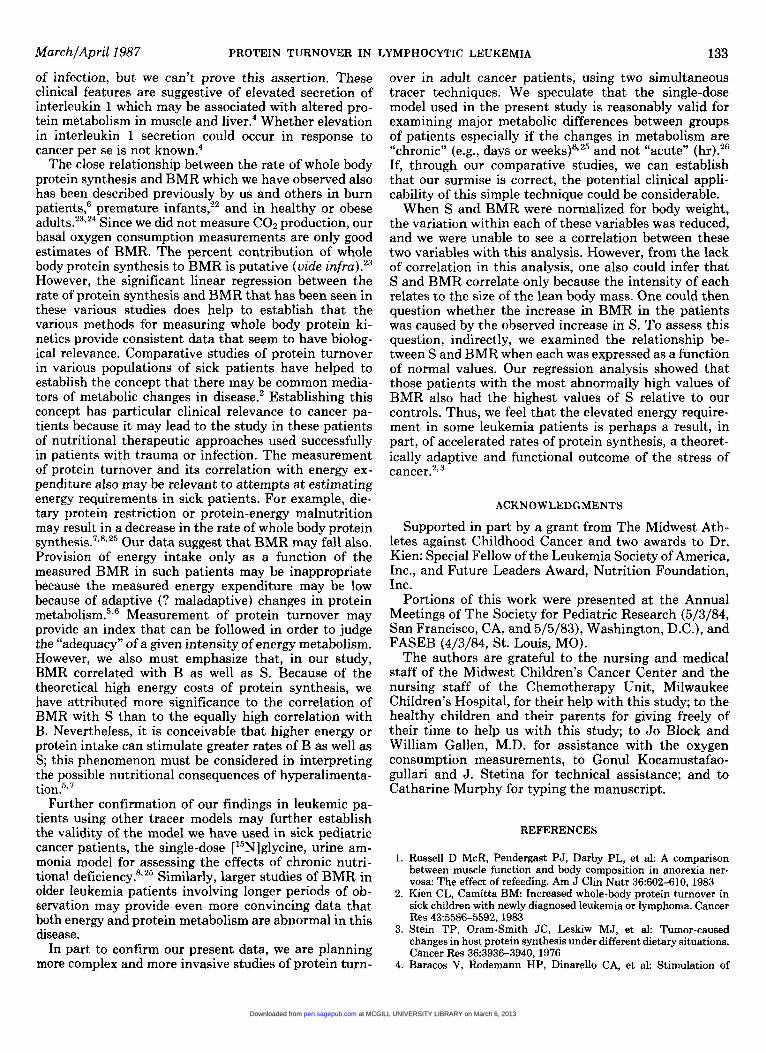
Basal Metabolic Rate in Relation to Protein Turnover Figure 2 shows the highly significant relationship be-
tween BMR (kcal/d) and S (g protein/d) ( r = 0.925, p < 0.001). The linear regression equation describing this relationship is the following: BMR (kcal/d) = 3.75 S (g protein/d) + 850. The energy cost for protein synthesis derived from this equation is then 3.8 kcal/g protein synthesized. When we excluded the highest two values of BMR and S, the correlation was still significant ( r = 0.87, p < 0.05). Also, there was a significant rank corre- lation for the eight values ( r = 0.905, p < 0.01).
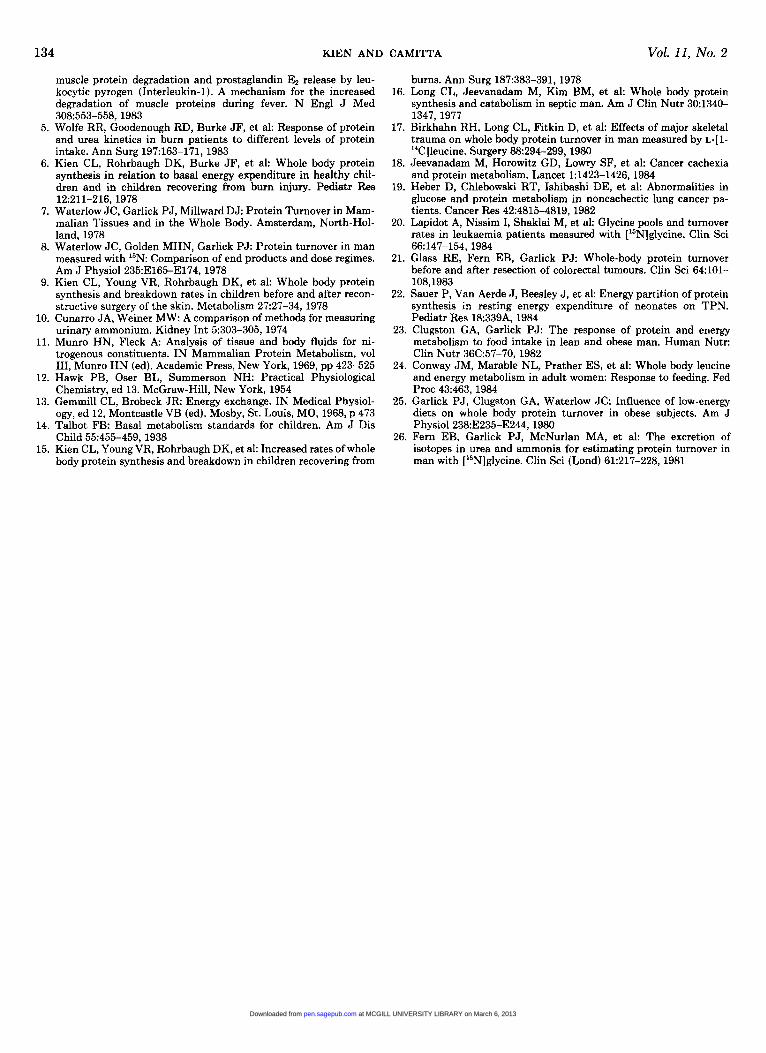
Although Figure 2 demonstrates the close relationship between S and BMR, it does not indicate whether pa- tients with abnormally high rates of S were the same patients who showed relatively high BMRs. Thus, we evaluated the linear regression of BMR, (expressed as a percentage of normal for weight)14 with S (g protein/kg/ d), expressed as a percentage of the mean in the eight
at MCGILL UNIVERSITY LIBRARY on March 6, 2013pen.sagepub.comDownloaded from
FIG. 1. Accelerated rates of whole body protein synthesis and break- down in pediatric patients with newly diagnosed acute lymphocytic leukemia. The mean (+ SD) rate of protein synthesis was 3.7 f 0.8 g protein/kg/d in the eight healthy controls and 5.9 f 2.2 in the 15 patients. The mean (+- SD) rate of protein breakdown was 3.0 f 1.1 g protein/kg/d in the healthy controls and 6.0 f 2.2 in the patients. I, mean f S.D.; *, p < 0.02; **,p < 0.005.
2400
2000
1600
I
TI . nl - 2 1200
c S m
800
400
C J
80 160 240 320 400
RATE OF UHOLE BODY PROTEIN SYNTHESIS (9 Prot/d) FIG. 2. Scattergram depicting the relationship between the rate of
whole body protein synthesis (S) (g protein/d) and basal metabolic rate (BMR) (kcal/d). The solid line depicts the linear regression model that applies to these data, the equation for which is the following: BMR (kcal/d) f 3.75 S (g protein/d) + 850 ( r = 0.925, p < 0.001).
healthy children (3.7 g protein/kg/d) (Fig. 3). There was a significant linear correlation ( r = 0.79, p < 0.05).
There were significant linear correlations of S with weight ( r = 0.86, p < 0.01) and age ( r = 0.86, p < 0.01). There also were less significant correlations of BMR
CAMITTA Vol. 11, No. 2
with weight ( r = 0.75, p < 0.05) and age r = 0.83, p < 0.05). Both weight and S were assessed in a multiple linear regression equation in order to predict BMR: BMR (kcal/d) = 4.34 S (g protein/d) - 7.42 wt (kg) + 927 ( r = 0.93, p < 0.001). The negative coefficient for weight in this equation is consistent with the fact that S seems to be much more highly related to either BMR or weight than BMR is related to weight.
The rate of whole body protein breakdown (g protein/ d) also correlated with BMR (kcal/d) ( r = 0.91, p < 0.01).
DISCUSSION
This study indicates that whole body rates of protein synthesis and breakdown are, on the average, greatly increased in children with newly diagnosed ALL com- pared to healthy children. These results confirm our previous observations in a smaller group of pediatric patients with leukemia or lymphoma. Furthermore, our data on eight subjects indicate that the degree of eleva- tion in S is correlated with the extent of hypermetabo- lism.
Neither of these observations, however, allows us to determine whether the abnormalities of protein kinetics are related to metabolic processes of leukemic cells per se, to cancer-induced alterations in host metabolism, or to infection that we are certain was present, in a few of the patients. I t seems unlikely that the relatively small mass of the leukemic cell pool could so greatly affect the whole body, weighted average rate of protein synthesis, or breakdown. Moreover, these results in cancer patients are similar to those found in patients with other forms of and in some (e.g., references 18-20) but not all (e.g., reference 21) types of cancer. It is of interest that two-thirds of all the patients were febrile, and half had hypoalbuminemia. We doubt that incipient infection was present in those febrile subjects without overt signs
""1
[L I m
50
'0 50 z 100 150 200 250 300
RATE OF WHOLE BODY PROTEIN SYNTHESIS ( % NORMAL)
FIG. 3. Scattergram depicting the relationship between the rate of whole body protein synthesis (S) and basal metabolic rate (BMR), each expressed as a percentage of normal values. The solid line depicts the linear regression model that applies to these data, the equation for which is the following: BMR (% nsrmal) = 0.38 S (% normal) + 84 ( r = 0.79, p < 0.05).
at MCGILL UNIVERSITY LIBRARY on March 6, 2013pen.sagepub.comDownloaded from
MarchlApril1987 PROTEIN TURNOVER IN LYMPHOCYTIC LEUKEMIA 133
of infection, but we can’t prove this assertion. These clinical features are suggestive of elevated secretion of interleukin 1 which may be associated with altered pro- tein metabolism in muscle and liver.4 Whether elevation in interleukin 1 secretion could occur in response to cancer per se is not known.4
The close relationship between the rate of whole body protein synthesis and BMR which we have observed also has been described previously by us and others in burn patients: premature infants:’ and in healthy or obese adult^.^^^'^ Since we did not measure COz production, our basal oxygen consumption measurements are only good estimates of BMR. The percent contribution of whole body protein synthesis to BMR is putative (vide infr~).’~ However, the significant linear regression between the rate of protein synthesis and BMR that has been seen in these various studies does help to establish that the various methods for measuring whole body protein ki- netics provide consistent data that seem to have biolog- ical relevance. Comparative studies of protein turnover in various populations of sick patients have helped to establish the concept that there may be common media- tors of metabolic changes in disease.2 Establishing this concept has particular clinical relevance to cancer pa- tients because it may lead to the study in these patients of nutritional therapeutic approaches used successfully in patients with trauma or infection. The measurement of protein turnover and its correlation with energy ex- penditure also may be relevant to attempts at estimating energy requirements in sick patients. For example, die- tary protein restriction or protein-energy malnutrition may result in a decrease in the rate of whole body protein ~ynthes is .~ .~ , ’~ Our data suggest that BMR may fall also. Provision of energy intake only as a function of the measured BMR in such patients may be inappropriate because the measured energy expenditure may be low because of adaptive (? maladaptive) changes in protein metabol i~m.~?~ Measurement of protein turnover may provide an index that can be followed in order to judge the “adequacy” of a given intensity of energy metabolism. However, we also must emphasize that, in our study, BMR correlated with B as well as S. Because of the theoretical high energy costs of protein synthesis, we have attributed more significance to the correlation of BMR with S than to the equally high correlation with B. Nevertheless, it is conceivable that higher energy or protein intake can stimulate greater rates of B as well as S; this phenomenon must be considered in interpreting the possible nutritional consequences of hyperalimenta- tion.5,
Further confirmation of our findings in leukemic pa- tients using other tracer models may further establish the validity of the model we have used in sick pediatric cancer patients, the single-dose [ 15N]glycine, urine am- monia model for assessing the effects of chronic nutri- tional deficiency?sz5 Similarly, larger studies of BMR in older leukemia patients involving longer periods of ob- servation may provide even more convincing data that both energy and protein metabolism are abnormal in this disease.
In part to confirm our present data, we are planning more complex and more invasive studies of protein turn-
over in adult cancer patients, using two simultaneous tracer techniques. We speculate that the single-dose model used in the present study is reasonably valid for examining major metabolic differences between groups of patients especially if the changes in metabolism are ‘lchronic” (e.g., days or week^)^"^ and not “acute” (hr).26 If, through our comparative studies, we can establish that our surmise is correct, the potential clinical appli- cability of this simple technique could be considerable.
When S and BMR were normalized for body weight, the variation within each of these variables was reduced, and we were unable to see a correlation between these two variables with this analysis. However, from the lack of correlation in this analysis, one also could infer that S and BMR correlate only because the intensity of each relates to the size of the lean body mass. One could then question whether the increase in BMR in the patients was caused by the observed increase in S. To assess this question, indirectly, we examined the relationship be- tween S and BMR when each was expressed as a function of normal values. Our regression analysis showed that those patients with the most abnormally high values of BMR also had the highest values of S relative to our controls. Thus, we feel that the elevated energy require- ment in some leukemia patients is perhaps a result, in part, of accelerated rates of protein synthesis, a theoret- ically adaptive and functional outcome of the stress of
ACKN 0 W LEDGMENTS
Supported in part by a grant from The Midwest Ath- letes against Childhood Cancer and two awards to Dr. Kien: Special Fellow of the Leukemia Society of America, Inc., and Future Leaders Award, Nutrition Foundation, Inc.
Portions of this work were presented at the Annual Meetings of The Society for Pediatric Research (5/3/84, San Francisco, CA, and 5/5/83), Washington, D.C.), and FASEB (4/3/84, St. Louis, MO).
The authors are grateful to the nursing and medical staff of the Midwest Children’s Cancer Center and the nursing staff of the Chemotherapy Unit, Milwaukee Children’s Hospital, for their help with this study; to the healthy children and their parents for giving freely of their time to help us with this study; to Jo Block and William Gallen, M.D. for assistance with the oxygen consumption measurements, to Gonul Kocamustafao- gullari and J. Stetina for technical assistance; and to Catharine Murphy for typing the manuscript.
REFERENCES
1. Russell D McR, Pendergast PJ, Darby PL, et al: A comparison between muscle function and body composition in anorexia ner- vosa: The effect of refeeding. Am J Clin Nutr 36602-610, 1983
2. Kien CL, Camitta BM: Increased whole-body protein turnover in sick children with newly diagnosed leukemia or lymphoma. Cancer Res 435586-5592,1983
3. Stein TP, Oram-Smith JC, Leskiw MJ, et al: Tumor-caused changes in host protein synthesis under different dietary situations. Cancer Res 363936-3940,1976
4. Baracos V, Rodemann HP, Dinarello CA, et al: Stimulation of
at MCGILL UNIVERSITY LIBRARY on March 6, 2013pen.sagepub.comDownloaded from
muscle protein degradation and prostaglandin EP release by leu- kocytic pyrogen (Interleukin-1). A mechanism for the increased degradation of muscle proteins during fever. N Engl J Med
5. Wolfe RR, Goodenough RD, Burke JF, et al: Response of protein and urea kinetics in burn patients to different levels of protein intake. Ann Surg 197:163-171, 1983
6. Kien CL, Rohrbaugh DK, Burke JF, et al: Whole body protein synthesis in relation to basal energy expenditure in healthy chil- dren and in children recovering from burn injury. Pediatr Res
7. Waterlow JC, Garlick PJ, Millward DJ: Protein Turnover in Mam- malian Tissues and in the Whole Body. Amsterdam, North-Hol- land, 1978
8. Waterlow JC, Golden MHN, Garlick PJ: Protein turnover in man measured with 15N: Comparison of end products and dose regimes. Am J Physiol 235:E165-E174, 1978
9. Kien CL, Young VR, Rohrbaugh DK, et al: Whole body protein synthesis and breakdown rates in children before and after recon- structive surgery of the skin. Metabolism 2227-34,1978
10. Cunarro JA, Weiner MW: A comparison of methods for measuring urinary ammonium. Kidney Int 5x303-305, 1974
11. Munro HN, Fleck A: Analysis of tissue and body fluids for ni- trogenous constituents. IN Mammalian Protein Metabolism, vol 111, Munro HN (ed). Academic Press, New York, 1969, pp 423-525
12. Hawk PB, Oser BL, Summerson NH: Practical Physiological Chemistry, ed 13. McGraw-Hill, New York, 1954
13. Gemmill CL, Brobeck J R Energy exchange. IN Medical Physiol- ogy, ed 12, Montcastle VB (ed). Mosby, St. Louis, MO, 1968, p 473
14. Talbot F B Basal metabolism standards for children. Am J Dis Child 55:455-459,1938
15. Kien CL, Young VR, Rohrbaugh DK, et al: Increased rates of whole body protein synthesis and breakdown in children recovering from
308553-558,1983
12~211-216,1978
burns. Ann Surg 187:383-391,1978 16. Long CL, Jeevanadam M, Kim BM, et al: Whole body protein
synthesis and catabolism in septic man. Am J Clin Nutr 301340- 1347,1977
17. Birkhahn RH, Long CL, Fitkin D, et al: Effects of major skeletal trauma on whole body protein turnover in man measured by ~ - [ l - “Clleucine. Surgery 88:294-299,1980
18. Jeevanadam M, Horowitz GD, Lowry SF, et al: Cancer cachexia and protein metabolism. Lancet 1:1423-1426,1984
19. Heber D, Chlebowski RT, Ishibashi DE, et al: Abnormalities in glucose and protein metabolism in noncachectic lung cancer pa- tients. Cancer Res 42:4815-4819,1982
20. Lapidot A, Nissim I, Shaklai M, et al: Glycine pools and turnover rates in leukaemia patients measured with [l5N]g1ycine. Clin Sci
21. Glass RE, Fern EB, Garlick PJ: Whole-body protein turnover before and after resection of colorectal tumours. Clin Sci 64101- 108,1983
22. Sauer P, Van Aerde J , Beesley J , et a1 Energy partition of protein synthesis in resting energy expenditure of neonates on TPN. Pediatr Res 18339A, 1984
23. Clugston GA, Garlick PJ: The response of protein and energy metabolism to food intake in lean and obese man. Human Nutr: Clin Nutr 36C:57-70, 1982
24. Conway JM, Marable NL, Prather ES, et al: Whole body leucine and energy metabolism in adult women: Response to feeding. Fed Proc 43:463, 1984
25. Garlick PJ, Clugston GA, Waterlow JC: Influence of low-energy diets on whole body protein turnover in obese subjects. Am J Physiol238E235-E244,1980
26. Fern EB, Garlick PJ, McNurlan MA, et al: The excretion of isotopes in urea and ammonia for estimating protein turnover in man with [15N]glycine. Clin Sci (Lond) 61:217-228, 1981
66~147-154,1984
at MCGILL UNIVERSITY LIBRARY on March 6, 2013pen.sagepub.comDownloaded from