28
THECB 7/2006 Closing the Gaps by 2015 Closing the Gaps by 2015 Progress Report Progress Report David W. Gardner David W. Gardner July 31, 2006 July 31, 2006
| Date post: | 01-Jan-2016 |
| Category: |
Documents |
| Upload: | brynn-farrell |
| View: | 49 times |
| Download: | 3 times |

THECB 7/2006
Closing the Gaps by 2015Closing the Gaps by 2015
Progress ReportProgress Report
David W. GardnerDavid W. Gardner
July 31, 2006July 31, 2006

THECB 7/2006
Close the Gaps in Close the Gaps in ParticipationParticipation
By 2015, close the gaps in By 2015, close the gaps in enrollment rates across Texas to enrollment rates across Texas to add 630,000 more students.add 630,000 more students.

THECB 7/2006
Five years of enrollment increases, but Five years of enrollment increases, but from 2004 to 2005, pace slackenedfrom 2004 to 2005, pace slackened
0
200
400
600
800
2000 2005 2010 2015
Th
ou
san
ds Target Actual
200,970

THECB 7/2006
Growth Continues Growth Continues at Two-Year Collegesat Two-Year Colleges
1%
35%
5%
59%
Health-Related
University
Independent
Two-YearCollege
2000 – 2005
21%
18%61%
University
Two-YearCollege
Independent
1995 - 2000
THECB 7/2006
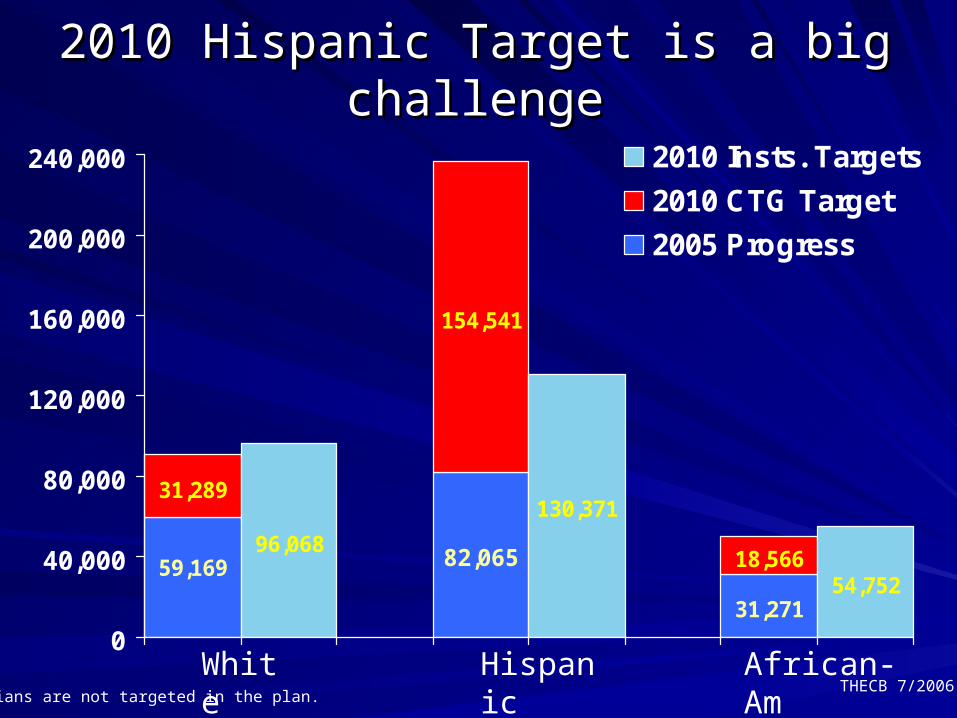
2010 Hispanic Target is a big challenge2010 Hispanic Target is a big challenge
154,541
18,56696,068
130,371
54,75231,271
82,06559,169
31,289
0
40,000
80,000
120,000
160,000
200,000
240,000 2010 Insts. Targets
2010 CTG Target
2005 Progress
* Asians are not targeted in the plan.
White Hispanic African-Am

THECB 7/2006
3 Regions account for 75% of Hispanic 3 Regions account for 75% of Hispanic enrollment increaseenrollment increase
Gulf Coast, 20.3%
Metroplex, 17.5%
Central Tx, 5.7%
So. Texas, 36.5% Others,
7.6%
Upper Rio Grande, 12.2%

THECB 7/2006
108,778108,691105,63699,54194,84992,51088,59286,962
0
20,000
40,000
60,000
80,000
100,000
120,000
1998 1999 2000 2001 2002 2003 2004 2005
The percent of students entering from public high schools increased slightly.
(44.1%)(43.6%) (43.4%)(44.1%)(44.2%)
Percent of GraduatingClass
(44.4%) (45.4%)
Into public higher education only.
(44.5%)

THECB 7/2006
108,778108,691105,636
99,54194,84992,510
88,59286,962
0
20,000
40,000
60,000
80,000
100,000
1998 1999 2000 2001 2002 2003 2004 2005
Recommended & Above Regular
Large increases in the percent of entering students with the Recommended
or above curriculum
55% 53%65%
73%78%
53%
84%
86%

THECB 7/2006
Economically disadvantaged students Economically disadvantaged students less likely to enroll in higher educationless likely to enroll in higher education
60%49% 46%
64% 63%
38%40%35%
0%
20%
40%
60%
80%
100%
White African-Am. Hispanic Asian
Non Economically DisadvantagedEconomically Disadvantaged

THECB 7/2006
ParticipationParticipation
Fall 2004 to fall 2005 enrollment growth Fall 2004 to fall 2005 enrollment growth was lowest increase since 1995was lowest increase since 1995
Hispanic enrollment growth was Hispanic enrollment growth was substantial but continues to trail targetssubstantial but continues to trail targets
Percentage of students coming from high Percentage of students coming from high school increased slightlyschool increased slightly
THECB 7/2006
Close the Gaps in Close the Gaps in SuccessSuccess
By 2015, award 210,000 undergraduate By 2015, award 210,000 undergraduate degrees, certificates and other identifiable degrees, certificates and other identifiable student successes from high quality student successes from high quality programs.programs.

THECB 7/2006
28,963 more Bachelor’s, Associate’s 28,963 more Bachelor’s, Associate’s and Certificates awarded than in 2000and Certificates awarded than in 2000
010203040506070
2000 2005 2010 2015
Th
ou
san
ds
Target Actual
28,963

THECB 7/2006
Public institutions’ 2010 baccalaureate Public institutions’ 2010 baccalaureate awards targets slightly below 2010 CTGawards targets slightly below 2010 CTG
10,726
20,957
15,090
10,40110,700
6,854
0
4,000
8,000
12,000
16,000
20,000
24,000
2010 Insts' Targets
To Reach 2010 CTG Target
2005 Progress
Bachelor’s Associate’s
THECB 7/2006
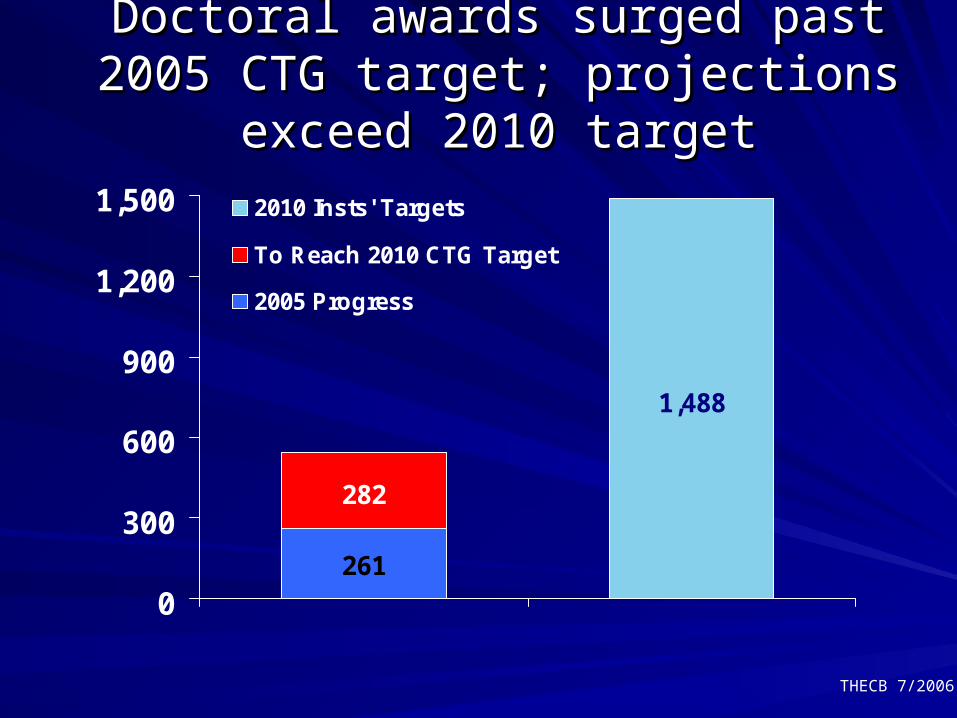
Doctoral awards surged past 2005 CTG Doctoral awards surged past 2005 CTG target; projections exceed 2010 targettarget; projections exceed 2010 target
1,488
261
282
0
300
600
900
1,200
1,500 2010 Insts' Targets
To Reach 2010 CTG Target
2005 Progress

THECB 7/2006
Hispanic undergraduate awards’ Hispanic undergraduate awards’ target is ambitious target is ambitious
3,302
19,929
9,9779,9764,312
14,841
8,260
0
5,000
10,000
15,000
20,000
25,000
30,000 2010 Insts' Target
To Reach 2010 CTG Target
2005 Progress
* Not targeted in the Plan.
White* Hispanic African-Am.

THECB 7/2006
How can we increase graduates in How can we increase graduates in critical fields?critical fields?
16,0549,898
17,205
1,688
4,246
5,843
0
4,000
8,000
12,000
16,000
20,000
24,0002010 Insts' Target
To Reach 2010 CTG Target
2005 Progress
Technology Nursing/Allied Health

THECB 7/2006
UG awards in Allied Health and Nursing UG awards in Allied Health and Nursing may reflect legislative initiatives may reflect legislative initiatives
0
2,000
4,000
6,000
8,000
10,000
12,000
14,000
16,000
18,000

THECB 7/2006
Close the Gaps in Close the Gaps in ExcellenceExcellence
By 2015, substantially increase the By 2015, substantially increase the number of nationally recognized number of nationally recognized programs or services at colleges and programs or services at colleges and universities in Texas.universities in Texas.
THECB 7/2006
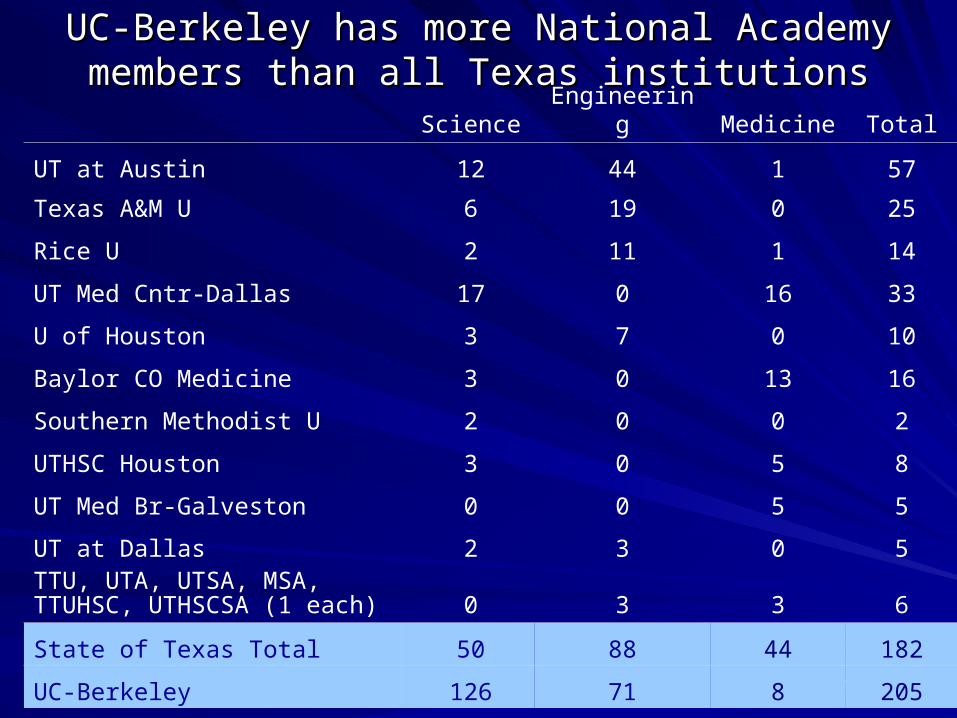
UC-Berkeley has more National Academy UC-Berkeley has more National Academy members than all Texas institutionsmembers than all Texas institutions
Science Engineering Medicine Total
UT at Austin 12 44 1 57
Texas A&M U 6 19 0 25
Rice U 2 11 1 14
UT Med Cntr-Dallas 17 0 16 33
U of Houston 3 7 0 10
Baylor CO Medicine 3 0 13 16
Southern Methodist U 2 0 0 2
UTHSC Houston 3 0 5 8
UT Med Br-Galveston 0 0 5 5
UT at Dallas 2 3 0 5TTU, UTA, UTSA, MSA, TTUHSC, UTHSCSA (1 each) 0 3 3 6
State of Texas Total 50 88 44 182
UC-Berkeley 126 71 8 205

THECB 7/2006
Undergraduate ExcellenceUndergraduate Excellence
Access to excellent undergraduate Access to excellent undergraduate education is criticaleducation is critical
81% of all public university students are 81% of all public university students are undergraduatesundergraduates
91% of all public college and university 91% of all public college and university students are undergraduatesstudents are undergraduates
THECB 7/2006
Close the Gaps in Close the Gaps in ResearchResearch
By 2015, increase the level of federal By 2015, increase the level of federal science and engineering research science and engineering research funding to Texas institutions to 6.5% of funding to Texas institutions to 6.5% of obligations to higher education.obligations to higher education.

THECB 7/2006
Texas has improved its shareTexas has improved its shareof of Federal R&D relative to other top statesFederal R&D relative to other top states
0
500
1000
1500
2000
2500
3000
Mill
ions
2003 1998
(Constant 1998 Dollars)
14.0%
14.9%8.1%
8.3%6.2%
6.4%6.1%
5.3%5.7%
6.0%5.4%
6.2%

THECB 7/2006
Texas’ share of federal obligations Texas’ share of federal obligations for research on course to reach for research on course to reach
2015 target2015 target
0.0%
1.0%
2.0%
3.0%
4.0%
5.0%
6.0%
7.0%

THECB 7/2006
Research Expenditures growth rate appears to be recovering
$0.0 $0.5 $1.0 $1.5 $2.0 $2.5 $3.0
FY 2001
FY 2002
FY 2003
FY 2004
FY 2005
Public Universities Public Health-Related Institutions
3.7%
6.0%
10.4%
1-Year Increase
9.0%
15.9%
(in billions)

THECB 7/2006
Public institution research expenditures have Public institution research expenditures have increased by 29% since 2000 in constant dollarsincreased by 29% since 2000 in constant dollars
$0
$400
$800
$1,200
$1,600
$2,000
$2,400
1990 1992 1994 1996 1998 2000 2002 2004
Health-Related Universities
(Constant 1998 Dollars)(Millions)
1,0761,213
1,3811,3151,294
1,517
1,9411,853

THECB 7/2006
ResearchResearch
Rapid growth in recent years due to Rapid growth in recent years due to increased NIH fundingincreased NIH funding
Prospects for continued NIH increases Prospects for continued NIH increases are uncertainare uncertain
Federal proposals for enhanced NSF Federal proposals for enhanced NSF fundingfunding

THECB 7/2006
Next Steps?Next Steps?
Revise strategies for each Revise strategies for each Closing the Closing the GapsGaps area to focus efforts on pertinent area to focus efforts on pertinent activities that lead to genuine progressactivities that lead to genuine progress
Concentrate on Hispanic participation and Concentrate on Hispanic participation and success success
Create Create Closing the GapsClosing the Gaps state-level state-level committee composed of state business, committee composed of state business, education and civic leaderseducation and civic leaders

THECB 7/2006


