DOE/SC-ARM-17-004 Cloud, Aerosol, and Complex Terrain Interactions (CACTI) Science Plan Revised August 2018 A Varble S Nesbitt P Salio E Zipser S van den Heever G McFarquhar P DeMott S Kreidenweis M Jensen P Kollias D Romps K Rasmussen R Houze, Jr R Leung D Gochis E Avila C Williams P Borque
Transcript
DOE/SC-ARM-17-004
Cloud, Aerosol, and Complex Terrain Interactions
(CACTI) Science Plan
Revised August 2018
A Varble S Nesbitt P Salio E Zipser S van den Heever G McFarquhar P DeMott S Kreidenweis M Jensen P Kollias D Romps K Rasmussen R Houze, Jr R Leung D Gochis E Avila C Williams P Borque
DISCLAIMER
This report was prepared as an account of work sponsored by the U.S. Government. Neither the United States nor any agency thereof, nor any of their employees, makes any warranty, express or implied, or assumes any legal liability or responsibility for the accuracy, completeness, or usefulness of any information, apparatus, product, or process disclosed, or represents that its use would not infringe privately owned rights. Reference herein to any specific commercial product, process, or service by trade name, trademark, manufacturer, or otherwise, does not necessarily constitute or imply its endorsement, recommendation, or favoring by the U.S. Government or any agency thereof. The views and opinions of authors expressed herein do not necessarily state or reflect those of the U.S. Government or any agency thereof.
DOE/SC-ARM-17-004
Cloud, Aerosol, and Complex Terrain
Interactions (CACTI) Science Plan A Varble, Pacific Northwest National Laboratory, University of Utah Principal Investigator S Nesbitt, University of Illinois, Urbana-Champaign P Salio, Universidad de Buenos Aires E Zipser, University of Utah S van den Heever, Colorado State University G McFarquhar, University of Oklahoma P Kollias, Stony Brook University S Kreidenweis, Colorado State University P DeMott, Colorado State University M Jensen, Brookhaven National Laboratory R Houze, Jr, University of Washington K Rasmussen, Colorado State University R Leung, Pacific Northwest National Laboratory D Romps, Lawrence Berkeley National Laboratory D Gochis, National Center for Atmospheric Research E Avila, Universidad Nacional de Córdoba, Argentina C Williams, University of Colorado, Boulder/National Oceanic and Atmospheric Administration P Borque, University of Illinois Co-Investigators Revised August 2018 Work supported by the U.S. Department of Energy, Office of Science, Office of Biological and Environmental Research
A Varble et al., August 2018, DOE/SC-ARM-17-004
iii
Executive Summary
General circulation models and downscaled regional models exhibit persistent biases in deep convective initiation location and timing, cloud top height, stratiform area and precipitation fraction, and anvil coverage. Despite important impacts on the distribution of atmospheric heating, moistening, and momentum, nearly all climate models fail to represent convective organization, while system evolution is not represented at all. Improving representation of convective systems in models requires characterization of their predictability as a function of environmental conditions, and this characterization depends on observing many cases of convective initiation, non-initiation, organization, and non-organization.
The Cloud, Aerosol, and Complex Terrain Interactions (CACTI) experiment in the Sierras de Córdoba mountain range of north-central Argentina is designed to improve understanding of cloud life cycle and organization in relation to environmental conditions so that cumulus, microphysics, and aerosol parameterizations in multiscale models can be improved. The Sierras de Córdoba range has a high frequency of orographic boundary-layer clouds, many reaching congestus depths, many initiating into deep convection, and some organizing into mesoscale systems uniquely observable from a single fixed site. Some systems even grow upscale to become among the deepest, largest, and longest-lived in the world. These systems likely contribute to an observed regional trend of increasing extreme rainfall, and poor prediction of them likely contributes to a warm, dry bias in climate models downstream of the Sierras de Córdoba range in a key agricultural region.
Many environmental factors influence the convective life cycle in this region, including orographic, low-level jet, and frontal circulations, surface fluxes, synoptic vertical motions influenced by the Andes, cloud detrainment, and aerosol properties. Local and long-range transport of smoke resulting from biomass burning as well as blowing dust are common in the austral spring, while changes in land surface properties as the wet season progresses impact surface fluxes and boundary-layer evolution on daily and seasonal time scales that feed back to cloud and rainfall generation. This range of environmental conditions and cloud properties coupled with a high frequency of events makes this an ideal location for improving our understanding of cloud-environment interactions.
The following primary science questions will be addressed through coordinated first U.S. Department of Energy (DOE) Atmospheric Radiation Measurement (ARM) Mobile Facility (AMF1), mobile C-band Scanning ARM Precipitation Radar (C-SAPR2), ARM Aerial Facility (AAF) Gulfstream-1 (G-1), and guest instrument observations:
1. How are the properties and life cycles of orographically generated cumulus humulis, mediocris, and congestus clouds affected by environmental kinematics, thermodynamics, aerosols, and surface properties? How do these cloud types alter these environmental conditions?
2. How do environmental kinematics, thermodynamics, and aerosols impact deep convective initiation, upscale growth, and mesoscale organization? How are soil moisture, surface fluxes, and aerosol properties altered by deep convective precipitation events and seasonal accumulation of precipitation?
This multi-faceted experiment involves a long-term 7-month extended operational period (EOP, 1 October, 2018–30 April, 2019) as well as a 1.5-month intensive operational period (IOP, 30 October–13 December) that will include G-1 observations coinciding with the international multi-agency Remote Sensing of Electrification, Lightning, and Meso-scale/Micro-scale Processes with Adaptive Ground Observations (RELAMPAGO) field campaign.
A Varble et al., August 2018, DOE/SC-ARM-17-004
iv
Acronyms and Abbreviations
AAF ARM Aerial Facility ACDC ARM Cloud Digital Cameras ACSM aerosol chemical speciation monitor AERI atmospheric emitted radiance interferometer AERONET Aerosol Robotic Network ALERT.AR “Forecast of High-Impact Weather events in Argentina: Implementation and
strategies in operations at the National Weather Service” (translated from Spanish)
AMF1 first ARM Mobile Facility AMIE ARM MJO Investigation Experiment AOD aerosol optical depth AOS aerosol observing system APS aerodynamic particle sizer ARM Atmospheric Radiation Measurement user facility ARSCL Active and Remotely Sensed Cloud Boundaries ASR Atmospheric System Research AWS automated weather station BER Biological and Environmental Research CACTI Cloud Aerosol and Complex Terrain Interactions CALIPSO Cloud-Aerosol Lidar and Infrared Pathfinder Satellite Observations CAPS cloud, aerosol, precipitation spectrometer CAS cloud aerosol spectrometer CCN cloud condensation nuclei CESD Climate and Environmental Sciences Division CMIP Coupled Model Intercomparison Project COPE Convective Precipitation Experiment CN condensation nuclei CPC condensation particle counter CRM cloud-resolving model C-SAPR2 C-band Scanning ARM Precipitation Radar 2 CSIP Convective Storm Initiation Project CSU Colorado State University CuPIDO Cumulus Photogrammetric, In situ, and Doppler Observations CVI counterflow virtual impactor DOE U.S. Department of Energy DOMEX DOMinica EXperiment
A Varble et al., August 2018, DOE/SC-ARM-17-004
v
DOW Doppler on wheels ECOR eddy correlation flux measurement system EOP extended operational period FIMS fast integrated mobility spectrometer G-1 Gulfstream 1 aircraft GCCN giant cloud condensation nuclei GCM general circulation model GOAmazon Green Ocean Amazon 2014/15 HSRHI hemispheric range height indicator INP ice nucleating particles IOP intensive operational period IR infrared IS ice spectrometer KAZR Ka-band ARM Zenith Radar LAM limited area model LES large-eddy simulation LT local time MAOS mobile aerosol observing system MC3E Mid-latitude Continental Convective Clouds Experiment MCS mesoscale convective system MET surface meteorological instrumentation MFRSR multifilter rotating shadowband radiometer MMF multiscale modeling framework MODIS Moderate Resolution Imaging Spectroradiometer MPL micropulse lidar MWR microwave radiometer NASA National Aeronautics and Space Administration NCAR National Center for Atmospheric Research NOAA National Oceanic and Atmospheric Administration NSF National Science Foundation NSSL National Severe Storms Laboratory NWP numerical weather prediction PASS-3 3-wavelength photo-acoustic soot spectrometer PCASP passive cavity aerosol spectrometer PILS particle in liquid system PPI plan position indicator RACORO Routine AAF Clouds with Low Optical Water Depths (CLOWD) Optical
Radiative Observations
A Varble et al., August 2018, DOE/SC-ARM-17-004
vi
RCM regional climate model RELAMPAGO Remote sensing of Electrification, Lightning, and Meso-scale/micro-scale
Processes with Adaptive Ground Observations RHI range height indicator RWP radar wind profiler SALLJ South American Low-Level Jet SCM single-column model SEBS surface energy balance system SGP Southern Great Plains SMN Servicio Meteorológico Nacional SMPS scanning mobility particle sizer SODAR Sonic Detection and Ranging SONDE balloon-borne sounding system SP2 single-particle soot photometer Tb brightness temperature TRMM Tropical Rainfall Measuring Mission TWP-ICE Tropical Warm Pool – International Cloud Experiment UAS unmanned aerial system UHSAS ultra-high-sensitivity aerosol spectrometer WACR W-band ARM Cloud Radar X/Ka-SACR X-band/Ka-band Scanning ARM Cloud Radar
A Varble et al., August 2018, DOE/SC-ARM-17-004
vii
Contents
Executive Summary ..................................................................................................................................... iii Acronyms and Abbreviations ...................................................................................................................... iv 1.0 Background ........................................................................................................................................... 1 2.0 Scientific Objectives ............................................................................................................................. 4
5.1 Interactions between Boundary-Layer Clouds and the Environment ......................................... 26 5.2 Deep Convective Initiation and Organization ............................................................................ 30
6.0 Relevancy to the Mission of the DOE Office of BER ........................................................................ 35 7.0 References .......................................................................................................................................... 36
A Varble et al., August 2018, DOE/SC-ARM-17-004
viii
Figures
1 12Z (0900 LT) operational Córdoba soundings (top) courtesy of the University of Wyoming are shown for congestus (left), weak deep convective (middle), and strong deep convective (right) situations with 1330 LT MODIS images on the same days as the soundings. ....................................... 6
2 (a) Frequency of initiation for large MCSs (observed by TRMM satellite for November-December 2002–2010) tracked with IR brightness temperature (Tb). Frequency of IR Tb lower than 235 K for systems that initiate near the Sierras de Córdoba (blue rectangle) between 21Z and 3Z is shown for (b) 00Z, (c) +6 hours forward in time, and (d) +12 hours forward in time ........... 7
3 2009 AERONET sun photometer retrievals of fine (red)- and coarse (blue)-mode aerosol optical depth (AOD) at 500 nm (left) at the Córdoba-CETT site courtesy of Brent Holben and NASA, and MODIS images courtesy of NASA of aerosol sources (right) in the region. .................................. 8
4 MODIS true-color images courtesy of NASA showing typical vegetative change between September (left), November (middle), and March (right). ..................................................................... 9
5 Summertime (DJF) ensemble RCM biases for 2-m temperature (°C; left) and precipitation (mm/month; right). ............................................................................................................................... 10
6 Map of the AMF1, C-SAPR2, west sounding, AWS, and ACDC sites with terrain elevation color filled. ........................................................................................................................................... 11
7 Horizontal (left) and vertical (right) plan views of observation locations with typical circulation vectors overlaid. ................................................................................................................................... 14
8 Three potential flight strategies for orographic cumulus events in horizontal plan views. .................. 20 9 The flight strategy for two deep convective situations in horizontal plan views with precipitation
radar locations. ..................................................................................................................................... 21 10 Map showing key RELAMPAGO fixed assets in relation to the CACTI sites (yellow) and
expected typical orographic deep convective initiation and upscale growth regions. .......................... 24
Tables
1 Subjective determination based on ~1030 and ~1330 LT MODIS imagery of the number of days by month in 2014–2015 that fit into cloud type categories observable from the proposed AMF1 site. .............................................................................................................................................. 5
2 Instrumentation requested as part of the AMF1 and C-SAPR2 deployment. ....................................... 12 3 The AAF payload. ................................................................................................................................ 17 4 List of primary RELAMPAGO and Argentinean instrumentation and funding agencies. ................... 22
A Varble et al., August 2018, DOE/SC-ARM-17-004
1
1.0 Background
Deep convective parameterizations in general circulation models (GCMs) are known to poorly represent the life cycle of moist convective clouds (Del Genio 2012). In GCMs and downscaled models used for regional assessment of climate change impacts and process diagnoses, key aspects of the convective life cycle that are poorly represented include the timing (e.g., diurnal cycle) and location of convective initiation, the upscale growth of the convective ensemble from individual convective thermals to cumulus congestus to isolated deep cumulonimbi (e.g., Hohenegger and Stevens 2013; Hagos et al. 2014) to mesoscale convective systems (MCSs), and the structural evolution and propagation characteristics of mature MCSs (e.g., Del Genio et al. 2012; Song et al. 2013). Better prediction of the initiation and life cycle of these large convective systems should be a top priority because of their dominant contribution to rainfall in many regions of the world, especially over land (Nesbitt et al. 2006), their significant impact on radiation (e.g., Del Genio and Kovari 2002), and their strong influence on vertical and horizontal exchanges of momentum, heat, moisture, and aerosols (e.g., Houze 1989; Storelvmo 2012).
Much of the global MCS population forms in the lee of complex terrain over land, producing more than two-thirds of the annual rainfall in these regions (Laing and Fritsch 1997; Nesbitt et al. 2006; Rasmussen et al. 2016). In these regions, many of which are semi-arid and may have important land surface controls on aerosols, clouds, and precipitation, convective initiation often occurs over topography (e.g., the North American Western Cordillera, South American Andean Cordillera, East African Highlands and Rift, and Himalayas), and convective upscale growth occurs in the lee of the topography, often tied to a fixed diurnal cycle (Kikuchi and Wang 2008). These regions produce the most intense and organized convection on the planet according to satellite proxies (Nesbitt et al. 2006; Zipser et al. 2006), but not all convection is intense or organized. Many studies have highlighted global model deficiencies in representing the diurnal cycle of rainfall in these regions (e.g., Dai 2006), yet few observations exist outside of North America. Improving the representation of these systems in multiscale models is necessary to answering the question of how water and food resources will change in a changing climate.
The ability to parameterize deep convection depends on the predictability of the convective life cycle from initiation through organization to decay, but this predictability has yet to be quantified as a function of environmental conditions. Large MCSs may separate from large-scale control and self-sustain for periods of time, but a MCS first requires convective initiation, upscale growth, and organization that depend on the environment. Studying the full life cycle depends on environmental conditions and is difficult because initiation is usually widely spread geographically, and organization often does not occur near initiation. Deep convection requires conditional instability and removal of convective inhibition, which can be achieved through combinations of horizontal advection, surface fluxes, or upward motion. Predicting convective initiation in GCMs is important, but so is predicting mesoscale convective organization because of its impacts on cloud coverage, distributions of heating, moistening, and momentum, and induced large-scale circulations (Houze 2004). Mesoscale organization depends on environmental humidity, vertical wind shear, cold pools, and mesoscale circulations such as the low-level jet. Regional climate model (RCM) simulations, like GCM simulations, produce dry biases in MCS regions downstream of topography in association with their inability to represent mesoscale organization (e.g., Anderson et al. 2003; Klein et al. 2006). Despite advancements made by incorporating two-dimensional cloud-resolving models in GCMs using a multiscale modeling framework (MMF)
A Varble et al., August 2018, DOE/SC-ARM-17-004
2
(Grabowski 2001; Khairoutdinov and Randall 2001), these formulations still fail to fully support the propagation and three-dimensional flow structure of MCSs (e.g., Ovtchinikov et al. 2006).
Aerosols also impact deep convective properties, but quantifying these impacts has proven difficult, with many conflicting results in the literature. Studies have demonstrated that the sensitivity of deep convection to aerosols varies as a function of the environment, particularly the relative humidity (Yu et al. 2007; Khain et al. 2008), vertical wind shear (Fan et al. 2009), and convective available potential energy (Storer et al. 2010). Others have suggested sensitivities based on vertically location of aerosols (Fridlind et al. 2004), the type of nucleating aerosol present (van den Heever et al. 2006), and the type of cloud systems being considered (Seifert and Beheng 2006; Khain et al. 2008). While individual storm systems may demonstrate a specific response to aerosol forcing, this response may be buffered when considering a regional scene or longer time scale (Stevens and Feingold 2009; van den Heever et al. 2011; Morrison and Grabowski 2013). Dynamical feedbacks further complicate the aerosol response in deep convection. For example, a number of modeling studies have demonstrated a cold pool response to aerosol loading (van den Heever and Cotton 2007; Lee et al. 2008a-b; Storer et al. 2010; Storer and van den Heever 2013), which can impact the organization and strength of MCSs.
Clouds also impact aerosols. Cumulus clouds transport aerosols into the free troposphere, some being cloud-processed. Once in the free troposphere, aerosols are more readily transported over great distances because of lower probabilities of sedimentation. Deep convective storms are able to transport aerosols much further vertically and horizontally than shallow clouds because of the large wind speeds in the upper troposphere, where particles may also interact with radiation and influence the microphysics of cirrus clouds. Wet deposition reduces particle concentrations, but evaporation produces storm-processed aerosols in cold pools, which are likely to be larger in size and pose fewer restrictions to drop activation (Crumeyrolle et al. 2008). Strong surface winds produced by storms also loft aerosols such as dust (Siegel and van den Heever 2012), and precipitation releases biological aerosols, some highly active as ice nucleating particles (INP; Prenni et al. 2013). The way that aerosols are represented in models may significantly influence their activation rate, wet deposition, and ultimate location in the atmosphere.
The surface is a primary source for aerosols, and therefore changes in surface properties impact boundary-layer aerosol properties (Guenther et al. 1995; Fuentes et al. 2000). Surface conditions also affect boundary-layer temperature and humidity evolution through latent and sensible heat fluxes that depend on soil and vegetation properties (e.g., Lemone et al. 2007). Because of this, surface conditions also impact cloud life cycles. Surface properties, however, vary on daily and seasonal time scales because of precipitation, which increases soil moisture and greening of vegetation. Precipitation can also be impacted by soil moisture and evapotranspiration through a surface-precipitation feedback (Findell and Eltahir 2003; Koster et al. 2004). This cycle is important for agriculture and water storage, but GCMs struggle to represent it in regions of the world in which precipitation is primarily produced by MCSs (Taylor et al. 2012), regions that also tend to be major agricultural areas such as the Great Plains and Argentina.
Boundary-layer clouds are also sensitive to surface conditions, and their properties impact convective initiation and cloud radiative forcing. Cumulus cloud statistics can be accumulated using satellite data, but relating these statistics to radiative forcing and environmental conditions (land surface, thermodynamics, kinematics, aerosols) are necessary steps for predicting climate. This requires coincident measurements of the evolution of environmental, radiative, and cloud microphysical and macrophysical properties. Orographic clouds are easier to track than non-orographic clouds because they are anchored to topographic features. They are also more strongly forced by convergent upslope flow and can evolve from
A Varble et al., August 2018, DOE/SC-ARM-17-004
3
small individual cumulus clouds a few hundred meters deep to congestus clouds several kilometers deep to cumulonimbus clouds over 10 km deep with anvil cirrus shields hundreds of km across. Because of this, they strongly interact with the free troposphere and should exhibit clear dynamical, microphysical, and macrophysical sensitivities to environmental conditions. Reproducing these sensitivities is an important test for models of all scales from large-eddy simulations (LES) to GCMs.
Recent experiments including CuPIDO (Damiani et al. 2008), DOMEX (Smith et al. 2012), CSIP (Browning et al. 2007), COPS (Wulfmeyer et al. 2008), and COPE (Blyth et al. 2015) have examined orographic cumulus clouds and/or deep convective initiation, and several recent ARM campaigns have examined deep convective life cycle (TWP-ICE (May et al. 2008), MC3E (Jensen et al. 2010), AMIE (Long et al. 2010, 2011), and GOAmazon 2014/15 (Martin et al. 2013). While these and other campaigns have focused on specific aspects of clouds and the surrounding environment, none have adequately observed the high-resolution evolution of cloud dynamics, microphysics, and macrophysics and related this evolution to local environmental conditions for a large number of cases in one location, which is necessary to adequately address the predictability and parameterization of cloud properties in multiscale models. Questions related to cumulus cloud life cycle, deep convective initiation, mesoscale organization, and land surface-precipitation feedbacks apply to many regions of the world, but answering them requires a unique location where these processes continually operate in close proximity so that sufficient sampling can occur.
The Sierras de Córdoba range in north-central Argentina is perhaps the best location, providing a “real-world laboratory” for answering such questions. Therefore, this is the location chosen for the Cloud, Aerosol, and Complex Terrain Interactions (CACTI) experiment between 1 October 2018 and 30 April 2019, with a primary goal of improving understanding and prediction of cloud life cycles in relation to their environment so that cloud, microphysical, and aerosol parameterizations in multiscale models can be improved. CACTI will use the first ARM Mobile Facility (AMF1), deployable C-band Scanning ARM Precipitation Radar (C-SAPR2), and guest instrumentation to obtain a robust sample of environmental properties including aerosol, cloud, and precipitation measurements in the Sierras de Córdoba mountain range of north-central Argentina. The October to April time frame covers the wet season during which an average of ~700 mm of rainfall is observed in Córdoba, constituting nearly all of the annual precipitation. Higher amounts are found downstream where mature MCSs are more common. Peak amounts in December (150 mm) are greater than the peak over the central and Southern Great Plains (SGP) and much higher than any locations near the Rockies. The biomass burning season extends into November, while dust events are most common in the austral spring following the dry winter season. Vegetation also undergoes significant greening during the wet season. Along with changes in soil moisture, this should impact surface fluxes and boundary-layer cloud properties on daily and seasonal time scales and feed back to rainfall generation.
During a 6-week intensive observation period (IOP) from 30 October to 13 December coincident with the austral spring convective peak, AMF1, C-SAPR2, and guest instrument observations will be complemented by AAF in situ observations of environmental kinematic, thermodynamic, and aerosol properties as well as cloud microphysical properties collected aboard the Gulfstream-1 (G-1) aircraft. This 6-week IOP will overlap with the Argentinean-funded ALERT.AR (“Forecast of High Impact Weather events in Argentina: Implementation and strategies in operations at the National Weather Service”) and multi-agency, National Science Foundation-led, Remote sensing of Electrification, Lightning, and Meso-scale/micro-scale Processes with Adaptive Ground Observations (RELAMPAGO) field campaigns, discussed further in Section 3.3.
A Varble et al., August 2018, DOE/SC-ARM-17-004
4
The CACTI science team covers all areas of expertise necessary for maximizing the chances of a successful field campaign, including convective cloud life cycle, aerosol properties and interactions with clouds, cloud microphysics, cloud and precipitation radar observations, surface and boundary-layer evolution, precipitation properties, and atmospheric modeling. Team members also have extensive experience in designing and running field campaigns. Science team investigators are affiliated with U.S. universities and laboratories as well as Argentinean universities.
2.0 Scientific Objectives
2.1 Science Questions
The following primary science questions will be addressed using CACTI data:
1. How are the properties and life cycles of orographically generated boundary-layer clouds, including cumulus humulis, mediocris, congestus, and stratocumulus, affected by environmental kinematics, thermodynamics, aerosols, and surface properties? How do these clouds types alter the lower free troposphere through detrainment?
We will simultaneously measure the scales and velocities of individual cloud updrafts and downdrafts, including how they evolve in time, and relate these to measurements of cloud microphysical and macrophysical features. We will investigate the ways in which aerosol properties and cloud dynamics impact precipitation and ice initiation in a growing congestus cloud and the ways that these initiations impact subsequent cloud and precipitation evolution. The predictability of cloud coverage, depth, and radiative properties given large-scale environmental conditions will be explored, and the impacts of mesoscale circulations and land surface interactions on local environmental conditions and cloud life cycles will be investigated. Cloud effects on the environment will also be quantified.
2. How do environmental kinematics, thermodynamics, and aerosols impact deep convective initiation, upscale growth, mesoscale organization, and system lifetime? How are soil moisture, surface fluxes, and aerosol properties altered by deep convective precipitation events and seasonal accumulation of precipitation?
We will quantify the mechanisms that transition congestus to deep convection, while relating deep convective dynamical motions to microphysical signatures and macrophysical characteristics of the clouds and precipitation. We will investigate the predictability of deep convective cloud and precipitation properties, including mesoscale organization given knowledge of large-scale environmental conditions, and determine the mechanisms most important for continued growth and/or organization of deep convection. This includes the ways in which cold pool properties depend on environmental and precipitation characteristics. The impact of deep convective precipitation on boundary-layer aerosol and cloud properties through alteration of surface conditions will also be investigated.
To properly measure dynamical, microphysical, and organizational sensitivities to environmental conditions requires a large number of cases with high-frequency observations of surface fluxes, boundary-layer structure, free-tropospheric structure, aerosol properties, cloud microphysical properties, and cloud dynamical/turbulence properties, all of which are measurable with ARM climate research facilities, which provide high-resolution and high-frequency measurements of atmospheric state, aerosols properties,
A Varble et al., August 2018, DOE/SC-ARM-17-004
5
energy fluxes, and cloud microphysics, while a combination of stereo cameras (~20-m resolution) with multi-frequency scanning radars (~50-200-m resolution) allows tracking of individual cumulus clouds through their life cycles and occasional upscale growth to congestus, cumulonimbus, or mesoscale deep convection.
2.2 Rationale for Deployment
Repeated formation, growth, and decay of boundary-layer clouds in the same location
Table 1 shows that, during the 7-month 2014–15 wet season, there were at least 134 days of orographic cumulus clouds observed by Moderate Resolution Imaging Spectroradiometer (MODIS) overpasses, likely an underestimate because of limited sampling times. Daytime surface heating and boundary-layer mixing create anabatic flows that converge near the mountain ridge top, while air masses advected toward the range can also be mechanically forced upward. Cloud tops are limited by the magnitude of the convergence forcing them, the environmental stability, mixing with dry mid-level air, and condensate loading. Repeated cumulus formation in the same approximate location with predictable and measureable free-tropospheric westerly winds make it possible to track individual clouds from birth to maturity with stereo cameras and radars while measuring their interaction with the environment. Table 1 also shows that orographically impacted stratocumulus and overcast conditions also occur frequently enough to be studied in detail, but cumulus clouds are, by far, most common.
Table 1. Subjective determination based on ~1030 and ~1330 LT MODIS imagery of the number of days by month in 2014–2015 that fit into cloud type categories observable from the proposed AMF1 site. Cu is cumulus, Sc is stratocumulus, and Cb is cumulonimbus. Because of limited overpasses, the number of cloud days is a lower limit.
Oct. Nov. Dec. Jan. Feb. Mar. Apr.
Orographic Cu 13 19 15 22 19 24 22
Orographic Sc 6 3 2 5 1 1 4
Orographic Cb 1 7 9 6 8 8 2
Overcast 2 3 6 1 7 5 4
Scattered Non-Orographic Clouds 6 2 4 4 1 0 0
Clear 4 3 3 0 0 1 3
On some days, cumulus clouds remain shallow, but on many days, they grow into vigorous congestus clouds several kilometers deep that typically shear eastward aloft toward the proposed AMF1 site to the east. The 0800 LT Córdoba sounding and 1330 LT MODIS overpass from one of these days is shown in the leftmost panels of Figure 1. Because cumulus clouds are so common and environmental conditions are quite variable (based on 12Z soundings at Córdoba), the sensitivity of cumulus cloud dynamical, microphysical, and macrophysical life cycles to environmental variables such as stability, humidity, vertical wind shear, aerosols, multiscale circulations, and adjacent clouds can be studied with ground instrumentation fixed at one site. Repeated cloud formation in the same location also impacts the local environment through latent and radiative heating, moistening, and aerosol processing and transport. The Sierras de Córdoba is therefore an ideal natural laboratory for studying these two-way interactions between clouds and the surrounding environment. Simulating these interactions is also simplified since the central portion of the Sierras de Córdoba can be approximated as a two-dimensional ridge, which allows for idealized terrain representations in models.
A Varble et al., August 2018, DOE/SC-ARM-17-004
6
Figure 1. 12Z (0900 LT) operational Córdoba soundings (top) courtesy of the University of Wyoming are shown for congestus (left), weak deep convective (middle), and strong deep convective (right) situations with 1330 LT MODIS images on the same days as the soundings. CACTI instrumented sites are shown in orange along with the location of the Argentinean operational C-band radar. The Sierras de Córdoba ridge crest elevation west of the AMF1 site is shown on the soundings in red.
Deep convective initiation, upscale growth, and organization in close proximity
Table 1 shows that orographic deep convective initiation is also very common. At the SGP, there is no analog to the Sierras de Córdoba mountain range that focuses much of the Argentina initiation (Romatschke and Houze 2010; Rasmussen and Houze 2011; Rasmussen and Houze 2016). Figure 2a shows that deep convective systems have a much higher probability of initiating to the immediate east of the Sierras de Córdoba crest than anywhere else. As systems mature (Figure 2b–d), the cold cloud tops propagate eastward, but remain tied to the mountains. Two different deep convective situations are shown in the middle and right panels of Figure 1, one with significant instability and a crest-level inversion at 750 hPa, and another with minimal instability and an inversion-based mixed layer starting at 600 hPa. A survey of other days on which MODIS shows deep convective initiation yields a diverse array of 12Z (8 AM local) Córdoba soundings with a variety of surface-based and elevated instabilities, wind and humidity profiles, and capping inversion heights and strengths (not shown).
A Varble et al., August 2018, DOE/SC-ARM-17-004
7
Figure 2. (a) Frequency of initiation for large MCSs (observed by TRMM satellite for November-
December 2002–2010) tracked with IR brightness temperature (Tb). Frequency of IR Tb lower than 235 K for systems that initiate near the Sierras de Córdoba (blue rectangle) between 21Z and 3Z is shown for (b) 00Z, (c) +6 hours forward in time, and (d) +12 hours forward in time (Vidal et al. 2014, in prep.). The filled white circle shows the proposed AMF1 location.
Figure 2 shows that convective initiation is highest in frequency over the Sierras de Córdoba. Upward motions caused by the orography cool and moisten stable layers, which can destabilize the potentially unstable atmosphere that commonly exists during the wet season in northern Argentina. Once deep convection initiates, environmental conditions and convective-downdraft-produced cold pool properties help determine whether it grows upscale and/or organizes on the mesoscale. Predicting whether decay, upscale growth, or organization will occur is important because these processes determine spatiotemporal cloud and precipitation coverage. Deep convective systems also redistribute heat, moisture, momentum, and aerosols, but the resulting distributions depend on properties of the deep convection. The Sierras de Córdoba and downstream region are different from many worldwide locations such as the U.S. Great Plains in that some deep convective cells quickly grow upscale and begin organizing close to the mountains, often with new convective growth upstream of the system (Anabor et al. 2008; Rasmussen et al. 2014), which is ideal for a fixed instrumentation site to observe the life cycle of convection from shallow cumulus through the beginning of mesoscale convective organization.
The SGP and northern Argentina both experience severe weather with reports of damaging winds, hail, tornadoes, and flooding (Rasmussen et al. 2014). Satellite observations, however, show that the largest MCSs have deeper convection (Zipser et al. 2006), significantly larger cloud shields (Velasco and Fritsch 1987), are of longer duration (Salio et al. 2007; Durkee and Mote 2009), and produce more rainfall (Durkee et al. 2009) in Argentina than over the SGP. Hail and tornado reports also occur most commonly in well-organized mesoscale systems in Argentina, the opposite of systems over the Great Plains (Matsudo and Salio 2010; Rasmussen and Houze 2011). The reasons for these differences are poorly understood because of few observations in Argentina. The Andes are taller and steeper than the Rockies, which may influence the nature of the capping inversion and convective initiation location and timing (Rasmussen and Houze 2016). In addition, the Andes slow the progression of synoptic features across subtropical South America, which provides an environment conducive to prolonged and repeated convective initiation and growth in a narrower region than downstream of the Rockies (Rasmussen and Houze 2015). Such a difference may also impact trapping and transport of aerosols. The South American Low-Level Jet (SALLJ) can also support nocturnal growth of MCSs (Salio et al. 2007; Borque et al. 2010; Nicolini and Skabar 2011) and continued convective development on the west side of MCSs; however, the SALLJ typically requires the synoptic formation of the "Chaco low" in the lee of the Andes (Salio et al. 2007).
A Varble et al., August 2018, DOE/SC-ARM-17-004
8
Variability in aerosol and surface properties
Northern Argentina has a variety of aerosol compositions (see Figure 3), but to date, they have yet to be characterized. Sources include Amazonian biomass burning, which extends into austral spring and produces smoke transported by the SALLJ to Argentina. The region also includes dusty deserts, dry lakebeds and salt flats, local fires, agricultural regions, and the city of Córdoba with over 1 million people. Salt can alter precipitation onset by introducing giant cloud condensation nuclei (GCCN) into a cloud (Johnson 1982; Lasher-Trapp et al. 2001), while desert and soil dusts can initiate ice in supercooled clouds (DeMott et al. 2003; Murray et al. 2012; Tobo et al. 2014). Urban aerosol plumes can impact downwind convective clouds (Ramanathan et al. 2001; Givati and Rosenfeld 2004; Mölders and Olson 2004; Jirak and Cotton 2006; van den Heever and Cotton 2007), while smoke can have a multitude of semi-direct and indirect impacts on cloud properties (Feingold et al. 2005; Lohmann and Feichter 2005; McCluskey et al. 2014).
Figure 3. 2009 AERONET sun photometer retrievals of fine (red)- and coarse (blue)-mode aerosol
optical depth (AOD) at 500 nm (left) at the Córdoba-CETT site courtesy of Brent Holben and NASA, and MODIS images courtesy of NASA of aerosol sources (right) in the region. The potential AMF1 site is shown with white circles.
Figure 3 shows that AOD observed by a former Aerosol Robotic Network (AERONET) site to the southwest of Córdoba is highly variable, with the presence of both clean and dirty continental conditions. The AOD measurements tend to be dominated by either the fine or coarse aerosol mode, with the dominant mode correlated with wind direction. Peaks in fine-mode AOD (likely smoke) are associated with low and mid-level northerly flow, while peaks in coarse-mode AOD (likely dust) are associated with low and mid-level southerly flow. Expansion of agriculture, deforestation, overgrazing, and fires have led to degradation of drylands, which make up 75% of Argentina and account for approximately half of the country’s agricultural and livestock production. This degradation is likely an important factor in dust storms that form behind cold fronts in the austral spring. Winker et al. (2013) suggest most dust transport in the Southern Hemisphere is from South America, peaking from September to November. This coincides with significant biomass burning from the Amazon southward into northern Argentina.
A Varble et al., August 2018, DOE/SC-ARM-17-004
9
Figure 4. MODIS true-color images courtesy of NASA showing typical vegetative change between
September (left), November (middle), and March (right). The red circle shows the AMF1 location.
As a result of accumulated rainfall, northern Argentina also experiences significant increases in green vegetation between the early and late parts of the wet season (see Figure 4), which is likely correlated with increases in soil moisture and evapotranspiration. Surface conditions combined with boundary-layer relative humidity and winds determine the Bowen ratio, the ratio of sensible to latent heating. For a constant surface heat flux, greater latent heating produces greater moistening of the boundary layer with slower temperature rises, whereas greater sensible heating produces the opposite effect. By impacting boundary-layer structure, the surface impacts cloud and precipitation formation and evolution, likely feeding back to the surface conditions on daily and seasonal time scales. GCMs and RCMs show a strong coupling between precipitation and surface conditions in this region (Sörensson and Menéndez 2011); however, precipitation and 2-m temperature are biased in these models, and observations are needed to confirm whether relationships between surface conditions and precipitation are properly represented in models.
GCM/RCM biases
Northern Argentina is known to produce the most extreme convective systems on the planet in terms of their vertical development and horizontal size (Nesbitt et al. 2006; Zipser et al. 2006). The frequency of these systems is often the determinant of flood or drought conditions, and yet the microphysical and kinematic properties of such systems are often poorly predicted in mesoscale and global models. In particular, MCSs are poorly represented, if at all, in GCMs and RCMs, the consequences of which include major model biases, including warm, dry biases downstream of the Rockies (Klein et al. 2006) and Sierras de Córdoba, as shown in Figure 5.
RCMs overestimate orographic rainfall and the frequency of rainfall in subtropical South America, but underestimate total rainfall downstream of the Sierras de Córdoba range, which is a result of underestimated heavy rainfall events (Carril et al. 2012). This is likely associated with insufficient moisture transport by the SALLJ and a lack of mesoscale convective organization in this region, where up to 95% of warm-season rainfall results from deep convection and MCSs (Nesbitt et al. 2006; Rasmussen et al. 2016). RCM precipitation biases also tend to be larger for South America than North America or Europe (Solman et al. 2013), and although these biases are large enough to be trusted, observed rainfall has significant uncertainty because of scarce measurements in the region (Carril et al. 2012). Although
A Varble et al., August 2018, DOE/SC-ARM-17-004
10
RCM output is questionable, they do suggest an increase in warm-season precipitation in a global warming scenario, primarily as a result of increased frequency of extreme rainfall events (Marengo et al. 2010; Kitoh et al. 2010).
Figure 5. Summertime (DJF) ensemble RCM biases for 2-m temperature (°C; left) and precipitation
(mm/month; right). CMIP5 GCMs exhibit similar biases (Flato et al. 2013). The region just downstream of the Sierras de Córdoba is boxed. Figure from Solman et al. (2013).
Northern Argentina is clearly a region with poor climate predictive skill, but one that offers a unique opportunity to study complex interactions between a variety of environmental conditions and the life cycles of aerosols, clouds, and precipitation on a very regular basis throughout the wet season. In particular, repeated orographic shallow cumulus formation, common growth into congestus, frequent convective initiation, and occasional mesoscale convective organization observable from one location makes the Sierras de Córdoba range an ideal location for studying the predictability and parameterization of cloud properties, deep convective initiation, and mesoscale convective organization.
3.0 Measurement Strategies
3.1 AMF1
As shown in Figure 6, the AMF1 will be sited near Villa Yacanto, Argentina (32.12°S, 64.75°W) at an elevation of approximately 1150 m approximately 20 km east of the highest ridge top in the Sierras de Córdoba range. The area has electricity, cellphone service, WiFi, paved road access, and is ideally situated to observe orographic cumulus growth, deep convective initiation, and beginning stages of deep convective organization. This site is also situated to take advantage of the dense RELAMPAGO observational network (see Section 3.3). The C-SAPR2 location is not yet decided, but will potentially be offset from the AMF1 site to the north, as shown in Figure 6. Other sites include a sounding site to the west of the mountains in Villa Dolores to be operated by SMN and a site to the southeast of the AMF1 where ARM Cloud Digital Cameras (ACDCs) will be set up to measure evolution of cumulus cloud boundaries over and west of the AMF1 site. These sites are also shown in Figure 1.
A Varble et al., August 2018, DOE/SC-ARM-17-004
11
Figure 6. Map of the AMF1, C-SAPR2, west sounding, AWS, and ACDC sites with terrain elevation
color filled. A 25-km range ring is shown in orange and a 40-km range ring is shown in green centered on the AMF-1/C-SAPR2 site. Map background courtesy of Google.
The instrumentation being deployed, the measurements that they make, and their usage are summarized in Table 2. Because of newly installed radars, the region extending from Córdoba eastward to Uruguay will have operational C-band radar coverage provided by the Argentinean Servicio Meteorológico Nacional (SMN, equivalent to the U.S. National Weather Service). The AMF1 and C-SAPR2 scanning radars combined with ACDCs will provide observations that the operational radars cannot: high-spatiotemporal-resolution measurements of the dynamical and microphysical evolution of cumulus and deep convective clouds from initiation to maturity, and in the case of many cumulus and congestus clouds, to decay.
A Varble et al., August 2018, DOE/SC-ARM-17-004
12
Table 2. Instrumentation requested as part of the AMF1 and C-SAPR2 deployment. In addition to baseline AMF1 instrumentation, which now includes many instruments previously in the MAOS, C-SAPR2, a pair of ACDCs, and filters to collect INP concentration to be processed offline will be deployed (highlighted in green). Additional non-standard instrumentation includes two automated weather stations that will be deployed off of a 4-wheel-drive road between the AMF1 site and mountain ridge top, an aerodynamic particle sizer (APS) that measures large aerosol sizes, and a lightning mapping array station funded by NASA.
Trace gas concentration Trace gas instrument system Concentration of CO, H2O, N2O, O3
The vertically pointing W-band radar (WACR) has been deployed with the AMF1 in previous field campaigns, but will be replaced by the vertically pointing Ka-band radar (KAZR). KAZR is preferable to WACR because of its similar sensitivity and resolution but less attenuation. KAZR will provide detailed observations of cumulus, early stage deep convection, and convective stratiform/anvil clouds that can be combined with the X- and Ka-band scanning cloud radar (X/Ka-SACR) vertical scans to retrieve cloud water content, ice particle properties, and supercooled liquid layers. The X/Ka-SACR will be used for cloud and precipitation microphysics retrievals for systems evolving over and within 25 km of the AMF1 site. For non-precipitating clouds, these retrievals combined with atmospheric state, radiation, and G-1 observations will be essential for determining environmental (surface, circulation, thermodynamic, aerosol, etc.) impacts on cloud properties. For deep convective systems, these retrievals will be key to linking anvil properties to convective and large-scale environmental properties. An investigation of radar beam blockage patterns (not shown) shows that no beam blockage occurs viewing eastward at low elevation angles and elevation angles of ~5° or greater will not be blocked viewing westward toward the ridge top.
For heavy, deep, convective precipitation, cloud radars experience significant attenuation, and longer-wavelength radars such as C-SAPR2 are needed to retrieve precipitation properties. The C-SAPR2 has a longer range than the X/Ka-SACR and can observe deep convective upscale growth and organization as cells move eastward away from the AMF1. With C-SAPR2 observations, X-band and Ka-band attenuation will be estimated and used in microphysics retrievals. In addition to multi-wavelength polarimetric retrievals, the combination of three wavelengths allows for retrieval of ice properties, hydrometeor identification, and detection of supercooled liquid layers. Additionally, the X-band and C-band observations, separated in location, may allow for cloud dynamics retrievals in precipitation. If mobile X-band radars (Doppler on wheels) are funded as part of RELAMPAGO (see Section 3.3), they can be used with C-SAPR2 for multi-Doppler convective vertical velocity retrievals. The micropulse lidar
A Varble et al., August 2018, DOE/SC-ARM-17-004
14
(MPL) will determine whether optically thin clouds are present, while the ceilometer gives cloud-base height. For non-precipitating clouds, the microwave radiometer will measure liquid water path. All of these measurements are critical components for determining differences between cloud properties that result from changing environmental conditions. They are also vital to several ARM value-added products such as KAZR-ARSCL (Active Remote Sensing of CLouds).
As shown in Figure 6, a pair of ACDCs will be deployed ~5 km to the northeast of the AMF site to provide a reconstruction of cloud boundaries at resolutions of ~20 m and 30 s (Oktem et al. 2014) over and to the west of the AMF site where clouds are of most interest. The stereo cameras will fill gaps in radar scans by providing cloud-base height, cloud size, cloud boundary vertical velocities, and cloud tracking (Romps and Oktem 2015). The ACDC are able to reconstruct the high-frequency evolution of cloud features with high accuracy between approximately 5 and 25 km, so this pair will provide tracking of individual cloud boundaries as they evolve to the west of and over the AMF1 site, providing important life cycle context for vertically pointing and scanning AMF1 measurements.
During overnight and early morning hours, the C-SAPR2 will be in a default mode that mixes surveillance volumes with range height indicator (RHI) scans. The X/Ka-SACR scanning will be in a default RHI mode with intermixed vertical scanning for calibration and retrievals and possible intermixed sector plan position indicator (PPI) scans for context. When cumulus clouds are expected to develop mid-morning through the afternoon, X/Ka-SACR scanning will primarily be in the form of either partial RHIs (e.g., 0–90 degrees) or fully hemispheric RHIs (HSRHIs) with intermixed vertical scans. The precise sequence will depend on whether deep clouds are expected for a given day. Contextualizing sector PPIs at predetermined single or multiple elevation angles that cut through frequent cloud and precipitation initiation regions west of the AMF site may also be performed. The primary purpose of the RHIs is to capture the dynamical and microphysical evolution of features within the convective clouds at high spatiotemporal resolution. As shown in Figure 7, RHIs will step through a number of different azimuthal angles, likely 4–12 that are evenly spaced over all 360 degrees or a sector when RHIs are limited to 90 degrees or less in elevation swath. With each HSRHI taking ~30 seconds, the entire scan pattern will vary between ~2 and 5 minutes. During G-1 aircraft operations, RHIs will attempt to be aligned with flight tracks passing over the site.
Figure 7. Horizontal (left) and vertical (right) plan views of observation locations with typical
circulation vectors overlaid. The horizontal plan view shows a MODIS true-color image of congestus clouds over the Sierras de Córdoba, courtesy of NASA. Yellow lines represent potential RHI azimuths and the 25-km range ring shows the region of most interest for growing convective clouds.
A Varble et al., August 2018, DOE/SC-ARM-17-004
15
C-SAPR2 will be co-located with X/Ka-SACR at the AMF1 site (Figures 6 and 7). It will perform full-volume surveillance scans intermixed will HSRHIs such that observations are balanced between measuring convective cells in high resolution near the site and measuring widespread precipitation conditions over a larger, mesoscale domain that extends up to 100 km away from the site toward the east. Since low levels will be blocked to the west by high terrain, little to no information will be available regarding approaching precipitation west of the mountain range, but this is an intentional sacrifice to focus on the details of clouds and precipitation that form and evolve in the vicinity of the site. The full-volume scans will take 5–8 minutes depending on the number of elevation angles, while HSRHI patterns take ~2–5 minutes. We hope to design a strategy that allows back-to-back HSRHI patterns such that the time evolution of high-resolution precipitation structures near the site can be characterized. However, we also do not want to space volume scans too widely in time because they will be key in characterizing the upscale growth and organization of deep convection to the east of the site. Therefore, we will aim to have combined volume and HSRHI patterns last 10–15 minutes before repeating.
There is potential that the default strategy will be altered to incorporate vertical scans, differing sequencing of volume scans and HSRHIs, or differing numbers of elevation angles depending on the potential for operations with RELAMPAGO radars in the area. However, any deviations from default operations will be limited so that systems observed during the IOP can be adequately contextualized by systems observed outside the IOP. Surveillance volume elevation angles may be spaced more than normal at low levels to better sample mid-upper levels of precipitation, especially near the site where convective precipitation features are of most interest because of other measurements being made there. The optimal number and spacing of HSRHIs for several different situations will be determined using idealized LES simulations with radar simulators before the experiment.
Operational radiosondes are launched at 12Z (9 AM LT) in Córdoba, Resistencia to the far north, Santa Rosa to the far south, Buenos Aires to the southeast, and Mendoza to the west. Additional radiosonde launches supported by the SMN will be launched at Córdoba and Mendoza during at least part of the field campaign. With such a large region covered by so few soundings, the AMF1 surface meteorological instrumentation (MET), balloon-borne sounding system (SONDE), 1290-MHz radar wind profiler (RWP), microwave radiometers (MWRs), and atmospheric emitted radiance interferometer (AERI) will be used to distinguish meteorological regimes and measure local tropospheric thermodynamic and kinematic evolution in association with cloud and precipitation evolution. For forecasted deep convective initiation days, the sounding frequency will increase from 4 times per day to 5–7 soundings, with all soundings between ~0900 and ~2100 LT (12 and 0 UTC, respectively). Because more soundings have been funded through ALERT.AR and are planned for RELAMPAGO (see Section 3.3), the AMF1 radiosondes will be targeted toward process-based questions in addition to large-scale environmental characterization. Examples include the evolution of boundary-layer properties, interaction of larger-scale flows with upslope circulations, impacts of cumulus clouds on downstream free-tropospheric conditions and inversion strength, and changes in environmental conditions impacting convective initiation.
The RWP will provide frequent zonal winds, which will fill in atmospheric properties during time periods in between soundings when combined with MWR retrievals of precipitable water and AERI retrievals of boundary-layer temperature and water vapor profiles. Wind profiles will also be combined with ACDC observations and radar measurements of cloud movement and radial velocity structure to retrieve cloud dynamics. The RWP will additionally be used to retrieve vertical velocity in convective drafts when they pass overhead, as in Giangrande et al. (2013). An additional sounding site with 2–3 times daily (morning and afternoon) soundings will be positioned to the west of the Sierras de Córdoba at the Villa Dolores
A Varble et al., August 2018, DOE/SC-ARM-17-004
16
airport (31.93°S, 65.12°W) so that the troposphere approaching the mountains can be compared to cloud and topography-modified atmosphere over the AMF1 site. Radiosonde launches at this previously existing meteorological monitoring station will be performed by SMN employees.
The surface energy balance system (SEBS) and eddy correlation flux measurement system (ECOR) measurement of soil moisture and surface heat fluxes will be crucial for relating surface fluxes to boundary-layer thermodynamic and kinematic evolution, including impacts on cumulus formation, growth, and organization. Impacts of precipitation events and accumulated wet-season precipitation on soil moisture and surface fluxes will be quantified using a combination of SEBS and ECOR measurements with other precipitation and radiation measurements. The Doppler lidar will be used to monitor the evolution of boundary-layer turbulence, convergence, upslope flow, and vertical motion (including cloud-base vertical velocity) in relation to surface fluxes, mesoscale circulations, and cloud properties. Redundant measurements from rain gauges and disdrometers are important for a number of radar retrievals and for assessing sensitivity of precipitation to environmental conditions and cloud properties. Meteorological observations will be vital for monitoring the evolution of near-surface conditions. Several additional meteorological stations, disdrometers, and rain gauges will also be deployed around the region as part of ALERT.AR, and RELAMPAGO to provide important context for the AMF1 site.
AOD measurements by the Cimel sun photometer and multifilter rotating shadowband radiometer (MFRSR) will be used to characterize tropospheric aerosol loading and to place CACTI observations into the context of multi-year AERONET and satellite observations. The MPL will detect aerosol layers and their impacts on radiation and cloud properties. Combined with aerosol, cloud, atmospheric state, and surface energy measurements, the radiometer measurements will quantify the impact of aerosols and clouds on radiative fluxes and boundary-layer thermodynamic properties. A number of instruments that were previously part of the mobile aerosol observing system (MAOS) will now be deployed with the AMF1; these instruments will be extremely valuable for further examining interactions between aerosols, clouds, and precipitation. Variables measured include condensation nuclei (CN) concentration by the condensation particle counters (CPCs) and cloud condensation nuclei (CCN) concentrations at multiple supersaturations. These are key measurements for characterizing the number of aerosols and condensation nuclei being ingested into clouds, which will be correlated with cloud and precipitation evolution while controlling for other environmental factors to quantify aerosol impacts on clouds. These will also be key measurements for establishing the ways in which precipitation and downdrafts impact boundary-layer aerosol properties, including through new particle formation. The ultra-high-sensitivity aerosol spectrometer (UHSAS) and scanning mobility particle sizer (SMPS) will measure the aerosol size distribution, which is necessary for initializing models and again examining interactions between aerosols, clouds, and precipitation.
Additionally, an aerodynamic particle sizer (APS) will be deployed to measure large aerosols such as dust and salt that are expected to be encountered. Aerosol composition also impacts interactions with clouds and precipitation and will be measured with an aerosol chemical speciation monitor (ACSM), with black carbon concentration measured with the single-particle soot photometer (SP2) and an aethalometer. Aerosol absorption and scattering at a number of wavelengths will be measured with a nepholometer and particle soot absorption photometer (PSAP), aerosol growth will be examined with nepholometers, and a number of trace gases will be measured, as highlighted in Table 2. These measurements will tie together many of the other aerosol measurements in helping to understand the source of air masses (e.g., urban or
A Varble et al., August 2018, DOE/SC-ARM-17-004
17
biomass burning) and co-evolution of aerosol properties with other environmental conditions including clouds and precipitation.
Filters for the offline analyses of immersion freezing of the particles following release into liquid in the Colorado State University (CSU) ice spectrometer (IS) instrument (Hill et al. 2014; Hiranuma et al. 2015) will also be collected at the AMF1 site. Post-processing in the IS device provides a full temperature spectrum of immersion freezing INP from -5°C to approximately 27°C, with limits of detection and resolution largely determined by achievable sample volumes. Sample periods can be up to 24 hours at a 2–3-day frequency. This will provide a timeline of INP for constraining models and investigating factors affecting boundary-layer INP. Additional ARM automated weather stations (AWSs) will be deployed at two locations off of 4-wheel-drive road that connects Villa Yacanto to the top of the mountain ridge as shown in Figure 6. The approximate elevation of these stations will be 1923 m and 2656 m, respectively.
3.2 AAF (G-1)
The AAF (G-1) will be staged at Las Higueras Airport, Rio Cuarto, Argentina (33.09°S, 64.26°W) for 45days from approximately October 30 to December 13. This location is approximately 2–2.5 hours’ drive from the AMF1 location but is ~115 km straight-line distance away. The G-1 will be capable of flying up to 7-km altitude and accommodates external probes to measure atmospheric state, aerosol, and cloud properties. Its range and 4-hour flight duration when fully loaded is sufficient for flight tracks described further below. The C-band operational radar in Córdoba, the ARM radars, and RELAMPAGO C-band radars will be used with near-real-time GOES satellite imagery for keeping the G-1 in safe operating conditions. Daily forecast and decision-making briefings will include CACTI, RELAMPAGO, and AAF personnel such that ground operations do not interfere with flight operations. The different G-1 measurements and their usage are summarized in Table 3.
Table 3. The AAF payload. INP concentration filters for offline processing are added as guest instrumentation (highlighted in green).
Property Instrument Comment
Hydrometeor size distribution
Fast cloud droplet probe (F-CDP) Measures 2–50 µm diameter particles
Cloud particle imager (CPI) Images of cloud particles
Cloud imaging probe (CIP) Redundant measure of precipitation particle sizes (25–1,500 µm diameter) as part of cloud aerosol and precipitation spectrometer (CAPS)
Cloud and aerosol spectrometer (CAS) Measure of large aerosols and redundant measure of small cloud drops (0.5–50 µm) as part of CAPS
Cloud liquid water content (LWC)
A Varble et al., August 2018, DOE/SC-ARM-17-004
18
Property Instrument Comment
Particle volume monitor 100-A (PVM-100A)
Measure of LWC at high frequency
Multi-element water content system (WCM-2000)
Provides measures of LWC, total water content, and derived ice water content; needed for redundant LWC
Hot-wire probe from CAPS Redundant measure of LWC
Cloud extinction (b) Cloud-integrating nephelometer (CIN) Measure of b gives first order impact of clouds on radiation; helps in closure with DSDs
Aerosol sampling
Aerosol isokinetic inlet Sample stream of dry aerosol
Counterflow virtual impactor (CVI) Sampling of evaporated cloud droplet residuals
Video camera P1344 Forward video images behind cockpit window
A Varble et al., August 2018, DOE/SC-ARM-17-004
20
Orographic cumulus clouds. The primary goal for orographic cumulus (mediocris and congestus) flights is to characterize in-cloud dynamics, microphysics, and aerosols as well as the environmental variability around the clouds, focusing on conditions upstream (west) and downstream (east) of clouds at multiple altitudes in the vicinity of the AMF1 site. A secondary focus is characterizing north-south variability in environmental conditions. In situations of significant aerosol heterogeneity as shown in Figure 3, emphasis will be placed on obtaining observations in and out of aerosol plumes in the vicinity of the clouds.
The flight strategy for orographic cumulus clouds is shown in Figure 8, with flight legs at constant altitudes between 3.3 km and 7 km. Potential patterns include a bow-tie (Figure 8, left panel) with radials that cross the AMF1 site while penetrating clouds whenever possible. The advantage of this approach is that flight legs can be performed along HSRHI scans by the C-SAPR2 and Ka/X-SACR radars. Other possible patterns are shown in the middle and right panels of Figure 8 in which north-south and east-west legs are performed to maximize sampling in cloud and in the immediate upstream and downstream vicinity of clouds. The exact location of these legs would depend on the location of clouds during the flight, which is expected to vary by event. The flight strategy and altitudes to be flown will be decided before each flight through consultation between weather forecasters, scientists, and the AAF team. In addition, spiral legs may be performed over the AMF1 site to determine the vertical variability of aerosol characteristics, which is critical for initializing models. Vertical variability of cloud properties may also be measured when clouds are over the site, which will aid remote-sensing retrievals.
Figure 8. Three potential flight strategies for orographic cumulus events in horizontal plan views.
Likely cloud locations are shown in light blue. Flight legs are shown in black. Flight legs would be performed at several predetermined altitudes that depend on the forecasted depth of clouds during the flight.
Deep congestus clouds may contain vigorous updrafts peaking at 10–15 m s-1 based on observations of deep orographic clouds in Arizona during CuPIDO, and clouds extending above 5-km altitude will likely be supercooled. We expect to encounter little ice because ice formation is expected to be associated with quite vigorous clouds that soon after form rimed, precipitating ice that will be avoided by the G-1 because of safety considerations. Observations of cloud/drizzle droplet characteristics will be much more important during these flights than for convective system flights. In addition to bulk water content and cloud/drizzle size distribution measurements (see Table 3), the counterflow virtual impactor (CVI) will be used to sample droplet residuals. In-cloud cloud residuals can then be compared to out-of-cloud aerosols measured on the isokinetic inlet, which will be critical for characterizing the life cycles of aerosols as they pass through the cloud from the boundary layer into the free troposphere.
A Varble et al., August 2018, DOE/SC-ARM-17-004
21
Deep convective systems. On days during which deep convective initiation is anticipated, most flights will begin before deep convective initiation, continuing through a period in which deep convection is occurring. Before initiation, the flight strategy will be similar to the orographic cumulus flight strategy, but following initiation, the focus will be on characterizing environmental properties around the growing deep convection and in adjacent regions with congestus that is not initiating so that the differences in environment can be compared. This strategy is shown in the left panel of Figure 9. Convective inflow and free-tropospheric properties will be important for putting AMF1 observations into context and for providing input to numerical simulations.
Some flights may also target the low-to-mid-level inflow or outflow of mesoscale convective systems as shown in the right panel of Figure 9. G-1 flights in MCS convective inflow, whether in the SALLJ or not, will be outside of clouds and precipitation and thus the focus will be on characterizing the distribution of temperature, humidity, horizontal and vertical winds, and aerosol properties. An example of this flight path is shown in Figure 9 as the flight track to the north of the precipitating area. Aerosol properties will be measured through a combination of instruments that are wing-mounted or in the cabin via the isokinetic ambient inlet. A complete aerosol size distribution will be obtained with the SMPS, the UHSAS, the passive cavity aerosol spectrometer (PCASP), and cloud aerosol spectrometer (CAS) as part of the cloud, aerosol, and precipitation spectrometer (CAPS). Inclusion of the SP2 and particle soot absorption photometer (PSAP) will identify the presence of black carbon particles, their coating thicknesses (degree of atmospheric processing), and diesel or biomass burning origin, using their spectral absorption properties. A single-particle mass spectrometer (MiniSPLAT II; Zelenyuk et al. 2015) will measure the evolution of aerosol composition.
Figure 9. The flight strategy for two deep convective situations in horizontal plan views with
precipitation radar locations. The CSU and CSWR C-band radars are being deployed for RELAMPAGO, which significantly overlaps with the G-1 IOP. Light blue indicates cloud, green indicates light precipitation, and red indicates heavy precipitation. Flight legs are shown in black and are flexible to changing depending on the evolution of each event. The G-1 will always remain at a safe operating distance away from deep convection such that these conceptual diagrams are altered for each situation.
A second focus for flights during MCS conditions is the low-level cold pool outflow generated by convective downdrafts where the aircraft will be directed as low as is safely possible and allowed by air traffic control. An example of this flight leg is shown as the southern flight leg in the right panel of Figure 9. All legs will remain at safe distances away from convective regions. Along with inflow
A Varble et al., August 2018, DOE/SC-ARM-17-004
22
properties, cold pool measurements are crucial for validating high-resolution models and understanding convective upscale growth and organization. Cloud processing will be studied by comparing dry aerosol size distributions in the low-level cold pool outflow with those measured in the convective inflow. The dual-column cloud condensation nuclei counter will help to assess the extent of scavenging/regeneration of hygroscopic particles. Filter collections for the offline analyses of immersion freezing of particles following release into liquid in the CSU IS instrument are also proposed for the G-1, just as they are for the AMF1 site. The condensation particle counter (CPC) 3025A provides a constraint on total particle number concentrations larger than 2.5 nm; together with summed particle counts from size distribution measurements (SMPS, UHSAS, PCASP), the CPC data can indicate if new particle formation occurs, for example in storm outflow. Gas-phase measurements (CO, O3) will aid in characterizing air masses and their sources, especially urban and biomass burning plumes.
The G-1 needs to stay away from deep convection in safe operating locations at all times. The CACTI PI will work with the AAF team to choose flight plans that do not compromise safety, depending on meteorological conditions. All flights are expected to be during the daytime. Multiple science team members with experience directing aircraft in convective situations will be in the field to continuously monitor weather conditions using radar, satellite, and mesonet observations and to communicate potential hazards to the AAF team.
3.3 Synergy with RELAMPAGO
CACTI will overlap with and complement a major international field campaign called RELAMPAGO scheduled for 1 November to 20 December 2018. RELAMPAGO, which stands for Remote sensing of Electrification, Lightning, and Meso-scale/micro-scale Processes with Adaptive Ground Observations, is primarily supported by NSF. A major goal of RELAMPAGO is to understand how and why the convective storms in subtropical South America initiate and organize rapidly on large horizontal scales, becoming statistically more vertically intense with more lightning in the extreme scenarios than counterparts in North America, and yet apparently produce less severe weather. RELAMPAGO, in addition to already awarded funding by the Argentinian National Weather Service to improve the operational radar network, surface observations, and nowcasting efforts, will provide the tools listed in Table 4.
Table 4. List of primary RELAMPAGO and Argentinean instrumentation and funding agencies.
Long-Term Infrastructure
Argentina – Instituto Nacional de Technologia Agropecuaria
C-Band dual-polarization radars at Córdoba (installed May 2015), Anguil and Parana (operational), radars being installed at other sites in north and central Argentina
Argentina (ALERT.AR) 1 mobile and 1 portable radiosonde system, hail pads, disdrometers, integration of Argentinian surface stations and mesonets, increased operational sounding frequency
RELAMPAGO Field Campaign 1
November–20 December 2018)
US NSF Deployment Pool CSU C-band radar (1 November–30 January), CSRW C-band on wheels (COW), 3 CSWR Doppler on wheels (DOWs), 2 CSWR
A Varble et al., August 2018, DOE/SC-ARM-17-004
23
integrated sounding systems, 3 CSWR mobile mesonets, DIAL water vapor lidar
US NSF – Individual Proposals 3 Illinois and 1 CSU mobile radiosonde systems, NCAR/RAL and EOL hydrometeorological network
US NASA Lightning mapping array Brazil CPTEC/INPE/University of São Paulo Precipitation supersite, X-band dual-polarization scanning radar,
RELAMPAGO seeks to provide these measurements over a large region in north-central Argentina that includes the Sierras de Córdoba. Figure 10 shows the anticipated locations of the two C-band radars and the DIAL water vapor lidar that will be deployed. The CSU C-band radar will be deployed for a longer period than the primary RELAMPAGO observing period, with measurements being collected through January 2019. The collective RELAMPAGO instrumentation is expected to greatly complement ARM in situ and remote-sensing observations of atmospheric state, aerosol, cloud, precipitation, radiation, and surface flux properties. RELAMPAGO C-band radars will be extremely helpful for examining mesoscale convective organization that occurs to the east of the Sierras de Córdoba.
In addition, the DOW X-band radars will provide extremely high-resolution, dual-polarization X-band measurements and triple or quad Doppler wind measurements depending on the proximity to available radars. Two lightning mapping arrays (one in the region of the ARM site, the other to the east centered near São Borje, Rio Grande do Sul, Brazil) will measure macroscale lightning information as well as detailed flash structure to infer 4D charge structure, and high-frame-rate lightning cameras will examine flash structure and upper atmospheric discharges. Documentation of the kinematic and microphysical life cycle of convective clouds and their lightning production by the dual-polarization radar/lightning network, as well as vertical velocity estimates provided by X-band dual-Doppler measurements, will be valuable for comparison and validation of ARM measurements. They will also provide measurements of systems as they move eastward away from the AMF1 and C-SAPR2 sites such that the entire convective life cycle can be better characterized for events during the IOP.
DOW POD and mobile mesonets will operate in configurations during DOW sampling over and east of the Sierras de Córdoba to provide surface thermodynamic and wind measurements over a domain under the DOW radar operations area. Existing mesonets similar to the Oklahoma Mesonet that are operated by regional provincial governments will also be used for characterizing surface meteorological evolution, providing critical measurements of the ways in which the boundary layer is being modified in cloud inflow environments and cold pools. In addition, deployment of seven portable/mobile sounding systems with a DIAL water vapor lidar will be crucial for the initialization and evaluation of environmental conditions in LES, CRMs, LAMs, and GCMs.
A Varble et al., August 2018, DOE/SC-ARM-17-004
24
Figure 10. Map showing key RELAMPAGO fixed assets in relation to the CACTI sites (yellow) and
expected typical orographic deep convective initiation and upscale growth regions. The CSU and COW radars will be deployed with the water vapor lidar on the plains to the east of the ARM operations area. RELAMPAGO will additionally include a large number of hydrometeorological, lightning, and mobile radar, mesonet, and sounding facilities, as described in the text.
Radiosondes will be launched up to eight times per day during RELAMPAGO IOPs to understand the environments of convective systems prior to and following convective initiation, including cold pool and convective inflow characteristics. These measurements will be especially useful for examining mesoscale convective organization, which will often occur within range of the C-SAPR2, but away from the AMF1 site. These measurements will also place AMF1 environmental measurements into spatiotemporal context. Hydrometeorological measurements from NCAR/RAL, EOL, and the University of Illinois will
A Varble et al., August 2018, DOE/SC-ARM-17-004
25
cover the Carcaraña River Basin that drains the southern and central Sierras de Córdoba with a focus on flash flood assessment and prediction as well as land-atmosphere interactions studies. These measurements will be available for the entirety of the CACTI field campaign, providing crucial context to land-atmosphere interactions and boundary-layer evolution at the AMF1 site.
4.0 Project Management and Execution
Most instrumentation will operate in a default mode; however, some operations will vary based on forecasted conditions. In particular, radar scans and radiosonde launch times may vary. These will be chosen from a few pre-defined possibilities prior to each day based on whether deep clouds are forecasted or not. Additionally, during the IOP, coordination with RELAMPAGO will be performed at a centralized operations center in Villa Carlos Paz, where the CACTI PI or other designated CACTI science lead will work with the RELAMPAGO forecasting and science teams to formulate daily plans.
CACTI Forecasting: Daily radar and sounding operations will be decided upon by the PI and other science team members at their home institutes and communicated to AMF1 technicians with a lead time of at least one day. During the IOP, a team of forecasters (U.S. and Argentinian students working with the Argentinian National Weather Service) will provide a daily forecast briefing to support flight and RELAMPAGO operations.
Flight Planning Activities: Flight modules will be developed in advance of the IOP and will be chosen based on information from both the AAF team and the RELAMPAGO forecast and science briefings. The PI or another designated individual will communicate with the AAF team in Rio Cuarto to come to agreement on flight plans for each day. This individual will also be in charge of communicating any potential meteorological aircraft hazards to a designated AAF team member during flights through phone and XChat.
CACTI Web Site: An external website, maintained by ARM, will offer meteorological information, real-time imagery, instrument health information, etc. so that CACTI science team members and ARM instrument mentors can detect any potential instrument issues and mitigate data loss. Some of this information will be transmitted to the password-protected RELAMPAGO field catalog during the IOP, which will be used for real-time operations and documenting daily operations.
Reviews and Reporting: We will have intermittent EOP and IOP project reviews to ensure operations are being executed as planned and to determine any changes to procedures. We will conduct post-project reviews at the ASR/ARM Science Team meetings following the project. AMF/AAF project personnel will aid the science team in preparing these status reports.
5.0 Science
AMF1, AAF, C-SAPR2, and guest instrument data will be quality-controlled following the experiment and placed in the ARM Data Center online for use by the scientific community. Full aerosol and cloud/drizzle size distributions will be constructed from the range of instrumentation, being constrained with bulk measurements. Current multi-wavelength cloud radar microphysics algorithms will be tested and applied using the in situ data. ARM translators will be key to this process and the experiment PI and co-investigators will have detailed discussions with ARM translators before, during, and after the
A Varble et al., August 2018, DOE/SC-ARM-17-004
26
experiment. Members of the science team will write several manuscripts based on these data. Much of this research will be supported by funding from science team members’ research grants, which will be obtained by submitting proposals to the DOE ASR program and other agencies such as NSF.
The overarching goal of CACTI is to robustly characterize the macrophysical, microphysical, and dynamical life cycles of convective clouds in a variety of environmental conditions. Such a characterization can be used to improve multiscale model parameterizations, specifically focused on the prediction of cloud fraction, cloud radiative properties, deep convective initiation, and mesoscale convective organization as functions of large-scale environmental properties, the diurnal cycle, and the seasonal cycle. The scientific objectives of CACTI can be roughly separated into two categories: one focused on interactions between boundary-layer clouds and the environment (Section 5.1) and a second focused on deep convective initiation, upscale growth, and organization (Section 5.2).
5.1 Interactions between Boundary-Layer Clouds and the
Environment
Because boundary-layer clouds, and in particular cumulus clouds, are so common over the Sierras de Córdoba during the wet season, the interactions between these clouds and a range of environmental factors discussed in the following sub-sections can be robustly characterized.
Land Surface Properties
Absorbed solar radiation by the land surface induces sensible and latent heat fluxes that warm and moisten air in contact with the surface, and through convective and turbulent motions, this heat and moisture is mixed vertically to form clouds in some situations. These clouds significantly alter the incoming shortwave radiation at the surface because of their high albedo (Hartmann et al. 1992), and couple with boundary-layer turbulence to alter boundary-layer structural evolution (Nicholls and Lemone 1980). They also heat and moisten the atmosphere in ways that can lead to deeper cloud growth and precipitation, while aerosol size and hygroscopicity are increased after cloud processing (e.g., Wurzler et al. 2000). Because they alter lower-tropospheric processes in these important ways, their occurrence and coverage are important to predict in models (Tiedtke et al. 1988). Single-column models often fail miserably to reproduce observed cumulus cloud cover because of weak boundary-layer turbulence and frequent initiation of deep convection (e.g., Lin et al. 2015). LES simulations perform better and are commonly used to test coarser resolution models, but LES models still need more validation.
The prediction of cloud formation and evolution depends on boundary-layer relative humidity, depth, and turbulence, all of which are partly modulated by the Bowen ratio (the ratio of surface sensible to latent heating), which is impacted by atmospheric humidity and surface moisture (Rabin et al. 1990). In subtropical South America, surface properties change as the wet season progresses because of individual precipitation events and accumulation of precipitation. CACTI observations of precipitation, soil moisture, surface sensible and latent heating, upwelling and downwelling radiative fluxes, CCN, boundary-layer temperature, moisture, winds, turbulence, and evolving cloud structures will allow couplings between the surface, boundary layer, and boundary-layer clouds to be quantified. This quantification is vital for validating LES to GCM models so that parameterizations can be improved. Some of this research has been performed at the SGP (e.g., RACORO; Vogelmann et al. 2012), but the Sierras de Córdoba range uniquely presents many observable cases in one location. Orographic and low-
A Varble et al., August 2018, DOE/SC-ARM-17-004
27
level jet circulations as well as frequent growth of small cumulus into congestus and deep convective clouds add real-world complexities to predicting boundary-layer cloud evolution.
The following questions will be addressed with combined CACTI, ALERT.AR, and RELAMPAGO datasets:
• How do surface conditions such as soil moisture and vegetation, as well as atmospheric conditions such as atmospheric relative humidity and wind speed, impact the Bowen ratio?
• How does the Bowen ratio impact the evolution of boundary-layer temperature, relative humidity, depth, and turbulence?
• How does the coupling between surface conditions and boundary-layer structure impact boundary-layer aerosol and cloud properties?
• Can single-column and LES models reproduce observed sensitivities of boundary-layer evolution to surface conditions? If not, what causes differences?
Boundary-Layer Circulations
Clouds are much more frequent over the Sierras de Córdoba than adjacent flat terrain because of circulations induced by the topography. The AMF1 site will be ideally situated to observe thermally and mechanically driven upslope flows (and downslope flows during many nights) so that their properties and impacts on cloud evolution can be quantified as a function of vertical profiles of temperature, humidity, and winds. Previous research has shown that variations in boundary-layer temperature and humidity can determine the location of cloud formation and the size of the clouds when boundary-layer air is lifted by uniform ascent (Nugent and Smith 2014). This will be tested using CACTI observations, because the Sierras de Córdoba range is a ridge that rises 2000 m above surrounding plains and extends from north to south for well over 100 km without any canyons that completely pass through, presenting a large barrier for zonal winds. This simplified topography also allows idealized model setups to simulate boundary-layer clouds observed during CACTI.
A wide range of meteorological conditions is expected, with background mesoscale and synoptic circulations superposed onto the orographic circulations during many events, and the ways that these different circulations impact the observed cloud life cycles will be studied. The synoptically forced Chaco low-pressure center in the lee of the Andes regularly occurs to the west of the Córdoba region, and forces the SALLJ to turn westward after it passes the Andes elbow in Bolivia. At times, this may lead to predominantly northerly flow parallel to the main Sierras de Córdoba ridge axis, and at other times it may lead to easterly upslope flow. There is a pronounced diurnal cycle in the strength of the low-level jet caused by vertical mixing in the boundary layer and variability in the vertical and horizontal dimensions of the jet. The sensitivity of cumulus life cycles to all of these factors will be studied. In particular, the coverage and depth of cumulus clouds as a function of time will be analyzed and understood in terms of changes in convergence, boundary-layer structure, and in-cloud dynamical and microphysical properties.
The following questions will be addressed with CACTI observations:
• How is the evolution of upslope flow affected by surface fluxes and the horizontal and vertical distributions of atmospheric temperature, humidity, and winds?
A Varble et al., August 2018, DOE/SC-ARM-17-004
28
• How do background mesoscale circulations, such as the SALLJ or a cold front, interact with the topography and alter thermal upslope flows?
• How do boundary-layer circulations and thermodynamics impact cloud location and depth as a function of time?
• How well do multiscale models reproduce boundary-layer circulations and observed sensitivities of boundary-layer growth and cloud formation to these circulations? What are sources for model biases?
Free-Tropospheric Interactions
While cumulus clouds are strongly tied to boundary-layer characteristics, they also interact with the free troposphere, with entrainment partly modulating the depth of the clouds. As described in Section 3, a variety of free-tropospheric conditions can be found in subtropical South America. However, flow aloft typically has a strong westerly component associated with the jet stream, and variable lapse rates are influenced by the Andes, with common temperature inversions that “cap” conditionally unstable low-level air. Once-daily soundings at 0800 LT in Córdoba show that the height and strength of these inversions varies greatly, and the impacts of these variations on cloud life cycles will be studied. Morning soundings often show no conditional instability on days when MODIS shows deep congestus or deep convection occurring in the afternoon, and therefore, the atmosphere is rapidly modified to produce instability in some conditions. Advective and surface-flux warming and moistening of low levels, lifting of free-tropospheric air by synoptic and mesoscale circulations, and evaporation of clouds all act to decrease stability and promote deeper cloud growth as a function of time. CACTI observations will elucidate the relative roles of these processes and present cases to test the ability of multiscale models and parameterizations to reproduce these relative roles in different cases.
One particular research target will be the variability of estimated entrainment rates as a function of the large-sale environment and the impact of entrainment on the convective cloud life cycle. Entrainment reduces in-cloud buoyancy, affecting cloud dynamics, microphysics, and size, but accurately measuring it has remained elusive. Jensen and Del Genio (2006) used a simple entraining plume model with radiosonde observations of atmospheric thermodynamics and millimeter-wavelength cloud radar observations from the ARM Nauru site to estimate bulk entrainment rates for tropical cumulus congestus clouds and the environmental factors that influence those entrainment rates. Recent work has aimed at the development of a new technique to estimate profiles of entrainment rate using radar-derived vertical velocity profiles. We will apply these techniques to CACTI observations using the sounding and G-1 observations with vertically pointing cloud radar observations. Compared to previous work, the availability of scanning cloud radars and ACDC for this deployment will help in better determining the life cycle context of developing convective clouds, providing crucial model validation data. Additionally, cloud detrainment moistens the free troposphere downwind of the cloud. The AMF1 site will often be either downwind of or directly underneath clouds, so that entrainment and detrainment effects can be quantified for a large number and variety of cases during CACTI.
The following questions will be addressed with CACTI observations:
• How does the entrainment rate vary as a function of environment, and what impact does it have on cumulus dynamics, microphysics, and macrophysics?
• How does cloud detrainment modify the lower free-tropospheric humidity and stability?
A Varble et al., August 2018, DOE/SC-ARM-17-004
29
• How do orographic, low-level jet, and synoptic circulations modify the free-tropospheric humidity and stability, and what are the relative time scales of these modifications?
• How do impacts of circulations and clouds on the environment feed back to the circulation and cloud evolution?
• How well do multiscale models reproduce the interactions between cloud life cycle and free-tropospheric evolution? When do models perform well and when do they not? What are sources of model biases?
Aerosol Effects
CACTI will focus on aerosol indirect effects through changes in cloud droplet size, although datasets will also contain information on direct and semi-direct effects. Aerosols, just like surface fluxes and multiscale circulations, continuously change and impact cloud macrophysical, microphysical, and dynamical properties. In fact, AOD and size often correlate with circulations in the Córdoba region. Increasing CCN at cloud base tends to increase cloud droplet number concentrations and decrease characteristic cloud droplet size (Khain et al. 2005), which can increase the amount of incoming solar radiation that is reflected back to space and thus alter the cloud radiative forcing (Twomey 1977). A decrease in cloud droplet size may enhance evaporation rates and decrease the probability for drizzle formation (e.g., Heymsfield and McFarquhar 2001), both of which impact cloud dynamical motions in ways that could alter cloud macrophysical evolution. On the other hand, raindrops that do form tend to be larger, which can reduce evaporation and weaken cold pools (e.g., van den Heever and Cotton 2007; May et al. 2011). These effects will be isolated from those of meteorology because of the large numbers of observed clouds and sampled environments provided by CACTI measurements.
In contrast to many aerosol indirect effect studies that focus on correlations between cloud properties and nearby environmental aerosol properties at one point in time, CACTI measurements will be able to characterize aerosol effects on the life cycles of individual clouds and groups of clouds, which includes potential feedbacks that can enhance or buffer these effects. Datasets will provide information for studying correlations between surface CN and CCN, AOD, and possibly free-tropospheric CN and CCN. They will also provide vital information for studying uncertainties and potential biases of satellite studies correlating AOD and cloud fraction or brightness as well as surface-based studies correlating CN with vertically pointing measurements of cloud properties.
In deploying the G-1, aerosol and cloud droplet size distributions, together with meteorological conditions sampled at multiple altitudes, will be essential for modeling and analysis of aerosol-cloud interactions. Spatial and temporal variations of CCN will be characterized to determine the potential linkages between surface conditions (e.g., during greening of vegetation), aerosol size distribution, and CCN number concentrations. Multiscale model simulations with spectral bin microphysics parameterizations (e.g., Khain et al. 2009; Fan et al. 2012) will be evaluated using cloud microphysical measurements from the G-1, satellite, and ground-based observations of cloud structural properties to establish model skill in capturing the cloud structure during its life cycle.
The following questions will be addressed with CACTI datasets:
• As a function of meteorology, how does the low-level CCN concentration impact cloud microphysics, dynamics, macrophysics, and radiative forcing?
A Varble et al., August 2018, DOE/SC-ARM-17-004
30
• How does CCN correlate with CN and AOD for different meteorological conditions and as a function of the diurnal cycle?
• How do out-of-cloud, in-cloud, and cloud-processed aerosol properties relate to one another?
• How well do surface aerosol measurements predict in-cloud aerosol and cloud droplet properties?
• How well do high-resolution simulations with state-of-the-art aerosol and microphysics schemes reproduce observed sensitivities of clouds to aerosol properties, particularly the aerosol size distribution and CCN number concentration?
Validation and Improvement of Models
A primary motivation in obtaining this unprecedented set of observations in subtropical South America is to improve model parameterizations of clouds and precipitation. In particular, we will use CACTI observations to answer the following questions:
• How well do different combinations of surface, boundary-layer, free troposphere, and aerosol variables predict cloud macrophysical, microphysical, and dynamical properties as a function of time in observations and models?
• Can idealized and nested LES simulations using an ensemble of physics schemes reproduce relationships between surface conditions, boundary-layer structure, aerosol properties, and cloud properties when given the range of conditions that were observed? What are the primary causes for differences between simulations and observations?
• Can GCM and NWP simulations reproduce cloud macrophysical, dynamical, and microphysical characteristics as a function of environment and different time scales (diurnal and seasonal)? What are the primary causes of model biases?
5.2 Deep Convective Initiation and Organization
Analysis of deep convection and MCSs observed during CACTI will seek to understand the dependency of deep convective initiation, growth, and organization on environmental properties. It will also involve searching for these dependencies in models and reconciling differences between models and observations, while simultaneously using model output for information on critical processes that cannot be measured.
Transition from Congestus to Cumulonimbus
The transition from congestus to deep convection has major ramifications for the radiation budget, but is poorly predicted in models of all scales, especially GCMs. In situations of large instability, a cloud can inevitably grow past the congestus stage very quickly, but in situations of more marginal instability, congestus clouds can persist for a long time without transitioning to cumulonimbus. Satellite data show that is a common situation over the Sierras de Córdoba range. CACTI data will allow us to study the mechanisms that aid transition from congestus to cumulonimbus. Some mechanisms, such as localized enhanced low-level convergence, moistened mid-levels, and steepened upper-level lapse rates, promote deeper cloud depths that reach temperatures cold enough to form ice. However, the temperature at which ice initially forms is difficult to predict and depends on cloud or drizzle droplet sizes (and thus CCN) and INP characteristics. AMF1, C-SAPR, and G-1 measurements are well-positioned to monitor these
A Varble et al., August 2018, DOE/SC-ARM-17-004
31
mechanisms and determine the timing and location of ice formation as well as the evolution of the cloud dynamics and microphysics after ice forms.
Similarly, radar observations will be able to detect drizzle formation should it occur before ice initiation, which is important because of the potential for precipitation to create downdrafts that enhance low-level convergence and promote transitioning from congestus to cumulonimbus. Observations will also determine the relative roles of surface fluxes, advection, cloud detrainment, and layer lifting in increasing instability and limiting the effects of entrainment on cloud growth. The predictability of these interactions between the environment and transitioning between congestus and cumulonimbus will be explored, since the predictability of these events impacts their parameterization in NWP models and GCMs. Deep convective initiation prediction can certainly be improved in models, but the limits of predictability also require further study.
Specific questions that will be addressed with CACTI datasets include:
• How predictable is the transition from congestus to cumulonimbus, and which combinations of environmental variables are the best predictors of this transition?
• Does warm rain form in congestus clouds? If so, what environmental conditions support warm rain formation, and how does warm rain impact subsequent cloud and precipitation evolution?
• When and where in congestus clouds does ice initiate? How does ice initiation depend on INP properties and other environmental conditions, and how does ice initiation impact subsequent cloud and precipitation evolution?
• How do models with different grid spacing and physics parameterizations perform in predicting deep convective initiation? What model aspects produce the best and worst predictability? Are environmental predictors of initiation the same in models and observations? If not, why not?
Dynamical, Microphysical, and Macrophysical Relationships
The macrophysical, and to a lesser extent microphysical, properties of clouds largely control the impact of clouds on the radiation budget, while coupled dynamical and microphysical processes largely control the impacts of clouds on the heat and moisture budgets. Only by observing the internal evolution of clouds with the coincident evolution of the surrounding non-cloud environment can we understand the relationships between cloud dynamical, microphysical, and macrophysical properties as a function of environment so that cloud parameterizations in multiscale models can be improved. In particular, as a function of environment, uniquely combined CACTI multi-frequency radar and ACDC observations will allow us to study the high-resolution spatiotemporal evolution of cloud updraft and downdraft sizes and strengths. These dynamical characteristics will be related to radar measurements and retrieved microphysical properties such as liquid water content, cloud droplet size, and bulk rain and ice characteristics in and around the drafts as a function of time. This will allow us to interpret interactions between cloud dynamics and microphysics that are occurring and relate these to the macrophysical evolution of the cloud and precipitation. Anvil cirrus expansion rate, coverage, depth, internal dynamical and microphysical structures, and impact on radiative fluxes will be related to environmental conditions and properties of the convective cores producing the anvil.
These relationships between co-evolving cloud dynamics, microphysics, and macrophysics are crucial to analyzing causes of cloud and precipitation biases that consistently appear in cloud-resolving models
A Varble et al., August 2018, DOE/SC-ARM-17-004
32
(CRMs), limited area models (LAMs), single-column models (SCMs), RCMs, and GCMs. Validation of deep convective LES simulations is a rather new phenomenon. Preliminary indications are that these simulations may improve comparisons with observations such as radar reflectivity and convective vertical velocity, but they still exhibit biases. These dynamical, microphysical, and macrophysical biases tend to appear quickly in simulations, highlighting the importance of observing cases from early stages on.
Because only select deep convective cases are typically simulated, it is also unclear how model biases vary as a function of different relevant environmental variables such as instability, humidity, vertical wind shear, and aerosol properties. CACTI will provide observations for many cases in varying conditions that will test the variability of model biases and the ability for models to reproduce observed sensitivity to these environmental variables. As for shallow cumulus and congestus cases, sensitivity simulations will be performed to examine the impacts of aerosols on cloud dynamics and microphysics using G-1 meteorological and aerosol observations as input. Output will be compared against observed cloud and precipitation properties and used to interpret relationships between aerosol, meteorological, and cloud observations.
Specific questions that will be addressed include:
• What size and strength are convective updrafts and downdrafts in congestus and cumulonimbus clouds, and how do draft properties depend on environmental conditions (boundary-layer depth, convective available potential energy, vertical wind shear, and free-tropospheric humidity)?
• How do sub-cloud-scale microphysical features (e.g., regions of large precipitation rate, supercooled water, or specific ice properties) relate to cloud updrafts and downdrafts?
• How do cloud dynamical and microphysical features co-evolve in time, and what impacts do they have on cloud macrophysical evolution?
• How do CCN and INP properties indirectly impact deep convective dynamics and ice microphysics through lofting of supercooled water and ice initiation, and how does this affect cloud top height, anvil expanse/thickness, and rainfall?
• How do relationships between simulated deep convective cloud macrophysics, microphysics, and dynamics compare to observed relationships as a function of the convective life cycle? How do comparisons change with model setup (grid spacing, physics schemes, etc.), and what aspects of parameterizations cause differences between simulations and observations?
Factors Controlling Mesoscale Organization
Upscale growth and organization of deep convection further impacts the radiation budget through the production of more extensive and longer-lived cirrus clouds, but it also strongly impacts the heat and moisture budgets by increasing the ratio of stratiform to convective precipitation with time because heating and moistening profiles in these two types of precipitation are completely different (Schumacher et al. 2007). Only one GCM convective parameterization even attempts to represent stratiform precipitation in MCSs (GFDL model; Donner et al. 2001) despite its significant contribution to global rainfall (Nesbitt et al. 2006) and its impact on global upper tropospheric stability, distribution of moisture, and strength of Hadley and Walker circulations in GCM simulations (Donner et al. 2001). Just as the parameterization of deep convection is impacted by the predictability of deep convective initiation in different large-scale environmental conditions, the parameterization of mesoscale convective organization
A Varble et al., August 2018, DOE/SC-ARM-17-004
33
is impacted by its predictability in different large-scale environmental conditions. This predictability will be analyzed using CACTI observations of many deep convective events, some of which organize and become long lived, and some of which do not.
Congestus and cumulonimbus clouds are frequently visible over the Sierras de Córdoba in satellite imagery, whereas congestus clouds are rarely seen over the surrounding flat terrain, and cumulonimbus clouds over the flat terrain are typically quite vigorous. This seems to indicate that some cumulonimbus clouds that are initiated over the high terrain fail to initiate further deep convection downstream while others do. Processes that control new deep convective development to the east of the high terrain such as interactions of cold pools with environmental vertical wind shear and entrainment will be analyzed. Because the low-level forcing for convective updrafts is different over the flat terrain than it is over the mountains, there may be important differences in updraft dynamical and microphysical structure that result. Should secondary deep convection develop, environmental lapse rate and wind vertical profiles will have a significant impact on the organizational mode — single cell, multi-cell, supercell, squall line, or some combination.
MCSs in subtropical South America have been shown to commonly develop new convection upstream of the mature and decaying convection (Anabor et al. 2008; Rasmussen et al. 2014), often when the SALLJ is present, which allows convection to remain close to the topography in some cases. Predicting the mesoscale organizational mode that develops is important because it affects the system lifetime, anvil cirrus coverage, precipitation coverage and amount, and convective-stratiform precipitation ratio. The environmental conditions that best differentiate between these organizational modes will be researched, and multiscale models will be tested to check whether they reproduce these differentiations.
Sensitivity simulations will be performed to understand the impacts of aerosols on MCS cloud structure and precipitation. The CACTI measurements will be used to constrain models for evaluating the relative importance of microphysical effects (e.g., reduced ice particle size and ice fall speed by aerosols in the anvils) and dynamical effects (e.g., invigoration of convection by latent heat release from larger concentration of smaller cloud drops and ice particles) (Rosenfeld et al. 2008; Fan et al. 2013), which have mostly been investigated for isolated deep convective clouds rather than MCSs. Because deep convection and MCSs occur frequently, the G-1 will be able to sample aerosol size distributions for several cases. A specific focus will be comparing cold pool measurements to model output, testing a model’s ability to accurately simulate aerosol-cloud-precipitation interactions in convective drafts.
Questions that will be addressed by CACTI data include:
• How predictable is the upscale growth and mesoscale organization of deep convection, and which combinations of environmental variables are the best predictors of these processes?
• Which combinations of cold pool strength/depth and ambient environmental conditions promote upscale growth and organization of convection to the east of the mountains and which do not? How important are the SALLJ and gravity waves?
• Which environmental properties best predict convective mode?
• What impacts do aerosols have on mesoscale convective properties such as cold pool strength, and how does organized deep convection alter the distribution of aerosols?
A Varble et al., August 2018, DOE/SC-ARM-17-004
34
• Are multiscale models able to predict situations in which deep convective mesoscale organization occurs and when it does not? Which models perform best and why? How can mesoscale convective organization be represented in GCMs?
Impacts on Aerosols and Land Surface Properties
Deep convection that grows upscale and organizes will produce significant amounts of precipitation over a large region, which will strongly impact surface properties for the days that follow. Changes in soil moisture will be correlated with changes in surface fluxes and alterations in boundary-layer structure that impact aerosol and cloud properties. Over the length of the wet season, the accumulation of large amounts of precipitation increases the coverage of green vegetation, and the ways that this impacts surface fluxes through increased evapotranspiration will also be analyzed. Changes in conditional instability and inversion strength resulting from altered boundary-layer temperature and humidity can impact the probability of deep convection and further precipitation. More precipitation and more intense rain rates increase the potential for runoff, which impacts collection of water in reservoirs and flood potential. Boundary-layer thermodynamic changes caused by the land surface also impact mesoscale circulations responding to horizontal pressure gradients in the boundary layer. The response of cloud coverage, location, and depth to these changes in the boundary layer and surface conditions will be examined using CACTI datasets.
Surface conditions such as soil moisture also impact the rate of wind-driven aerosol production, and vegetation evolution may alter biogenic emissions as a function of time. Precipitation scavenges aerosols, while cloud evaporation leads to processed aerosols that are larger and more hygroscopic than non-processed aerosols. Cumulus clouds transport processed and non-processed aerosols upward into the free troposphere, and deeper clouds transport aerosols to higher altitudes where winds are stronger, although they mix with environmental air at all levels. Deep convection has perhaps the most diverse impacts on aerosol processing, transport, scavenging, and production because it covers the depth of the troposphere, has strong vertical motions that produce substantial supersaturations and potential activation of small Aitken nuclei, produces heavy precipitation, and produces convective downdrafts that transport processed aerosols back into the boundary layer while producing new ones lofted from the surface (Crumeyrolle et al. 2008; Prenni et al. 2013). All of these processes will be studied as the G-1 is deployed with AMF1, ALERT.AR, and RELAMPAGO data used for context.
We will use datasets to answer the following questions:
• How does deep convective rainfall impact soil moisture and vegetation on daily and seasonal time scales?
• How do convective downdrafts feeding cold pools and precipitation alter CCN and INP properties at the surface and in the boundary layer?
• How do surface conditions that change as a result of precipitation feed back to boundary-layer cloud properties and probability of further precipitation (e.g., through the altered probability of convective initiation)?
• Do aerosol and surface schemes in models accurately reproduce observed changes in surface conditions and aerosols that result from precipitation on daily and seasonal time scales?
A Varble et al., August 2018, DOE/SC-ARM-17-004
35
Validation and Improvement of Models
Prediction of convective initiation in GCMs is poor, and mesoscale organization is not represented in all but one GCM, where it is represented quite crudely. One issue holding back progress is lack of knowledge of the predictability of these processes, given environmental conditions. Higher-resolution models such as CRMs and LAMs perform better, but still produce major convective, stratiform, and anvil biases across a variety of models and parameterizations (e.g., Bryan and Morrison 2012; Adams-Selin et al. 2013; Varble et al. 2011, 2014a-b). LES and spectral bin microphysics schemes are expected to improve predictive capabilities, but high-resolution datasets of convective cloud life cycles are lacking, which leaves these models and schemes severely under-constrained.
The high frequency of deep convective development and close proximity of mesoscale organization in the Sierras de Córdoba range will provide a necessary and comprehensive dataset of convective cloud life cycles in association with environmental measurements that will allow new forms of model validation. This validation will focus on comparison of high-resolution cloud dynamical, microphysical, and macrophysical evolution in well-characterized local environmental conditions. It is this type of characterization, focused on cloud dynamical, cloud microphysical, and environmental interactions as a function of time, which is necessary to isolate causes for already well-established deep convective model biases rather than assuming that they originate in one part of one parameterization. Output from all types of models — GCM, RCM, SCM, MMF, CRM, LAM, and LES — will be compared to CACTI datasets, and both idealized and nested setups will be used. Although large-scale forcing will not be available from a sounding array, environmental measurements from ALERT.AR and RELAMPAGO will allow for NWP data assimilation and estimation of multiscale forcings. Idealized setups will be possible because of the pseudo-2D geometry of the Sierras de Córdoba where the AMF1 will be sited, which will allow very high-resolution LES runs to be performed.
Other Research
CACTI instrumentation and measurement strategies are designed to answer the questions listed in the previous sections, but datasets will also contain information that can likely be used for other research as well. Examples include nocturnal initiation of convection and interactions of MCS circulations and stratiform clouds with topography. Nocturnal initiation is not a target of this campaign because predicting and tracking it is difficult, but it will likely be observed in default scanning overnight patterns and many AMF1 environmental measurements will continue through the nighttime hours. MCSs that form in the lee of the Andes near Mendoza occasionally pass over the Sierras de Córdoba overnight, and their interaction with the topography may enhance precipitation in stratiform regions, initiate new convection, or be detrimental to mesoscale circulations helping to maintain the MCS. Mountain waves are also likely to exist, which can alter stratiform cloud properties and amplify precipitation through various mechanisms (e.g., during overcast conditions). AMF1 and C-SAPR2 instrumentation will be well-positioned to observe such processes.
6.0 Relevancy to the Mission of the DOE Office of BER
Among the goals in the DOE Office of Biological and Environmental Research (BER) Climate and Environmental Sciences Division (CESD) strategic plan, one is to “develop and improve global and regional models by focusing on regions vital to climate assessments and regions with known biases and
A Varble et al., August 2018, DOE/SC-ARM-17-004
36
climate sensitivities.” As discussed in Section 1, subtropical South America experiences some of the most extreme convective systems in the world, systems that cause severe weather and flooding and dominate annual rainfall, but systems that GCMs and RCMs fail to represent properly, which is a likely cause of surface temperature and precipitation biases in the region. Like the SGP, subtropical South America is a vital agricultural region of the world. Therefore, more accurately simulating the future climate in this region is very important for predicting future food and water supply.
Little advancement has occurred in reducing convective system cloud and precipitation biases in GCMs and high-resolution models because of a scarcity of high-resolution measurements that fully characterize the evolution of convective environmental thermodynamics, kinematics, and aerosols coincident with cloud and precipitation properties. CACTI will deliver a large dataset of atmospheric state, aerosol, cloud, and precipitation properties far beyond anything ever measured in subtropical South America that can be used to validate high-resolution simulations, improve understanding of cloud processes responsible for model biases, and develop cumulus parameterizations for GCMs.
Another goal in the DOE BER CESD strategic plan is to “determine robust scale-aware relationships for key atmospheric processes, including dynamics and microphysics of stratiform and convective cloud systems, cloud-aerosol interactions, and aerosol indirect effects.” This goal encompasses key CACTI objectives, such as understanding relationships between environmental conditions (kinematics, thermodynamics, and aerosols) and cloud properties (dynamical, microphysical, and macrophysical).
Specific foci include understanding causes for transitions between different types of cumulus clouds, causes for mesoscale organization of shallow and deep convective clouds, and three-way interactions between aerosols, clouds, and precipitation. A related goal of the DOE BER CESD is to use “targeted ARM field campaigns and ARM long-term observations to quantify local atmospheric aerosol and precipitation processes, including aerosol formation, chemical evolution, and optical properties; initiation of cloud droplets, ice crystals, and precipitation, as well as feedbacks involving the terrestrial-aerosol-cloud system.”
CACTI seeks to relate environmental conditions, including aerosol properties, to cloud droplet characteristics, cloud radiative forcing, precipitation initiation, and ice formation, while understanding the ways in which these processes impact subsequent cloud and local environmental evolution. It also seeks to quantify land surface-precipitation feedbacks via altered surface fluxes, boundary-layer structure, cloud properties, and aerosol properties.
7.0 References
Adams-Selin, RD, SC van den Heever, and RH. Johnson. 2013. “Impact of graupel parameterization schemes on idealized bow echo simulations.” Monthly Weather Review 141(4): 1241–1262, https://journals.ametsoc.org/doi/10.1175/MWR-D-12-00064.1
Anabor, V, DJ Stensrud, and OLL de Moraes. 2008. “Serial upstream-propagating mesoscale convective system events over southeastern South America.” Monthly Weather Review 136(8): 3087–3105, https://journals.ametsoc.org/doi/10.1175/2007MWR2334.1
Anderson, CJ, RW Arritt, Z Pan, ES Takle, WJ Gutowski, Jr., FO Otieno, R da Silva, D Caya, JH Christensen, D Luthi, MA Gaertner, C Gallardo, F Giorgi, R Laprise, S-Y Hong, C Jones, H-MH Juang, JJ Katsfey, JL McGregor, WM Lapenta, JW Larson, JA Taylor, GE Liston, RA Pilke, Sr., and J Roads. 2003. “Hydrological processes in regional climate model simulations of the central United States flood of June–July 1993.” Journal of Hydrometeorology 4(3): 584–598, https://journals.ametsoc.org/doi/10.1175/1525-7541%282003%29004%3C0584%3AHPIRCM%3E2.0.CO%3B2
Blyth, AM, LJ Bennett, and CG Collier. 2015. “High-resolution observations of precipitation from cumulonimbus clouds.” Meteorological Applications 22(1): 75–89, https://rmets.onlinelibrary.wiley.com/doi/abs/10.1002/met.1492
Borque, P, P Salio, M Nicolini, and YG Skabar. 2010. “Environment associated with deep moist convection under SALLJ conditions: A case study.” Weather and Forecasting 25(3): 970–984, https://journals.ametsoc.org/doi/10.1175/2010WAF2222352.1
Browning, KA, AM Blyth, PA Clark, U Corsmeier, C Morcrette, JL Agnew, SP Ballard, D Bamber, C Barthlott, LJ Bennett, KM Beswick, M Bitter, KE Bozier, BJ Brooks, CG Collier, F Davies, B Deny, MA Dixon, T Feuerle, RM Forbes, C Gaffard, MD Gray, R Hankers, TJ Hewison, N Kalthoff, S Khodayar, M Kohler, C Kottmeier, S Kraut, M Kunz, DN Ladd, HW Lean, J Lenfant, Z Li, J Marsham, J McGregor, SD Mobbs, J Nicol, E Norton, DJ Parker, F Perry, M Ramatschi, HMA Ricketts, NM Roberts, A Russell, H Schulz, EC Slack, G Vaughan, J Waight, DP Wareing, RJ Watson, AR Webb and A Wieser. 2007. “The Convective Storm Initiation Project.” Bulletin of the American. Meteorological Society 88(12): 1939–1955, https://journals.ametsoc.org/doi/abs/10.1175/BAMS-88-12-1939
Bryan, G, and H Morrison. 2012. “Sensitivity of a simulated squall line to horizontal resolution and parameterization of microphysics.” Monthly Weather Review 140(1): 202–225, https://journals.ametsoc.org/doi/10.1175/MWR-D-11-00046.1
Carril, AF, CG Menendez, ARC Remedio, F Robledo, A Sorensson, B Tencer, J-P Boulanger, M d Castro, D Jacob, H Le Truet, LZX Li, O Penalba, S Pfeifer, M Rusticucci, P Salio, P Samuelsson, E Sanchez, and P Zaninelli, 2012. “Performance of a multi-RCM ensemble for South Eastern South America.” Climate Dynamics 39(12): 2747–2768, https://link.springer.com/article/10.1007/s00382-012-1573-z
Crumeyrolle, S, L Gomes, P Tulet, A Matsuki, A Schwarzenboeck, and K Crahan. 2008. “Increase of the aerosol hygroscopicity by cloud processing in a mesoscale convective system: a case study from the AMMA campaign.” Atmospheric Chemistry and Physics 8(23): 6907–6924, https://www.atmos-chem-phys.net/8/6907/2008/
Dai, A. 2006. “Precipitation characteristics in eighteen coupled climate models.” Journal of Climate 19(18): 4605–4630, https://journals.ametsoc.org/doi/10.1175/JCLI3884.1
Damiani, R, J Zehnder, B Geerts, J Demko, S Haimov, J Petti, GS Poulos, A Razdan, J Hu, M Leuthold, and J French. 2008: “The Cumulus, Photogrammetric, In Situ, and Doppler Observations Experiment of 2006.” Bulletin of the American Meteorological Society 89(1): 57–73, https://journals.ametsoc.org/doi/10.1175/BAMS-89-1-57
Del Genio, AD, and W Kovari. 2002. “Climatic properties of tropical precipitating convection under varying environmental conditions.” Journal of Climate 15(18): 2597–2615, https://journals.ametsoc.org/doi/10.1175/1520-0442%282002%29015%3C2597%3ACPOTPC%3E2.0.CO%3B2
Del Genio, AD. 2012. “Representing the sensitivity of convective cloud systems to tropospheric humidity in general circulation models.” Surveys in Geophysics 33(3–4): 637–656, https://link.springer.com/article/10.1007/s10712-011-9148-9
Del Genio, AD, J Wu, and Y Chen, 2012. “Characteristics of mesoscale organization in WRF simulations of convection during TWP-ICE.” Journal of Climate 25(17): 5666–5688, https://journals.ametsoc.org/doi/10.1175/JCLI-D-11-00422.1
DeMott, PJ, K Sassen, M Poellot, D Baumgardner, DC Rogers, S Brooks, AJ Prenni, and SM Kreidenweis. 2003. “African dust aerosols as atmospheric ice nuclei.” Geophysical Research Letters 30(14): 1732, https://agupubs.onlinelibrary.wiley.com/doi/pdf/10.1029/2003GL017410
Donner, LJ, CJ Seman, RS Hemler, and S Fan. 2001. “A cumulus parameterization including mass fluxes, convective vertical velocities, and mesoscale effects: Thermodynamic and hydrological aspects in a general circulation model.” Journal of Climate 14(16): 3444–3463, https://journals.ametsoc.org/doi/10.1175/1520-0442%282001%29014%3C3444%3AACPIMF%3E2.0.CO%3B2
Durkee, JD, and TL Mote. 2009. “A climatology of warm-season mesoscale convective complexes in subtropical South America.” International Journal of Climatology 30(3): 418–431, https://rmets.onlinelibrary.wiley.com/doi/full/10.1002/joc.1893
Durkee, JD, TL Mote, and JM Shepherd. 2009. “The contribution of mesoscale convective complexes to rainfall across subtropical South America.” Journal of Climate 22(17): 4590–4605, https://journals.ametsoc.org/doi/10.1175/2009JCLI2858.1
Fan, J, T Yuan, JM Comstock, S Ghan, A Khain, LR Leung, Z Li, VJ Martins, and M Ovchinnikov. 2009. “Dominant role by vertical wind shear in regulating aerosol effects on deep convective clouds.” Journal of Geophysical Research 114: D22206, https://agupubs.onlinelibrary.wiley.com/doi/abs/10.1029/2009JD012352
Fan, J, D Rosenfeld, Y Deng, LR Leung, and Z Li. 2012. “Potential aerosol indirect effects on atmospheric circulation and radiative forcing through deep convection.” Geophysical Research Letters 39(9): L09806, https://agupubs.onlinelibrary.wiley.com/doi/10.1029/2012GL051851
Fan, J, LR Leung, D Rosenfeld, Q Chen, Z Li, J Zhang, and H Yan. 2013. “Microphysics effects determine macrophysical response for aerosol impacts on deep convective clouds.” Proceedings of the National Academy of Science of the United States of America 110(48): E4581–E4590, http://www.pnas.org/content/110/48/E4581
Feingold, G, H Jiang, and JY Harrington. 2005. “On smoke suppression of cloud in Amazonia.” Geophysical Research Letters 32(2): L02804, https://agupubs.onlinelibrary.wiley.com/doi/abs/10.1029/2004GL021369
Findell, KL, and EB Eltahir. 2003. “Atmospheric controls on soil moisture-boundary layer interactions. Part I: framework development.” Journal of Hydrometeorology 4(3): 552–569, https://journals.ametsoc.org/doi/10.1175/1525-7541%282003%29004%3C0552%3AACOSML%3E2.0.CO%3B2
Flato, G, J Marotzke, B Abiodun, P Braconnet, SC Chou, W Collins, P Cox, F Driouech, S Emori, V Eyring, C Forest, P Gleckler, E Guilyardi, C Jakob, V Kattsov, C Reason, M Rummukainen. 2013. “Evaluation of Climate Models.” In: Climate Change 2013: The Physical Science Basis. Contribution of Working Group I to the Fifth Assessment Report of the Intergovernmental Panel on Climate Change Stocker, TF, D Qin, G-K Plattner, M Tignor, SK Allen, J Boschung, A Nauels, Y Xia, V Bex and PM Midgley (eds.). Cambridge University Press, Cambridge, UK and New York, NY, USA.
Fridlind, AM, AS Ackerman, EJ Jensen, AJ Heymsfield, MR Poellot, DE Stevens, D Wang, LM Miloshevich, D Baumgardner, RP Lawson, JC Wilson, RC Flagan, JH Seinfeld, HH Jonsson, TM VanReken, V Varutbangkul, and TA Rissman. 2004. “Evidence for the predominance of mid-tropospheric aerosols as subtropical anvil cloud nuclei.” Science 304(5671): 718–722, http://science.sciencemag.org/content/304/5671/718
Fuentes, JD, L Gu, M Lerdau, R Atkinson, D Baldocchi, JW Bottenheim, P Ciccioli, B Lamb, C Geron, A Guenther, TD Sharkey, and W Stockwell. 2000. “Biogenic hydrocarbons in the atmospheric boundary layer: a review.” Bulletin of the American Meteorological Society 81(7): 1537–1575, https://journals.ametsoc.org/doi/abs/10.1175/1520-0477%282000%29081%3C1537%3ABHITAB%3E2.3.CO%3B2
Giangrande, SE, S Collis, J Straka, A Protat, C Williams, and S Krueger. 2013. “A summary of convective-core vertical velocity properties using ARM UHF wind profilers in Oklahoma.” Journal of Applied Meteorology and Climatology 52(10): 2278–2295, https://journals.ametsoc.org/doi/10.1175/JAMC-D-12-0185.1
Givati, A, and D Rosenfeld. 2004. “Quantifying precipitation suppression due to air pollution.” Journal of Applied. Meteorology 43(7): 1038–1056, https://journals.ametsoc.org/doi/abs/10.1175/1520-0450%282004%29043%3C1038%3AQPSDTA%3E2.0.CO%3B2
Grabowski, WW. 2001. “Coupling cloud processes with the large-scale dynamics using the cloud-resolving convection parameterization (CRCP).” Journal of the Atmospheric Sciences 58(9): 978–997, https://journals.ametsoc.org/doi/10.1175/1520-0469%282001%29058%3C0978%3ACCPWTL%3E2.0.CO%3B2
Guenther, A, CN Hewitt, D Erickson, R Fall, C Geron, T Graedel, and P Harley. 1995. “A global model of natural volatile organic compound emissions.” Journal of Geophysical Research – Atmospheres 100(D5): 8873–8892, https://agupubs.onlinelibrary.wiley.com/doi/epdf/10.1029/94JD02950
Hagos, S, Z Feng, K Landu, and CN Long. 2014. “Advection, moistening, and shallow-to-deep convection transitions during the initiation and propagation of Madden-Julian Oscillation.” Journal of Advances in Modeling Earth Systems 6(3): 938–949, https://agupubs.onlinelibrary.wiley.com/doi/full/10.1002/2014MS000335
Hartmann, DL, ME Ockert-Bell, and ML Michelsen. 1992. “The effect of cloud type on Earth’s energy balance: Global analyses.” Journal of Climate 5(11): 1281–1304, https://journals.ametsoc.org/doi/pdf/10.1175/1520-0442%281992%29005%3C1281%3ATEOCTO%3E2.0.CO%3B2
Heymsfield, AJ, and GM McFarquhar. 2001. “Microphysics of INDOEX clean and polluted trade cumulus clouds.” Journal of Geophysical Research – Atmospheres 106(D22): 28653–28673, https://agupubs.onlinelibrary.wiley.com/doi/epdf/10.1029/2000JD900776
Hill, TCJ, BF Moffett, PJ DeMott, DG Georgakopoulos, WL Stump, and GD Franc. 2014. “Measurement of ice nucleation-active bacteria on plants and in precipitation by quantitative PCR.” Applied and Environmental Microbiology 80(4): 1256–1267, http://aem.asm.org/content/80/4/1256.abstract
Hiranuma, N, S Augustin-Bauditz, H Bingemer, C Budke, J Curtius, A Danielczok, K Diehl, K Dreischmeier, M Ebert, F Frank, N Hoffmann, K Kandler, A Kiselev, T Koop, T Leisner, O Mohler, B Nillius, A Peckhaus, D Rose, S Weinbruch, H Wex, Y Boose, PJ DeMott, JD Hader, TCJ Hill, ZA Kanji, G Kulkarni, EJT Levin, CS McCluskey, M Murakami, BJ Murray, D Niedermeier, MD Petters, D O’Sullivan, A Saito, GP Schill, T Tajiri, MA Tolbert, A Welti, TF Whale, TP Wright, and K Yamashita. 2015. “A comprehensive laboratory study on the immersion freezing behavior of illite NX particles: a comparison of 17 ice nucleation measurement techniques.” Atmospheric Chemistry and Physics 15(5): 2489–2518, https://www.atmos-chem-phys.net/15/2489/2015/acp-15-2489-2015.pdf
Hohenegger, C, and B Stevens. 2013. “Preconditioning deep convection with cumulus congestus.” Journal of the Atmospheric Sciences 70(2): 448–464, https://journals.ametsoc.org/doi/full/10.1175/JAS-D-12-089.1
Houze, RA, Jr. 1989. “Observed structure of mesoscale convective systems and implications for large-scale heating.” Quarterly Journal of the Royal Meteorological Society 115(487): 425–461, https://atmos.washington.edu/MG/PDFs/QJR89_houz_observed.pdf
Houze, RA, Jr. 2004. “Mesoscale convective systems.” Review of Geophysics 42(4): RG4003, https://agupubs.onlinelibrary.wiley.com/doi/full/10.1029/2004RG000150
Jensen, MP, and AD Del Genio. 2006. “Factors limiting convective cloud-top height at the ARM Nauru Island Climate Research Facility.” Journal of Climate 19(10): 2105–2117, https://journals.ametsoc.org/doi/full/10.1175/JCLI3722.1
Jensen, MP, P Kollias, AD Del Genio, SE Giangrande, B Orr, WA Petersen, MR Schwaller, AY Hou, SA Rutledge, G Heymsfield, A Heymsfield, and E Zipser. 2010. Mid-Latitude Continental Convective Cloud Experiment (MC3E) Science and Implementation Plan. DOE/ARM Technical Report. DOE/SC-ARM/10-004.
Jirak, IL, and WR Cotton. 2006. “Effect of air pollution on precipitation along the Front Range of the Rocky Mountains.” Journal of Applied Meteorology and Climatology 45(1): 236–245, https://journals.ametsoc.org/doi/full/10.1175/JAM2328.1
Johnson, DB. 1982. “The role of giant and ultragiant aerosol particles in warm rain initiation.” Journal of the Atmospheric Sciences 39(2): 448–460, https://journals.ametsoc.org/doi/pdf/10.1175/1520-0469%281982%29039%3C0448%3ATROGAU%3E2.0.CO%3B2
Khain A, N BenMoshe, and A Pokrovsky. 2008. “Factors determining the impact of aerosols on surface precipitation from clouds: An attempt at classification.” Journal of the Atmospheric Sciences 65: 1721–1748, https://journals.ametsoc.org/doi/full/10.1175/2007JAS2515.1
Khain, AP, LR Leung, BH Lynn, and SJ Ghan. 2009. “Effects of aerosols on the dynamics and microphysics of squall lines simulated by spectral bin and bulk parameterization schemes.” Journal of Geophysical Research – Atmospheres 114(D22): D22203, https://agupubs.onlinelibrary.wiley.com/doi/full/10.1029/2009JD011902
Khairoutdinov, MF, and DA Randall. 2001. “A cloud resolving model as a cloud parameterization in the NCAR Community Climate Model: Preliminary results.” Geophysical Research Letters 28(18): 3617–3620, https://agupubs.onlinelibrary.wiley.com/doi/epdf/10.1029/2001GL013552
Kikuchi, K, and B Wang, 2008. “Diurnal precipitation regimes in the global tropics.” Journal of Climate 21(11): 2680–2696, https://journals.ametsoc.org/doi/full/10.1175/2007JCLI2051.1
Kitoh, A, S Kusunoki, and T Nakaegawa. 2011. “Climate change projections over South America in the late 21st century with the 20 and 60 km mesh Meteorological Research Institute atmospheric general circulation model (MRI-AGCM).” Journal of Geophysical Research 116(D6), https://agupubs.onlinelibrary.wiley.com/doi/full/10.1029/2010JD014920
Klein, SA, X Jiang, J Boyle, S Malyshev, and S Xie. 2006. “Diagnosis of the summertime warm and dry bias over the U.S. Southern Great Plains in the GFDL climate model using a weather forecasting approach.” Geophysical Research Letters 33(18): https://agupubs.onlinelibrary.wiley.com/doi/full/10.1029/2006GL027567
Koster, R, PA Dirmeyer, Z Guo, G Bonan, E Chan, P Cox, CT Gordon, S Kanae, . Kowalczyk, D Lawrence, P.Liu, C-Hsuan Lu, S Malyshev, B McAvaney, K Mitchell, D Mocko, T Oki, K Oleson, A Pitman, YC Sud, CM Taylor, D Verseghy, R Vasic, Y. Xue, T Yamada. 2004. “Regions of strong coupling between soil moisture and precipitation.” Science 305(5687): 1138–1140, http://science.sciencemag.org/content/305/5687/1138.full
Laing, AK, and MG Fritsch. 1997. “The global population of mesoscale convective complexes.” Quarterly Journal of the Royal Meteorological Society 123(538): 389-405, https://rmets.onlinelibrary.wiley.com/doi/full/10.1002/qj.49712353807
Lasher-Trapp, SG, CA Knight, and JM Straka. 2001. “Early radar echoes from ultragiant aerosol in a cumulus congestus: Modeling and observations.” Journal of the Atmospheric Sciences 58: 3545–3561, https://journals.ametsoc.org/doi/full/10.1175/1520-0469%282001%29058%3C3545%3AEREFUA%3E2.0.CO%3B2
Lee, SS, LJ Donner, VTJ Phillips, and Y Ming. 2008a. “Examination of aerosol effects on precipitation in deep convective clouds during the 1997 ARM summer experiment.” Quarterly. Journal of the Royal Meteorological Society 134(634): 1201–1220, https://rmets.onlinelibrary.wiley.com/doi/pdf/10.1002/qj.287
Lee, SS, LJ Donner, VTJ Phillips, and Y Ming. 2008b. “The dependence of aerosol effects on clouds and precipitation on cloud-system organization, shear and stability.” Journal of Geophysical Research – Atmospheres 113: D16202, https://agupubs.onlinelibrary.wiley.com/doi/full/10.1029/2007JD009224
Lemone, MA, F Chen, JG Alfieri, M Tewari, B Geerts, Q Miao, RL Grossman, and RL Coulter. 2007. “Influence of land cover and soil moisture on the horizontal distributions of sensible and latent heat fluxes in southeast Kansas during IHOP_2002 and CASES-97.” Journal of Hydrometeorology 8(1): 68–87, https://journals.ametsoc.org/doi/full/10.1175/JHM554.1
Lin, W, Y Liu, AM Vogelmann, A Fridlind, S Endo, H Song, S Feng, T Toto, Z Li, and M. Zhang. 2015. “RACORO continental boundary layer cloud investigations: 3. Separation of parameterization biases in single-column model CAM5 simulations of shallow cumulus.” Journal of Geophysical Research – Atmospheres 120(12):6015–6033, https://agupubs.onlinelibrary.wiley.com/doi/full/10.1002/2014JD022524
Lohmann, U, and J Feichter. 2005. “Global indirect effects: a review.” Atmospheric Chemistry and Physics 5(3): 715–737, https://www.atmos-chem-phys.net/5/715/2005/acp-5-715-2005.pdf
Long, CN, A Del Genio, P May, W Gustafson, S McFarlane, R Houze, P Minnis, C Jakob, C Schumacher, M Jensen, A Vogelmann, S Klein, Y Wang, LR Leung, X Wu, X Liu, S Xie, E Luke. 2010. AMIE (ARM MJO Investigation Experiment): Observations of the Madden-Julian Oscillation for modeling studies science plan. DOE/ARM Technical Report. DOE/SC-ARM-10-007.
Long, CN, A Del Genio, P May, M Deng, S McFarlane, X Fu, P Minnis, W Gustafson, C Schumacher, R Houze, A Vogelmann, C Jakob, Y Wang, M Jensen, P Webster, R Johnson, S Xie, X Liu, C Zhang, E Luke. 2011. ARM MJO investigation experiment on Gan Island (AMIE-Gan) science plan. DOE/ARM Technical Report DOE/SC-ARM-11-005.
Marengo, JA, T Ambrizzi, RP da Rocha, LM Alves, SV Cuadra, MC Valverde, RR Torres, DC Santos, and SET Ferraz . 2010. “Future change of climate in South America in the late 21st century: Intercomparison of scenarios from three regional climate models.” Climate Dynamics 35(6): 1073–1097, https://link.springer.com/article/10.1007/s00382-009-0721-6
Martin, S. 2013. Observations and modeling of the Green Ocean Amazon: Year-to-year differences. DOE/ARM Technical Report. DOE/SC-ARM-13-009.
Matsudo, CM, and PV Salio. 2011. “Severe weather reports and proximity to deep convection over northern Argentina.” Atmospheric Research: 100(4): 523–527, https://www.sciencedirect.com/science/article/pii/S0169809510003078
May, PT, JH Mather, G Vaughan, KN Bower, C Jakob, GM McFarquhar, and GG Mace. 2008. “The Tropical Warm Pool International Cloud Experiment.” Bulletin of the American Meteorological Society 89(5): 629–645, https://journals.ametsoc.org/doi/pdf/10.1175/BAMS-89-5-629
May, PT, VN Bringi, and M Thurai. 2011. “Do we observe aerosol impacts on DSDs in strongly forced tropical thunderstorms?” Journal of the Atmospheric Sciences 68(9): 1902–1910, https://journals.ametsoc.org/doi/full/10.1175/2011JAS3617.1
McCluskey, CS, PJ DeMott, AJ Prenni, EJT Levin, GR McMeeking, AP Sullivan, TCJ Hill, S Nakao, C M Carrico, and SM Kreidenweis. 2014. “Characteristics of atmospheric ice nucleating particles associated with biomass burning in the US: prescribed burns and wildfires.” Journal of Geophysical Research – Atmospheres 119(17): 10458–10470, https://agupubs.onlinelibrary.wiley.com/doi/full/10.1002/2014JD021980
Mölders, N, and MA Olson. 2004. “Impact of urban effects on precipitation in high latitudes.” Journal of Hydrometeorology 5(3): 409–429, https://journals.ametsoc.org/doi/full/10.1175/1525-7541%282004%29005%3C0409%3AIOUEOP%3E2.0.CO%3B2
Morrison, H, and WW Grabowski. 2013. “Response of tropical deep convection to localized heating perturbations: Implications for aerosol-induced convective invigoration.” Journal of the Atmospheric Sciences 70(11): 3533–3555, https://journals.ametsoc.org/doi/full/10.1175/JAS-D-13-027.1
Murray, BJ, O’Sullivan, D, Atkinson, JD, and ME Webb. 2012. “Ice nucleation by particles immersed in supercooled cloud droplets.” Chemical Society Reviews 41(19): 6519–6554, http://pubs.rsc.org/en/content/articlepdf/2012/cs/c2cs35200a
Nesbitt SW, R Cifelli, and SA Rutledge. 2006. “Storm morphology and rainfall characteristics of TRMM precipitation features.” Monthly Weather Review 134(10): 2702–2721, https://journals.ametsoc.org/doi/full/10.1175/MWR3200.1
Nicholls, S, and MA Lemone. 1980. “The fair weather boundary layer in GATE: The relationship of subcloud fluxes and structure to the distribution and enhancement of cumulus clouds.” Journal of the Atmospheric Sciences 37(9): 2051–2067, https://journals.ametsoc.org/doi/pdf/10.1175/1520-0469%281980%29037%3C2051%3ATFWBLI%3E2.0.CO%3B2
Nicolini, M, and YG Skabar. 2011. “Diurnal cycle in convergence patterns in the boundary layer east of the Andes and convection.” Atmospheric Research 100(4): 377–390, https://www.sciencedirect.com/science/article/pii/S0169809510002577
Nugent, AD, and RB Smith. 2014. “Initiating moist convection in an inhomogeneous layer by uniform ascent.” Journal of the Atmospheric Sciences 71(12): 4597–4610, https://journals.ametsoc.org/doi/full/10.1175/JAS-D-14-0089.1
Oktem, R, Prabhat, J Lee, A Thomas, P Zuidema, and DM Romps. 2014. “Stereophotogrammetry of oceanic clouds.” Journal of Atmospheric and Oceanic Technology 41(7): 1482–1502, https://journals.ametsoc.org/doi/full/10.1175/JTECH-D-13-00224.1
Ovtchinnikov, M, T Ackerman, R Marchand, and M Khairoutdinov. 2006. “Evaluation of the multiscale modeling framework using data from the Atmospheric Radiation Measurement program.” Journal of Climate 19(9): 1716–1729, https://journals.ametsoc.org/doi/full/10.1175/JCLI3699.1
Prenni, AJ, Y Tobo, E Garcia, PJ DeMott, C McCluskey, SM Kreidenweis, J Prenni, A Huffman, U Pöschl, and C Pöhlker. 2013. “The impact of rain on ice nuclei populations at a forested site in Colorado.” Geophysical Research Letters 40(1): https://agupubs.onlinelibrary.wiley.com/doi/full/10.1029/2012GL053953
Rabin, RM, S Stadler, PJ Wetzel, DJ Stensrud, and M Gregory. 1990. “Observed effects of landscape variability on convective clouds.” Bulletin of the American Meteorological Society 71(3): 272–280, https://journals.ametsoc.org/doi/10.1175/1520-0477%281990%29071%3C0272%3AOEOLVO%3E2.0.CO%3B2
Ramanathan, V, PJ Crutzen, JT Kiehl, and D Rosenfeld. 2001. “Aerosols, climate, and the hydrologic cycle.” Science 294(5549): 2119–2124, http://science.sciencemag.org/content/294/5549/2119.full
Rasmussen, KL, and RA Houze, Jr. 2011. “Orogenic convection in subtropical South America as seen by the TRMM satellite.” Monthly Weather Review 139(8): 2399–2420, https://journals.ametsoc.org/doi/full/10.1175/MWR-D-10-05006.1
Rasmussen, KL, and RA Houze, Jr. 2016. “Convective initiation near the Andes in subtropical South America.” Monthly Weather Review 144(6): 2351–2374, https://journals.ametsoc.org/doi/full/10.1175/MWR-D-15-0058.1
Rasmussen, KL, MD Zuluaga, and RA Houze, Jr. 2014. “Severe convection and lightning in subtropical South America.” Geophysical Research Letters 41(20): 7359–7366, https://agupubs.onlinelibrary.wiley.com/doi/full/10.1002/2014GL061767
Rasmussen, KL, MM Chaplin, MD Zuluaga, and RA Houze, Jr. 2015. “Contribution of extreme convective storms to rainfall in South America.” Journal of Hydrometeorology 17(1): 353–367, https://www.researchgate.net/publication/282156653_Contribution_of_Extreme_Convective_Storms_to_Rainfall_in_South_America
Romatschke, U, and RA Houze, Jr. 2010. “Extreme summer convection in South America.” Journal of Climate 23(14): 3761–3791, https://journals.ametsoc.org/doi/full/10.1175/2010JCLI3465.1
Romps, DM, R Oktem. 2015. “Stereo photogrammetry reveals substantial drag on cloud thermals.” Geophysical Research Letters 42(12): 5051–5057, https://agupubs.onlinelibrary.wiley.com/doi/full/10.1002/2015GL064009
Rosenfeld D, U Lohmann, GB Raga, CD O’Dowd, M Kulmala, S Fuzzi, A Reissell, and MO Andreae. 2008. “Flood or drought: How do aerosols affect precipitation?” Science 321(5894): 1309–1313, http://science.sciencemag.org/content/321/5894/1309.full
Salio, P, M Nicolini, and EJ Zipser. 2007. “Mesoscale convective systems over southeastern South America and their relationship with the South American low-level jet.” Monthly Weather Review 135(4): 1290–1309, https://journals.ametsoc.org/doi/full/10.1175/MWR3305.1
Schumacher, C, MH Zhang, and PE Ciesielski. 2007. “Heating structures of the TRMM field campaigns.” Journal of the Atmospheric Science 64(7): 2593–2610, https://journals.ametsoc.org/doi/full/10.1175/JAS3938.1
Seifert, A, and K Beheng. 2006. “A two-moment cloud microphysics parameterization for mixed-phase clouds. Part 2: Maritime vs. continental deep convective storms.” Meteorology and Atmospheric Physics 92(1): 67–82, https://link.springer.com/article/10.1007/s00703-005-0113-3
Seigel, R and SC van den Heever. 2012. “Dust lofting and ingestion by supercell storms.” Journal of the Atmospheric Sciences 69(5): 1453–1473, https://journals.ametsoc.org/doi/pdf/10.1175/JAS-D-11-0222.1
Smith, RB, JR Minder, AD Nugent, T Storelvmo, DJ Kirshbaum, R Warren, N Lareau, P Palany, A James, and J French. 2012. “Orographic precipitation in the tropics: The Dominica Experiment.” Bulletin of the American Meteorological Society 93(10): 1567–1579, https://journals.ametsoc.org/doi/pdf/10.1175/BAMS-D-11-00194.1
Solman, SA, E Sanchez, P Samuelsson, RP da Rocha, L Li, J Marengo, NL Pessacg, ARC Remedio, SC Chow, H Berbery, H Le Treut, M de Castro, and D Jacob, . 2013. “Evaluation of an ensemble regional climate model simulations over South America driven by the ERA-Interim reanalyses: model performance and uncertainties.” Climate Dynamics, 41(5): 1139–1157, https://link.springer.com/article/10.1007/s00382-013-1667-2
Song, H, W Lin, Y Lin, AB Wolf, R. Neggers, LJ Donner, AD Del Genio, and Y Liu. 2013. “Evaluation of precipitation simulated by seven SCMs against the ARM observations at the SGP site.” Journal of Climate 26(15): 5467–5492, https://journals.ametsoc.org/doi/10.1175/JCLI-D-12-00263.1
Sörensson, AA, and CG Menéndez. 2011. “Soil-precipitation coupling in South America.” Tellus 63A(1): 56–68, https://onlinelibrary.wiley.com/doi/full/10.1111/j.1600-0870.2010.00468.x
Stevens, B, and G Feingold. 2009. “Untangling aerosol effects on clouds and precipitation in a buffered system.” Nature 461: 607–613, https://www.nature.com/articles/nature08281
Storelvmo, T. 2012. “Uncertainties in aerosol direct and indirect effects attributed to uncertainties in convective transport mechanisms.” Atmospheric Research 118: 357–369, https://www.sciencedirect.com/science/article/pii/S0169809512002190
Storer, RL, SC van den Heever, and GL Stephens. 2010. “Modeling aerosol impacts on convective storms in different environments.” Journal of the Atmospheric Sciences 67(12): 3904–3915, https://journals.ametsoc.org/doi/full/10.1175/2010JAS3363.1
Storer, RL, and SC van den Heever. 2013. “Microphysical processes evident in aerosol forcing of tropical deep convective clouds.” Journal of the Atmospheric Sciences 70(2): 430–446, https://journals.ametsoc.org/doi/full/10.1175/JAS-D-12-076.1
Taylor, CM, R AM de Jeu, F Guichard, PP Harris, and WA Dorigo. 2012. “Afternoon rain more likely over drier soils.” Nature 489: 423–426, https://www.nature.com/articles/nature11377.pdf
Tiedtke, M, WA Heckley, and J Slingo. 1988. “Tropical forecasting at ECMWF: The influence of physical parameterization on the mean structure of forecasts and analyses.” Quarterly Journal of the Royal Meteorological Society 114(481): 639–664, https://rmets.onlinelibrary.wiley.com/doi/abs/10.1002/qj.49711448106
Tobo, Y, PJ DeMott, TCJ Hill, AJ Prenni, NG Swoboda-Colberg, GD Franc, and SM Kreidenweis. 2014. “Organic matter matters for ice nuclei of agricultural soil origin.” Atmospheric Chemistry and Physics 14(16): 8521–8531, https://www.atmos-chem-phys.net/14/8521/2014/acp-14-8521-2014.pdf
Van den Heever, SC, GG Carrio, WR Cotton, PJ DeMott, and AJ Prenni. 2006. “Impacts of nucleating aerosol on Florida storms. Part I: Mesoscale simulations.” Journal of the Atmospheric Sciences 63(7): 1752–1775, https://journals.ametsoc.org/doi/full/10.1175/JAS3713.1
Van den Heever, SC and WR Cotton. 2007. “Urban aerosol impacts on downwind convective storms.” Journal of Applied Meteorology and Climatology 46(6): 828–850, https://journals.ametsoc.org/doi/full/10.1175/JAM2492.1
Van den Heever SC, GL Stephens, and NB Wood. 2011. “Aerosol indirect effects on radiative-convective equilibrium.” Journal of the Atmospheric Sciences 68(4): 699–718, https://journals.ametsoc.org/doi/full/10.1175/2010JAS3603.1
Varble, A, AM Fridlind, EJ Zipser, AS Ackerman, J-P Chaboureau, J Fan, A Hill, SA McFarlane, J-P Pinty, and B Shipway. 2011. “Evaluation of cloud-resolving model intercomparison simulations using TWP-ICE observations: Precipitation and cloud structure.” Journal of Geophysical Research – Atmospheres 116(D12): D12206, https://agupubs.onlinelibrary.wiley.com/doi/full/10.1029/2010JD015180
Varble, A, EJ Zipser, AM Fridlind, P Zhu, AS Ackerman, J-P Chaboureau, S Collis, J Fan, A Hill, and B Shipway. 2014. “Evaluation of cloud-resolving and limited area model intercomparison simulations using TWP-ICE observations: 1. Deep convective updraft properties.” Journal of Geophysical Research – Atmospheres 119(24): 13,891–13,918, https://agupubs.onlinelibrary.wiley.com/doi/full/10.1002/2013JD021371
Varble, A, EJ Zipser, AM Fridlind, P Zhu, AS Ackerman, J-P Chaboureau, J Fan, A Hill, B Shipway, and CR Williams. 2014. “Evaluation of cloud-resolving and limited area model intercomparison simulations using TWP-ICE observations: 2. Precipitation microphysics.” Journal of Geophysical Research – Atmospheres 119(24): 13,919–13,945, https://agupubs.onlinelibrary.wiley.com/doi/abs/10.1002/2013JD021372
Velasco, I, and JM Fritsch. 1987. “Mesoscale convective complexes in the Americas.” Journal of Geophysical. Research – Atmospheres 92(D8): 9591–9613, https://agupubs.onlinelibrary.wiley.com/doi/epdf/10.1029/JD092iD08p09591
Vogelmann, AM, GM McFarquhar, JA Ogren, DD Turner, JM Comstock, G Feingold, CN Long, HH Jonsson, A Bucholtz, DR Collins, GS Diskin, H Gerber, RP Lawson, RK Woods, E Andrews, H-J Yang, JC Chiu, D Hartsock, JM Hubbe, C Lo, A Marshak, JW Monroe, SA McFarlane, B Schmid, JM Tomlinson, and T Toto. 2012. “Racoro extended-term aircraft observations of boundary layer clouds.” Bulletin of the American Meteorological Society 93(6): 861–878, https://journals.ametsoc.org/doi/full/10.1175/BAMS-D-11-00189.1
Winker, DM, JL Tuckett, BJ Getzewich, Z Liu, MAVaughan, and RR Rogers. 2013. “The global 3-D distribution of tropospheric aerosols as characterized by CALIOP.” Atmospheric Chemistry and Physics 13(6): 3345–3361, https://www.atmos-chem-phys.net/13/3345/2013/acp-13-3345-2013.pdf
Wulfmeyer, V, A Behrendt, C Kottmeier, U Corsmeier, C Barthlott, GC Craig, M Hagen, D Althausen, F Aoshima, M Arpagaus, HS Bauer, L Bennett, A Blyth, C Brandau, C Champpollion, S Crewell, G Dick, P Di Girolamo, M Dorninger, Y Dufournet, R Eigenmann, C Flamant, T Foken, T Gorgas, M Grzeschik, J Handwerker, C Hauck, H Holler, W Junkermann, N Kalthoff, C Kiemie, S Klink, M Konig, L Krauss, CN Long, F Madonna, S Mobbs, B Neininger, S Pal, G Peters, G Pigeon, E Richard, MW Rotach, H Russchenberg, T Schwitalla, V Smith, R Steinacker, J Trentmann, DD Turner, J van Baelen, S Vogt, H Volkert, T Weckwerth, H Wernli, A Wieser, and M Wirth. 2011. “The Convective and Orographically-induced Precipitation Study (COPS): the scientific strategy, the field phase, and research highlights. “Quarterly Journal of the Royal Meteorological Society 137(S1): 3–30, https://rmets.onlinelibrary.wiley.com/doi/full/10.1002/qj.752
Wurzler, S, TG Reisin, and Z Levin. 2000. “Modification of mineral dust particles by cloud processing and subsequent effects on drop size distributions.” Journal of Geophysical Research – Atmospheres 105(D4): 4501–4512, https://agupubs.onlinelibrary.wiley.com/doi/epdf/10.1029/1999JD900980
Yu, H, R Fu, RE Dickinson, Y Zhang, M Chen, and H Wang. 2007. “Interannual variability of smoke and warm cloud relationships in the Amazon as inferred from MODIS retrievals.” Remote Sensing of Environment 111(4): 435–449, https://www.sciencedirect.com/science/article/pii/S0034425707001502
Zipser, EJ, DJ Cecil, C Liu, SW Nesbitt, and DP Yorty. 2006. “Where are the most intense thunderstorms on Earth? Bulletin of the American Meteorological Society 87(8): 1057–1071, https://journals.ametsoc.org/doi/abs/10.1175/BAMS-87-8-1057


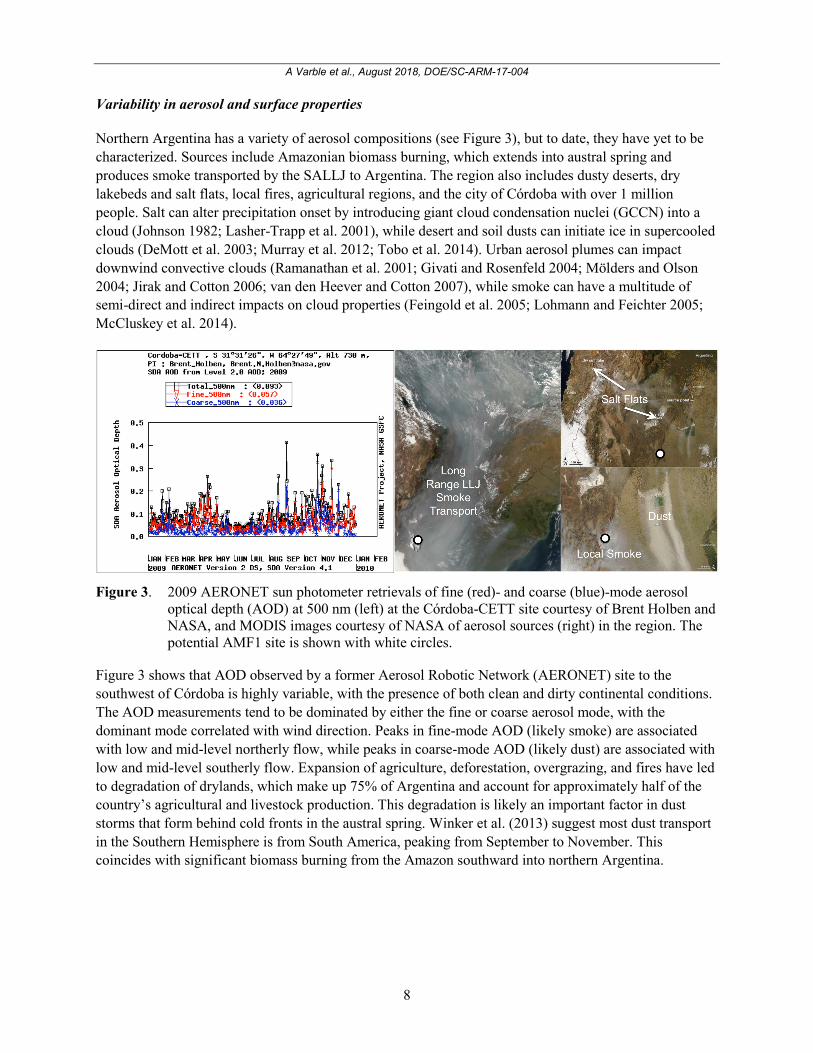


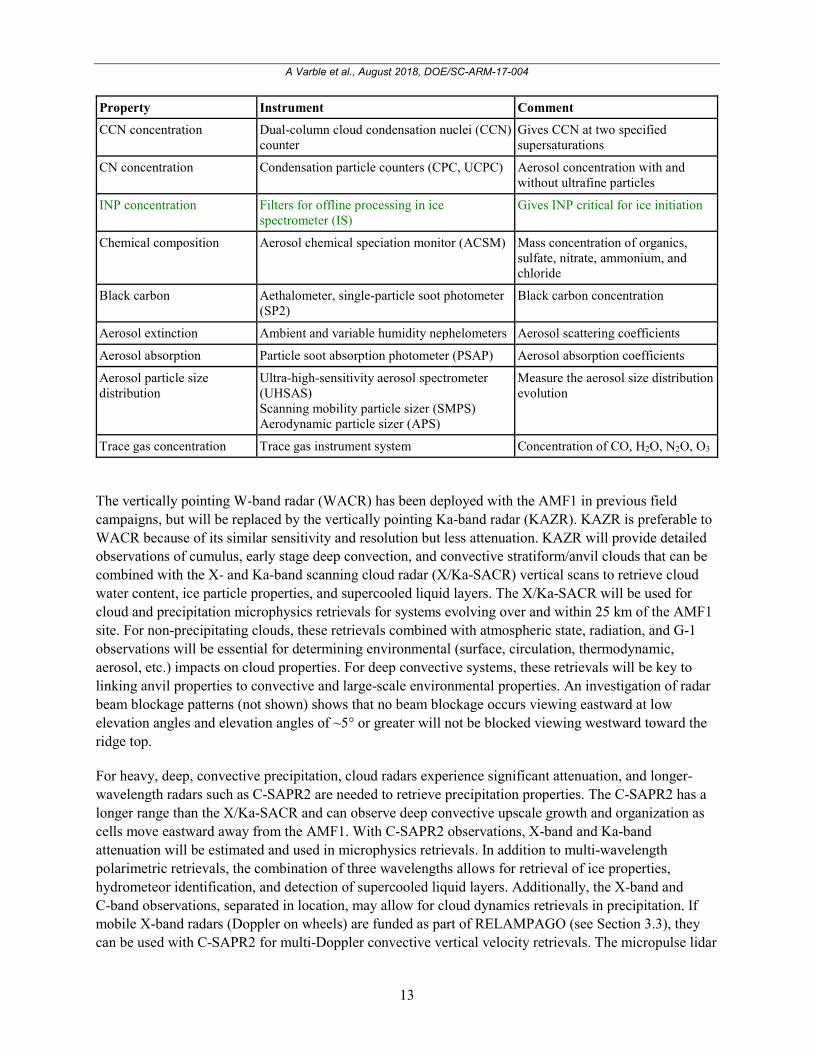


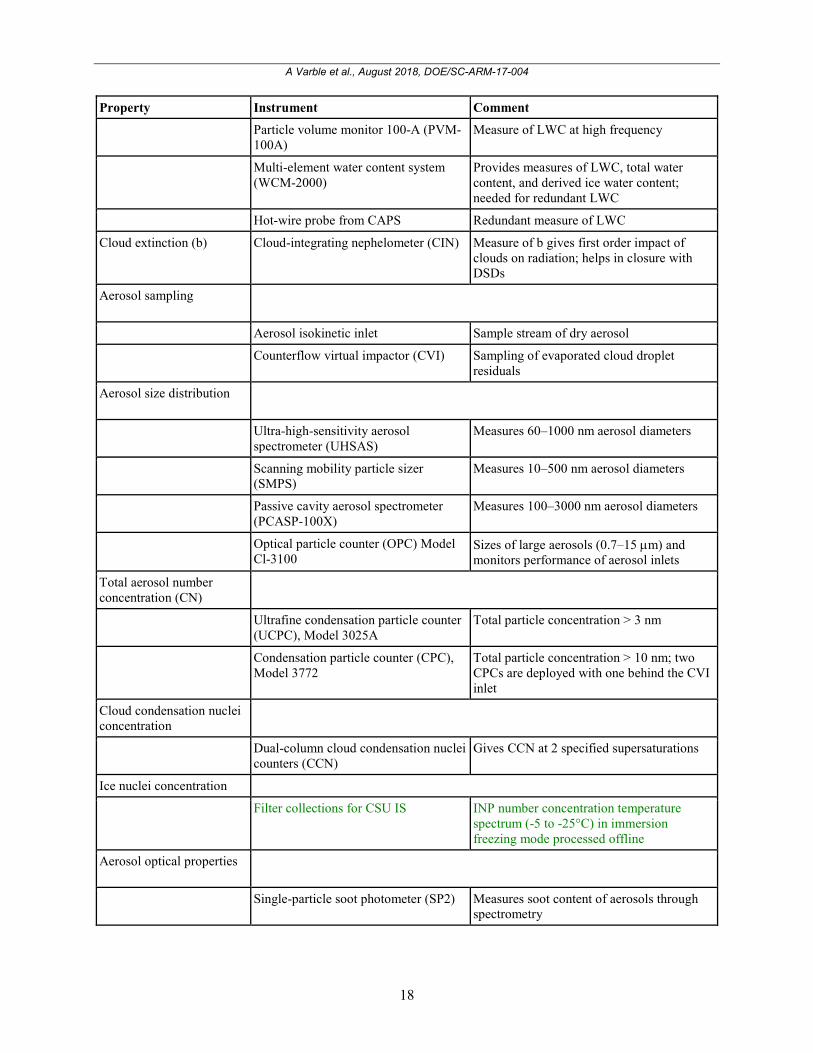


![Highlands Cacti (Native Southwest Cacti).ppt [Read-Only]Many species of cacti and other succulents are quite cold hardy. • Though cacti are often thought of as low desert plants,](https://static.documents.pub/doc/80x56/5e6f715b08e7e57abf396376/highlands-cacti-native-southwest-cactippt-read-only-many-species-of-cacti-and.jpg)


