Page 1
Cloud-Based Library
Dashboard Service
Created by:
Andranik Baghumyan
Steven Hewitt
Sharokh Pournazari
Mero Avanessian
Hong Luu
Faculty Advisor:
Dr. Russell Abbott
Company:
The Aerospace Corporation
Company Liaisons:
Krikor Geysimonyan
Denny Ly
Pablo Settecase
Date Version # Author Detailed Description Reviewed By
2/06/2016 1.1 Hong Luu First Draft Version
Page 2
Page 2
2/25/2016 1.2 Hong Luu Second Draft Version
4/14/16 1.3 Andranik Baghumyan
Final Revision
I. Executive Overview A. Introduction
The inspiration for CLDS was JavaSTARS, a program used by The
Aerospace Corp to monitor telemetry during rocket launches. In
JavaSTARS, all of the sensor readings and measurements from a rocket
are collected and provided to users along with a suite of tools for building
graphs and widgets to visualize the data. JavaSTARS has several
problems such as license dependencies, an inflexible core design, and
dated visuals. Our task was to recreate the basic functionality of
JavaSTARS in a web application.
CLDS Enhancement is a project continued from the original CLDS project.
There will be three main tasks: tab sharing, sending commands, and a
way to keep track of notes via textboxes.
B. Objectives
When presenting the large data stream to a user, the values change too
rapidly and there are too many streams to track. Thus, the solution is to
provide a graphical representation of the data stream via charts.
With CLDS Enhancement, users can: share data charts with other users,
manipulate the generation of the data sources, and provide comments
pertaining those charts.
C. Documentation Requirements
● System Requirements Document
● High Level Architecture Document
● Requirements Specifications Document
● CLDS Quick Start Guide
● CLDS Instruction Manual
● Transition-Out Document
● Lessons Learned Document
II. Requirements
Page 3
Page 3
Req # Requirement Description Type Priority
1.0
A user (henceforth referred to as a "driver")
shall be able to permit other users (referred to
as passengers) to view the driver's tabs
(referred to as "sent tabs").
System 1-High
1.01 Driver shall be able to choose which tabs shall be
sent to passengers. Derived
1.02 Driver shall be able to edit textboxes within each
sent tab. Derived
1.03 Driver shall be able to edit command buttons within
each sent tab. Derived
1.04 Driver shall be able to edit charts within each sent
tab. Derived
1.05 Any command button contained within sent tabs
shall be received by passengers. Derived
1.06 Any textbox contained within sent tabs shall be
received by passengers. Derived
1.07 Any chart contained within sent tabs shall be
received by passengers. Derived
1.08
Passengers shall be able to view updates to sent
tabs automatically after the driver modifies those
tabs.
Derived
1.09 Passengers shall be able to choose which sent tab
to view. Derived
1.10 Passengers shall not be able to modify any received
textboxes. Derived
1.11 Passengers shall not be able to modify any received
command buttons. Derived
1.12 Passengers shall not be able to modify any received
chart. Derived
1.13
Passengers shall be able to request tab share from
a driver. Derived
1.14
Driver shall be able to reject a tab request from a
passenger. Derived
1.15
Driver shall be able to accept a tab request from a
passenger. Derived
1.16
Tabs sent by a driver shall be automatically
accepted by a passenger. Derived
2.0 Drivers shall be able to send commands to data System 1-High
Page 4
Page 4
sources.
2.01 Drivers shall be able to create "command buttons." Derived
2.02 Drivers shall be able to change the icon displayed
on the command button. Derived
2.03 Drivers shall be able to select a command to be run
by a command button. Derived
2.04 Drivers shall be able to use a slider to edit
command parameters. Derived
2.05 Drivers shall be able to send multiple commands
within one command button. Derived
2.06 Only one driver shall be able to operate a source via
commands at a time. Derived
2.07 Passengers shall not be able to send commands
upon clicking command buttons. Derived
2.08 A user shall be able to change location of button by dragging it to desired location on UI
Derived
3.0 Drivers shall be able to add textboxes in each
tab. System 2-Medium
3.01 Drivers shall be able to scroll horizontally on
textboxes. Derived
3.02 Textboxes shall be saved into tabs. Derived
3.03 Textboxes shall be loaded into tabs. Derived
3.04 Passengers shall be able to scroll horizontally in text
boxes independently of drivers. Derived
3.05 A user shall be able to change location of textbox by dragging it to desired location on UI
Derived
3.06 Drivers shall change the size of the textBox Derived
Page 5
Page 5
III. User Manual
Cloud-Based Library
Dashboard Service
CLDS
USER MANUAL
CLDS DEMO URL: http://aerospace.superlunchvote.com/
CLDS Contact Email: [email protected]
CLDS Administrators:
Will Klein
Vicken Krikorian
Pablo Settecase
Clifford Lin
David Thomas
Ali Rizvi
CLDS Enhancement Administrators:
Andranik Baghumyan
Steven Hewitt
Sharokh Pournazari
Mero Avanessian
Hong Luu
Page 6
Page 6
Table of Contents
WELCOME TO CLDS …………………………………………………………… 7
GENERAL HOMEPAGE LAYOUT …………………………………………… 8
CLDS COMPONENT FUNCTIONALITY DESCRIPTION …………………… 9
Graph Generator Functions …………………………………………… 9
Graph Display Functions …………………………………………… 11
Individual Chart/Graph Functions …………………………………………… 12
Data Feed Controller Functions …………………………………………… 13
Tab Sharing Functions …………………………………………… 14
Commands Functions …………………………………………… 18
Textbox Functions …………………………………………… 19
GETTING STARTED …………………………………………………………… 20
Logging In …………………………………………… 20
Saving/Load Layout …………………………………………… 20
QUICK START DEMO (FIGURE 11) …………………………………………… 14
View Dashboard …………………………………………… 21
Quick Start Demo …………………………………………… 22
Tab Sharing Demo …………………………………………… 23
Commands Demo …………………………………………… 24
Textboxes Demo …………………………………………… 24
Welcome to CLDS
Page 7
Page 7
The inspiration for CLDS was JavaSTARS, a program used by The
Aerospace Corp to monitor telemetry during rocket launches. In
JavaSTARS, all of the sensor readings and measurements from a rocket
are collected and provided to users along with a suite of tools for building
graphs and widgets to visualize the data. JavaSTARS has several
problems such as license dependencies, an inflexible core design, and
dated visuals. Our task was to recreate the basic functionality of
JavaSTARS in a web application.
Quickstart CLDS
CLDS is a single page web application that gives users the ability to create
different tabs to categorize their graphs. The main page is called the
Dashboard. The left column contains all the features of creating, editing,
and deleting various types of graphs. The middle column is where a
selected tab is displayed. User can also add different tabs and change
existing tabs’ names. The right column is where a list of possible data feeds
and active feeds is listed. Under Data Feeds, is a list of data feeds that can
be used to be displayed on a graph. Active Feeds is what feeds are active
on a selected graph. In this document, under Dashboard, more specific
details on how to manage the data feeds per graph are listed. The header
consists of Edit Dashboard, View Dashboard, Save Layout, Load Layout,
and Login. Selecting edit dashboard allows you to edit tabs, modify graphs,
and delete/add feeds. In view mode, users can only view the different tabs
and created graphs. The save and load layout functions allow users to save
specific layouts on different tabs in xml files, which can be loaded later on.
Below is a more specific graphical instruction on how to use CLDS
Dashboard.
*Please refer to QUICK START GUIDE FOR CLDS for more details on
getting started
General Homepage Layout
When enter the URL, http://aerospace.superlunchvote.com, you will reach
the homepage of CLDS. Figure 1 below is a picture of the homepage.
Page 8
Page 8
From the homepage, you can see the three main sections of the web
application.
On the left, the graph generator will allow users to create various types of
charts/graphs with labels and initial data feeds. The middle of the
application, graph display, is where graphs generated on the chosen tab
are displayed. The last part on the right, the data controller, is where active
feeds of a selected graph are displayed, and where data feeds can be
added to the selected graph.
CLDS Component Functionality Description
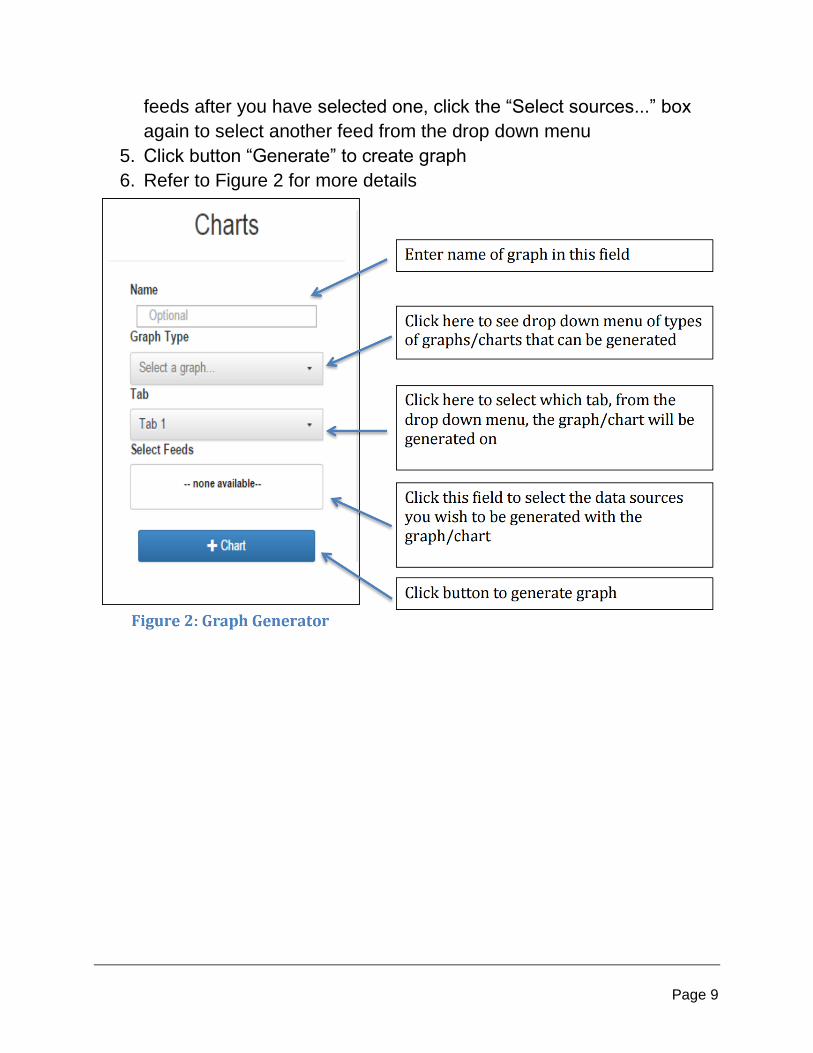
Graph Generator Functions
1. Enter name of graph you want to create (optional)
2. Select graph type from drop down menu
3. Select tab the graph will be generated on from drop down menu
4. Click box labeled “Select sources...” to view and select possible feeds
that will be generated along with the graph. *NOTE* To add more
Page 9
Page 9
feeds after you have selected one, click the “Select sources...” box
again to select another feed from the drop down menu
5. Click button “Generate” to create graph
6. Refer to Figure 2 for more details
Page 10
Page 10
Graph Display Functions (Figure 3)
● All generated graphs on a selected tab are displayed
● Different tabs can be selected or created
● Graphs can be moved by click and dragging a graph’s header
● Tab names can be changed by double clicking on the tabs in the
header of the graph display
Page 11
Page 11
Individual Chart/Graph Functions (Figure 4)
● Frequency can be adjusted
● All data feeds can be paused or resumed simultaneously
● Maximum number of points generated can be set
● View of graph can be adjusted by zooming or scrolling from start to
most recent point plotted
● Graph settings can be accessed to change the following:
○ Graph title o Height/width
○ Type of graph
○ Graph style
○ Y-axis min/max
○ Each active data feed’s settings can also be changed
Figure 4: Chart/Graph
Data Feed Controller Functions (Figure 5)
Page 12
Page 12
● View active and possible data feeds of a given graph by clicking on it
to select it
● “Data Feeds” are feeds that can be added to a selected graph
● Active feeds are data feeds that are being plotted onto the selected
graph
Figure 5: Data Feed Controller
Tab Sharing Functions
● Drivers can select which tabs to share (Fig. 6.1)
Page 13
Page 13
● Drivers can select which passengers to receive shared tabs (Fig. 6.2)
● Passengers shall receive shared tabs from driver (Fig. 6.3)
● Tabs that are shared are automatically accepted by targeted
passengers
● Passengers can view shared tabs, but can’t modify them
● Drivers can update shared tabs for each individual sharing session
● Passengers can request tabs from the main user(driver) (Fig. 6.4)
● Drivers can accept or deny tab share requests
● Drivers can close tab sharing sessions that they start
● Active tab sharing sessions are maintained by the tab sharing server.
These sessions will remain active as long as the driver chooses to
have active. Whether a user (driver or passenger) logs off or closes
the application, the tab sharing sessions that they were a part of will
still be available the next time they log in.
Figure 6.1: Tab Sharing - Driver Loading Tabs to Share
Figure 6.2: Tab Sharing - Driver Selecting Passengers and Tabs
Page 14
Page 14
Figure 6.3 Tab Sharing - Passenger Receiving Shared Tab
Page 15
Page 15
Figure 6.4 Tab Sharing - Passenger Requesting Tab Sharing
Page 16
Page 16
Commands Functions
● Commands can be sent via command button (Fig. 7.1)
○ When clicked, the button will send commands to a server
Page 17
Page 17
○ Users can add any number of commands to a button
○ Users can modify the background image displayed on the
button
○ Users can change command parameters using a settings menu
accessible via the gear button in the bottom right corner
○ Users can adjust the timing for subsequent commands using
the “Delay” command
Figure 7.1: Commands - Single Command Button
Page 18
Page 18
Textboxes Functions
● Display Textboxes (Fig. 8)
● Textboxes can be edited
● Textboxes are scrollable
Figure 8: Textboxes
Getting Started
Logging In
To login, look to the header of the web application. Click the link labeled
“Login” in order to enter credentials. Figure 6 below shows the header and
the correct link to select in order to log in.
Page 19
Page 19
Saving/Load Layout
Click “Save Layout” to save all graphs, tabs, and feeds in xml layout. Click “Load
Layout” to open an xml file that will load all graphs, tabs, and feeds saved. Refer
to Figure 9 for details.
View Dashboard
All previous documentation refers to “Edit Dashboard” mode where graphs, feeds,
and displays can be edited. When “View Dashboard” is clicked, a different
Homepage Layout is displayed where only active graphs are shown. Refer to
Figure 10 for more details.
Figure 9: Header
Figure 10: View Dashboard Display
Quick Start Demo (Figure 11)
Page 20
Page 20
Figure 11: Demo
Tab Sharing Demo (Figure 12)
Page 21
Page 21
Commands Demo (Figure 13)
Page 22
Page 22
Textboxes Demo (Figure 14)
IV. Architecture and Design
Page 23
Page 23
Cloud-Based Library
Dashboard Service
CLDS Enhancement
Design/Architecture Plan
CLDS Enhancement Administrators:
Andranik Baghumyan
Steven Hewitt
Sharokh Pournazari
Mero Avanessian
Hong Luu
Author:
Hong Luu
Page 24
Page 24
Table of Contents
Overview …………………………………………………………………………… 27
Introduction …………………………………………………………………… 27
System Overview …………………………………………………………………… 28
System Description …………………………………………………………… 28
System Organization …………………………………………………………… 29
System Architecture …………………………………………………………… 30
Data Flow Diagrams …………………………………………………………… 31
Management Overview …………………………………………………………… 33
Visualize Code Dependencies …………………………………………………… 34
System Setup …………………………………………………………………… 35
Points of Contact …………………………………………………………………… 38
Page 25
Page 25
Overview
The CLDS Enhancement Design Plan is a document that will explain the process of
implementing the enhancement portion of the CLDS project. CLDS Enhancement is a
project continued from the original CLDS project. There will be three main tasks: tab
sharing, sending commands, and a way to keep track of notes via textboxes.
The CLDS Enhancement Design Plan will also explain the process of installing libraries
and using the CLDS Enhancement features.
Introduction
Tab Sharing
From here on, we shall refer users sending data in tabs as “drivers” and the
users receiving data in tabs as “passengers.” Tab Sharing provides a way for a
driver to share tabs with passengers. The intended purpose is to provide a way
for users to view the same data.
Commands
Commands provides a way for the user to manipulate the way data is generated
from a source. The user will be provided three ways to achieve that task: single
command button, slider to change quantitative values, and customizable button
for multiple commands.
Textboxes
Textboxes is a way to allow users viewing the chart data to leave notes inquiring
about the data.
The system is composed of two components:
1. Front End, which will operate through AngularJS.
2. Back End, which will operate through Apache Tomcat server.
The frontend is a service that is used by the clients that provides an easy to use
interface to
make interacting with the backend easier.
The backend provides a streaming service, pulls data from remote sources, and
provides a
RESTful service.
System Overview
Page 26
Page 26
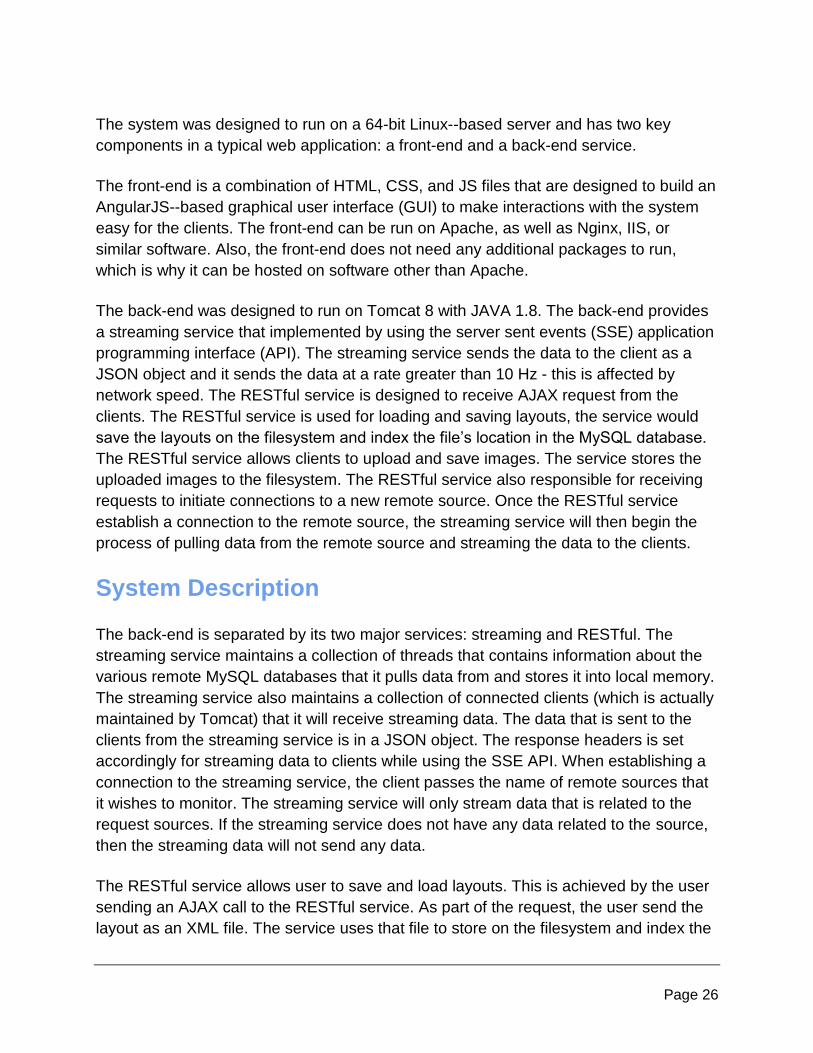
The system was designed to run on a 64bit Linux-based server and has two key
components in a typical web application: a frontend and a backend service.
The frontend is a combination of HTML, CSS, and JS files that are designed to build an
AngularJS-based graphical user interface (GUI) to make interactions with the system
easy for the clients. The frontend can be run on Apache, as well as Nginx, IIS, or
similar software. Also, the frontend does not need any additional packages to run,
which is why it can be hosted on software other than Apache.
The backend was designed to run on Tomcat 8 with JAVA 1.8. The backend provides
a streaming service that implemented by using the server sent events (SSE) application
programming interface (API). The streaming service sends the data to the client as a
JSON object and it sends the data at a rate greater than 10 Hz this is affected by
network speed. The RESTful service is designed to receive AJAX request from the
clients. The RESTful service is used for loading and saving layouts, the service would
save the layouts on the filesystem and index the file’s location in the MySQL database.
The RESTful service allows clients to upload and save images. The service stores the
uploaded images to the filesystem. The RESTful service also responsible for receiving
requests to initiate connections to a new remote source. Once the RESTful service
establish a connection to the remote source, the streaming service will then begin the
process of pulling data from the remote source and streaming the data to the clients.
System Description
The backend is separated by its two major services: streaming and RESTful. The
streaming service maintains a collection of threads that contains information about the
various remote MySQL databases that it pulls data from and stores it into local memory.
The streaming service also maintains a collection of connected clients (which is actually
maintained by Tomcat) that it will receive streaming data. The data that is sent to the
clients from the streaming service is in a JSON object. The response headers is set
accordingly for streaming data to clients while using the SSE API. When establishing a
connection to the streaming service, the client passes the name of remote sources that
it wishes to monitor. The streaming service will only stream data that is related to the
request sources. If the streaming service does not have any data related to the source,
then the streaming data will not send any data.
The RESTful service allows user to save and load layouts. This is achieved by the user
sending an AJAX call to the RESTful service. As part of the request, the user send the
layout as an XML file. The service uses that file to store on the filesystem and index the
Page 27
Page 27
location and the client who uploaded the file in the database. When it comes to loading
layouts, the service sends a JSON list that has the name of each of the layouts saved
for that particular client. The RESTful service allows clients to upload images. The
uploaded images are stored on the filesystem. Unlike layouts, no index is stored on the
database. The RESTful service will also receive request to initiate connections to new
remote sources.
Once a connection is establish, the streaming service will maintain the connection.
System Organization
● The backend was designed to run on a Tomcat 8 server
● The backend is divided by its two services that run independent of each other
Project References
● JavaSTARS
● CLDS Project [from year 2014-2015]
Page 28
Page 28
System Architecture
User/Layout Data
Streaming Service
REST Service
Data Source
Data
Sources
User Interface
Graph
Websocket Server
User Interface
Graph
Page 29
Page 29
Data Flow Diagrams
Tab Sharing - Data Flow
Commands - Data Flow
Page 30
Page 30
Textboxes - Data Flow
Page 31
Page 31
Management Overview
Description of Implementation
● The system has two separate parts, a frontend and a backend
● This is the order of the things that needs to be set up and configured
○ The frontend requires Apache
○ The backend requires Tomcat 8 or newer
○ MySQL database
■ needs to be running successfully before setting up the backend
○ Backend service
■ needs the information to connect to the MySQL database
■ needs to be running successfully before setting up the frontend
○ Frontend service
■ needs the information to connect to the backend service
Page 32
Page 32
Visualize Code Dependencies
CLDS
Page 33
Page 33
System Setup
Brief Description
Setting up the system will require 3 main technologies:
1. Java 1.8
2. MySQL
3. Tomcat 8 (Apache is optional)
The system admin needs to verify that Tomcat 8 is set up to use Java 1.8 or newer.
● No special config required for Java and Tomcat installations
The system admin will need to download and unzip a copy of the software from the
GitHub (must be signed in first) repository at
https://github.com/hal255/CLDS_Enhancement
● The folder public_html contains the code that will be hosted by Apache
● The folder projectscontains two folders:
1. Streaming
2. DataGenerator
● The Streamingfolder contains a .warfile that needs to be deployed
on the Tomcat server (Tomcat has an admin page that let’s you
upload the .war)
The software engineer team, system and mysql administrators will need to coordinate to
configure the Streamingproject to be able to connect to the MySQL database.
● The configuration file for the Streaming project is located under
WebContent/WEBINF/config.properties
The software engineer team will need to update the information in app.jsto connect to
the database and the location where layouts and images are stored
● The configuration file for the public_htmlis located under
public_html/assets/js/app.js
The software engineer team will need to update the address location to the REST and
Streaming services.
Development Environment
Page 34
Page 34
Eclipse
1. Download and install Eclipse Java EE IDE for Web Developers
a. at the time of this writing we used 3 different versions:
i. 4.4.0
ii. 4.4.2 (Luna)
iii. 4.5.0 (Mars)
2. Once Tomcat 8 is installed on the machine you can add the server to Eclipse.
3. To create the new Eclipse project for developing on CLDS:
a. right click on the white space in the project explorer (left side)
b. Import > Web > WAR file
i. Module name needs to be Streaming
ii. Streaming.war is located in Aerospacemaster / projects /
Streaming
iii. Target runtime is of course Tomcat 8
c. Import > Existing Projects into Workspace > Select TabShareServer folder
d. Import > Existing Projects into Workspace > Select data-generator folder
4. To run Selenium Tests:
a. Import > Existing Projects into Workspace > Select SeleniumTests folder
b. To import necessary JAR files
i. In project explorer, right click SeleniumTests
ii. Properties > Java Build Path > click Libraries tab > Add External JA
files
iii. Find the JAR files located within the SeleniumTests folder.
1. Selenium-server-standalone-2.50.1.jar
2. Jxl.jar (needed for spreadsheet printout)
File configuration
● There are a few files we need to update before the app will run correctly
1. Yournameconfig.properties
a. This file is located in WebContent/WEBINF/
b. create or modify an existing config file that will be used by the app
c. This config file specifies the names of the names of the database, tables,
and MYSQL credentials.
d. Make sure the fields database, databaseAlt, and databaseAlt2 all contain
the name of your database.
e. For testing, make sure login1 is the driver, login2 is a passenger, and
login3 is a second passenger.
2. Java Resources / src / server.rest / RestServer.java
a. update configFileName to the name of your local config file
3. Java Resources / src / server.rest / ImageServer.java
a. same as #2
Page 35
Page 35
4. Java Resources / src / data / DataGenerator.java
a. same as #2
b. Comment out line 145 tmp.initTables()
5. App.js
a. uncomment lines 5460, this way Angular knows to use localhost
b. comment out the other two similar blocks (they point to other servers)
Setting up MYSQL:
● Create a databasecalled aerospace that gives the user write permissions. Using
a GUI program like MYSQL Workbench (WIN) or Sequel Pro (MAC) makes it
easy to do this.
● To create the tablescorrectly please see the Aerospace.sql file included in the
documentation for details.
Your local development environment should now be set up and ready to run the
app on the server.
Running the web app using Eclipse
1. Make sure MySQL service is running
2. Execute DataGenerator.java
a. right-click on the file in Eclipse, Run As > Java Application
b. if you set up all files correctly and MySQL is running then you should get
no errors and you should see a console message “Generating data...”
3. Right-click on the top level Streaming project icon and select Run As > Run on
server
a. make sure Tomcat 8 is the target runtime
4. Running TabShare.java
a. After steps 1, 2, and 3 is done, right click on the java file and run as Java
Application
b. If properly setup, should see the message “Tab Share Server started on
port: 3000”
5. Running Selenium Tests
a. Same as step 4a.
b. Script will run automatically
c. Test result can be viewed in the spreadsheet located within the
SeleniumTests folder, file named “SeleniumTestsData.xls”
We recommend debugging the app using Google Chrome web browser. Once the app
is running successfully in Eclipse you can view it at http://localhost:8080/Streaming/
Page 36
Page 36
Note: Ideally the data sources would already be configured and the user would
not have to worry about them. But, for development purposes on your local
machine you will have to add a data source. This is of course your own local
instance of MySQL. Click on “Data Source” on the right sidebar and enter your
credentials appropriately to view some “streaming” data.
Points of Contact
● Project Lead
○ Andranik Baghumyan
● Tab Sharing Lead
○ Mero Avanessian
● Commands Lead and Architecture Lead
○ Steven Hewitt
● Textboxes Lead, Demo Lead, and Presentation Lead
○ Sharokh Pournazari
● Documentation, Testing, and Customer Liaison Lead
○ Hong Luu