19
Intended for The Municipality of Copenhagen Date October, 2013 CLOUDBURST ADAPTATION A COST-BENEFIT ANALYSIS

Intended for
The Municipality of Copenhagen
Date
October, 2013
CLOUDBURST
ADAPTATION A COST-BENEFIT
ANALYSIS

CLOUDBURST ADAPTATION
A COST-BENEFIT ANALYSIS
Ramboll
Hannemanns Allé 53
DK-2300 Copenhagen S
Denmark
T +45 5161 1000
F +45 5161 1001
www.ramboll.com
Revision 01
Date 09/10/2013
Made by Jonathan A. Leonardsen
Approved by Henrik R. Seiding
Description Report
A COST-BENEFIT ANALYSIS
Cost-Benefit Analysis of Cloudburst Adaptation in Copenhagen
CONTENTS
1. Introduction 4 2. Methodology 5 3. Investments and operational costs and benefits for the
Municipalities and Utilities 7 3.1 Investment cost analysis 7 3.2 Operational cost analysis 8 3.3 Income analysis 9 3.4 Total analysis 10 4. Socio-economic analysis 12 4.1 Limitations 12 4.2 Baseline 12 4.3 Health and environmental costs and benefits 12 4.4 Transport cost and benefits 13 4.5 Private (citizens) costs and benefits 14
Real estate value 14 4.5.1
Insurance Damage 16 4.5.2
4.6 Total analysis 16 5. Sensitivity analysis 18
4/19
Rambøll Danmark A/S
CVR-NR 35128417
Medlem af FRI
1. INTRODUCTION
The Municipality of Copenhagen was hit by a cloudburst in 2011. The resulting damages from flooding
generated an estimated € 800 million in insurance claims. As a response, the municipality created a
cloudburst adaptation plan, with the focus on identifying critical and high risk areas and designing
solutions for adapting to cloudbursts in the future.
Rambøll, Rambøll Management Consulting and Atelier Dreiseitl have been responsible for the design of a
detailed cloudburst adaptation plan for two high risk areas: Vesterbro and Ladegårdså.
During a cloudburst the water can either be transported or stored in traditional subterranean structures
such as drainage pipes, sewers, storage chambers, etc. Alternatively the water can be handled by
terrain based solutions, where blue and green elements disperse the water.
The alternative solutions have a large impact on the design and feel of the city. Green and blue
elements create urban lungs and recreational areas. Trees and bushes assist in capturing and filtering
air pollution, augment bio diversity, increase property values, and create a pleasant-looking urban area.
In contrast, blue and green elements can obstruct traffic patterns and reduce road capacity. It is
therefore necessary to plan according to local needs.
Rambøll and Atelier Dreiseitl have been in charge of the design of the master planning and design of the
cloudburst adaptation. Rambøll Management Consulting (RMC) has thereafter conducted a socio-
economic cost benefit analysis. This summary will portray the results from this socio-economic cost
benefit analysis.
The cost benefit analysis conducted focused on three parties:
The municipalities: Copenhagen and Frederiksberg
The utility companies: HOFOR and Frederiksberg Forsyning
The society
The memo will first present a summary of the used methodology; thereafter will the results of the
calculations be presented. Lastly the results from the sensitivity analysis will be presented, as well as
the investment recommendation.

5/19
2. METHODOLOGY
This section will present a short overview of the methodology used in the cost-benefit analysis (CBA).
The methodology builds upon the design of the specific cloudburst solutions outlined in the two
alternative masterplans for the catchment area of Vesterbro and Ladegårdsåen. The solutions are
generally split into two categories: Surface (terrain) solutions, and subterranean solutions. Based upon
the masterplans, the cost and benefits of investment and operation over the lifetime of the project and
presented as a discounted net-present value (NPV), calculated for the two stakeholders:
The Municipalities (Copenhagen and Frederiksberg)
The Utility companies (HOFOR and Frederiksberg Forsyning)
An analysis of the socio-economic costs and benefits for the society as a whole follows the NPV
projection. This includes the investment and operational costs, but takes into account distributional
effects of public budgets, environmental and private effects. The cost-benefit analysis is calculated over
the lifetime of the project, and discounted to provide a NPV. Thereafter, a sensitivity analysis is
conducted; hereafter the investment recommendations are presented. The methodology is illustrated in
Figure 1.
Figure 1 Methodology of the Cost Benefit Analysis
In order to conduct the CBA certain assumptions have been made. Firstly, all prices are displayed at a
2013 price level. Prices displayed originally at another price index year have been re-indexed to a 2013
price level with an inflation rate of 2 pct. The lifetime of the project is estimated to be 50 years,
wherefore all costs and benefits are portrayed in yearly cash flows. The initial implementation period is
estimated to be five years, wherefore only investment costs occur the first five years. All operational
costs and benefits occur only thereafter. Following guidelines from the Danish Ministry of the

6/19
Environment, the tax distortion1 effect is set at 20 pct. and the net tax distortion2 effect is set to 17 pct.
Following the Environmental Economic Council, the discount rate is set to 3 pct. All assumptions are
listed in Table 1.
Table 1 Main assumptions
Price index 2013
Inflation 2 pct.
Lifetime of project 50 years
Tax distortion 20 pct.
Net tax distortion 17 pct.
Discount rate 3 pct.
Source: the Ministry of the Environment, the Environmental Economic Council
To evaluate the economic feasibility of the masterplans, the different cash flows (both positive and
negative) will be discounted and added to form the net present value (NPV). The NPV is a measure of
the sum of the discounted total benefits and costs over a given time period. Thus, if the specific
Masterplan produces a positive net present value, the Masterplan benefits society as a whole or for the
specific stakeholder.
1 Tax distortion is the effect, where added costs for the public administration have to be funded by taxes, which decreases purchasing power and
production in the society. At the same time, an added benefit reduces the need for funding, which increases purchasing power and production in
the society. 2 Net tax distortion is the difference between good traded on the market and non-market goods. Good traded on the market have taxes and
subsidies applied to their price, wherefore non-market goods have to be distorted by the net tax.

7/19
3. INVESTMENTS AND OPERATIONAL COSTS AND BENEFITS
FOR THE MUNICIPALITIES AND UTILITIES
In the following, the investment and operational costs and benefits for the municipalities and the utilities
are highlighted.
3.1 Investment cost analysis
The investment costs for the municipalities and utilities are divided between the two parties. The
subterranean solutions are solely financed by the utilities, whereas utilities and municipalities finance
the terrain-based solutions by 75 pct. and 25 pct. respectively. In the current analysis, it is assumed
that the utilities will make use of serial loans with a maturity of 40 years, which can be obtained from
the municipal financing institution Kommunekredit, at 3 pct. interest3.
It has not been made clear how the municipalities will choose to finance their part. Therefore, it is
assumed that tax revenue will cover the financial outlays.
The investment will be evenly distributed over a 5-year implementation period. Table 2 illustrates how
the utilities have an investment of 235 million EUR for masterplan 1, and 334 million EUR for
masterplan 2. The municipalities however, have a much smaller piece, where masterplan 1 requires an
investment of 58 million EUR and masterplan 2 an investment of 55 million EUR.
Table 2 Investment in million EUR
Masterplan 1 Masterplan 2
Utilities 235 334
Municipalities 58 55
Total 293 389
Source: Rambøll
Figure 2 illustrates the costs of loan financing for the utilities. Each year during the implementation
period, the investment for that year will be financed with a loan of 40 years at 3 pct. interest. In total, 5
loans will be obtained per masterplan. Due to the nature of the serial loan, the amortisement is
distributed evenly over time. As the interest rate payments are calculated based upon the outstanding
debt, the initial payments are therefore high, but will decrease over time, as the interest rate payments
drop.
3 This includes a margin of roughly 0,5 pct. points, in order to provide sober and conservative estimates in relation to project risk.

8/19
Figure 2 Cash flow from serial loan financing (million EUR)
Source: Rambøll, KommuneKredit, own calculations
In Masterplan 1 the utilities will have a total interest rate expense of 145 million EUR, which means that
the utilities will have a total investment cost of 380 million EUR. Masterplan 2 will have a total interest
rate expense of 205 million EUR with the total investment costs accruing to 539 million EUR. Due to the
higher investment costs, Masterplan 2 will cost the utilities around 160 million EUR more to finance than
Masterplan 1. The investment costs are not discounted and, as should be expected, these figures will
vary greatly depending on financing solution.
As mentioned earlier, the Municipalities have not yet chosen a method for financing, but have different
options in terms of loan financing or budget financing. It is assumed that the financing is conducted
over 5 years through the budget.
When calculating the NPV of the investment and financing, the entire lifetime of the project is taken into
account. As mentioned in section 2, the total lifetime of the project is 50 years, and the discounting
factor is 3 pct. Table 3 illustrates the NPVs for the utilities and the municipalities for both Masterplans 1
and 2. Although Masterplan 2 requires utilities to invest roughly 160 million EUR more than Masterplan
1, the difference in financing costs for the two Masterplans decreases to 95 million EUR when taking the
NPV into account. For the municipalities the financing costs are the discounted 5 year investments of 58
and 55 million EUR for Masterplan 1 and 2 respectively fall accordingly to 54 and 52 million EUR.
Table 3 NPV of investment and financing (million EUR)
Masterplan 1 Masterplan 2
Utilities -229 -324
Municipalities -54 -52
Source: Rambøll, KommuneKredit, own calculations
3.2 Operational cost analysis
Following the determination of financing responsibility, the municipalities and the utilities split the
operational costs. The subterranean solutions are solely operated by the utilities, whereas the terrain-
based solutions are divided between the utilities and the municipalities, where the municipalities assume
a larger portion of the operational costs of the blue-green solutions.
-20
-18
-16
-14
-12
-10
-8
-6
-4
-2
-
1 3 5 7 9 11 13 15 17 19 21 23 25 27 29 31 33 35 37 39 41 43 45 47 49
Masterplan 1 Masterplan 2

9/19
This division is therefore visible in the estimated operational costs in that Masterplan 1 has more
municipal operational costs due to a greater amount of terrain-based solutions. Masterplan 2 sets a
greater focus on subterranean solutions. Table 4 illustrates the yearly operational costs for the utilities
and the municipalities.
Table 4 Yearly operational costs (million EUR)
Masterplan 1 Masterplan 2
Utilities 2 3
Municipalities 3 2
Total 6 5
Source: Rambøll
Note: Total due to rounding
The operational costs are not initiated before the implementation concludes in year 5 and are kept
constant over time. For the utilities, the NPV shows that Masterplan 1 will be 9 million EUR less
expensive than Masterplan 2, whereas the municipalities experience an inverse relationship. For the
municipalities, Masterplan 1 is 18 million EUR more expensive than Masterplan 2. Utilities’ and municipal
costs taken together, Masterplan 1 is 9 million EUR more expensive than Masterplan 2, and therefore
the more expensive investment of the two Masterplans regarding operational costs.
Table 5 NPV of Operational costs (million kr.)
Masterplan 1 Masterplan 2
Utilities -49 -58
Municipalities -70 -52
Total -119 -110
Source: Rambøll, Own calculations
3.3 Income analysis
A large public investment in cloudburst adaptation solutions will not generate direct cash flows. The
municipalities collect taxes which finance the investment, and the utilities collect a fee based on water
sold to their customers. Neither the municipality nor the utility aim for profit; rather taxes and water
fees will equal costs and the business case zeroes out.
However, certain savings and indirect cash flows can be realised. First of all, both the municipality and
particularly the utility can create savings on renewals or upgrades of current installations such as pipes
and drains by virtue of reducing the wear and tear on the existing water management system.
These savings have been conservatively estimated to be around 10.000-20.000 kr. per meter of
renewal/upgrade work on current installations. Only a limited amount of the roads where cloudburst
adaptation instalments are made have been used to estimate these savings. It is not assumed that the
Masterplans will provide different savings. Table 6 presents the NPV of the savings for the utilities and
the municipalities.

10/19
Table 6 NPV Savings for the stakeholders (in million EUR)
Masterplan 1 Masterplan 2
Utilities 72 72
Municipalities 24 24
Source: Rambøll Denmark, Own calculations
Moreover, through investments in green and blue solutions, the municipality will indirectly accrue
revenue from increased real estate taxes. Prices on real estates are affected by their surroundings,
where green areas have a proven positive effect. Section 4.5.1 will further explain this effect. Real
estate taxes are related to the public value of the real estate, and charged at roughly 0,034 pct. for
Copenhagen, and 0,027 pct. for Frederiksberg.
Section 4.5.1 presents the socio-economic effects of cloudburst adaptation on real estate values, from
which derives the increase in real estate taxes. From a socio-economic point of view, the tax is a
transfer of money between two parties that cancel each other out, the society becomes neither richer
nor poorer by the transfer. In the distributional analysis, it is, however, relevant to show the income
potential for the municipalities.
The increase in real estate tax is estimated to provide the municipality with 5 million EUR every year in
both masterplans after implementation..
Table 7 presents the NPVs of the real estate taxes. The slight difference in the tax revenue stream
stems from Masterplan 1’s marginally greater proportion of new green urban space. This difference is,
however, not a very significant for the tax revenue.
Table 7 NPV of real estate taxes
Masterplan 1 Masterplan 2
Municipalities 114 113
3.4 Total analysis
When combining the three elements of the investment and operations into a single cost benefit analysis,
the result varies greatly from masterplan to masterplan and between the municipalities and the utilities.
Table 8 shows the summarized costs and benefits for the utilities for Masterplan 1 and 2. The clear
difference lies with the financing costs, where Masterplan 2 is 95 million EUR more expensive in terms of
its NPV. The overall costs for the utilities are higher for Masterplan 2, and the total savings are identical
for both Masterplans, wherefore Masterplan 2 is more costly with an NPV of 310 million EUR, or 104
million EUR more than Masterplan 1.
11/19
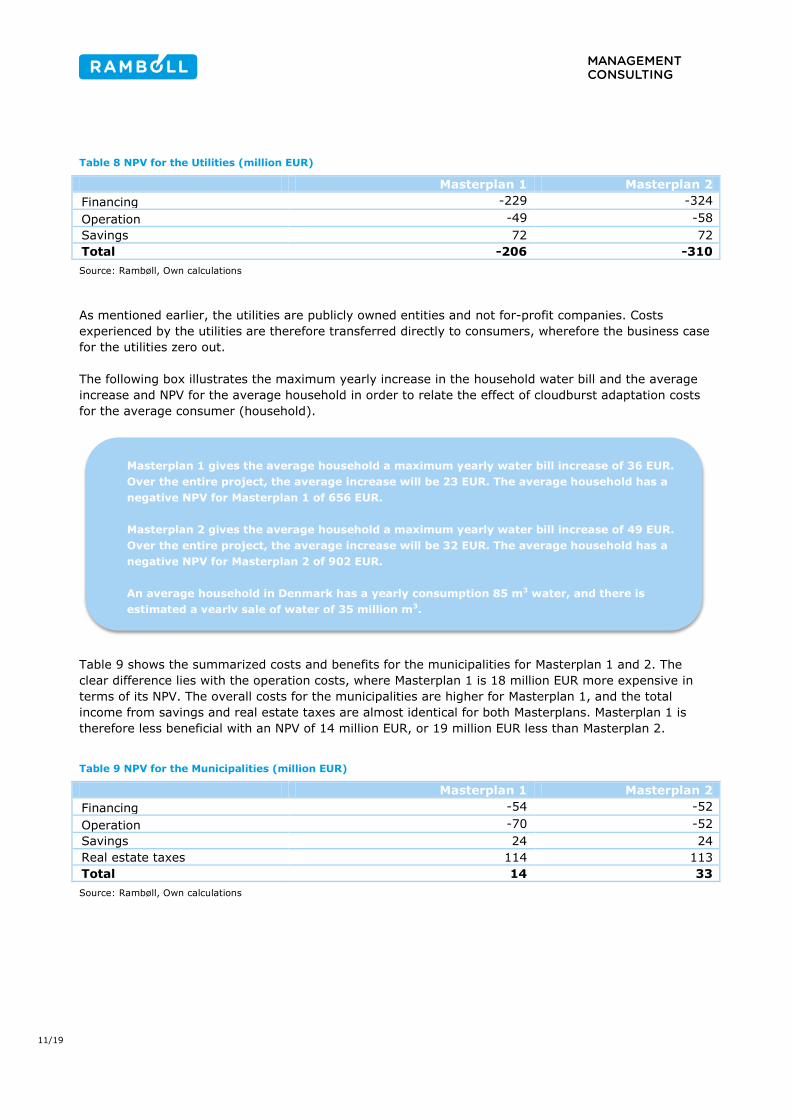
Table 8 NPV for the Utilities (million EUR)
Masterplan 1 Masterplan 2
Financing -229 -324
Operation -49 -58
Savings 72 72
Total -206 -310
Source: Rambøll, Own calculations
As mentioned earlier, the utilities are publicly owned entities and not for-profit companies. Costs
experienced by the utilities are therefore transferred directly to consumers, wherefore the business case
for the utilities zero out.
The following box illustrates the maximum yearly increase in the household water bill and the average
increase and NPV for the average household in order to relate the effect of cloudburst adaptation costs
for the average consumer (household).
Table 9 shows the summarized costs and benefits for the municipalities for Masterplan 1 and 2. The
clear difference lies with the operation costs, where Masterplan 1 is 18 million EUR more expensive in
terms of its NPV. The overall costs for the municipalities are higher for Masterplan 1, and the total
income from savings and real estate taxes are almost identical for both Masterplans. Masterplan 1 is
therefore less beneficial with an NPV of 14 million EUR, or 19 million EUR less than Masterplan 2.
Table 9 NPV for the Municipalities (million EUR)
Masterplan 1 Masterplan 2
Financing -54 -52
Operation -70 -52
Savings 24 24
Real estate taxes 114 113
Total 14 33
Source: Rambøll, Own calculations
Masterplan 1 gives the average household a maximum yearly water bill increase of 36 EUR.
Over the entire project, the average increase will be 23 EUR. The average household has a
negative NPV for Masterplan 1 of 656 EUR.
Masterplan 2 gives the average household a maximum yearly water bill increase of 49 EUR.
Over the entire project, the average increase will be 32 EUR. The average household has a
negative NPV for Masterplan 2 of 902 EUR.
An average household in Denmark has a yearly consumption 85 m3 water, and there is
estimated a yearly sale of water of 35 million m3.

12/19
4. SOCIO-ECONOMIC ANALYSIS
The socio-economic analysis includes the following elements:
Investments and operational costs and benefits
Health and environmental costs and benefits
Transport cost and benefits
Private (citizens) costs and benefits
These cost and benefits will be further described below; firstly the limitations and the baseline will be
identified.
4.1 Limitations
Masterplan 1 includes a radical change to the lake system in Copenhagen, where Skt. Jørgens Lake
would be remodelled. The masterplan will increase the lake’s accessibility from the street level; create a
green and activity based environment, but, in contrast, would reduce the size of the actual lake. This
should make the lake area more appealing to users of the park and area residents who will be able to
utilize a green urban space, rather than an inaccessible lake. The lake is part of a larger lake system,
however: Skt. Jørgens Lake has a profound cultural and historical importance in Copenhagen. By
converting the lake into a park/lake urban space, the area’s heritage will be altered with. This would be
a loss for some.
As there is no identification or knowledge on the socio-economic effects of lake alterations, the section
regarding Skt. Jørgens Lake has been deemed to be outside of the scope of this report to analyse.
4.2 Baseline
The cost of the damage due to cloudbursts if neither Masterplan 1 nor 2 are implemented has been
estimated in order to establish a baseline to measure the effect of the two Masterplans. This damage
would incur an annual cost of 34 million EUR. The NPV of the damage costs will amount to
approximately 900 million EUR if we insert the annual cost into the project's estimated 50 year life cycle
Furthermore, there are additional investments that must be made e.g. general update/renewal of the
drainage system in Copenhagen and Frederiksberg. As shown in section 3.3, there are immense savings
for both the municipalities and the utilities by investing in cloudburst adaptation. The NPV of the
additional costs for the utilities and the municipalities is approximately 100 million EUR.
The costs of not performing any cloudburst adaptation can therefore be measured to an NPV of
approximately 1.000 million EUR.
4.3 Health and environmental costs and benefits
Local air pollution has a direct effect on the health of citizens. Air pollution can lead to coronary heart
diseases, cancer related diseases and is often linked to the premature death of city residents. Thus,
pollution is a critical issue in many major cities across the world, particularly considering most
pollutants’ origins in facets of everyday urban life such as energy and transport. Aside from detriments
to human health, air pollution has a profound effect on the climate and results in a changing climate.
Green areas reduce air pollution. The American NGO, the Trust for Public Land, has performed several
studies that map the contribution of green areas to the removal of air pollution in urban areas4. Table 10
4 http://www.tpl.org/publications/books-reports/ccpe-publications/measuring-the-economic-value.html

13/19
shows the different air pollutant gasses, the amount of tons that 1 hectare (ha) filters per year, and the
socio-economic value of 1 ton of the particular air pollution gas.
Table 10 Air pollution gas
Air pollution gas Ton/ha/year Socio-economic value (EUR) per ton
CO2 0,05 22
NOx 0,25 6.084
O3 0,86 6.084
PPm 0,65 13.866
SOx 0,23 11.744
Source: The Trust for Public Land, DMU, TERESA
Masterplan 1 adds 53,4 ha of new green urban space and Masterplan 2 similarly adds 52,8 ha. The
yearly savings from new green urban spaces can be adduced by comparing the new green urban space
with the amount of tonnage of air pollution gases removed/filtered per ha per year and the socio-
economic value per ton of air pollution gas removed. Table 11 below illustrates Masterplan 1’s yearly
socio-economic benefit of roughly 11.000 EUR more per year compared to Masterplan 2. It is therefore
also clear that air pollution removal/filtering is not major impacting factor in terms of deciding between
the two Masterplans.
Table 11 Yearly savings on air pollution (EUR)
Masterplan 1 Masterplan 2
CO2 63 63
NOx 81.493 80.575
Ozone 280.272 277.113
Particles 484.216 478.757
SO2 146.379 144.729
Total 992.424 981.236
Source: DMU, TERESA, Trust for Public Land, Rambøll Denmark, Own calculations
Note: Sum due to rounding
This point is further illustrated when calculating the NPV for both Masterplans, where Masterplan 1 is
only 1 million EUR more beneficial to society compared to Masterplan 2. More green urban space is,
nonetheless, an advantage of Masterplan 1 even though the socio-economic effect of air pollution is less
significant.
Table 12 Air pollution NPV (million EUR)
Masterplan 1 Masterplan 2
Air pollution 22 21
Source: DMU, TERESA, Trust for Public Land, Rambøll Denmark, Own Calculations
4.4 Transport cost and benefits
The effects of cloudburst adaptation solutions on transportation differ from the type of the solution and
the way the solution is constructed.

14/19
Terrain based solutions
During the construction phase, terrain based solutions will have a significant impact on
transportation. Construction will obstruct normal traffic flow, which to will have to be rerouted in
some cases.
After the construction phase, terrain based solutions can have a negative or positive effect on traffic
flow depending on manner of the solution’s implementation. Moreover, terrain based solutions can,
if designed proper, act as a supporting factor for green transportation, i.e. cycling or walking.
Terrain based solutions might, therefore, act both as a hindrance and a supporting factor for
transportation.
Subterranean solutions
During the construction phase, subterranean based solutions will have a significant impact on
transportation. Construction will be in the way of the normal traffic flow which will have to be
rerouted. Only in extreme cases, i.e. the drilling of large tunnels, will subterranean solutions not
have an impact on traffic, as construction is done underground.
After the construction phase, subterranean based solutions will not have an effect on traffic flow.
A transportation analysis conducted by Rambøll Denmark, shows that there will not be a significant
impact on traffic due to the cloudburst adaptation master plans, wherefore the impact on traffic is not
further analysed.
4.5 Private (citizens) costs and benefits
The costs and benefits on private citizens from the cloudburst adaptation project relates to the following
two issues:
Real estate value
Insurance damage
Real estate value 4.5.1
Several studies show that there is a significant relationship between real estate value and green spaces.
The Danish Nature Agency has shown that there is an effect of 1 pct. higher real estate value per 1
hectare of green space compared to comparable real estate's where no green spaces are found. When
the distance to the park exceeds 500 meters, the effect drops to roughly 0,5 pct., but can still be
measured up to 1.000 meters away. The Trust for Public Land has likewise conducted studies that show
that green urban spaces have significant effects on real estate values. They estimate the effect to be
between 5-15 pct. depending on the quality of the green space, and on the proximity to the real estate.
In order to show how green-blue terrain based solutions effect real estate value, Ramboll uses a
conservative estimate of a real estate value increase of 0,33 pct. per hectare green solution. The
geographic distance is set to a maximum of 500 meters, but already existing green urban spaces are
used as a proxy. On the other hand, existing green urban spaces, that will be upgraded or renewed, will
likewise become more attractive and will therefore also contribute to a higher real estate value. The
prerequisites are displayed below in Table 13.

15/19
Table 13 Real estate value
Increase per 1 ha. Geographic distance
The Danish Nature Agency 1 % 500 meters
The Trust for Public Land 5 % 600 meters
Ramboll estimate 0,33 % 200-500 meters
Source: The Danish Nature Agency, The Trust for Public Land, Own calculations
Note: The trust for public land does not place a relationship between the size of the green space and the increase in value; they do
however place a range from 5-15 pct. increase depending on the quality of the green space.
Real estate values have been collected from the public sales and valuation register. The real estate
values are therefore based upon the public valuation rather than the traded market price. This further
supports the conservative estimation methodology, as the public valuation is set lower than the market
valuation.
The socio-economic effect derived from the real estate value increase is a one-off event. It is assumed
that the increase happens after implementation, i.e. in year 5 of the 50 year project lifetime.
When the value of real estate increases, so will the tax basis from which the municipality collects real
estate taxes. The municipalities collect taxes individually; Copenhagen has a tax rate of 0,034 pct. of
the value, where Frederiksberg has a tax rate of 0,028 pct. The tax payment is in a socio-economic
sense, a transfer of payments between two parties. The society is therefore, as a whole, neither better
nor worse off after the transfer. However, as the municipalities have budgets based upon tax
collections, this increased tax income will mean that taxed can be reduced elsewhere, a tax distortion
effect of 20 pct. and the net tax distortion effect of 17 pct. have to be included as a socio-economic
benefit.
As such, the socio-economic analysis of the effects on real estate value combines two elements: the
increase in real estate value, and the tax distortion effects. Table 14 illustrates the new green space in
terms of hectares, the NPVs the real estate value increase and the tax distortion effects. Masterplan 1
has roughly 0,6 hectare more of added green space compared to Masterplan 2. This is illustrated by the
NPVs of the real estate value increase and the tax distortion effects, where Masterplan 1 has a higher
NPV. Due to the relative small difference between the new green spaces, the socio-economic effect is
manifestly small. This is further enforced by the conservative approach to the value increases. In total,
Masterplan 1 has an NPV of 193 million EUR compared to Masterplan 2s NPV of 191 million EUR.
Table 14 Real estate value effects (in million EUR)
Masterplan 1 Masterplan 2
New green space 53,4 ha 52,8 ha
Real estate value increase 151 150
Tax Distortion 42 42
Total 193 191
Source: Naturstyrelsen, Den Offentlige Ejendomsvurdering, Rambøll Denmark, Own Calculations
Note: Total due to rounding.
In order to illustrate the impact of the increase in real-estate value, Figure 3 illustrates an example on
the impact for an average apartment in Copenhagen.

16/19
Figure 3 Example
Insurance Damage 4.5.2
Damages on property, goods, inventory, infrastructure, etc. are substantial economic losses when
cloudbursts happen. The city of Copenhagen experienced insurance-related losses of 800 million € due
to the cloudburst in 2011. Based on data from Rambøll Denmark, the yearly insurance damage savings
from the cloudburst adaptation plans have been estimated to be 15 million EUR for Masterplan 1 and 16
million EUR for Masterplan 2.
In addition, as mentioned in section 3.3, due to the cloudburst adaptation solutions, there is a reduction
in the need to renew and upgrade the existing subterranean solutions. This reduced need results in an
economic saving. The investments are the same for both Masterplan 1 and 2, this amount to an annual
saving of 20 million EUR in the five-year implementation period. Discounted, this provides an NPV of
approximately 100 million EUR for the society.
Table 15 NPV Damage and renewal/upgrade savings (million EUR)
Masterplan 1 Masterplan 2
Damage savings 320 338
Renewal/upgrade savings 96 96
Source: Rambøll
4.6 Total analysis
As described earlier, the socio-economic analysis contains the two main elements: the health and
environmental costs and benefits, and the private (citizens) costs and benefits. For this total analysis,
the costs and benefits from the investments and operations costs analysis are included, in order to fully
assess the socio-economic costs and benefits of each masterplan. It should be noted that, the socio
economic costs and benefits include the tax distortion and the net tax distortion effects explained in
section 2. Table 16 and Table 17 present the summarized socio-economic costs and benefits.
An average apartment with a value of 400.000 EUR will, due to the cloudburst adaptation,
experience an increase in its value of 13.000 EUR after implementation and a yearly real estate
tax increase of roughly 40 EUR.

17/19
Table 16 Socio-economic costs and benefits Masterplan 1 (million EUR)
Air pollution 22
Real estate taxes 42
Insurance damages 320
Real estate value 151
Renewal/upgrade savings 96
Municipal investment -75
Utilities investment -260
Municipal operational costs -96
Utilities operational costs -58
Total 142
Source: Rambøll, Own calculations
Table 17 Socio-economic costs and benefits Masterplan 2 (million EUR)
Air pollution 21
Real estate taxes 42
Insurance damages 349
Real estate value 150
Renewal/upgrade savings 96
Municipal investment -71
Utilities investment -368
Municipal operational costs -72
Utilities operational costs -68
Total 78
Source: Rambøll, Own calculations
Based on the above calculations it can be deduced that Masterplan 1 (overall) has the largest socio-
economic surplus. Society gains approximately 64 million EUR more on Masterplan 1 over Masterplan 2.
This is despite the fact that Masterplan 2 has larger socio-economic benefits of approximately 27 million
EUR more than Masterplan 1. Masterplan 2 has, however, high investment costs which are about 105
million DKK more than Masterplan 1.
The conclusion of the socio-economic analysis is therefore, that Masterplan 1 is the best investment.

18/19
5. SENSITIVITY ANALYSIS
In the following section presents a sensitivity analysis of the results for the two Masterplans. The
purpose of the sensitivity analysis is to establish a negative and a positive scenario for all costs and
benefits, using a sensitivity factor of 10 pct. in both the negative and the positive sensitivity analysis.
In the negative sensitivity analysis, the sensitivity factor is deducted from the benefits and added to the
costs. In the positive sensitivity analysis the sensitivity factor is added to all benefits and deducted from
all costs.
Table 18 shows the sensitivity analysis for Masterplan 1 for the three stakeholders. The normal scenario
provides a positive NPV for the society and the municipalities, which is further increased in the positive
scenario. The negative scenario delivers a negative NPV for the municipalities and a positive NPV for the
society, even though the decrease in the NPV is steep. Masterplan 1 is therefore very liable in terms of
negative shocks. The utilities have a negative NPV in all three scenarios, yet with the negative scenario
providing a larger impact than the positive. This is due to the compounded interest rate costs of
financing the higher investment costs.
Table 18 Sensitivity analysis for Masterplan 1 (NPV in million EUR)
Stakeholder Negative Normal Positive
Society 31 142 254
Municipalities -12 14 40
Utilities -297 -206 -171
Source: Rambøll, Own calculations
Table 19 shows the sensitivity analysis for Masterplan 2 for the three stakeholders. The normal scenario,
like Masterplan 1, provides a positive NPV for the society and the municipalities. The NPV is further
increased in the positive scenario for both stakeholders. The negative scenario delivers a positive NPV
for the municipalities and a negative NPV for the society. Masterplan 2 is therefore very liable in terms
of negative shocks for the society. The utilities have a negative NPV in all three scenarios, yet with the
negative scenario providing a larger impact than the positive, this is, like Masterplan 1, due to the
compounded interest rate costs of financing the larger investment.
Table 19 Sensitivity analysis for Masterplan 2 (NPV in million EUR)
Stakeholder Negative Normal Positive
Society -46 78 202
Municipalities 9 33 57
Utilities -408 -310 -265
Source: Rambøll, Own calculations
Both Masterplans are liable to negative shocks, but Masterplan 1 provides the best overall investment,
as the society's NPV stays positive even in the negative scenario. The society incurs all the costs from
the municipalities and the utilities through taxes and the water bill. The society is therefore the
stakeholder where all costs and benefits are taken into account.

19/19


![Principles and Standards for Benefit–Cost Analysis] Introduction- Professionalizing Benefit–Cost Analysis](https://static.documents.pub/doc/80x56/56d6beb21a28ab30169333bb/principles-and-standards-for-benefitcost-analysis-introduction-professionalizing.jpg)
