49
Clouds in the Global Climate System

Clouds in the Global Climate System

What do clouds do?
Precipitate
Scatter, absorb, and emit radiation
Transport things vertically
Energy
Water
Momentum
Trace species
Faciliate chemical reactions

Two ways to think about clouds

There are forest people, and there are tree people.

Forest and trees

Tree processes
Radiation
Cloud-scalemotions
TurbulenceMicrophysics& Chemistry
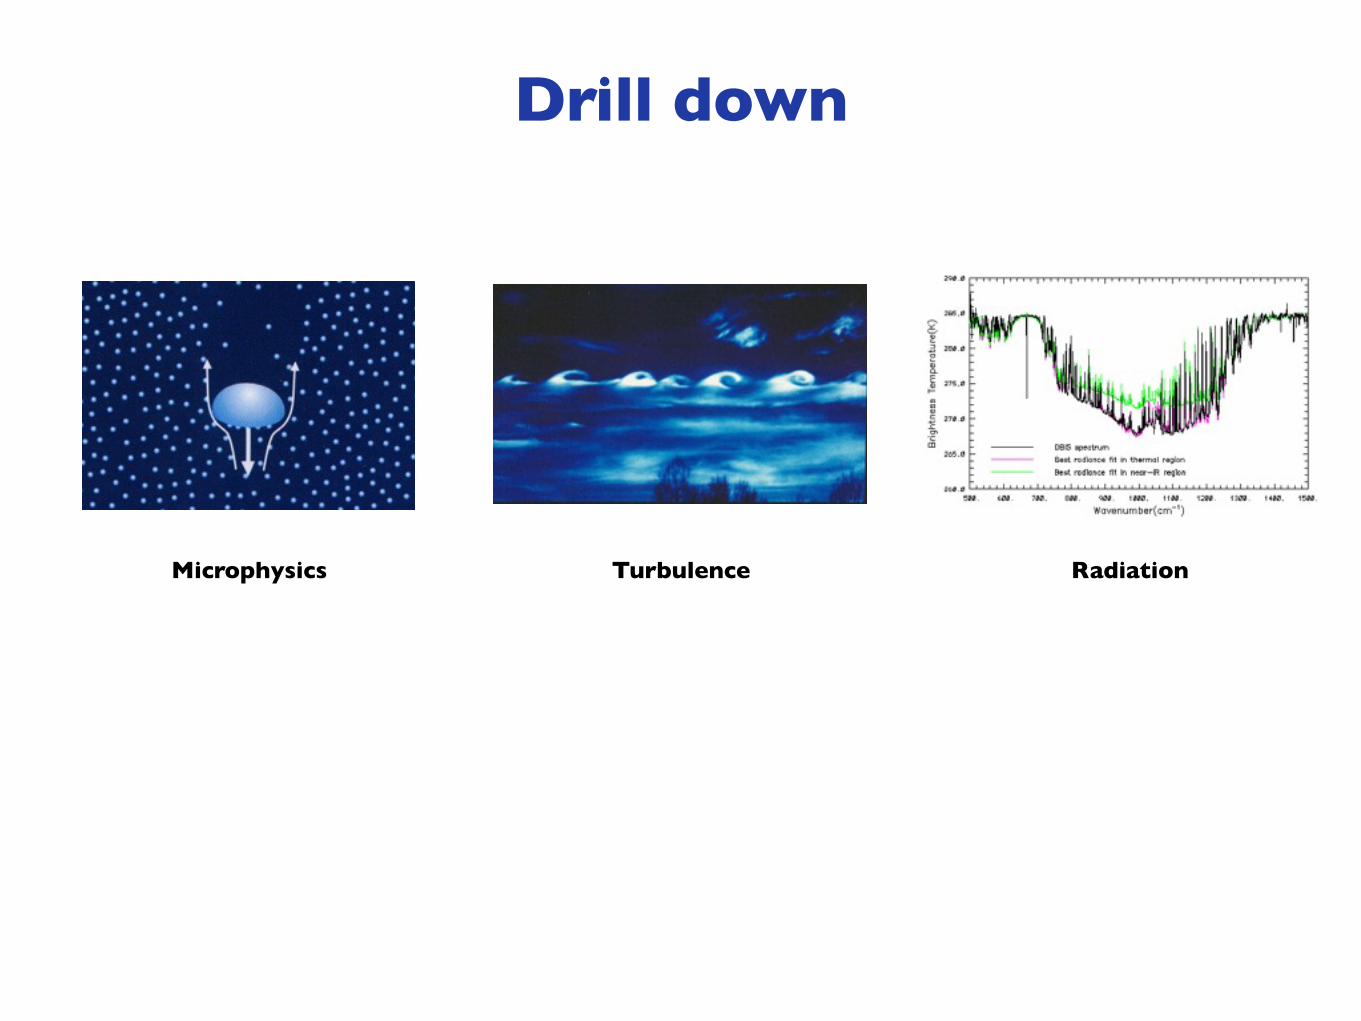
Drill down
Microphysics Turbulence Radiation

What conditions are favorable for cloud formation?
Lots of water vapor
Cool temperatures
Rising motion (with exceptions)
Steep lapse rate (with exceptions)
Strong surface heating
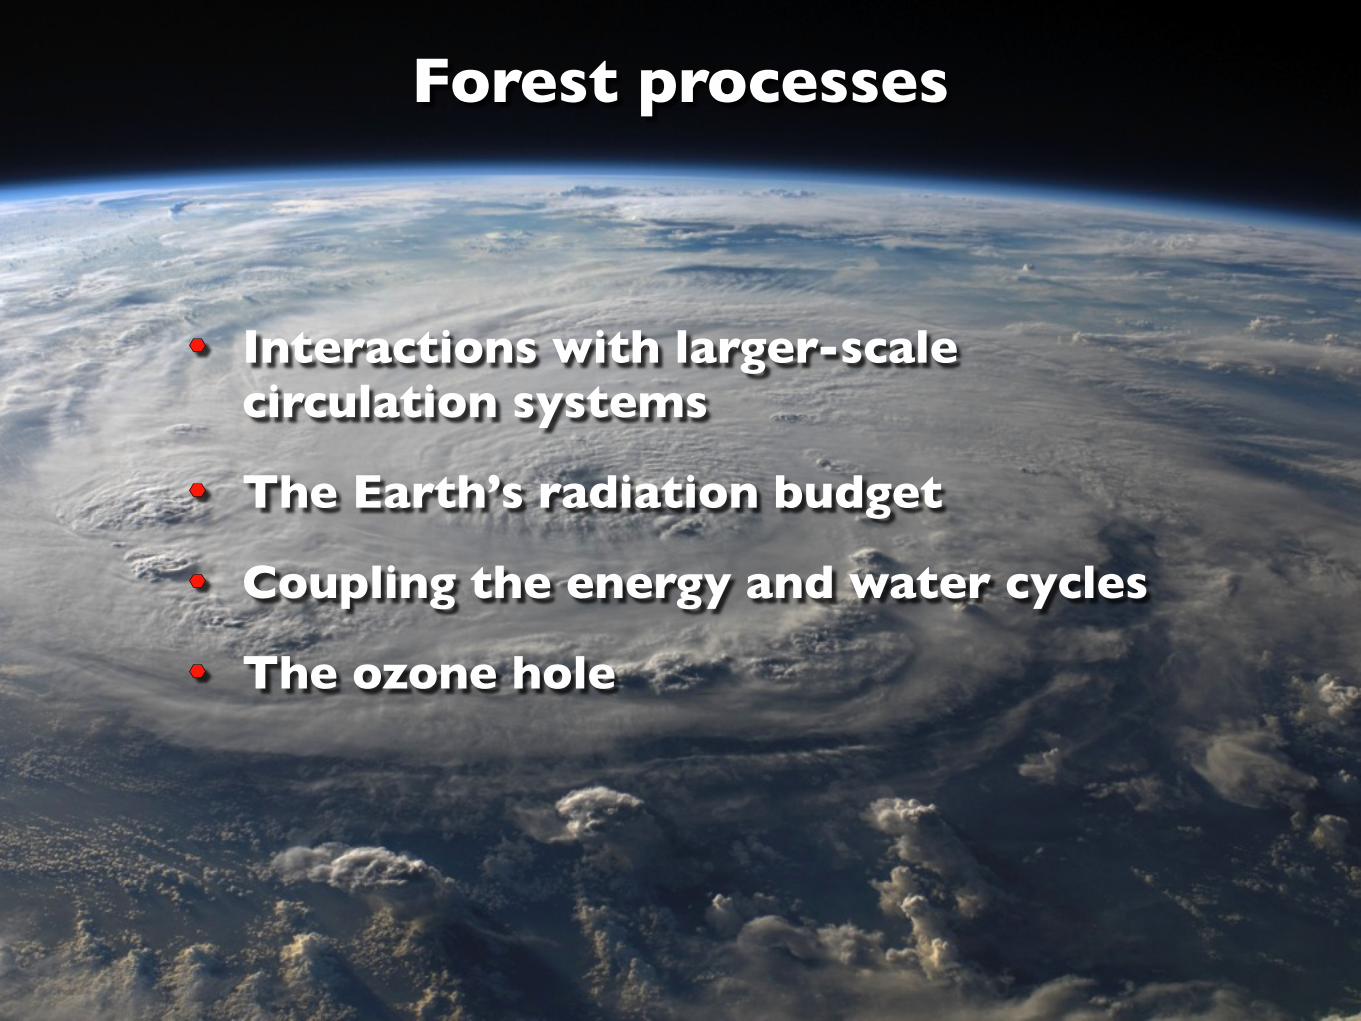
Forest processes
Interactions with larger-scale circulation systems
The Earth’s radiation budget
Coupling the energy and water cycles
The ozone hole
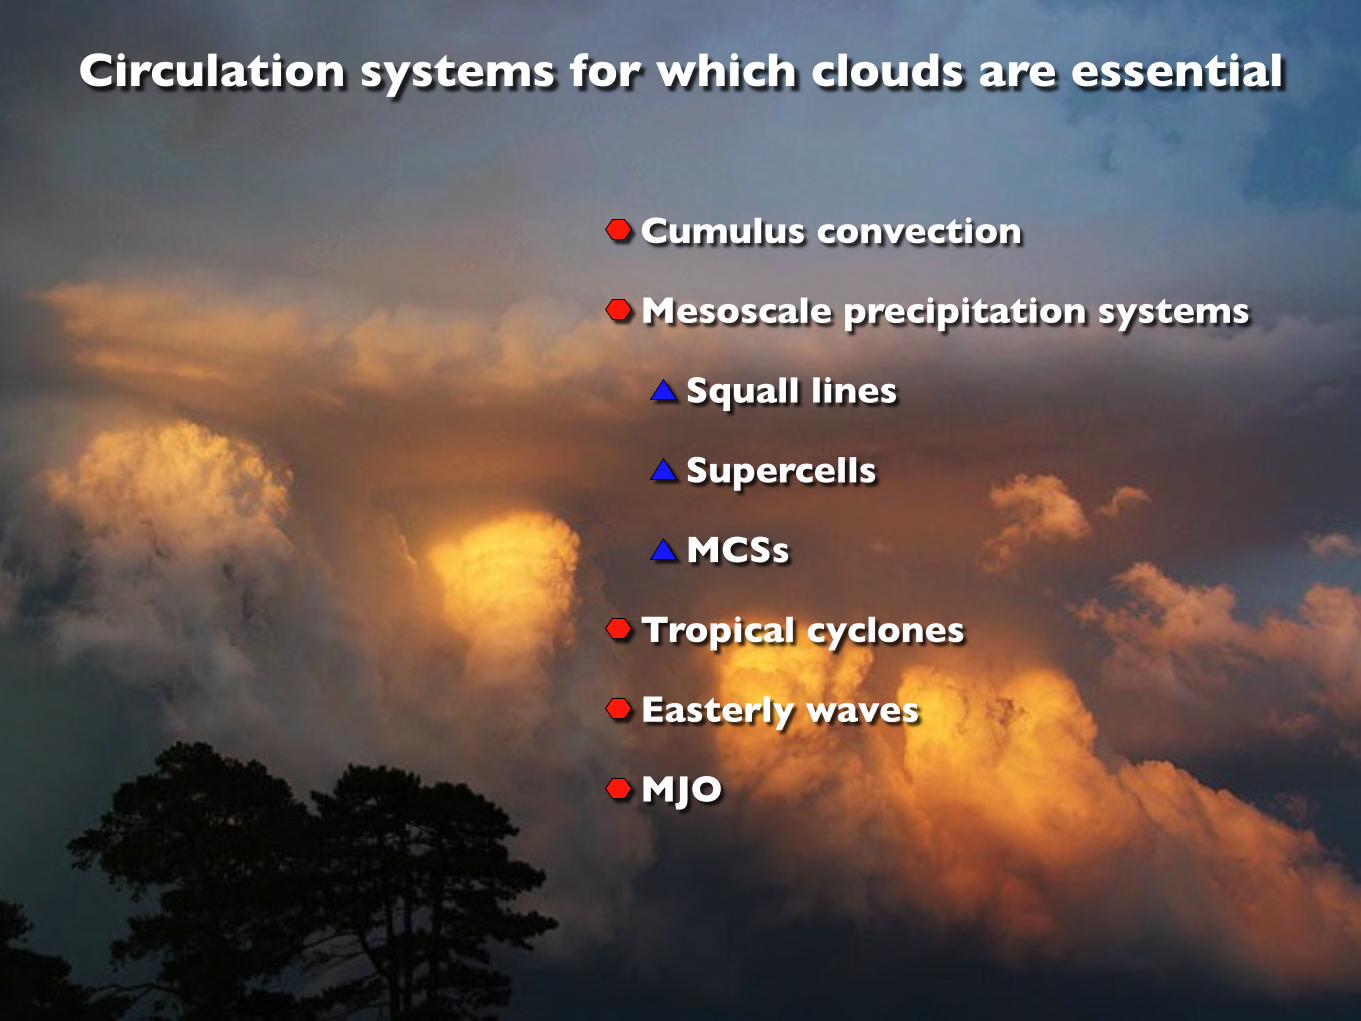
Circulation systems for which clouds are essential
Cumulus convection
Mesoscale precipitation systems
Squall lines
Supercells
MCSs
Tropical cyclones
Easterly waves
MJO

-25+15 -100+20 -5+5 -15+10 -20
850
200
500
700
p
Cool & dry Cool & dry
~10 days~20 days ~10-15 days
SST’
[hPa
]
Deepening cumulus heating & moistening,
destabilization
Convective and stratiform rainfall,
stabilization
Suppressed convection
Lag Day
West East
Slide from Jim Benedict
Larger-Scale Circulation Systems
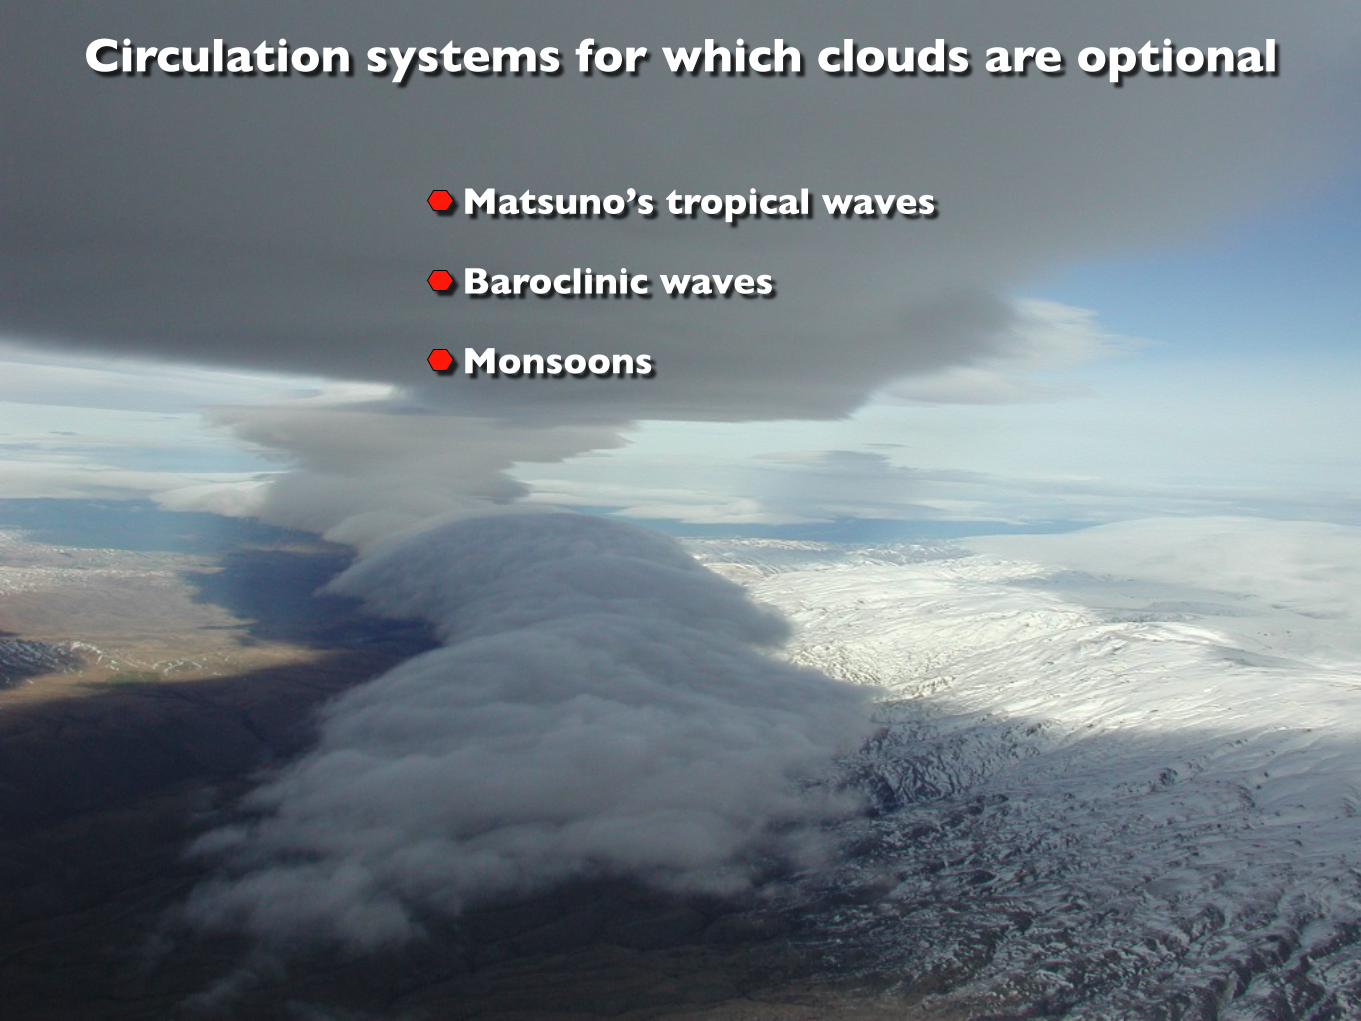
Circulation systems for which clouds are optional
Matsuno’s tropical waves
Baroclinic waves
Monsoons
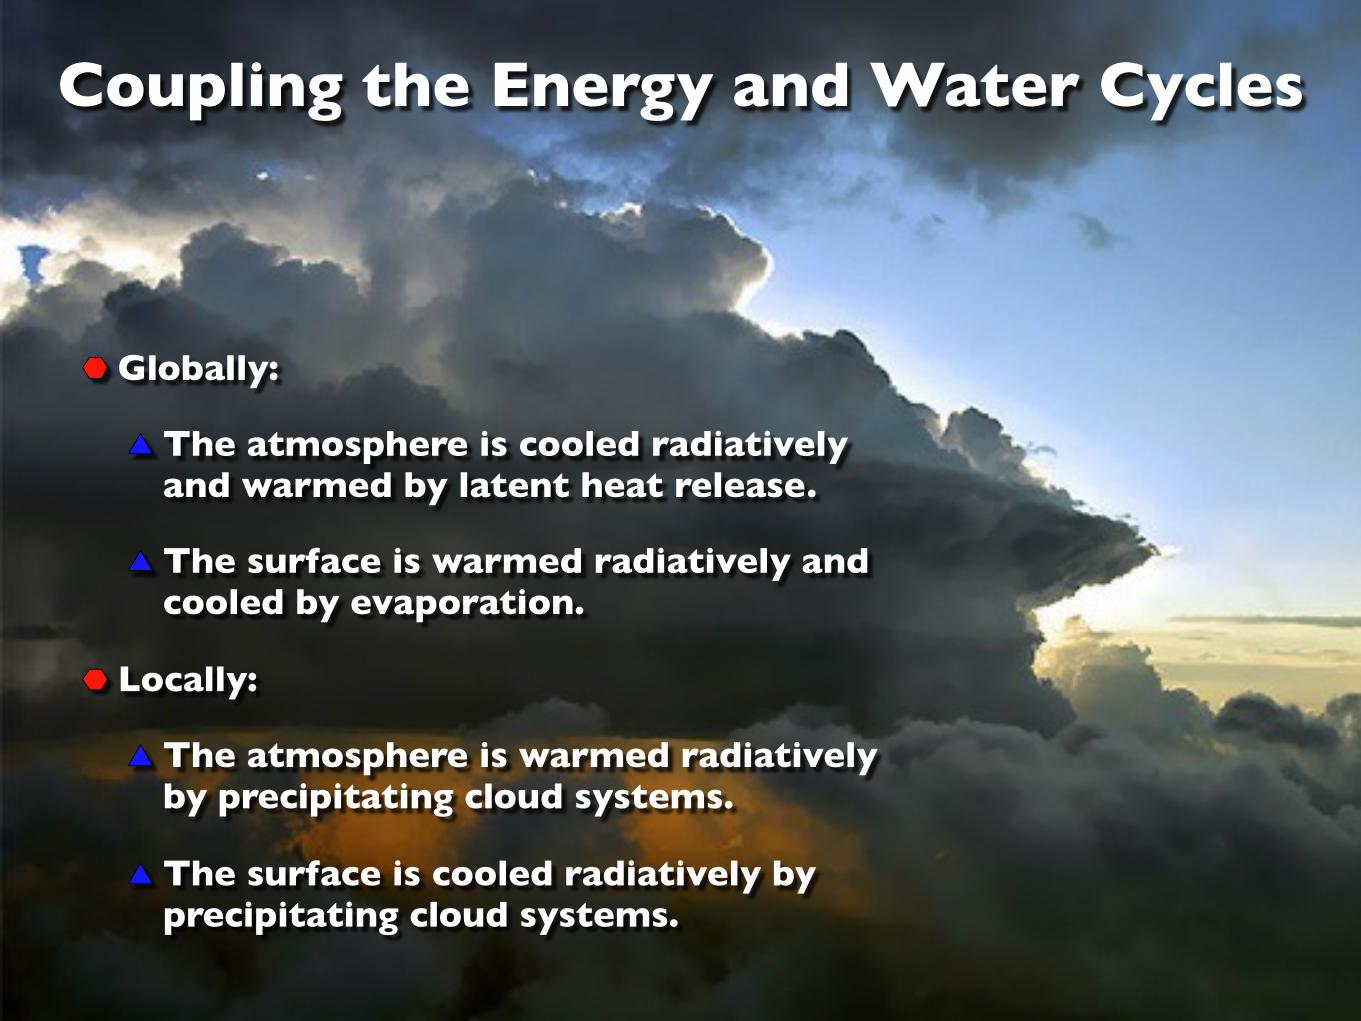
Coupling the Energy and Water Cycles
Globally:
The atmosphere is cooled radiatively and warmed by latent heat release.
The surface is warmed radiatively and cooled by evaporation.
Locally:
The atmosphere is warmed radiatively by precipitating cloud systems.
The surface is cooled radiatively by precipitating cloud systems.
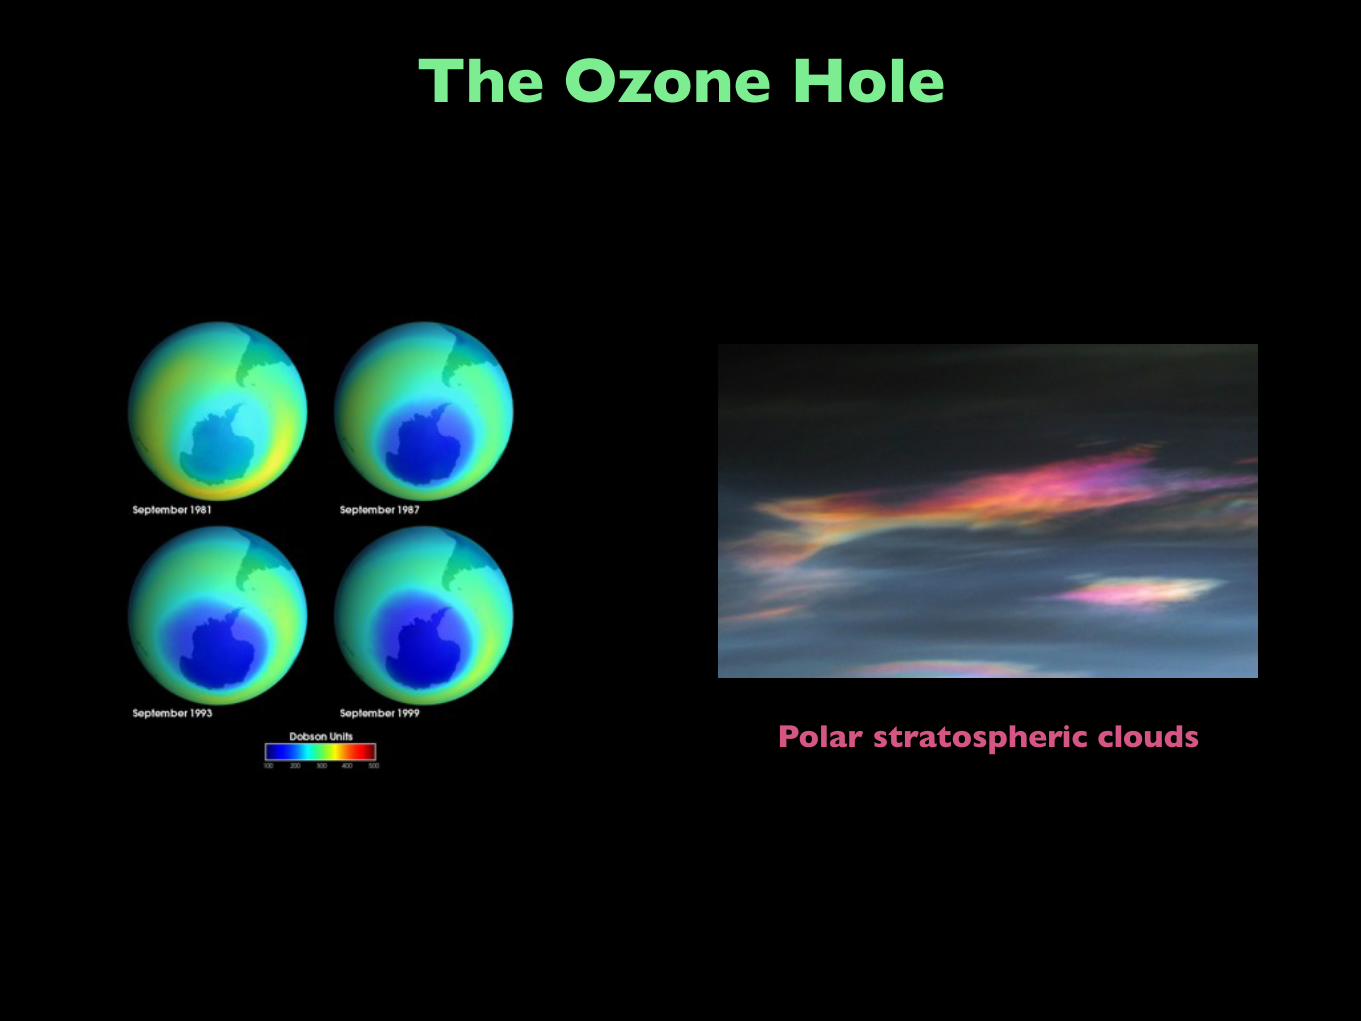
The Ozone Hole
Polar stratospheric clouds

Polar stratospheric clouds
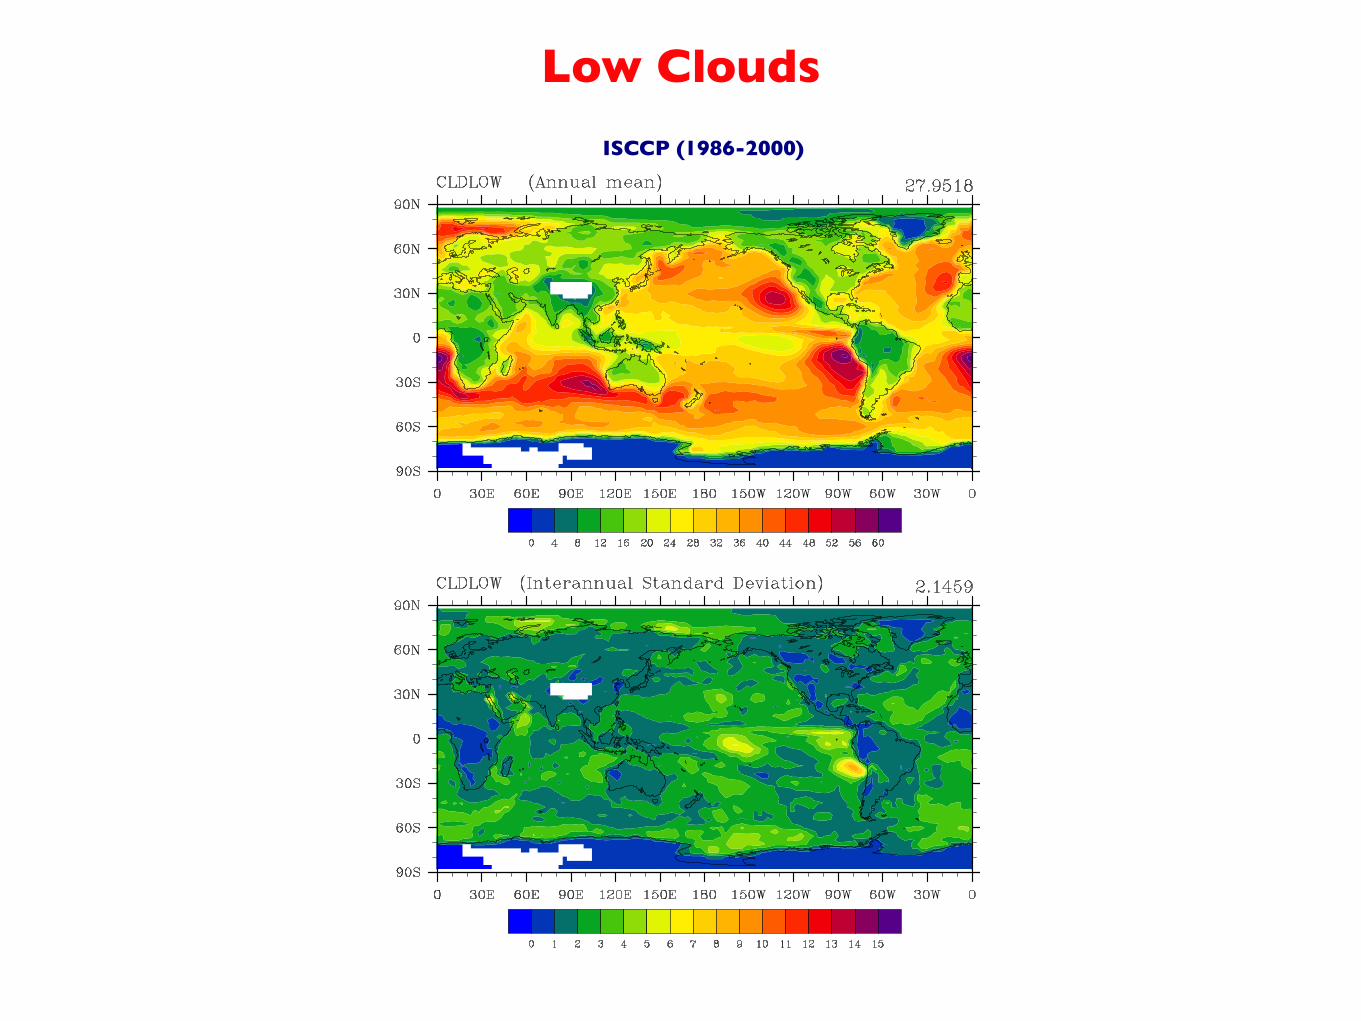
Low Clouds
ISCCP (1986-2000)
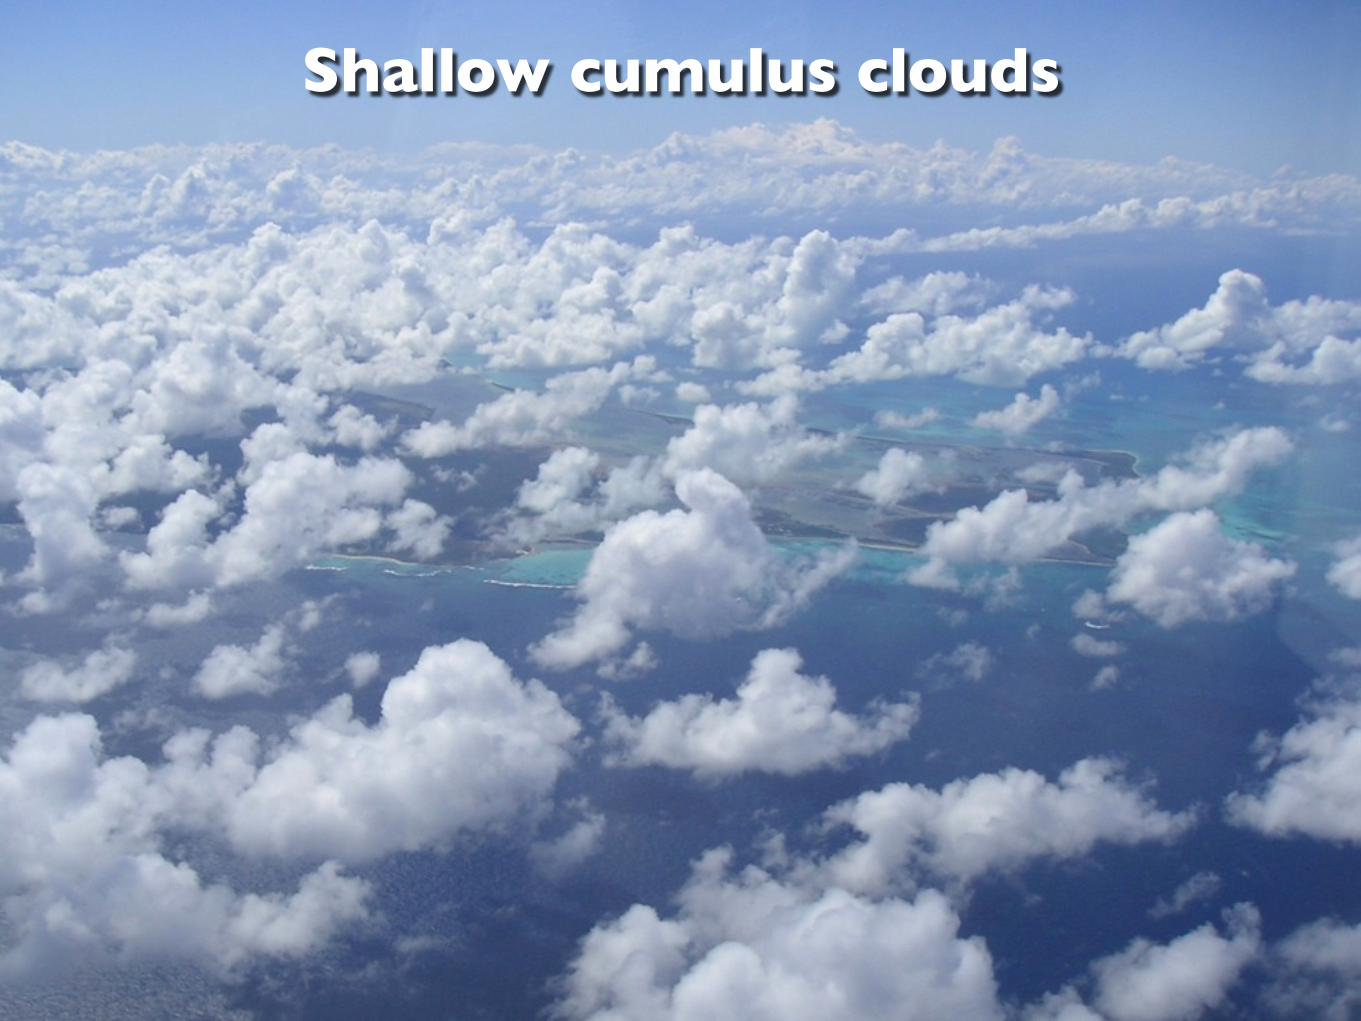
Shallow cumulus clouds

Marine stratocumulus clouds


Slide from Bjorn Stevens
“Models of cloud-topped mixed layers”

What is entrainment?
Clouds don’t entrain.
Turbulence entrains.
Clouds are turbulent.
Entrainment is the active annexation of quiet fluid by turbulence.

“Models of cloud-topped mixed layers”
583MAY 2003AMERICAN METEOROLOGICAL SOCIETY |
One last technological development that moti-vated a new observational attack on the entrainmentproblem was the availability of the National ScienceFoundation/National Center for AtmosphericResearch (NSF/NCAR) C130. Its long range facili-tates more extensive sampling of more remote lay-ers, and its large payload enables the delivery of agreater range of scientific instrumentation to the tar-get area.
THE FLIGHTS. The field program took place inJuly 2001. Remotely sensed data, forecast model out-put, and other data of opportunity were collected andarchived for the entire month, and research flightstook place from 7 to 28 July 2001. Flight operationswere based out of North Island Naval Air Station, just
across the bay from San Diego. The target area wasapproximately 1 h west southwest of San Diego as il-lustrated in Fig. 1. The field program consisted ofseven entrainment research flights and two radar re-search flights.
The entrainment flights were designed followinga template illustrated with the aid of Fig. 2. Althoughno single flight followed this schematic exactly, its es-sential elements were incorporated into every entrain-ment flight. These elements included circles to esti-mate divergences and fluxes concurrently (see also theflight track in Fig. 1) and long legs to reduce samplingerrors in fluxes and other higher-order statistics. Thestacking of these legs can allow better estimates ofcloud-top or surface fluxes. In addition, frequent pro-filing of the layer facilitated evaluation of the layer
FIG. 2. DYCOMS-II flight strategy. Symbols in bottom panel refer to total water mixing ratio qt; its changeacross cloud top, !qt; liquid water potential temperature, !l; its change across cloud top, !!l; and liquidwater mixing ratio ql.
Figure from Stevens et al. (2003)
(Fqt )B = −EΔqt (Fθl )B = −EΔθl +ΔR
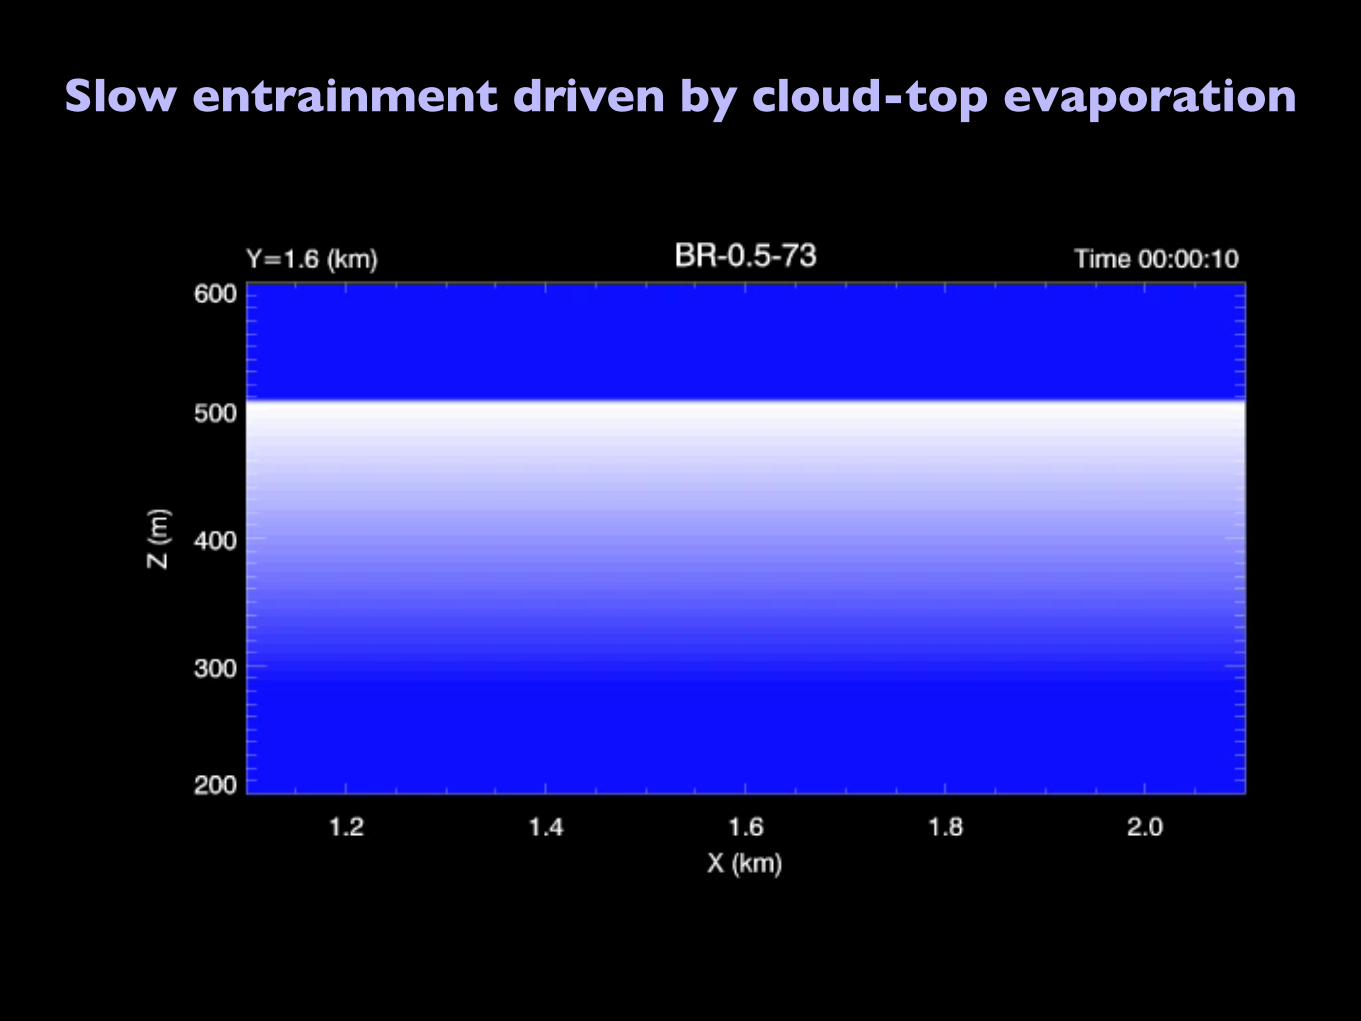
Slow entrainment driven by cloud-top evaporation
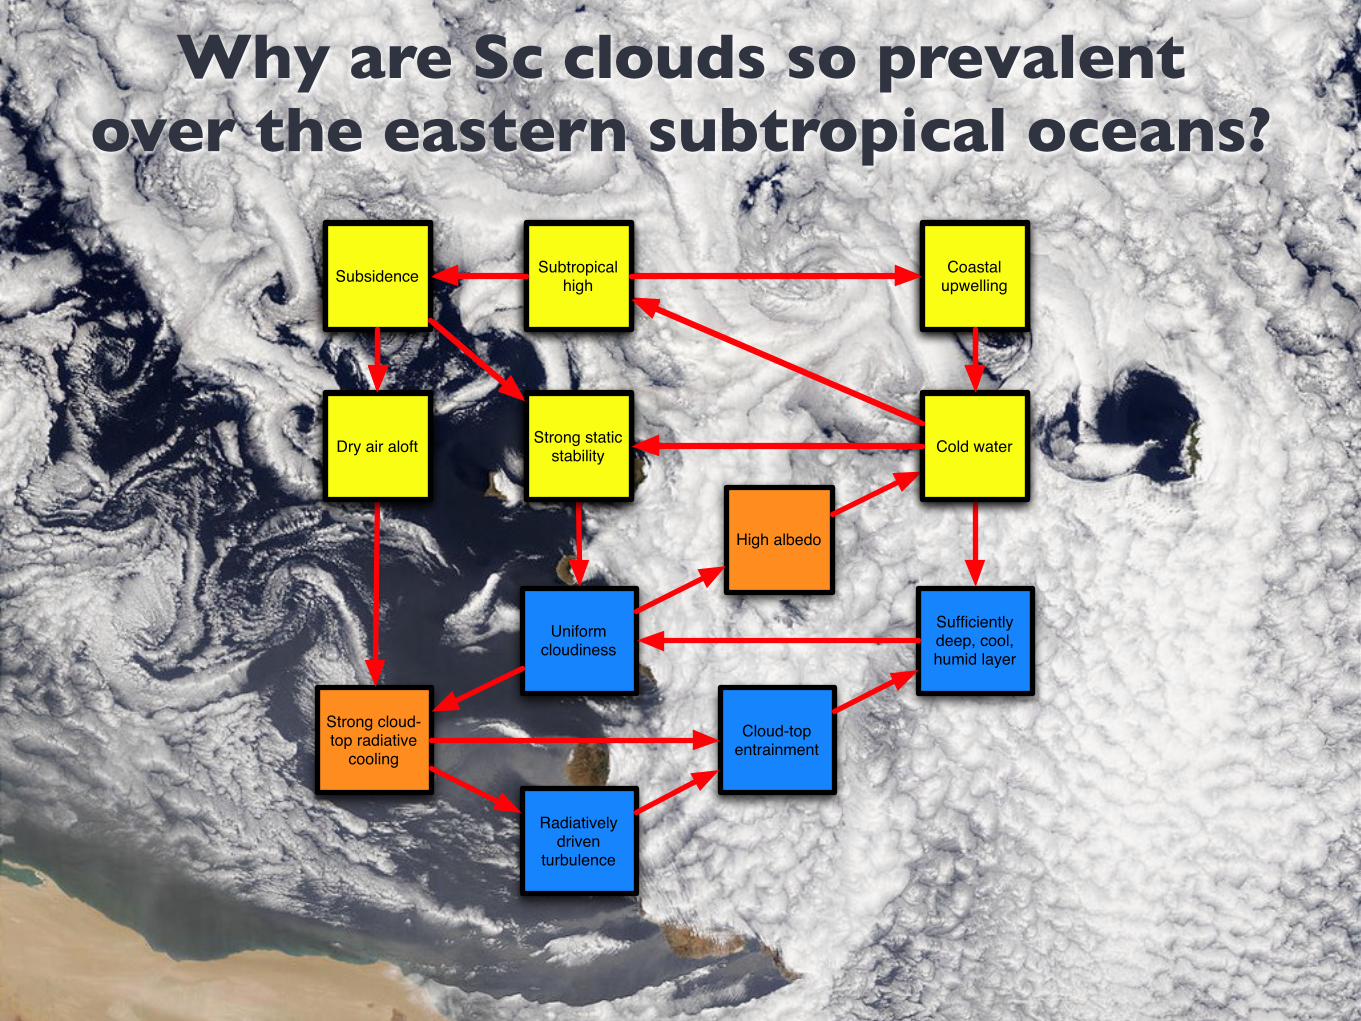
Why are Sc clouds so prevalent over the eastern subtropical oceans?
Radiatively driven
turbulence
Strong cloud-top radiative
cooling
Uniform cloudiness
Strong static stability
Cloud-top entrainment
Sufficiently deep, cool, humid layer
Subsidence
Cold water
High albedo
Dry air aloft
Subtropical high
Coastal upwelling
Strong static stability
Subsidence
Cold waterDry air aloft
Subtropical high
Coastal upwelling

NO DATA 0 10 20 30 40 50 60 70 80
Annual ISCCP C2 Inferred Stratus Cloud Amount
Percent
NO DATA -90 -70 -50 -40 -30 -20 -10 0 10 20 30 40
Annual ERBE Net Radiative Cloud Forcing
W/m**2
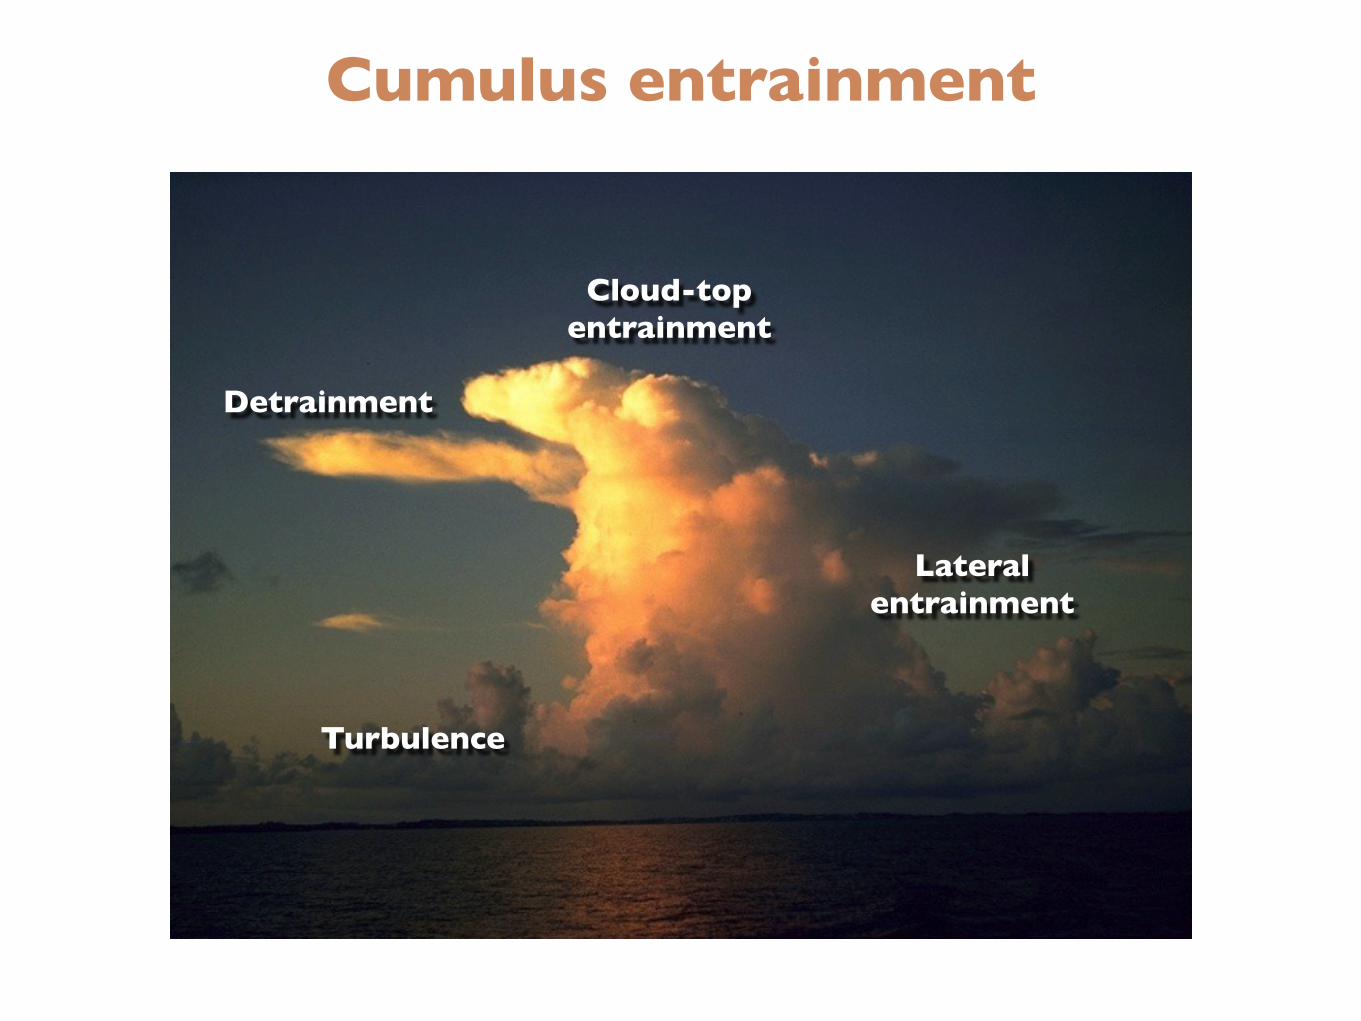
Cumulus entrainment
Detrainment
Cloud-top entrainment
Turbulence
Lateral entrainment

Entraining plumes
∂Mc z( )∂z
= E z( ) − D z( )
∂∂z
Mc z( )hc z( )⎡⎣ ⎤⎦ = E z( )h z( )− D z( )hc z( )
∂hc z( )∂z
=E z( )Mc
h z( ) − hc z( )⎡⎣ ⎤⎦
Mass budget
Moist static energy budget
Dilution

Conditional instability
Gravity wave Cumulus convectionDry thermal

Deep convection

ITCZ
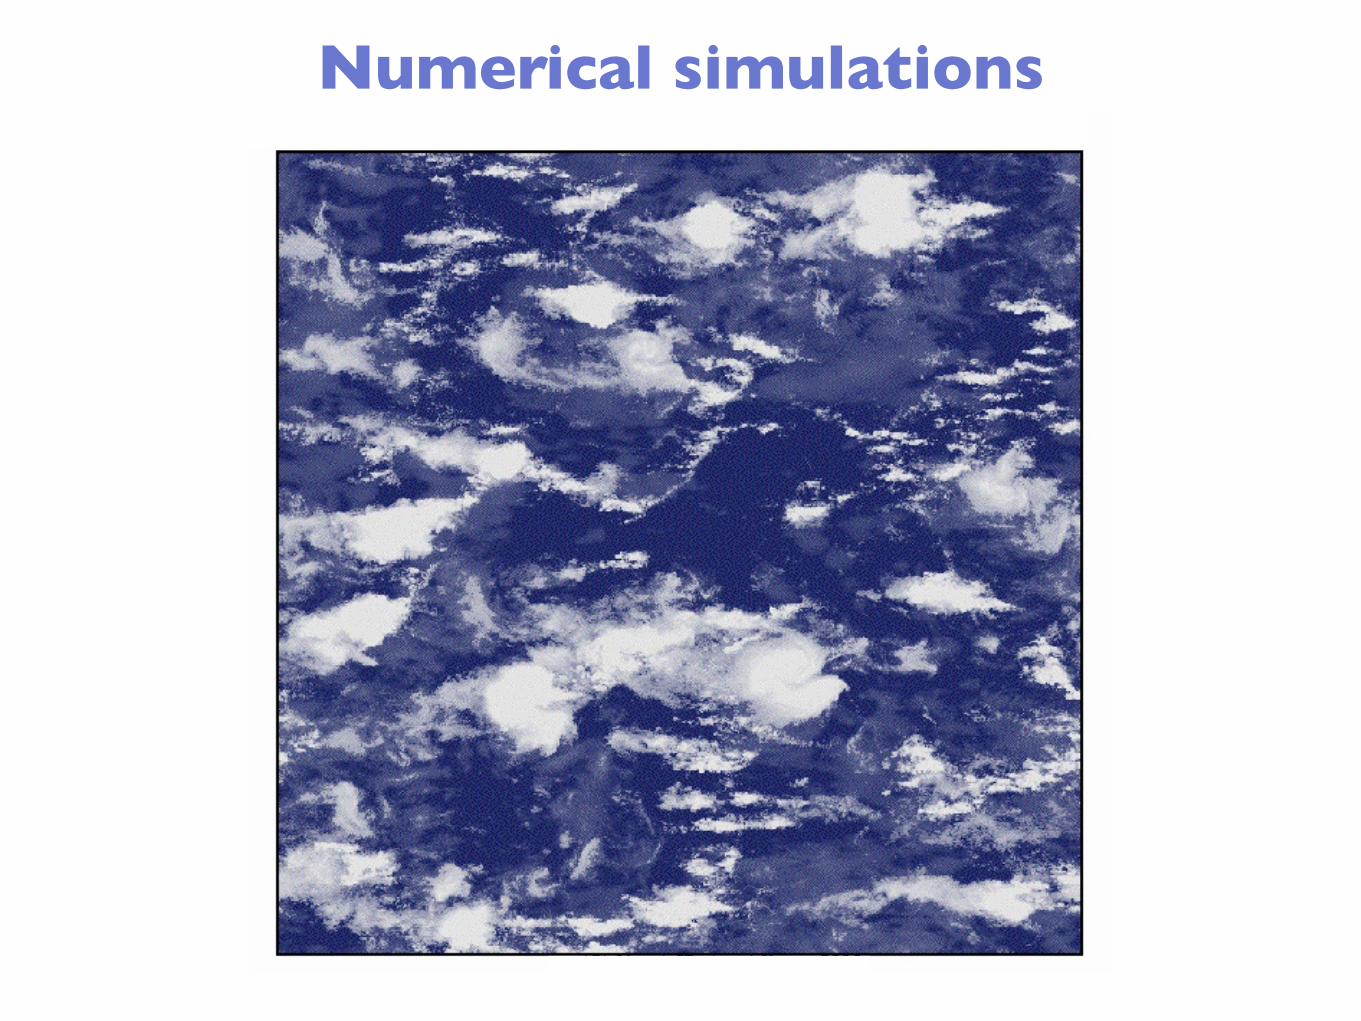
Numerical simulations
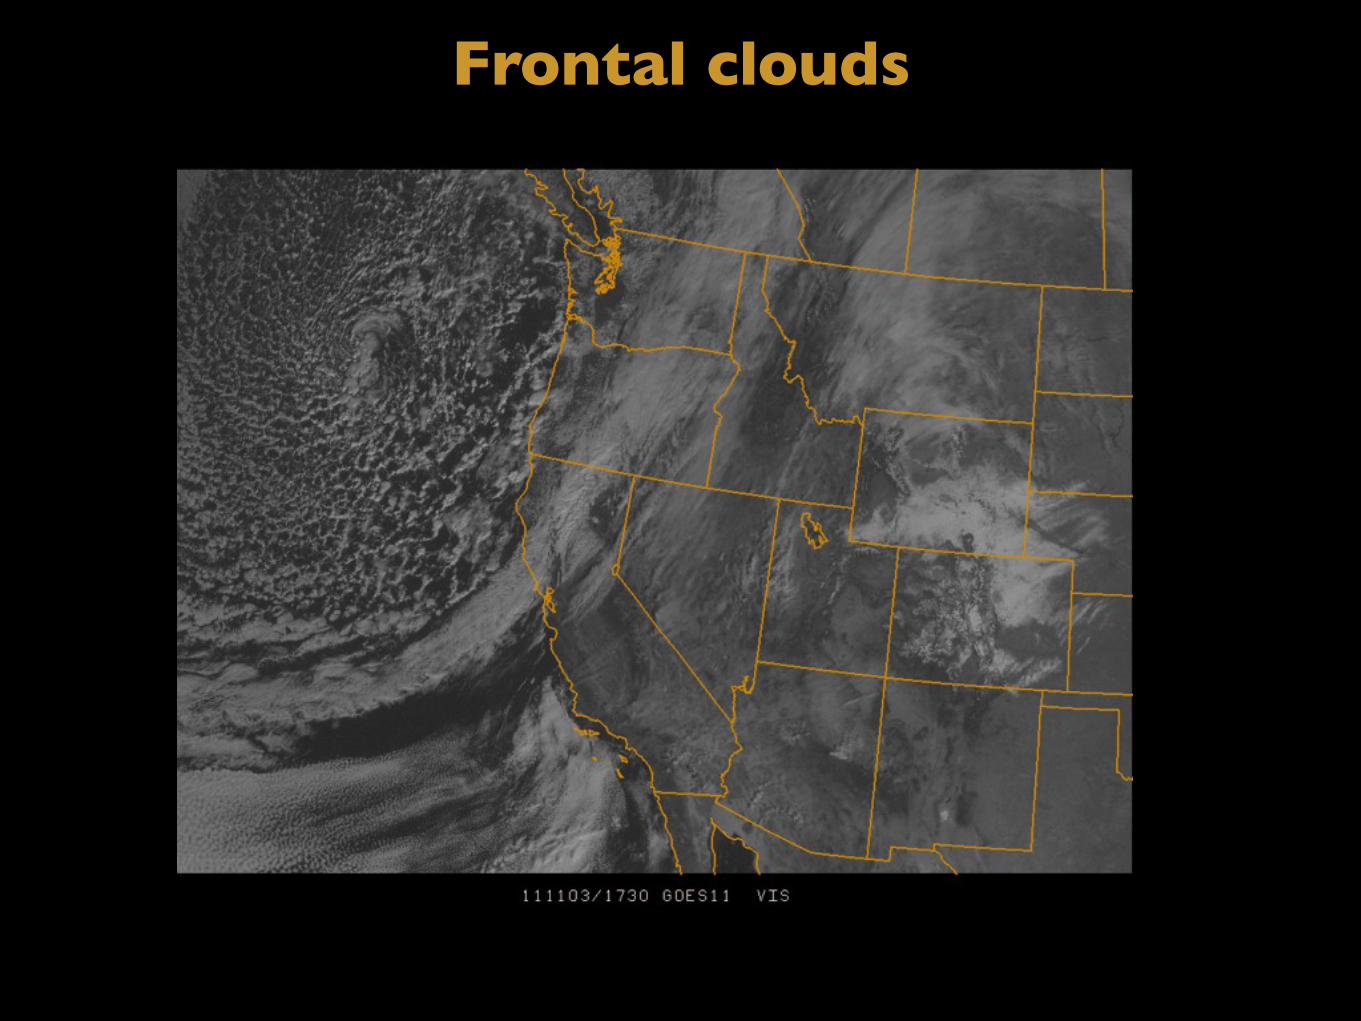
Frontal clouds
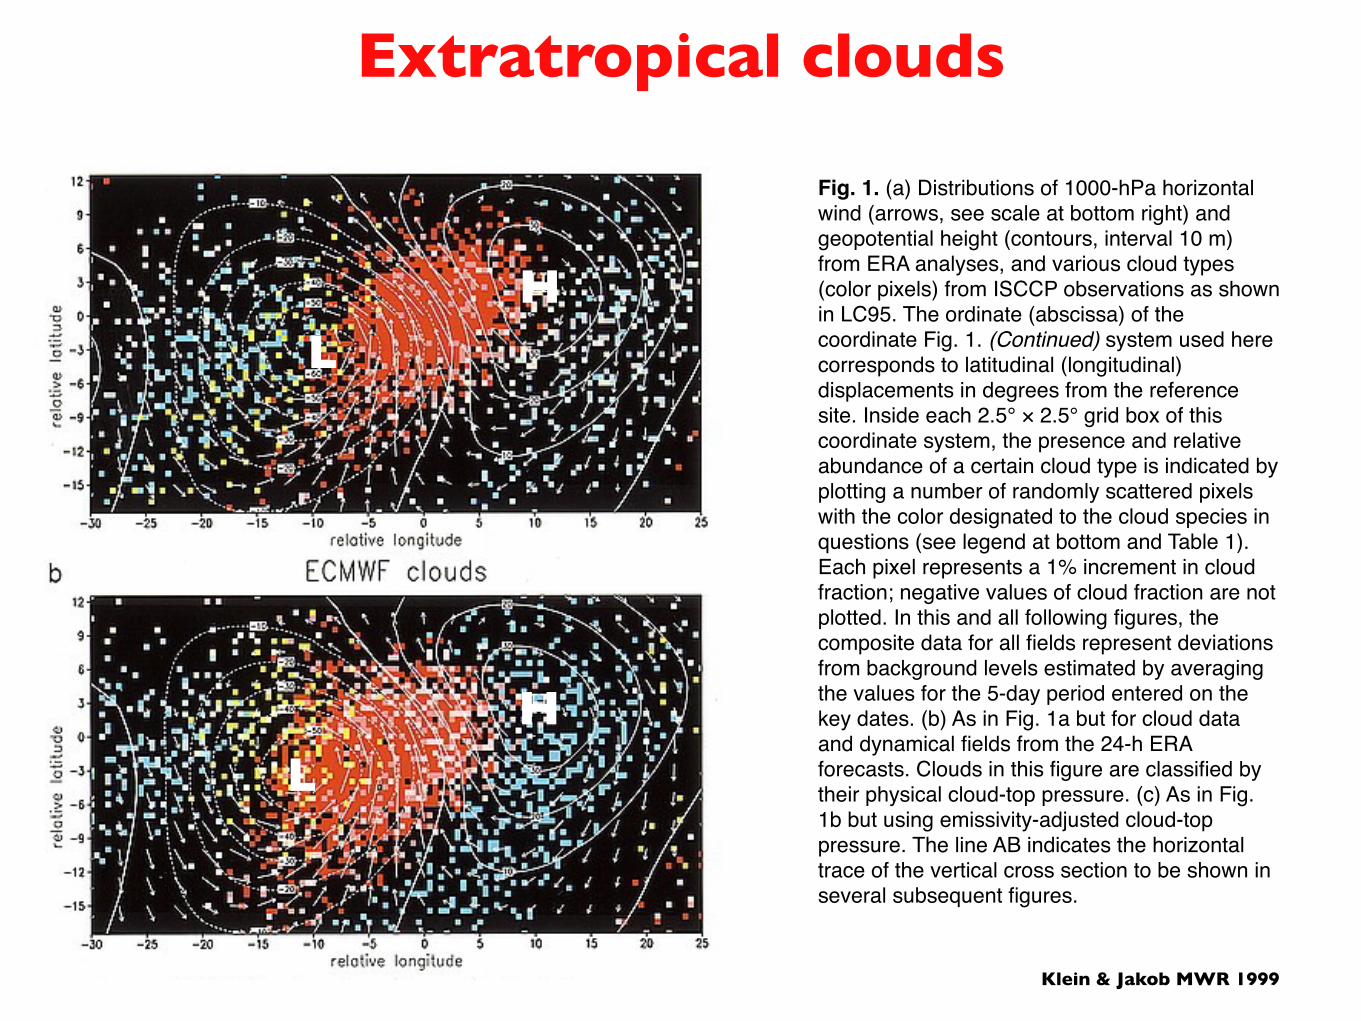
Extratropical clouds
Fig. 1. (a) Distributions of 1000-hPa horizontal wind (arrows, see scale at bottom right) and geopotential height (contours, interval 10 m) from ERA analyses, and various cloud types (color pixels) from ISCCP observations as shown in LC95. The ordinate (abscissa) of the coordinate Fig. 1. (Continued) system used here corresponds to latitudinal (longitudinal) displacements in degrees from the reference site. Inside each 2.5° × 2.5° grid box of this coordinate system, the presence and relative abundance of a certain cloud type is indicated by plotting a number of randomly scattered pixels with the color designated to the cloud species in questions (see legend at bottom and Table 1). Each pixel represents a 1% increment in cloud fraction; negative values of cloud fraction are not plotted. In this and all following figures, the composite data for all fields represent deviations from background levels estimated by averaging the values for the 5-day period entered on the key dates. (b) As in Fig. 1a but for cloud data and dynamical fields from the 24-h ERA forecasts. Clouds in this figure are classified by their physical cloud-top pressure. (c) As in Fig. 1b but using emissivity-adjusted cloud-top pressure. The line AB indicates the horizontal trace of the vertical cross section to be shown in several subsequent figures.
Klein & Jakob MWR 1999
LH
LH

Cloud Feedback(s)
•Cloud amount
•Cloud top height
•Cloud optical properties
•Convective transports
•Precipitation
•Radiative effects
or

Final Draft Chapter 8 IPCC WG1 Fourth Assessment Report
1
2 3 4 5 6 7 8 9
10 11 12 13
Figure 8.14. Comparison of GCM climate feedback parameters for water vapour (WV), cloud (C), surface albedo (A), lapse rate (LR) and the combined water vapour + lapse rate (WV+LR) in units of W m–2 K–1. "ALL" represents the sum of all feedbacks. Results are taken from Colman (2003a) (blue, black), Soden and Held (2006) (red) and Winton (2006a) (green). Closed blue and open black symbols from Colman (2003a) represent calculations determined using the partial radiative perturbation (PRP) and the radiative-convective method (RCM) approaches respectively. Crosses represent the water vapour feedback computed for each model from Soden and Held (2006) assuming no change in RH. Vertical bars depict the estimated uncertainty in the calculation of the feedbacks from Soden and Held (2006).
Do Not Cite or Quote 8-114 Total pages: 19
Feedbacks in Real Climate Change Simulations

Low-Cloud Feedback
Less absorbed sunshine
Warming
More bright, low clouds
Increasing greenhouse
gases
-
Note: This feedback can be either positive or negative.
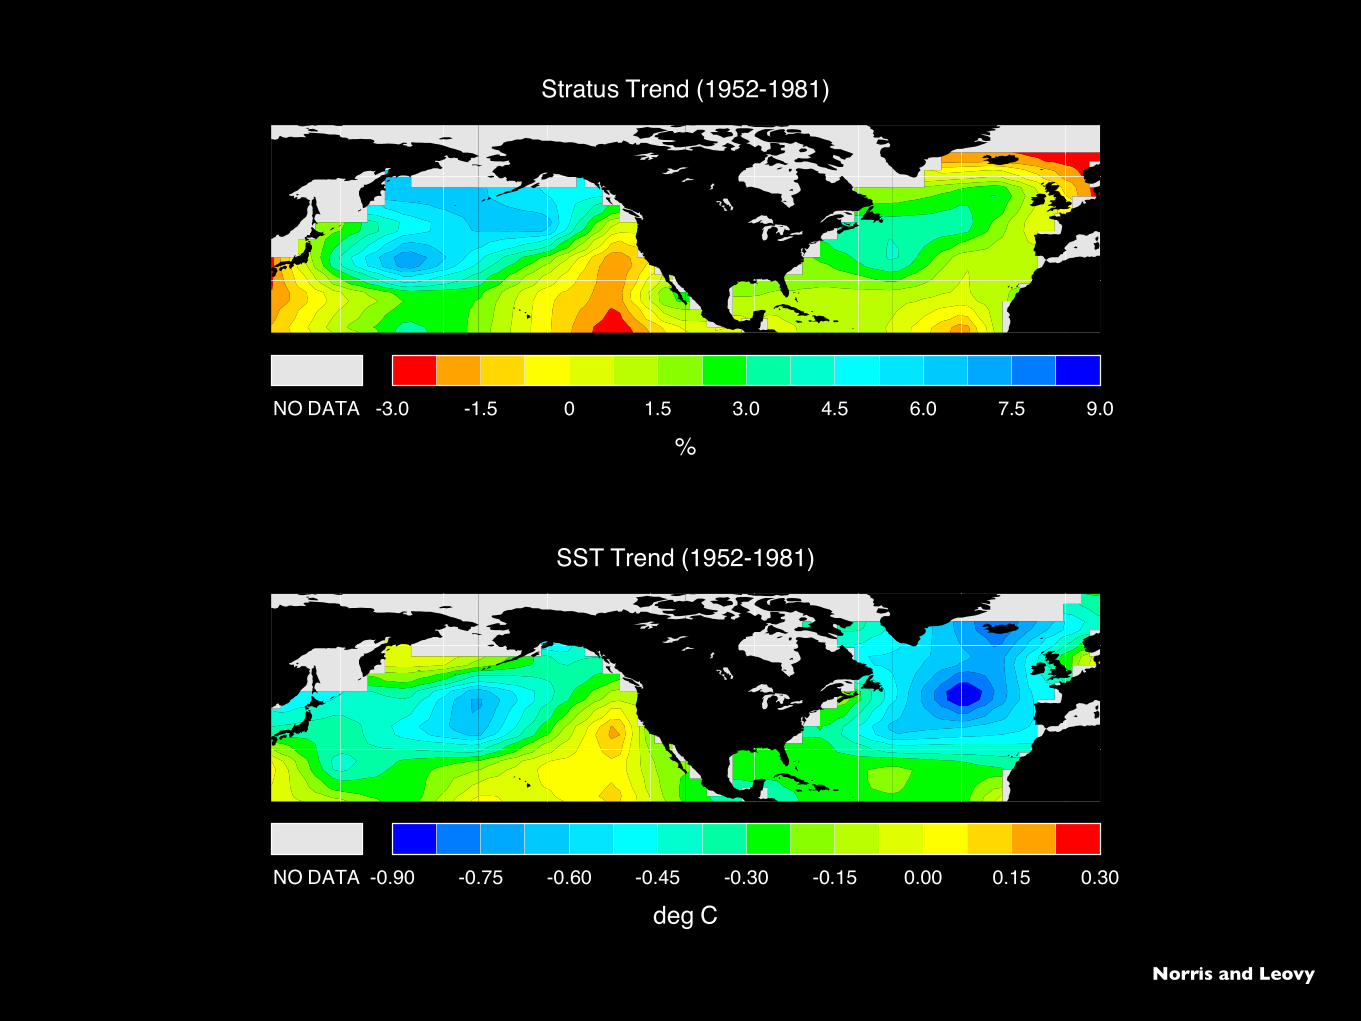
NO DATA -3.0 -1.5 0 1.5 3.0 4.5 6.0 7.5 9.0
Stratus Trend (1952-1981)
%
NO DATA -0.90 -0.75 -0.60 -0.45 -0.30 -0.15 0.00 0.15 0.30
SST Trend (1952-1981)
deg C
Norris and Leovy
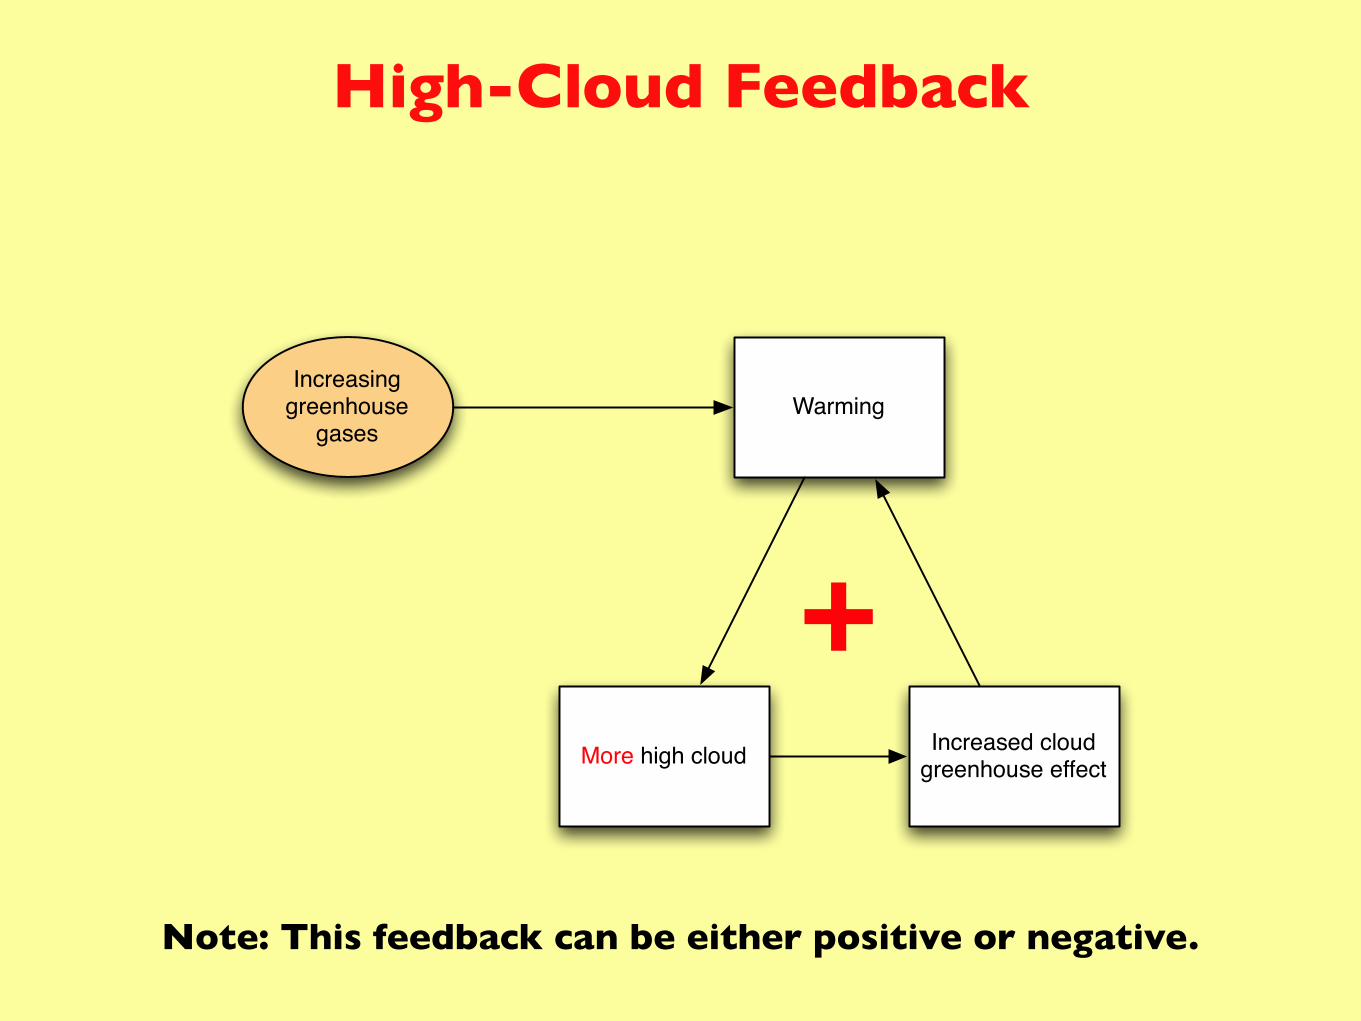
High-Cloud Feedback
Increased cloud greenhouse effect
Warming
More high cloud
Increasing greenhouse
gases
+
Note: This feedback can be either positive or negative.

The lapse-rate feedback
Temperature
Height
−∂T∂z
The temperature is predicted to increase more aloft than near the surface, because the moist adiabatic lapse rate decreases at warmer temperatures.

How the lapse rate can feed back
Temperature
Height
−∂T∂z
Warmer air up high can radiate heat away to space more easily than warmer air near the ground.
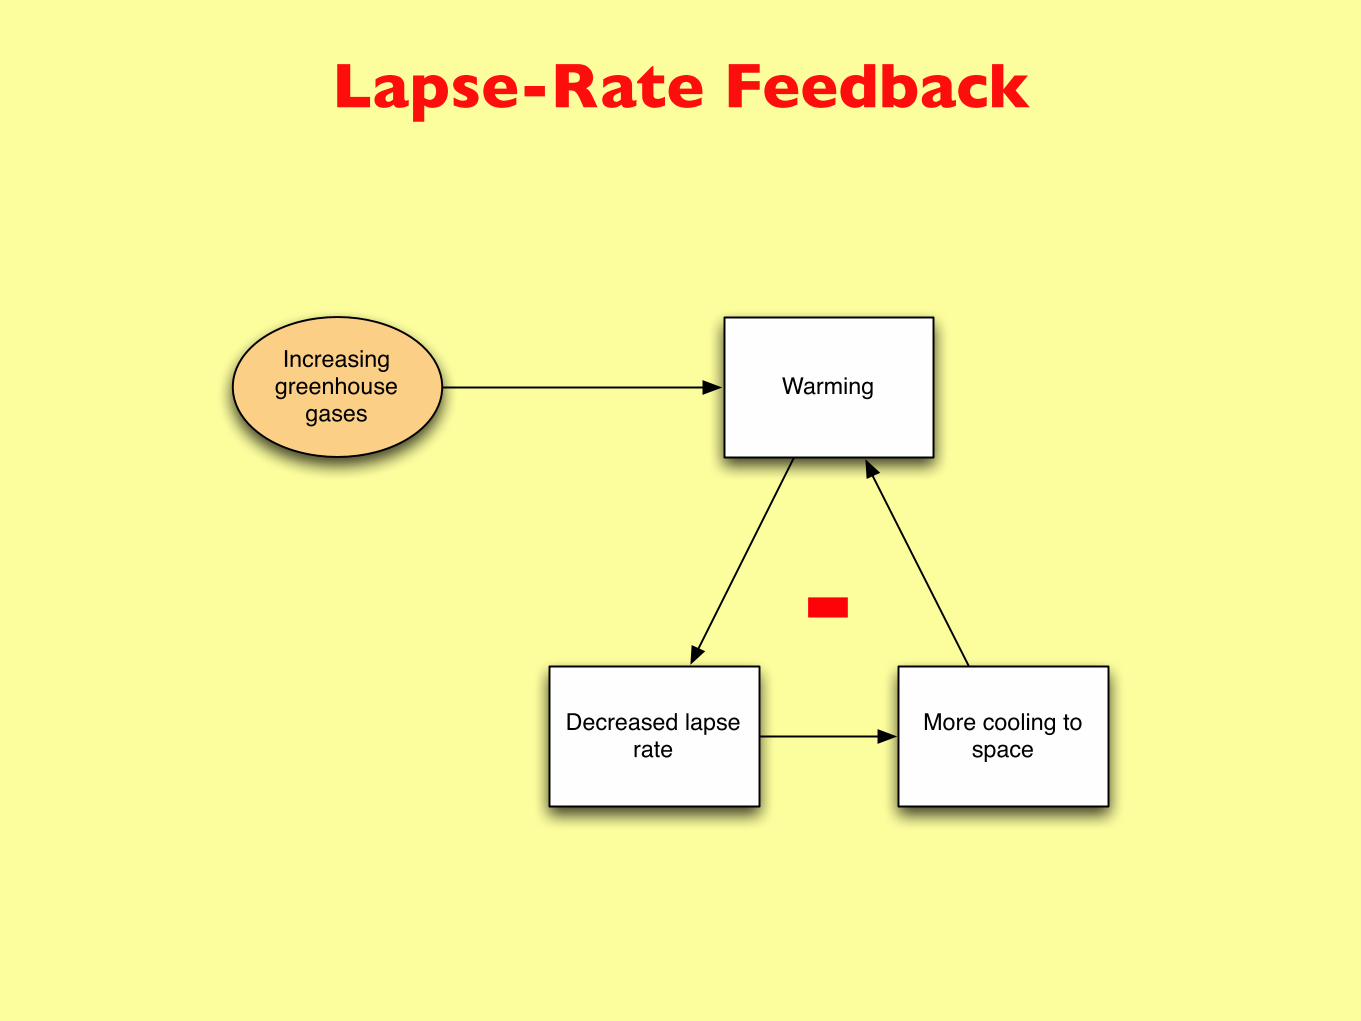
Lapse-Rate Feedback
More cooling to space
Warming
Decreased lapse rate
Increasing greenhouse
gases
-

The lapse-rate feedback in action
Clouds control the vertical distribution of water vapor.

Water Vapor Feedback
Water-vapor greenhouse strengthens
Warming
Increased atmospheric water vapor
Increasing greenhouse
gases
+
As water vapor increases, precipitation and evaporation also increase.
Final Draft Chapter 8 IPCC WG1 Fourth Assessment Report
1
2 3 4 5 6 7 8 9
10 11 12 13
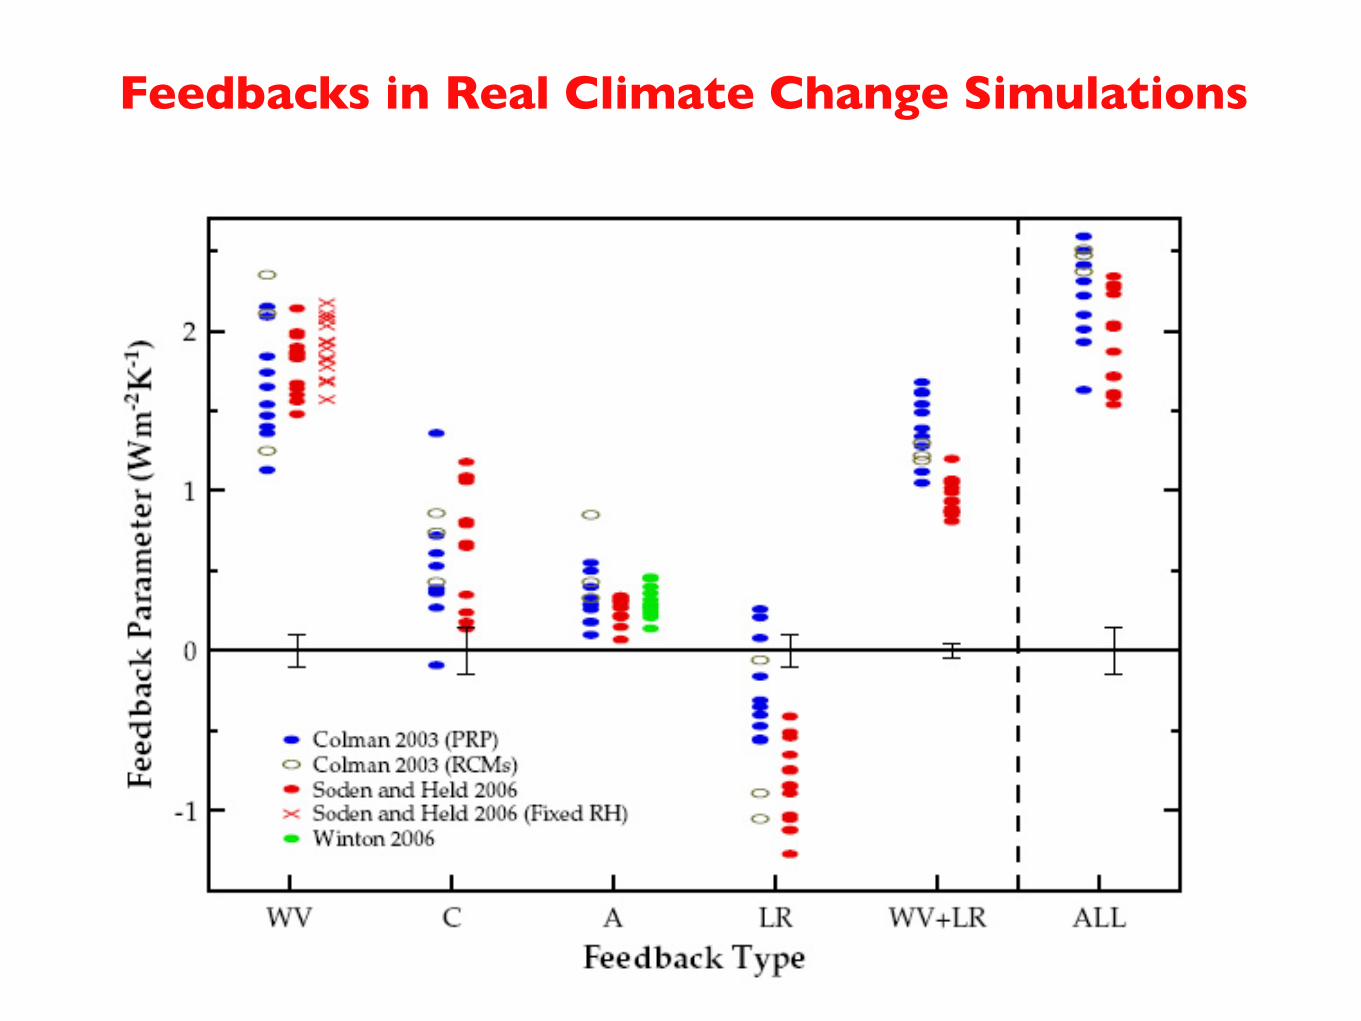
Figure 8.14. Comparison of GCM climate feedback parameters for water vapour (WV), cloud (C), surface albedo (A), lapse rate (LR) and the combined water vapour + lapse rate (WV+LR) in units of W m–2 K–1. "ALL" represents the sum of all feedbacks. Results are taken from Colman (2003a) (blue, black), Soden and Held (2006) (red) and Winton (2006a) (green). Closed blue and open black symbols from Colman (2003a) represent calculations determined using the partial radiative perturbation (PRP) and the radiative-convective method (RCM) approaches respectively. Crosses represent the water vapour feedback computed for each model from Soden and Held (2006) assuming no change in RH. Vertical bars depict the estimated uncertainty in the calculation of the feedbacks from Soden and Held (2006).
Do Not Cite or Quote 8-114 Total pages: 19
Feedbacks in Real Climate Change Simulations
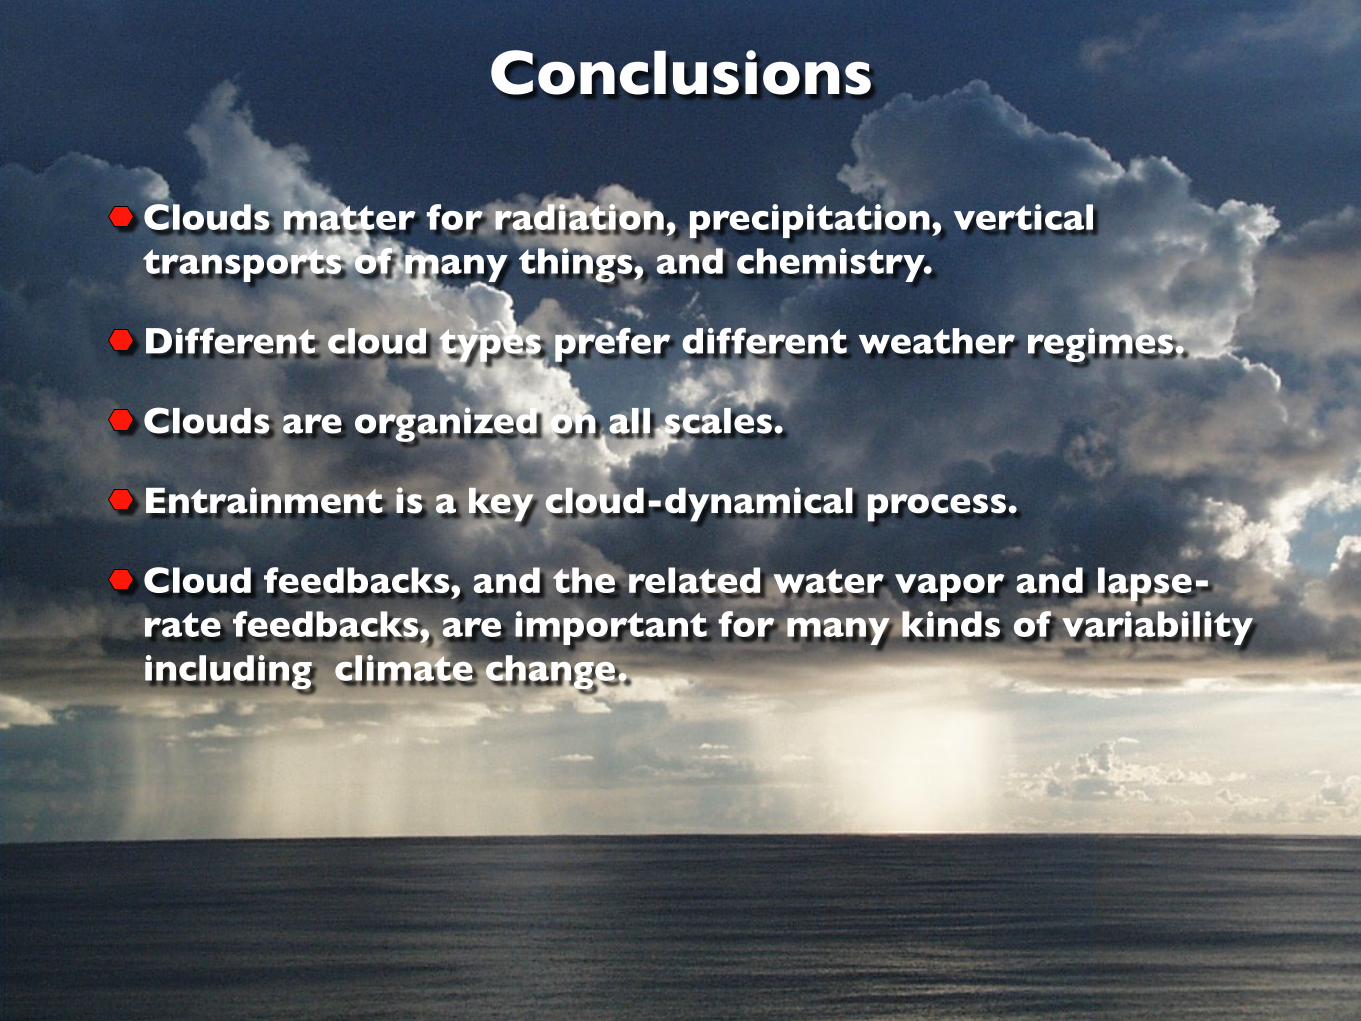
Conclusions
Clouds matter for radiation, precipitation, vertical transports of many things, and chemistry.
Different cloud types prefer different weather regimes.
Clouds are organized on all scales.
Entrainment is a key cloud-dynamical process.
Cloud feedbacks, and the related water vapor and lapse-rate feedbacks, are important for many kinds of variability including climate change.


