PhillipCapital | Equity Research Clover Corporation Limited (CLV) Page 1 21 March 2019 Wayne Sanderson [email protected]+61 3 8633 9930 Risk Rating High 12-mth Target Price (AUD) $1.66 Share Price (AUD) $1.80 12-mth Price Range $0.77 - $1.97 Forecast 12-mth Capital Growth -7.8% Forecast 12-mth Dividend Yield 1.2% 12-mth Total Shareholder Return -6.6% Market cap ($m) 297.3 Net debt (net cash) at 31/7/19e ($m) 2.3 Enterprise Value ($m) 299.6 Gearing (Net Debt/ Equity) 5% Shares on Issue (m) 165.2 Sector Materials- Chemicals Average Daily Value Traded ($) $709,000 ASX 300 Weight n/a Financial Forecasts & Valuation Metrics CLV SHARE PRICE PERFORMANCE Years ending July $m 17(a) 18(a) 19(e) 20(e) 21(e) Sales revenue 47.9 63.0 71.0 82.6 96.5 EBITDA 6.1 10.9 13.1 15.7 19.3 NPAT (reported) 3.6 7.6 8.9 10.5 13.4 EPS (adjusted) 2.5 4.2 5.3 6.4 8.1 EPS growth 88% 67% 26% 20% 28% DPS 1.0 1.8 2.1 2.6 3.3 P/E 71.4 42.8 33.9 28.3 22.2 EV / Ebitda 48.1 27.0 22.8 19.2 15.5 Yield 0.6% 1.0% 1.2% 1.4% 1.8% Franking 100.0% 100.0% 100.0% 100.0% 100.0% Net debt / equity net cash net cash 4.8% 7.3% 2.6% Source: Phillip Capital estimates Clover (CLV) is a niche food ingredients’ company focussed on the production and sale of Omega-3 and DHA rich natural tuna oils and micro-encapsulated powders for applications in infant formulae, food, beverages and supplements. CLV provides these powders and oils to most of the leading infant formula manufacturers in Australia, New Zealand and to many of the leading multinationals. DHA (Docosahexaenoic Acid) is an Omega-3 fatty acid which is essential for brain development in babies and children and is widely used to fortify infant formula. Governments are increasingly legislating the requirement for DHA in infant formula (IF) to match the levels found naturally occurring in human breast milk. CLV uses patented technology licenced exclusively from CSIRO for the encapsulation of marine (fish) oils and algae oils into a dry stable powder form. This protects the ingredients from oxidation, degradation and adverse taste and smell. CLV is one of just 4 global providers of these key ingredients. Key Points Interim results better than expected. Revenue up 10.4%, NPAT and EPS up 24% (excluding FX gain). We upgrade our EPS forecasts by 6.3% / 4.9% / 12.7% for FY19 / 20 / 21. We increase our 12-mth price target by 19% to $1.66 (was $1.40). CLV shares are up by 40% since our initiation report on 8/1/19 at $1.29. The shares now trade on similar multiples to A2 Milk (A2M). We lower our recommendation from Accumulate to HOLD. Catalysts EU Infant Formula regulation EU 2016/127 will make DHA a mandatory ingredient at a minimum level of 20 mg/100k calories and up to 50mg for 0-12mth formula from 22/2/20. This will approximately double the demand for DHA for IF sold in the EU. China has proposed a similar change for minimum DHA inclusion of 15 mg/100kcal. We await news of the legislation / implementation date. China state-run Bonded Warehouses to expand from 15 to 37 (+22) into second and third tier cities. This is a major channel for IF companies such as Bellamys and A2 Milk. Resolution of delays in issuance of new Chinese SAMR licences required for sale of Chinese labelled product into Chinese retailers, including Mother & Baby stores. Many of CLV’s customers do not yet have SAMR registration which is causing them to be very cautious on building inventories. Possible new acquisitions or Joint Ventures. Clover Corporation Limited (CLV) Strong interim results – Operating Profit Leverage Apparent Summary Recommendation Hold (was Accumulate)
Transcript
PhillipCapital | Equity Research Clover Corporation Limited (CLV)
Years ending July $m 17(a) 18(a) 19(e) 20(e) 21(e)
Sales revenue 47.9 63.0 71.0 82.6 96.5
EBITDA 6.1 10.9 13.1 15.7 19.3
NPAT (reported) 3.6 7.6 8.9 10.5 13.4
EPS (adjusted) 2.5 4.2 5.3 6.4 8.1
EPS growth 88% 67% 26% 20% 28%
DPS 1.0 1.8 2.1 2.6 3.3
P/E 71.4 42.8 33.9 28.3 22.2
EV / Ebitda 48.1 27.0 22.8 19.2 15.5
Yield 0.6% 1.0% 1.2% 1.4% 1.8%
Franking 100.0% 100.0% 100.0% 100.0% 100.0%
Net debt / equity net cash net cash 4.8% 7.3% 2.6%
Source: Phillip Capital estimates
Clover (CLV) is a niche food ingredients’ company focussed on the production and sale of Omega-3 and DHA rich natural tuna oils and micro-encapsulated powders for applications in infant formulae, food, beverages and supplements. CLV provides these powders and oils to most of the leading infant formula manufacturers in Australia, New Zealand and to many of the leading multinationals.
DHA (Docosahexaenoic Acid) is an Omega-3 fatty acid which is essential for brain development in babies and children and is widely used to fortify infant formula. Governments are increasingly legislating the requirement for DHA in infant formula (IF) to match the levels found naturally occurring in human breast milk.
CLV uses patented technology licenced exclusively from CSIRO for the encapsulation of marine (fish) oils and algae oils into a dry stable powder form. This protects the ingredients from oxidation, degradation and adverse taste and smell. CLV is one of just 4 global providers of these key ingredients. Key Points
Interim results better than expected. Revenue up 10.4%, NPAT and EPS up 24% (excluding FX gain).
We upgrade our EPS forecasts by 6.3% / 4.9% / 12.7% for FY19 / 20 / 21. We increase our 12-mth price target by 19% to $1.66 (was $1.40).
CLV shares are up by 40% since our initiation report on 8/1/19 at $1.29. The shares now trade on similar multiples to A2 Milk (A2M). We lower our recommendation from Accumulate to HOLD.
Catalysts
EU Infant Formula regulation EU 2016/127 will make DHA a mandatory ingredient at a minimum level of 20 mg/100k calories and up to 50mg for 0-12mth formula from 22/2/20. This will approximately double the demand for DHA for IF sold in the EU.
China has proposed a similar change for minimum DHA inclusion of 15 mg/100kcal. We await news of the legislation / implementation date.
China state-run Bonded Warehouses to expand from 15 to 37 (+22) into second and third tier cities. This is a major channel for IF companies such as Bellamys and A2 Milk.
Resolution of delays in issuance of new Chinese SAMR licences required for sale of Chinese labelled product into Chinese retailers, including Mother & Baby stores. Many of CLV’s customers do not yet have SAMR registration which is causing them to be very cautious on building inventories.
PhillipCapital | Equity Research Clover Corporation Limited (CLV)
Page 2
1H19 Results
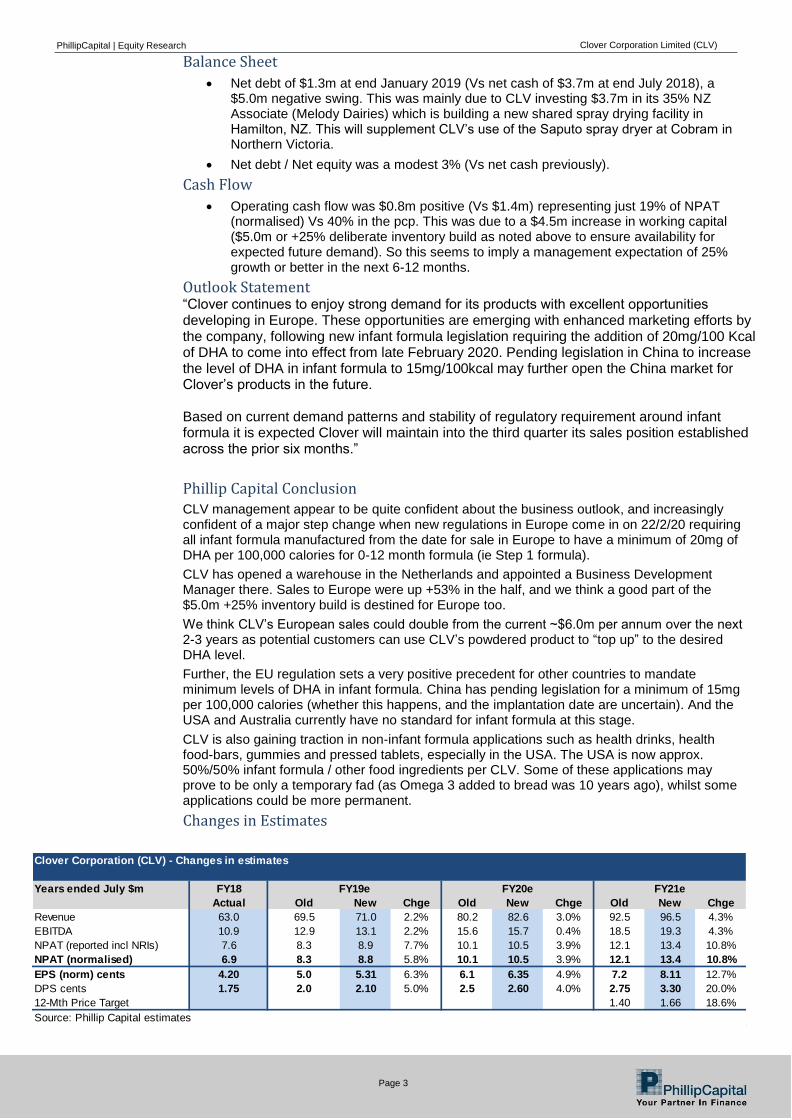
CLV has reported better than expected results for the six months ended July 2018 as follows:
Revenue up 10.4%. This included an estimated 4.0% currency benefit (AUD/USD rate down 8.0% making US$ revenue more valuable, on about half of CLV’s business).
Asian sales +39%, Europe +53% & USA +42% but Aust /NZ down 9% as some large international customers switched production to Asia. A&NZ and Asia combined was up 6.3%. CLV commented that it now has a broader group of customers & applications across powder for liquid drinks, health-food bars, gummies and pressed tablets.
Reported NPAT up 40%, but +24% if we strip out an FX gain on Debtors of $163k this period (and an FX loss of $293k in the PCP), so a material $456k swing.
Operating cash flow was weak due to a $5.0m deliberate inventory build (to $25m v $20m). New warehouse established in the Netherlands to support growing demand in Europe. CLV is obviously very confident of the benefit of the Euro regulation changes mandating DHA in the infant formula from Feb 2020 onwards.
$3.7m investment in NZ associate (Melody Dairies, 35% owned) in the half to build a new shared spray dryer ($11m expected total cost; OEL’s 35% share). This will be ready in late 2020/ early 2021. NZ is now the second largest infant formula producing country in the world.
Europe 2.0 2.1 3.0 52.6% 43.7% Strong performance in Europe, off a low base 2.2 36%
Americas 1.0 1.7 1.4 42.0% -15.9% Strong performance in Europe, off a low base 1.1 29%
Total 31.0 31.9 34.3 10.4% 7.3% 33.2 3.1%
AUD/USD FX rate average 0.781 0.756 0.719 -8.0% -5.0%
Change on pcp 4.2% -1.1% -8.0% 8% benefit to US$ denominated revenues (which are about 50% of CLV total)
Balance Sheet
Net Cash (Debt) $m 2.3 3.7 -1.3 -155% -134.2% $5.0m swing from net cash to net debt due to $3.7m investment in NZ Assoc 4.6 -127%
Net Debt / Equity % -7% -10% 3% Negligible gearing of only 3% -11%
Working Capital 24.4 27.2 31.7
Cash Flow
Operating cash flows 1.4 2.7 0.8 -41% -69.1% Weak cash flow due to a $5.0m inventory build 4.4 -81%
Net investing cash flows -3.8 -0.5 -3.7 $3.7m investment in NZ Associate (35% owned; building a new spray dryer) -1.4
Source: Phillip Capital research estimates
PhillipCapital | Equity Research Clover Corporation Limited (CLV)
Page 3
Balance Sheet
Net debt of $1.3m at end January 2019 (Vs net cash of $3.7m at end July 2018), a $5.0m negative swing. This was mainly due to CLV investing $3.7m in its 35% NZ Associate (Melody Dairies) which is building a new shared spray drying facility in Hamilton, NZ. This will supplement CLV’s use of the Saputo spray dryer at Cobram in Northern Victoria.
Net debt / Net equity was a modest 3% (Vs net cash previously).
Cash Flow
Operating cash flow was $0.8m positive (Vs $1.4m) representing just 19% of NPAT (normalised) Vs 40% in the pcp. This was due to a $4.5m increase in working capital ($5.0m or +25% deliberate inventory build as noted above to ensure availability for expected future demand). So this seems to imply a management expectation of 25% growth or better in the next 6-12 months.
Outlook Statement “Clover continues to enjoy strong demand for its products with excellent opportunities developing in Europe. These opportunities are emerging with enhanced marketing efforts by the company, following new infant formula legislation requiring the addition of 20mg/100 Kcal of DHA to come into effect from late February 2020. Pending legislation in China to increase the level of DHA in infant formula to 15mg/100kcal may further open the China market for Clover’s products in the future. Based on current demand patterns and stability of regulatory requirement around infant formula it is expected Clover will maintain into the third quarter its sales position established across the prior six months.”
Phillip Capital Conclusion CLV management appear to be quite confident about the business outlook, and increasingly confident of a major step change when new regulations in Europe come in on 22/2/20 requiring all infant formula manufactured from the date for sale in Europe to have a minimum of 20mg of DHA per 100,000 calories for 0-12 month formula (ie Step 1 formula).
CLV has opened a warehouse in the Netherlands and appointed a Business Development Manager there. Sales to Europe were up +53% in the half, and we think a good part of the $5.0m +25% inventory build is destined for Europe too.
We think CLV’s European sales could double from the current ~$6.0m per annum over the next 2-3 years as potential customers can use CLV’s powdered product to “top up” to the desired DHA level.
Further, the EU regulation sets a very positive precedent for other countries to mandate minimum levels of DHA in infant formula. China has pending legislation for a minimum of 15mg per 100,000 calories (whether this happens, and the implantation date are uncertain). And the USA and Australia currently have no standard for infant formula at this stage.
CLV is also gaining traction in non-infant formula applications such as health drinks, health food-bars, gummies and pressed tablets, especially in the USA. The USA is now approx. 50%/50% infant formula / other food ingredients per CLV. Some of these applications may prove to be only a temporary fad (as Omega 3 added to bread was 10 years ago), whilst some applications could be more permanent.
PhillipCapital | Equity Research Clover Corporation Limited (CLV)
Page 4
Valuation & Recommendation We have updated our comps and were surprised to see that CLV is now on similar multiples to A2 Milk (A2M), a company with a very well established brand in Australia, New Zealand and increasingly overseas.
Being in pretty much the same industry (infant formula), but one at the retail end, and one at the wholesale end, they share similar growth drivers. Arguably CLV has an even bigger medium term growth driver being the EU regulation for mandatory minimum levels of DHA in infant formula for 0-12mth old babies. And the precedent this sets for China, and possibly other countries to follow. If the proposed mandatory minimum DHA content for the Chinese infant formula becomes law, that would be a major catalyst for CLV. With strong demonstrated operating leverage, increased sales could see an even larger spike in profit margins and earnings, possibly well above our earnings estimates.
CLV is a niche player in the global ingredients market, offering customers a simple way to add value to their food product or other nutritional products, and to differentiate premium products based on the DHA content they contain. But transparency of CLV’s customers and competitors is low. The customer base is highly concentrated with the top 2 customers comprising 57% of FY18 revenue. Patent life is short. And any food quality or safety issue or product recall could be devastating.
We have decided to set our price target based on a 10% P/E discount to A2Milk (A2M) or 20.5x FY21. This implies a 12-mth price target of around $1.66 (previously $1.40). At $1.80 currently, CLV looks fully valued. But with the major European DHA regulation catalyst less than 12-mths away, and possibly a similar catalyst to occur in China we are happy to continue to HOLD the stock. The CLV share price is up 40% since our initiation report on 8 January 2019 (at $1.29 per share). We lower our recommendation from Accumulate to HOLD.
Catalysts
Expected major step up in new orders & customers as EU date for mandatory DHA inclusion approaches (Applies to infant formula manufactured from 22/2/20 for the EU market, for infants 0-12 months).
China – proposal for mandatory minimum levels of DHA in infant formula could be legislated (whether this happens, and the implementation date are uncertain).
China – State-run Bonded Warehouses to be expanded to second and third tier cities, increasing the number from the existing 15 to 37 in total (+22). Timing uncertain.
Resolution of delays in issuance of new Chinese SAMR licences required for sale of Chinese language labelled product into Chinese retailers including Mother & Baby stores. Many of CLV’s customers do not yet have SAMR registration, which is causing them to be very cautious on inventories.
New product developments and innovations.
Possible new acquisitions or JVs. CLV has been hinting of these for some time.
1. Strong 10 year track record – This analyst previously initiated research coverage of CLV
at another broking firm on 12/12/08 with an Accumulate recommendation at 17.5 cents, a
12-month price target of 22 cents, and potential upside to 30c per share. The performance
of the company has been impressive since then, with revenue growing by an average of
11% CAGR (compound annual growth rate), and normalised NPAT and EPS growing by
15% pa. Also the share price rising 10-fold from 17.5 cents then to $1.80 today.
2. Important EU regulation changes – On 2/2/16, the European Union released a new EU
Infant Formula regulation EU 2016/27 that must be adopted by 22/2/20 by all EU infant
formula manufacturers for infant formula marketed within the EU. DHA becomes a
mandatory ingredient at a minimum of 20 mg of DHA per 100,000 calories for 0-12mth
formula. ARA becomes an optional ingredient. We understand that the majority of IF
products marketed in Europe are below the new minimum requirement (average ~7-10mg).
Therefore, the volumes of DHA required could more than double for the EU market.
In addition, we understand that the majority of Euro made IF currently has DHA added via a
wet oil injection process. CLV believes that at much higher input levels there could be taste
and smell issues. On the other hand, CLV’s encapsulated powder protects the DHA oil from
oxidation which is the principal cause of unpleasant smell or taste. So CLV’s powder could
be well placed to top up the existing wet blend producers.
In FY18, the UK/ Europe was 6.7% of CLV sales and this has been rising steadily in recent
years. With a typical 6-month lead time to get stock into stores, this should commence
benefits to CLV in the latter half of calendar 2019 (ie. 1HFY20).
The EU move also sets a very positive precedent for other countries to mandate higher
levels of DHA in IF. There is currently no standard for IF in Australia or the US.
3. China structural growth (and South-East Asia) - China is the largest infant formula
market in the world and following the 2008 melamine substitution scandal (# see paragraph
below) Chinese mothers seem to prefer infant formula manufactured outside China and
from countries with strong and trustworthy food manufacturing safety standards such as
Australia, New Zealand and Europe. Sales to China/ Asian customers have averaged 37%
of CLV’s total sales over the last 4 years, but the true total is likely to be much higher if the
daigou “grey market” trade is factored in. As a major supplier to IF manufacturers worldwide
and especially to manufacturers in Australia and New Zealand, CLV is well placed to benefit
from this long- term structural growth story.
(# The scandal saw 6 deaths and 53,000 babies hospitalised after consuming a leading
budget brand of Chinese infant formula and milk which had been adulterated with
melamine. The chemical gives the appearance of a higher protein content but causes
kidney stones and kidney damage which can be fatal.)
10 Year Review FY08 FY18 10 Yr
CAGRYears ended June $m
Sales 21.6 63.0 11.3%
Gross Profit 7.5 18.2 9.4%
Gross margin 34% 29%
Ebitda (ex FX gains & losses) 2.7 10.9 15.1%
Ebitda margin 12.3% 17.3%
EBIT 2.5 10.8 16.0%
Pretax Profit 3.0 10.6 13.3%
NPAT (reported) 4.1 7.6 6.3%
NPAT (adjusted) 1.9 7.6 14.9%
EPS cents (adjusted) 1.1 4.6 14.9%
DPS cents 1.0 1.8 5.8%
Shares on Issue 165.2 165.2 0.0%
Shareholders Funds (ex mins) 27.0 38.1 3.5%
ROA 7.8% 20.8%
Source: CLV Annual reports; FY08 adjusted to exclude one-off tax credit, and adjusted to a theoretical 30% tax charge
PhillipCapital | Equity Research Clover Corporation Limited (CLV)
Page 6
4. Three recent China regulatory changes –
(a) New Chinese IF regulations announced in October 2016 requires manufacturers to
apply for new licences and to only provide a maximum of 3 brands with 3 scientifically
different formulations in each brand by 1 January 2018. CLV believes that most of its
international (and some Chinese) customers are already well positioned for this change and
that there is clear potential for different levels of DHA to be used as a differentiator in
the formula changes. It is also likely that about 2,400 small local Chinese brands will
disappear with the displaced market share being picked up by the major players, many of
which are existing CLV customers. Although the time deadline has passed, major delays in
the issuance of new licences mean this is yet to play out.
(b) Another change is the proposed expansion of the CBEC (Cross Border Electronic
Commerce) trade. A significant expansion of the number of state-run bonded
warehouses into second and third tier cities has been announced from the current 15 to
37 in total (+22).
(c) Another more recent change is a draft “GB standard” for IF requiring a minimum of
15mg of DHA per 100,000 calories. Similar to the forthcoming EU requirement, we believe
that this would be very positive for CLV if it is initiated.
5. In 2016 CLV achieved “NASAA Organic ingredients status” – This allows the CLV
product to sell as a qualified input for organic products in Australia. Potential customers
could include Bellamys Australia (BAL) and other organic brands. BAL has announced its
intention to upgrade its formula with the inclusion of DHA. Further, with CLV’s product being
made in Australia, this could potentially also help BAL meet its minimum of 60% Australian
content target. BAL had sales of $329m in FY18 and COGS (cost of goods sold) of $200m.
If the DHA additive was worth 2.5-5.0% of BAL’s COGS, this could be a ~$5-10m per
annum potential new customer for CLV.
6. New product development –
(a) CLV recently released a new “hypoallergenic” product (contains no cow/ bovine
proteins), and is designed to be added to goat and sheep milk based IF for consumers who
cannot consume the traditional cow milk-based product. CLV estimates this segment at
around 10% of the total IF market and is seeing good take up by customers.
(b) A new highly concentrated DHA product (with 60% oil loading in powder form) has
been launched into the “gummy bear lolly” market in the USA targeting children’s and
senior’s health. This also has significant potential for applications into the sport’s nutrition,
ready-to-drink and nutraceuticals markets. CLV’s new US distributor is assisting with this.
7. New project – CLV is investing $11m into Melody Dairies Ltd, a third-party specialised
spray drying facility to be constructed at Waikato Innovation Park in Hamilton New Zealand.
CLV will have a 35% share of the project with equivalent access time to the shared facility.
It will be managed and operated by one of the four partners NZFIW (New Zealand Food
Innovation Waikato). There are several benefits to CLV. (a) It gives CLV a part owned
manufacturing base in New Zealand which has become the No.2 exporter of IF in the world;
(b) It can process batches as small as 300kg per hour compared to the 2,000 kg per hour of
the Saputo facility in Cobram Vic which CLV currently uses. CLV says that this will
accelerate its new product development cycle and speed to market for new products; (c) It
provides extra capacity without CLV having to pay for the total capital cost on its own; (d)
Strategic benefits - CLV intend to put about 10% of their total capacity through this plant
which adds flexible, shared capacity and uses someone else’s labour force, and also
provides a beachhead into New Zealand with some interesting aligned business partners.
8. Supportive major shareholder – Respected long-term investor, Washington H Soul
Pattinson (SOL) (Market cap $7.2bn), has been a major shareholder since the IPO. SOL
currently owns 37.4m shares or 22.6%. Long term SOL director Peter Robinson was
Chairman of CLV from 13/12/02 until 21/9/17). This has provided good corporate
governance and discipline to CLV and other attractive characteristics such as no debt.
However, we note that SOL reduced its holding by 9.75m shares to 37.4m in 2016/17.
PhillipCapital | Equity Research Clover Corporation Limited (CLV)
Page 7
Negatives / Risk Factors
1. Chinese market is going through a period of major change and uncertainty. Major IF
manufacturers have reduced inventories and therefore reduced forward ordering due to the
uncertainty on how the new regulations will impact their brands and market access. This
has been compounded by delays in issuing SAMR licences necessary for sales into
Chinese retail stores including the key Mother & Baby store channel. However, CLV is now
seeing a good increase in demand. Recent proposed changes to specify minimum levels of
DHA and to increase the number of bonded warehouses to provincial cities for cross border
e-commerce (CBEC) are positive changes.
2. Major product recalls or contamination issues - These incidents can have big impact
over more than one financial year. For example, when Fonterra had a whey protein
concentrate (WPC) contamination scare (botulism) issue and precautionary stock recall in
NZ, China & Thailand in August 2013. The issue was subsequently found to be a false
alarm. CLV was not directly impacted but some of its customers were and consequently
industry sales got smacked: CLV’s FY14 sales fell -38%, Ebitda fell -82%, and EPS -84%
in that year. FY15 was also weak because some customers switched to cheaper ingredients
and CLV experienced increased competitive pressure on margins. Therefore, the one
incident actually impacted 2-3 years of results. Whilst these issues are usually only
temporary they can have devastating short term affects.
3. Loss of a major customer – CLV’s annual reports reveal that two customers comprised
38% and 19% of sales respectively in FY18 - being 57% combined. This information has
disclosed two major customers in each of the last 6 years. We understand that these may
not necessarily be the same two customers every year, as CLV told us another customer
has grown larger than the former top two. Obviously, the loss of such major customers, or
indeed any major problem with such customers, could have a severe impact on CLV’s
profitability.
4. New products have long lead times - Evaluation of new products by IF manufacturer
customers can take 2 – 4 years and it can take a long time to bring a new product to
market. Fortunately, CLV has a number of new products in its pipeline at different stages of
evaluation.
5. Maintaining the margins – CLV has recorded a gross margin in the range of 20% to 39%
over the last 10 years. Management has commented that it is essential to maintain a high
level of product innovation to protect these high margins. Currently CLV has a strong
pipeline of new or recent products. Ebitda margins have been more volatile, ranging from a
high of 22% in FY09 to a low of 5.9% and 1.9% in FY14 and FY15 after the Fonterra
botulism scare and product recall. This caused some customers to switch to lower priced
ingredients.
6. Sovereign Risk - CLV is increasingly exposed to emerging markets in China and Asia.
Whilst this is a significant opportunity, there is a risk of changes in government regulations
or new or higher tariffs being imposed on imported goods. Other companies such as
Bellamys Australia (BAL) have also experienced major problems when the regulations are
amended.
PhillipCapital | Equity Research Clover Corporation Limited (CLV)
Page 8
Company History
CLV was founded in 1988 as a family owned Australian company providing natural oils-based ingredients for the food industry. It listed on the ASX in November 1999 raising $21m at 30 cents per share for a market cap of $30.3m. Washington H Soul Pattinson was a cornerstone shareholder with an initial shareholding of 27% (40.1 m shares). In 2002 CLV formed a joint venture company (Nu-Mega Ingredients Pty Ltd) with Queensland based Food Spectrum Group, a manufacturer of functional food ingredients. This was 70% owned by CLV initially. CLV moved to full ownership in 2007.
CLV signed important supply contracts for ingredients for infant formula (“IF”) manufacturers with Heinz Farley in the UK (March 2002), International Nutritional Company of Denmark (INC)(March 2003) and Mead Johnson USA (Bristol-Myers Squibb) (Dec 2007). These were the “break-through” contracts which validated CLV’s technology and quality and provided international credibility.
Description of Business
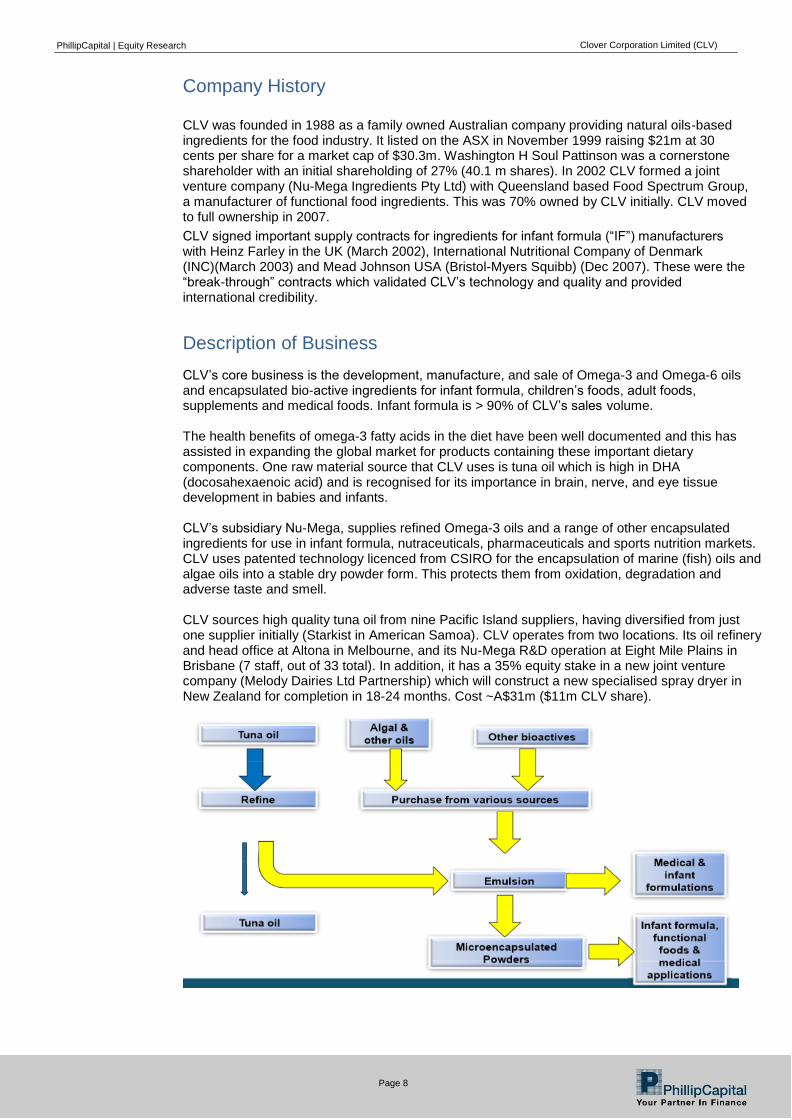
CLV’s core business is the development, manufacture, and sale of Omega-3 and Omega-6 oils and encapsulated bio-active ingredients for infant formula, children’s foods, adult foods, supplements and medical foods. Infant formula is > 90% of CLV’s sales volume. The health benefits of omega-3 fatty acids in the diet have been well documented and this has assisted in expanding the global market for products containing these important dietary components. One raw material source that CLV uses is tuna oil which is high in DHA (docosahexaenoic acid) and is recognised for its importance in brain, nerve, and eye tissue development in babies and infants. CLV’s subsidiary Nu-Mega, supplies refined Omega-3 oils and a range of other encapsulated ingredients for use in infant formula, nutraceuticals, pharmaceuticals and sports nutrition markets. CLV uses patented technology licenced from CSIRO for the encapsulation of marine (fish) oils and algae oils into a stable dry powder form. This protects them from oxidation, degradation and adverse taste and smell. CLV sources high quality tuna oil from nine Pacific Island suppliers, having diversified from just one supplier initially (Starkist in American Samoa). CLV operates from two locations. Its oil refinery and head office at Altona in Melbourne, and its Nu-Mega R&D operation at Eight Mile Plains in Brisbane (7 staff, out of 33 total). In addition, it has a 35% equity stake in a new joint venture company (Melody Dairies Ltd Partnership) which will construct a new specialised spray dryer in New Zealand for completion in 18-24 months. Cost ~A$31m ($11m CLV share).
PhillipCapital | Equity Research Clover Corporation Limited (CLV)
Page 9
Australia / NZ was 65% of FY18 revenue, China/ Asia 29%, Europe 7% and Americas 4% by customer location. However, CLV estimates that a higher proportion of product ends up in China via the cross border and daigou market channels. 70% of revenue was sale of Tuna Powder.
PhillipCapital | Equity Research Clover Corporation Limited (CLV)
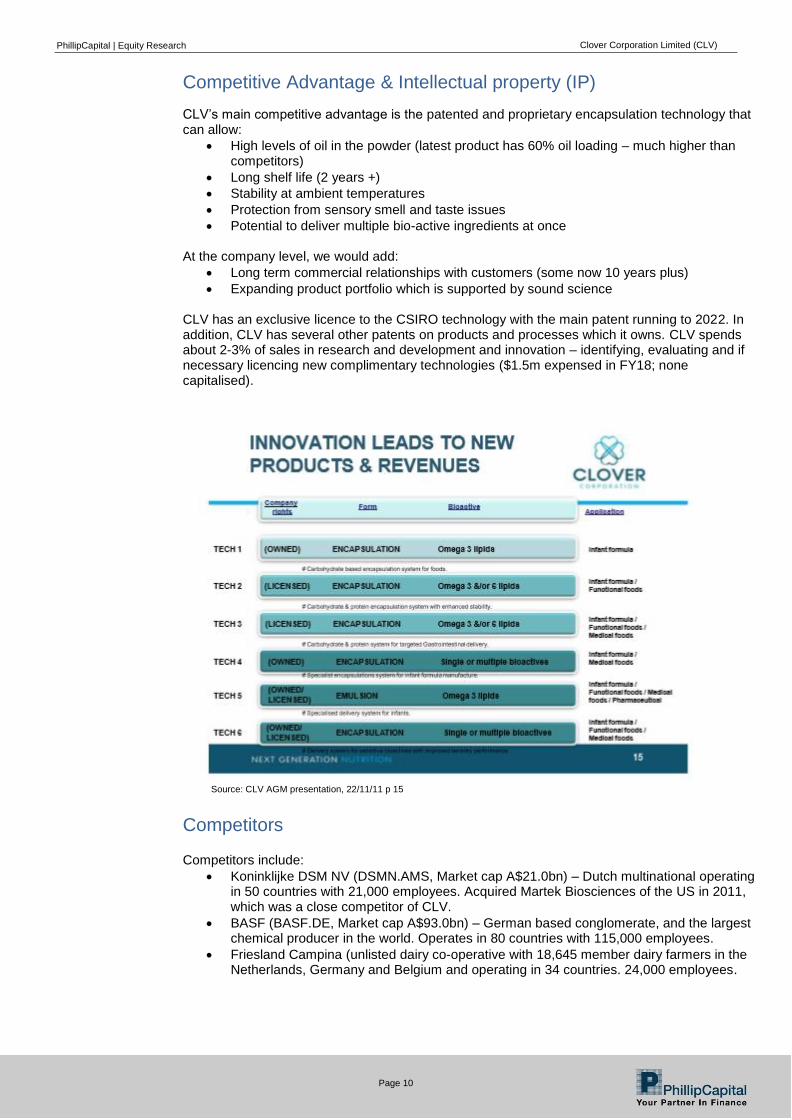
CLV’s main competitive advantage is the patented and proprietary encapsulation technology that can allow:
High levels of oil in the powder (latest product has 60% oil loading – much higher than competitors)
Long shelf life (2 years +)
Stability at ambient temperatures
Protection from sensory smell and taste issues
Potential to deliver multiple bio-active ingredients at once At the company level, we would add:
Long term commercial relationships with customers (some now 10 years plus)
Expanding product portfolio which is supported by sound science
CLV has an exclusive licence to the CSIRO technology with the main patent running to 2022. In addition, CLV has several other patents on products and processes which it owns. CLV spends about 2-3% of sales in research and development and innovation – identifying, evaluating and if necessary licencing new complimentary technologies ($1.5m expensed in FY18; none capitalised).
Source: CLV AGM presentation, 22/11/11 p 15
Competitors
Competitors include:
Koninklijke DSM NV (DSMN.AMS, Market cap A$21.0bn) – Dutch multinational operating in 50 countries with 21,000 employees. Acquired Martek Biosciences of the US in 2011, which was a close competitor of CLV.
BASF (BASF.DE, Market cap A$93.0bn) – German based conglomerate, and the largest chemical producer in the world. Operates in 80 countries with 115,000 employees.
Friesland Campina (unlisted dairy co-operative with 18,645 member dairy farmers in the Netherlands, Germany and Belgium and operating in 34 countries. 24,000 employees.
PhillipCapital | Equity Research Clover Corporation Limited (CLV)
Page 11
Market Size
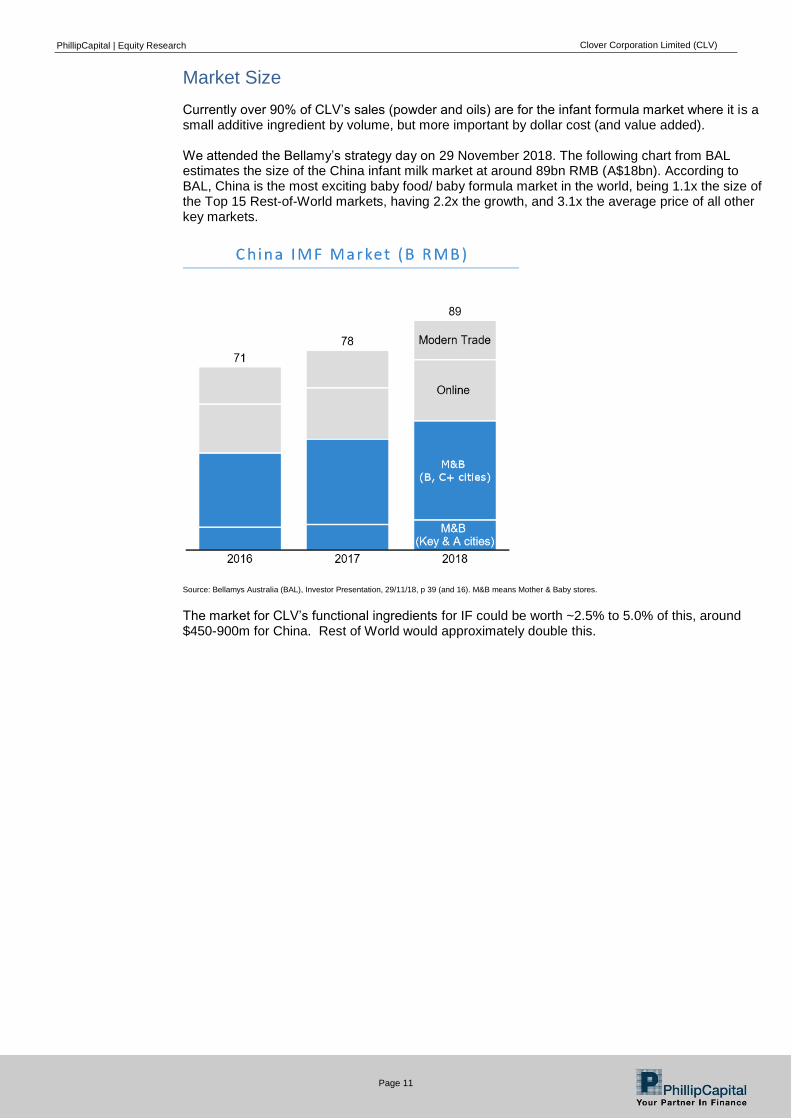
Currently over 90% of CLV’s sales (powder and oils) are for the infant formula market where it is a small additive ingredient by volume, but more important by dollar cost (and value added). We attended the Bellamy’s strategy day on 29 November 2018. The following chart from BAL estimates the size of the China infant milk market at around 89bn RMB (A$18bn). According to BAL, China is the most exciting baby food/ baby formula market in the world, being 1.1x the size of the Top 15 Rest-of-World markets, having 2.2x the growth, and 3.1x the average price of all other key markets.
Source: Bellamys Australia (BAL), Investor Presentation, 29/11/18, p 39 (and 16). M&B means Mother & Baby stores.
The market for CLV’s functional ingredients for IF could be worth ~2.5% to 5.0% of this, around $450-900m for China. Rest of World would approximately double this.
PhillipCapital | Equity Research Clover Corporation Limited (CLV)
Page 12
Management
Mr Rupert A Harrington - Non-Executive Director since 1/7/15; Appointed Chairman 21/9/17 Qualifications: BTech, MSc, CDipAF, MAICD. Mr Harrington is an experienced Director with a wealth of experience in business strategy and M & A. Mr. Harrington’s earlier career was in operational management in the UK and Australia. His career since 1987 has been in Private Equity where he has an excellent track record of delivering results for investors in sectors including: health, technology, industrial services and manufacturing. He is currently Chairman of Advent Partners, a pre-eminent mid-market Australian PE firm. Other Directorships: Non-Executive Director of Pro Pac Packaging (ASX: PPG) and Integral Diagnostics (ASX: IDX). Directorships of other listed companies in the last 3 years: Non-Executive Director of Bradken Limited (ASX: BKN) until its successful acquisition by Hitachi in 2017. Mr Peter J Davey – Appointed CEO and Executive Director 11/11/14 Qualifications: MBA, GradDip Bus., Dip.Art (Design), GAICD. Mr Davey has a track record of building businesses across a diverse range of industry sectors. He has held senior management positions within a number of manufacturing and distribution companies operating in competitive and diverse markets. Mr Davey has particular strengths in sales and marketing, and development and implementation of strategies for growth. Mr Davey was formerly Executive Manager AgriProdcuts and a director of Viterra Australia Limited, responsible for the AgriProducts division that traded in agricultural inputs, fertilizer, seed and wool. In earlier roles, Mr Davey headed the Sales and Marketing divisions of FMP Products and Hi Fert Pty Ltd. During his career, Mr Davey has had a particular focus on marketing based businesses operating in the Asia and Oceania regions. Other current listed company directorships: Nil Former listed company directorships in the past three years: Nil Mr Graeme A Billings – Appointed non-executive Director 14/5/13; Chair of the Audit Committee; Member of the Remuneration Committee; Member of the Nomination Committee Qualifications: BCom, FCA, MAICD Mr Billings has been a Chartered Accountant since 1980. Mr Billings was a partner at Coopers and Lybrand and then PricewaterhouseCoopers (PwC) for 24 years. Mr Billings was head of PwC’s Melbourne Assurance practice for a number of years as well as Global Leader of PwC’s Industrial Products and Manufacturing industry group. Mr Billings brings a range of financial, corporate governance, internal control, commercial and corporate transactional skills to the Company. Other current listed company directorships:
GUD Holdings Limited (ASX: GUD), appointed 2011
Korvest Limited (ASX: KOV), appointed 2013; Appointed Chairman 2014
Azure Healthcare (ASX: AZV), Chairman appointed 2015
DomaCom Ltd (ASX: DCL), appointed 2014
Former listed company directorships in the past three years: Nil
PhillipCapital | Equity Research Clover Corporation Limited (CLV)
Page 13
Mr Ian D Glasson - Non-Executive Director since 1/2/17; Member of the Audit Committee; Member of the Remuneration Committee; Member of the Nomination Committee Qualifications: BEng (Hons), MIE Aust, GAICD Mr Glasson is currently CEO of PGG Wrightson (NZX: PGW) based in Christchurch, New Zealand. He was formerly CEO of Gold Coin Group / Zuellig Agriculture which managed a portfolio of animal feed operations and farming ventures throughout South East Asia. Prior to that he was CEO for seven years of Sucrogen (formerly the sugar business of listed entity CSR and now owned by Wilmar) which generated revenues of nearly $2 billion and had extensive contacts across the local and international food and beverage sector and retail market. He has also had extensive agribusiness experience with Goodman Fielder and Gresham Rabo, as well as spending the first sixteen years of his career in the oil and gas sector with Esso. Other current company directorships: Ricegrowers Ltd (NSX: RGWB), appointed 2016 Former listed company directorships in the past three years: Nil Ms Cheryl L Hayman - Non-Executive Director since 9/7/08; Member of the Audit Committee; Member of the Remuneration Committee; Chair of the Nomination Committee Qualifications: B.Com, FAICD. Ms. Hayman has extensive consumer goods, packaged food and functional food industry experience including being former Marketing Director for the Baking Division of George Weston Foods (Australia/NZ) where she was largely responsible for leading the successful launch of the Hi-DHA Tip Top Up bread range. Ms. Hayman contributes significant strategic and marketing expertise derived from a corporate career which spanned local and global organisations. Her skills include developing marketing and business strategy across diverse industry segments, driving innovation, stimulating new product development, and business planning and branding across social media platforms. Today Cheryl is a professional Non-Executive Director across public, government and not-for-profit company directorships: Other current company directorships:
Non-Executive Director, HGL Ltd (ASX: HNG) appointed 2016
Non–Executive Director, AIFST appointed 2016
Non-Executive Director, Peer Support Australia appointed 2007.
Non-Executive Director, Chartered Accountants Australia & New Zealand appointed 2018
Former listed company directorships in the past three years: Nil Dr Merilyn J Sleigh - Non-Executive Director since 9/7/08; Member of the Audit Committee; Chair of the Remuneration Committee; Member of the Nomination Committee Qualifications: B.Sc, PhD, DipCorp Man, FTSE, FAICD. Dr Sleigh was trained as a Biochemist and was formerly CEO & Managing Director of EvoGenix Limited (ASX: EGX), an ASX-listed biotechnology company; Dean, Faculty of Life Sciences, University of NSW; Director, Research & Development at Peptech Limited (ASX: PTD) and Scientist & Senior Manager, CSIRO. She was until recently (retired June 2018) a director of Relationships Australia (NSW) and the Chair of its social enterprise RASE Pty Ltd, where she remains a director. She is also a member of the Council of the University of Technology Sydney. Dr Sleigh contributes extensive experience in strategic management of ASX-listed SMEs both as a director, and as a CEO. She also provides scientific research and development expertise relevant to Clover’s Innovations program and commercialisation of its products. Other current company directorships: Nil Former listed company directorships in the last three years:
Tyrian Diagnostics Limited (ASX: TDX), appointed 2008, resigned 2016.
PhillipCapital | Equity Research Clover Corporation Limited (CLV)
Page 14
Mr Paul Sherman – Company Secretary & CFO – Appointed 25/11/16 Qualifications: B.Bus, CA, MBA Mr Sherman is a Chartered Accountant with over 20 years’ experience in executive finance roles across a broad range of industries. Mr Peter R Robinson - Former Chairman & NED - Non-Executive Director since August 1997, Appointed Chairman 13/12/02 until his resignation on 21/9/17 Qualifications: B.Com. (UNSW), FAICD Mr Robinson has held both executive and non-executive directorships for a period of 30 years. Mr Robinson has over 30 years’ experience at general management and chief executive officer level. During this period Mr Robinson has had extensive experience in the pharmaceutical industry. Mr Robinson joined Washington H. Soul Pattinson and Company Limited (ASX: SOL) in 1978 and was appointed an Executive Director of SOL in 1984. Mr Robinson retired from SOL in March 31 2015. Former listed company directorships in the past three years:
Australian Pharmaceutical Industries Limited (API), appointed May 2000, retired January 2018.
TPI Enterprises Limited (TPE), appointed February 2013, retired May 2018
PhillipCapital | Equity Research Clover Corporation Limited (CLV)
Page 15
Clover Corporation (CLV) 1.800$
Profit & Loss Per share & Ratio data
Year end June FY18 FY19e FY20e FY21e Year end June FY18 FY19e FY20e FY21e
PhillipCapital | Equity Research Clover Corporation Limited (CLV)
Page 18
Recommendation Criteria
Investment View
PhillipCapital Investment View is based on an absolute 1-year total return equal to capital appreciation plus yield.
Buy Accumulate Hold Reduce Sell
>20% 10% – 20% 0% – 10% 0% to -10% >-10%
A Speculative recommendation is when a company has limited experience from which to derive a fundamental investment view.
Risk Rating
PhillipCapital has a four tier Risk Rating System consisting of: Very High, High, Medium and Low. The Risk Rating is a subjective rating based on: Management Track Record, Forecasting Risk, Industry Risk and Financial Risk including cash flow analysis.
Disclaimer/Disclosure
This publication has been prepared solely for the information of the particular person to whom it was supplied by Phillip Capital Limited (“PhillipCapital”) AFSL 246827.
Warning
This report is intended to provide general securities advice and does not purport to make any recommendation that any securities transaction is appropriate to your particular investment objectives, financial situation or particular needs. Prior to making any investment decision, you should assess, or seek advice from your adviser, on whether any relevant part of this report is appropriate to your financial circumstances and investment objectives.
PhillipCapital’s Research policy is to update research reports as and when the Research Analyst and Research Management deem appropriate, based on developments with the issuer, the sector, or the market that may have a material impact on the research views or opinions stated therein. The information contained in this report is drawn from sources believed to be reliable, but the accuracy and completeness of the information is not guaranteed, nor in providing it does PhillipCapital assume any liability. This information is given as of the date appearing on the report and PhillipCapital assumes no obligation to update the information or advise on further developments relating to these securities.
PhillipCapital and its associates within the meaning of the Corporations Act may hold securities in the companies referred to in this publication. This publication must not be distributed to retail investors outside of Australia.
Disclosure of Economic Interests
The views expressed in this research report accurately reflect the personal views of the author about the subject issuer and its securities. No part of the analyst's compensation was, is or will be directly or indirectly related to any recommendation or view expressed in this report.
The author of this report does hold an economic interest in the securities covered in this report or other securities issued by the subject issuer which may influence this report:
Disclosure of Corporate Involvement
PhillipCapital has not in the previous 24 months been involved in a publicly-announced transaction involving the payment of a fee to PhillipCapital by the corporate issuer described in this report. PhillipCapital may and may seek to do business with companies covered in its research.
PhillipCapital reports are available on Bloomberg, Reuters, FactSet, Capital IQ and www.phillipcapital.com.au
Important Notice
Copyright 2018. The Contents contained in this report are owned by Phillip Capital Limited ('PhillipCapital') and are protected by the Copyright Act 1968 and the copyright laws of other countries. The material contained in this report may not be copied, reproduced, republished, posted, transmitted or distributed in any way without prior written permission from PhillipCapital. Modification of the materials for any other purpose is a violation of the copyrights and other proprietary rights of PhillipCapital.
Regulatory Disclosure
This report was prepared solely by PhillipCapital. ASX did not prepare any part of the report and has not contributed in any way to its content. The role of ASX in relation to the preparation of the research reports is limited to funding the preparation by PhillipCapital, in accordance with the ASX Equity Research Scheme. ASX does not provide financial product advice. The views expressed in this research report may not necessarily reflect the views of ASX. To the maximum extent permitted by law, no representation, warranty or undertaking, express or implied, is made and no responsibility or liability is accepted by ASX as to the adequacy, accuracy, completeness or reasonableness of the research reports.


![[CLV] Sales Outline](https://static.documents.pub/doc/80x56/577cb4701a28aba7118c7998/clv-sales-outline.jpg)


