CLR Reviewed by: Peer Reviewed by: CLR Review Coordinator Jorge García-García Surajit Goswami, IEGEC Consultants Luis Álvaro Sánchez, IEGEC Consultant Mark Sundberg, Manager IEG Economic Management and Country Program, IEGEC CLR Review Independent Evaluation Group 2. Ratings CLR Rating IEG Rating Development Outcome: Moderately Satisfactory Moderately Satisfactory WBG Performance: Good Good 3. Executive Summary i. Rapid growth until 2012 led to a rapid decline in poverty, with the poverty headcount ratio reaching 11.3 percent in 2014. The fast pace of growth slowed down since 2013 thereby reducing the rate of decline in poverty. In addition to 29 million people below the poverty line, above it there are 65 million that are vulnerable. The government diagnosed the underlying causes of poverty and other problems in its development plan for 2009-2014. The plan formulated the development priorities as a set of 13 priority areas which the government considered “capable of answering a number of challenges faced by the nation and state in the future”. The World Bank Group (WBG) strategy addressed some of these challenges in four focus areas: (a) I - Pro-Growth Promoting Prosperity; (b) II - Pro-Jobs Enhancing Skills and Technology and Improving Social Protection; (c) III Pro-Poor, Promoting Communities, Protecting the Vulnerable and Improving Health Outcomes; and (d) IV - Pro- Green Ensuring Sustainable Development and Improving Disaster Resilience. ii. The program achieved or mostly achieved eight of its 15 objectives. The most significant achievements were in focus areas II (skills, technology and social protection) and III (community development, protecting the vulnerable, and improving health outcomes). Focus area IV (sustainable development and resilience to disaster) also presents substantial achievements in terms of processes that must be carried out to advance in sustainable development and resilience to disaster, but a final verdict on the results of that effort must wait longer, to be able to observe results. Focus area I (Pro- Growth) absorbed more than one third of the Bank’s financial support to Indonesia and most of its results are poor. Six of its seven objectives were partially achieved (connectivity, competitiveness, strengthen public sector, local government, and macroeconomic and fiscal management) or not achieved (infrastructure)). Good results are found in the financial sector and in logistic competence and border management (customs). iii. Overall WBG performance was good, both in designing and implementing the program. On design, the WBG selected objectives that supported the government’s development program, and it chose a mix and level of interventions appropriate to deliver the program and achieve the objectives. The program, though, could have been more selective given its interim nature. The results framework had a clear logic of interventions but fell short in the quality of the indicators to measure achievement; the indicators measured country outcomes rather than program outcomes, processes completed, and 1. CAS/CPS Data + Country: Indonesia CAS/CPS Year: FY2013-FY2015 CAS/CPS Period: FY2013-FY2015 CLR Period: FY13-FY15 Date of this review: November 18, 2015
Mark Sundberg, Manager IEG Economic Management and Country Program, IEGEC
CLR Review Independent Evaluation Group
2. Ratings
CLR Rating IEG Rating
Development Outcome: Moderately Satisfactory Moderately Satisfactory
WBG Performance: Good Good
3. Executive Summary
i. Rapid growth until 2012 led to a rapid decline in poverty, with the poverty headcount ratio reaching 11.3 percent in 2014. The fast pace of growth slowed down since 2013 thereby reducing the rate of decline in poverty. In addition to 29 million people below the poverty line, above it there are 65 million that are vulnerable. The government diagnosed the underlying causes of poverty and other problems in its development plan for 2009-2014. The plan formulated the development priorities as a set of 13 priority areas which the government considered “capable of answering a number of challenges faced by the nation and state in the future”. The World Bank Group (WBG) strategy addressed some of these challenges in four focus areas: (a) I - Pro-Growth Promoting Prosperity; (b) II - Pro-Jobs Enhancing Skills and Technology and Improving Social Protection; (c) III Pro-Poor, Promoting Communities, Protecting the Vulnerable and Improving Health Outcomes; and (d) IV - Pro-Green Ensuring Sustainable Development and Improving Disaster Resilience.
ii. The program achieved or mostly achieved eight of its 15 objectives. The most significant achievements were in focus areas II (skills, technology and social protection) and III (community development, protecting the vulnerable, and improving health outcomes). Focus area IV (sustainable development and resilience to disaster) also presents substantial achievements in terms of processes that must be carried out to advance in sustainable development and resilience to disaster, but a final verdict on the results of that effort must wait longer, to be able to observe results. Focus area I (Pro-Growth) absorbed more than one third of the Bank’s financial support to Indonesia and most of its results are poor. Six of its seven objectives were partially achieved (connectivity, competitiveness, strengthen public sector, local government, and macroeconomic and fiscal management) or not achieved (infrastructure)). Good results are found in the financial sector and in logistic competence and border management (customs).
iii. Overall WBG performance was good, both in designing and implementing the program. Ondesign, the WBG selected objectives that supported the government’s development program, and it chose a mix and level of interventions appropriate to deliver the program and achieve the objectives. The program, though, could have been more selective given its interim nature. The results framework had a clear logic of interventions but fell short in the quality of the indicators to measure achievement; the indicators measured country outcomes rather than program outcomes, processes completed, and
CLR Period: FY13-FY15 Date of this review: November 18, 2015
2
CLR Review Independent Evaluation Group
activities carried out. That weakness makes it difficult to assess the contribution of the program to the country’s development outcomes, and to learn what works, what does not work and why. On implementation, the WBG responded to changing circumstances and priorities, as indicated by its $985 million lending in FY15, the lowest in the previous five years, a result of the outgoing government’s decision to scale down lending before a new government took over. The Bank paid attention to program implementation, as attested by its year-long country portfolio performance review in FY14, but not enough to prevent delays in projects in infrastructure. On safeguards, the Bank could improve its performance, and on fiduciary issues the CLR reports that the Bank supported measures to strengthen accountability and build fiduciary capacity, but does not report about the results from that effort.
iv. The review concurs with the findings and lessons in the CLR, rephrases them, and presentssome of its own. First, good technical design alone does not ensure the success of a project or a program. Political economy aspects can make or break a well-designed project or program. Therefore, it is necessary to engage with counterparts that have the mandate to commit and the institutional capacity to deliver a project or a program. Second, WBG efforts to enhance the government’s ability to implement a project are likely to increase the program’s chance of success. This is particularly true for programs heavy in infrastructure and institution building. Shortcomings in project readiness – particularly in terms of advanced procurement, land acquisition, safeguard requirements, sponsor commitment, and ownership/commitment—delayed project execution, leading to meager results or outright failure. Third, without proper measurement tools the Bank cannot track and assess well the impact of its long-term involvement at the regional level. Building on early pilot interventions has proved effective in providing support to regions and communities through a CDD approach; as the engagement matures it is convenient to develop measures of aggregate impact at the local level. Fourth, the experience of the CPS, especially Focus Area I, shows that pillars, areas of engagement or objectives that bring together disparate issues reflect a lack of clear priorities and selectivity; once again, that experience shows that selectivity is important, more so when the Bank engages with an interim program. The Bank has engaged in Indonesia for decades and political change in the country may require a new, and selective, basis for Bank engagement in areas it can have impact. The findings and lessons suggest that the next CPF will have to be more selective in its design, scope and results. While the needs are great and the Government’s development agenda is necessarily broad, the WBG must have fewer areas of engagements to bring scale and impact to bear on the program.
4. Strategic Focus
Relevance of the WBG Strategy:
1. Congruence with Country Context and Country Program. Indonesia’s grew at 6.5 and 6.1 percent in 2011 and 2012 but this pace has declined, growing at 5.6 percent in 2013, at 5.0 percent in 2014, and expected to grow at about 4-4.5 percent in 2015, reflecting lower commodity prices and tighter external financing. Despite its substantial gains in poverty reduction, Indonesia poverty headcount ratio at national poverty lines reached 11.3 percent in 2014; its pace of decline is likely to slow down as the economy grows less rapidly. Also, another 65 million people above the poverty line are vulnerable. These two facts make it necessary to grow fast and have programs that cushion these groups from shocks that might affect their welfare. The government diagnosed the underlying causes of poverty and other problems affecting the country in its development plan for 2009-2014. The plan formulated the development priorities as a set of 13 priority areas for which it defined a list of priority programs which the government considered “capable of answering a number of challenges faced by the nation and state in the future” (See http://www.indonesia.go.id/en/indonesia-glance/vision-mission-and-strategy). The priorities were education, health, poverty reduction, employment creation, basic infrastructure development, food security, resistance and energy independence, good governance, enforcement pillars of democracy, law enforcement corruption, inclusive and equitable development, environment sector, and cultural development. The World Bank Group (WBG) strategy addressed the
key challenges facing the country, and it was aligned with the country’s own development strategy and program. The strategy consisted of: (a) Focus Area I Pro-Growth Promoting Prosperity, covering issues of connectivity, competitiveness, financial sector, infrastructure, local government, macroeconomic and fiscal management, and strengthening the public sector; (b) Focus Area II Pro-Jobs Enhancing Skills and Technology and Improving Social Protection, covering issues of education and social insurance; (c) Focus Area III Pro-Poor, Promoting Communities, Protecting the Vulnerable and Improving Health Outcomes, covering issues of poverty targeting, community development, food security and rural development, and health outcomes; and (d) Focus Area IV, Pro-Green Ensuring Sustainable Development and Improving Disaster Resilience, covering issues of environment, natural resources and climate change, and disaster risk management. Also, the strategy covered issues related to the twin goals of shared prosperity and reducing poverty.
2. Relevance of Design. The WBG set a wide net for its program. It adopted a broad agenda to support the government’s plan and to be ready to drop some of the areas selected in the CPS and respond to the priorities of the new government that would start in 2014 The program had a large number of interventions in lending, economic and sector work, policy notes, advisory services and technical assistance. Despite the program’s interim nature, the interventions could help achieve the CPS objectives and contribute to the country’s development. In general, the areas of engagement and the instruments were appropriate, both on lending and AAA; it is notable the large amount of TA, with a program six times larger in number of activities than the ESW. Focus Area I covered seven objectives whose rationale for being together is unclear. Focus Area IV deals with environmental aspects and climate change, and receives the largest amount of support from the donor community relative to other areas of engagement. That support raises two questions: (a) is the environment program demand-driven (by Indonesia) or supply-driven (by the international community)?; and (b) are environmental priorities set according to the largest costs to the economy (e.g., problems in the large metropolitan area of Jakarta –JABODETABEKJUR-1 versus forest depletion)? The strategy could have informed on the trade-offs it faced for including and excluding activities from the program. IFC’s program had substantial relevance, with emphasis on the Pro-Growth – Promoting Prosperity Focus Area, and aimed at addressing issues of connectivity, competitiveness, financial sector, and infrastructure. Overall, the design had substantial relevance.
Selectivity
3. The WBG chose a program that could have been more selective, especially for a three-year long program that was considered to be an interim one. The program was based on adequate country diagnostic and on the WBG’s knowledge of the country, fruit of its long interaction with the government and the presence of a strong local office. The program also reflected the WBG strengths in the areas it selected to work on, its past experience and its comparative advantage. It is possible that these strengths led the Bank to include a large number of activities in Focus Area I (Pro-Growth, Promoting Prosperity) but where the synergies among them are not clear. In the same manner, Focus Area IV (Pro-Green – Environment) deals with relevant issues but it should be asked why it overlooked the problems caused by the externalities in the metropolitan area of Jakarta. Throughout its engagement with the country the Bank has sought to build capacity and institutions, and this CPS sought to do so in several of the areas covered, such as local government, environment, poverty programs, social insurance, and public financial management, among others. This larger capacity should permit Indonesia sustain the future benefits of the program without foreign aid.
1 Including DKI Jakarta, covers areas in Banten and West Java, namely Depok, Bogor Regency, Bogor, Tangerang
Regency, South Tangerang, Tangerang, Bekasi, Bekasi Regency, and 4 kecamatan in Cianjur Regency not including
Cianjur city.
4
CLR Review Independent Evaluation Group
Alignment
4. The WBG programs in Indonesia have been aligned with the twin goals (reducing poverty and sharing prosperity). For some time, Indonesian governments have pursued the goals of stability, growth and equity, and WBG programs have reflected that concern. Focus areas II and III represent clear interventions to support the twin goals but also programs like connectivity, competitiveness and infrastructure in Focus Area III and disaster risk management in Focus Area IV support these goals.
5. Development Outcome
Overview of Achievement by Objective:
Focus Area I: Pro-Growth – Promoting Prosperity
5. Objective #1 [Connectivity]. Enhance Indonesia’s logistics performance, improve access to broadband and reduce costs for exporting and importing. Support for this objective consisted of two Connectivity DPLs, IFC support to PROTELINDO, a telecom operator, a loan to PT Jakarta Container Terminal, economic and sector work (ESW), policy notes and other analytical and advisory activities. Three indicators would measure the achievement of the objective:
Indonesia’s ranking in the Logistics Performance Index (LPI). Indonesia’s ranking rose to 53(target was less than 59, its rank in 2012), a gain that was accompanied by an improved score.The selected index represents international connectivity but not domestic connectivity. Ininternational connectivity some things improved and others deteriorated but on balance thesystem got better, a result validated by IEG’s review of the ICR for the two DPLs. IEG’s reviewof the ICR for the two DPLs also concluded that their effect on improving interislandconnectivity was modest. The CLR notes that “overall outcomes were short of expectations andIndonesia’s logistics sector continues to perform poorly compared to neighboring countries”. Onbalance, connectivity improved but less than implied by its rating in the CLR [Partiallyachieved.]
Access to broadband services. This is measured by the share of population with access tothem. The CLR reports that 34.5 percent of the population has access to broadbandconnection, surpassing the target of 30 percent for 2015; data from ITU WorldTelecommunication/ICT Indicators database show that 29.1 percent of households andindividuals had internet access at home in 2014, practically reaching the target for 2015.Improved access to broadband obeys to private investments in infrastructure and services byIndonesia’s telecommunications service providers. The World Bank provided advice to thegovernment on the enabling regulatory framework, in particular on regulations that directlyimpact access to broadband. Although this review agrees with the CLR that the indicator wasachieved, it is inappropriate to assess the impact of the WBG assistance in this area using thatindicator. [Achieved]
Cost and time to export and import. This uses the data reported in the Doing Business Surveyto determine achievement of results. The CLR reports this was Not Achieved.
The review concludes the objective was Partially Achieved.
6. Objective #2 [Competitiveness]. Improve the policy framework, regulatory environment, and coordinated interventions for productivity, competition and innovation. Support for this objective consisted of two Connectivity DPLs ($400 million plus co-financing of $1 billion by Asian Development Bank), an IFC financing and syndication for $540 million to Panca Amara Utama, a private limited company planning to set up a 2,000 tons per day ammonia greenfield production plant,
5
CLR Review Independent Evaluation Group
and analytical and advisory services on logistics and trade facilitation. Two indicators would measure the achievement of the objective:
Logistic competence and border management. The indicators selected were Indonesia’s scorein logistics competence and border management from the Logistics Performance Index (LPI).Both indicators exceeded the targets, and as a result Indonesia jumped 20 and 21 places in therankings for customs and logistics competence, to 55 and 41. These indicators are subsumedin the LPI indicator, already used to measure performance in objective #1. Including a subset ofthe LPI indicator in this objective implies to count the same achievement twice, an incorrect wayto measure achievement since the benefit accrues only once. To avoid counting the samebenefit twice, the review does not rate this achievement [Not rated].
Regulatory environment. Improvements in the regulatory environment would be measured bythe number of days required to start a company and to enforce a contract. The number of daysto start a company exceeds 50 days, missing the 30-day target, and the number of days toenforce a contract fell to 471. [Partially Achieved]
The review concludes the objective was Partially Achieved.
7. Objective #3 [Financial Sector]. Maintain financial sector stability, deepen financial markets, and enhance access. One DPL, several operations of IFC (Investment in BTPN and Bank Danamon to support SME lending, pilot with Holcim Indonesia -a cement company- to extend housing micro-loans, $70 million in the $250 million Indonesian Infrastructure Financing Fund) and diverse forms of analytical and advisory services supported this objective. The assistance sought to achieve results in two areas:
Stability and deepening of the financial sector. The sector has sound key financial ratios: non-performing loans at 2.3%, capital-adequacy ratio of 20 percent, stable net interest margin, anda loan to deposit ratio of 85%, above its target value of 80 percent. The CLR does notdistinguish between overall performance of the economy and how much the WBG programcontributed to such performance [Achieved].
Larger capital market and access to services. The assistance expected that the capital marketswould be larger and that microenterprises, SMEs and underserved populations would havehigher access to financial services at the end of the program. In this area two out of threeindicators were met: the percentage of banking loans to SMEs was above 50 percent; KUR(Kredit Usaha Rakyat)-a credit program for SMEs had provided partial credit guarantees tomore than 12 million borrowers and had disbursed about IDR 180 trillion (about $14 billion),almost 3 times the value of 2011; non-performing loans represented 3.3 percent of total loans;the CLR does not inform on the percentage of households with access to bank accounts, butthe Indonesia team informed IEG that 36 percent of individuals had access to a bank account in2014, up from 20 percent in 2011. The CLR does not distinguish between overall results for theeconomy and how much the WBG program contributed to such results [Mostly Achieved].
The review concludes the objective was Mostly Achieved.
8. Objective # 4 [Infrastructure]. Increase the quantity and efficiency of national and subnational government spending on infrastructure, and increase private investment in infrastructure. Support for this objective consisted of three loans for power and roads, an infrastructure guarantee fund, IFC investments in renewable power, water/sanitation, ports, shipping and logistics, telecom, oil and gas, a public expenditure review (PER) on roads and railways, ESW on policies for infrastructure, and advisory services on different areas of infrastructure. The assistance sought to achieve results in three areas:
6
CLR Review Independent Evaluation Group
Roads: cumulative maintenance and development by the Directorate General of Highways. Thetarget was to increase the number of kilometers maintained and developed over the 2011-2015period by 25 percent per year (above 100 percent for the period); by 2014, the kilometers ofroads maintained and developed had increased by 44 percent and 57 percent over the entireperiod, falling short of the target [Partially Achieved].
Electricity: better electricity service judged by duration of interruptions in power supply. Thetarget was to reduce power supply interruptions per customer/per year from 5 to 2 hours;interruptions increased to 5.8 (2013 data). [Not Achieved]; and
Private investment: more private investment in infrastructure through the public-privatepartnership (PPP) framework. On investment in infrastructure, no PPP has yet succeededdespite having established a Viability Gap Funding to boost such investment [Not Achieved].
The review concludes that the objective was Not Achieved.
9. Objective#5 [Local Government]. Improved fiduciary, social and environmental management and technical performance of selected local governments in the delivery of basic services, and enhance the capacity of local institutions to monitor and assess subnational public expenditures. Support for this objective consisted of two loans (Local Government and Decentralization Program, and Urban Sector Development and Reform), a report on urban agglomeration and other on Sulawesi development, a trust fund for Public Expenditure Analysis and Capacity Harmonization (PEACH), and IFC advisory services for doing business reforms at the sub-national level. The assistance sought to:
Improve fiduciary, social and environmental management (Implement and complete PEACH insix provinces). PEACH had the general objective of enhancing capacity at the level of sub-national governments, central government, civil society and media organizations, and centersof excellence in order to achieve the following goals: deliver better sub-national budgets,monitor the sub-national government, improve advocacy on PFM issues, analyze publicexpenditure, and enhance the recipient’s capacity to design and deliver capacity building andtechnical assistance programs. From the perspective of delivering the program, PEACH wasimplemented and completed in all six targeted provinces. On its effect, the CLR reports that“the provinces benefited from the program and made improvements in the province’s fiduciary,social and environmental management as well as technical performance in the delivery of basicservices”. The CLR does not provide information to support this assertion. Subsequentinformation from the country management unit indicates that provinces considered as goodperformers under the Local Government and Decentralization Program received technicalassistance in the fiduciary, safeguards and technical areas, and that their infrastructure projectsfollowed appropriate fiduciary procedures. That information also indicates that the GovernmentInternal Auditor received technical training to improve its capacity to verify in the field thedelivery of infrastructure. The program will not be expanded because the donor supporting theprogram decided to implement it directly. [Partially achieved]
Enhancing capacity. Enhance the capacity of local institutions to analyze and monitor publicfinancial management and demand better performance in these areas. The CLR reports thatthe Local Government and Decentralization Project supported improving the quality of publicspending on local infrastructure, and that local governments participating in it financed higherrates of investments from own sources than non-participating governments. The CLR does notprovide information to support its assertion about better quality of public expenditure.Subsequent information from the country management unit indicates that training on publicfinancial management for sub-national governments has expanded under a program financedwith trust funds and managed by the University of Gadjah Mada. The information providedsuggests that the training helped improve the quality of audits for subnational governmentsinvolved in PEACH: of 24 audits reviewed by the Supreme Audit Agency, 17 of them improved.[Partially achieved]
7
CLR Review Independent Evaluation Group
The review concludes the objective was Partially Achieved.
10. Objective #6. [Macroeconomic and Fiscal Management] Enhanced Government ability tomeet its financing needs and maintain critical public expenditures, and use monitoring and evaluation to inform budget allocation. Support for this objective consisted of three loans [two DPLs for tax administration, social and investment –INSTANSI, $700 million total-, and one DPL-DDO for economic resilience, investment and social assistance –PERISAI, $2 billion) and several analytical and advisory activities, one of them a Development Policy Review. The assistance sought to achieve results in two areas:
Government’s access to markets and its level of investment. The government maintained itsaccess to financial markets, as net securities issuance exceeded 100 percent of the target basefor 2012 and 2013 and was on track to reach it in 2014 (CLR does not provide information on2014). On capital expenditures, subsequent information from the country management unitshows that President Widodo’s Government decision to reduce US$2.8 billion in fuel subsidiespermitted to allocate more resources to capital expenditures. As a result, the share of capitalexpenditures in the central government’s expenditure (excluding transfers to regions) increasedfrom about 14 to 21 percent between 2012 and 2015. [Mostly achieved]
Monitoring and evaluation and its role in budget allocations. By mid-2013 more than 70 lineministries and agencies had reported their progress in bureaucratic reform through the BRISAsystem, a web-based bureaucratic reform monitoring and evaluation system launched in 2012,but the system became inactive at the end of 2013. The CLR does not report if monitoring andevaluation informed budget allocations. Lacking that information the review rates the result asNot Achieved.
The review concludes that two of the four results indicators were achieved, and rates the objective Partially Achieved.
11. Objective #7. Strengthen the public sector by enhancing public financial management.Support for this objective consisted of four loans [the INSTANSI DPLs supporting objective 6, one for a Management and Revenue Administration Project and other for a Scholarships Program for Strengthening Reforming Institutions] and the donor trust fund for public financial management. The support sought to:
Strengthen a multi-year perspective in financial planning, expenditure policy and budgeting.Achievement in this area would be measured by increasing the note for PI-12, the value of thePEFA indicator that measures such perspective, from C+ to at least B+ in 2015. There was noPEFA assessment and the CLR notes that the improvement observed is unlikely to have led tosuch rating. Not achieved.
Improving the quality of annual financial statements. Achievement in this area would bemeasured by having at least 85% of Ministries and Agencies receiving an unqualified opinionon their financial statements for FY2013. Only 75 percent of them received unqualified opinionfor their financial statements. Partially achieved.
Information system. Put in place a new financial management information system in all 177Treasury local offices to improve the quality and timeliness of data available. The automatedbudget and treasury system was completed in 2013 and rolled out to all 222 treasury offices. ByFebruary 2015 the system managed all the financial transactions. Achieved.
The review concludes the objective was Partially Achieved.
12. Summarizing, seven DPLs (2 connectivity, 2 INSTANSI, 2 financial sector, and one PERISAI)supported Focus Area I. The seven loans amounted to $3.7 billion, a sum equivalent to 36 percent of
8
CLR Review Independent Evaluation Group
the total commitments for active projects during the period, and to 98 percent of the new loans granted in FY13-FY15. Focus Area I absorbed the largest amount of financial resources of the program and has few good results to show: improvements in customs and logistics competence which result in better international connectivity, increased stability of the financial sector, solidity of its financial indicators, and improved access of SMES and the underserved to financial services. Because six of the seven objectives have ratings of not achieved or partially achieved. IEG rates the outcome under Focus Area I as Unsatisfactory.
Focus Area II – Enhancing Skills and Technology and Improving Social Protection (Pro-Jobs in CLR)
13. Objective #8. [Education] Improve the education quality and performance of teachers,and improve the human resource capacity in R&D. Many interventions supported this objective. Among them, the review notes four investment loans (early childhood, teacher upgrading, higher education, and research and innovation in science and technology), several reports on teacher reform, public expenditure, school grants, opportunities for young people, impact evaluations of teacher certification and the early childhood project, and TA on skills development. IFC gave advisory service to farmers for improving their yields. The assistance sought results in two areas:
Quality of primary and secondary school teachers and their performance. Increase the numberof teachers in basic education that meet academic qualifications mandated by the Teacher Law(teachers holding a S1 degree or more). For primary school teachers 1.378 million of them, 82percent of the total, hold an S1 degree in 2015, meeting the target. For junior secondary schoolteachers, 578,023 or 92 percent of them hold an S1 degree in 2015, falling short of the target of98 percent. The CPS did not set an indicator to measure teacher performance and the CLRdoes not report on it [Mostly Achieved].
Quality of researchers. Increase to 17 percent the share of researchers with Masters (S2) andPhD (S3) degrees working in public research institutes. By 2015, about 3,100 of theseresearchers, 21 percent of the total, had an S2 or S3 degree. [Achieved]
The review concludes the objective was Mostly Achieved.
14. Objective #9. [Social Insurance] Conversion of the existing social insuranceadministrators into not-for-profit institutions and expand coverage and contributions. The interventions supporting this objective consisted of advisory services to several government agencies (among others, Planning Agency, Ministries of Finance and Labor, and national social security council), policy notes, modelling of reforms impact, and several background papers on retirement age, coverage of the poor, and use of surplus in administrators and social insurance funds. This assistance sought to help convert JAMSOSTEK (Social Security System) into a not-for profit institution that can administer pensions and old age savings program and to expand membership. A law converted JAMSOSTEK from a profit-based state-owned company to a not-for-profit entity reporting to the President. This first indicator was achieved. The CLR reports progress in enrolling informal sector workers and in expanding the number of workers paid for by the government, but does not provide numbers on the extent of such progress. The social security health program covered 133.4 million citizens in December 31, 2014, consisting of civil servants, the poor, self-employed, and formal and informal sector workers. This second indicator was achieved.
The review concludes the objective was Achieved.
15. IEG rates the outcome under Focus Area II as Satisfactory. The assistance achieved theobjectives sought in the quality of teachers and in social insurance. IEG note that information on teacher performance was not provided.
9
CLR Review Independent Evaluation Group
Focus Area III – Promoting Communities, Protecting the Vulnerable and Improving Health Outcomes (Pro Poor in CLR)
16. Objective # 10 [Poverty Targeting]. Enhanced capacity for detecting and responding toshocks that threaten vulnerable households, and increase the number of poverty programs using the national registry of poor and vulnerable households. The interventions supporting this objective consisted of three loans (two DPLs for tax administration, social and investment, one loan for early childhood education project, and one loan for statistical capacity building and the development of statistics), an IFC investment into microfinance institutions, and several pieces of analytical and advisory services covering, among others, monitoring shocks to households, response to shocks, integrating poverty reduction programs, and incidence of benefits of households. The assistance expected to achieve three results. First, to develop and put in place a national system to monitor shocks (Achieved). Second, to have more management units of poverty programs identify beneficiaries using the national registry of poor and vulnerable households; by 2015, at least 4 units were using the program (Achieved). Third, increase poor households’ participation in early childhood development programs. This goal was to be achieved by reaching a 72 percent gross enrollment rate for children aged 4-6. There is no information for that age group but for children aged 3-6, whose enrollment rate was 66 percent; this number suggests that the goal for 4-6-year-old children may have been met because their enrollment rate is higher than that for children aged 3-6. (Mostly Achieved).
The review concludes the objective was Mostly Achieved.
17. Objective #11 [Community Development]. Improved local-level governance, greaterparticipation by women, increased access to health and education, and participation in early childhood education and development. The support for this objective consisted of (a) three loans for rural development (two national programs for community empowerment –PNPM Generasi and Rural- and one for community development in Sulawesi), (b) several trust funds (Multidonor, Japan, for Consolidating Peaceful Development in Aceh), (c) an IFC investment in the microfinance Mitra Bisnis Keluarga Ventura, (d) several studies that ranged from simulating the economic impact of PNPM Rural, village infrastructure census, and (e) technical assistance to Aceh local government. The expected results covered three areas:
Local governance. Four indicators measured achievement of results: number of communitymembers participating in PNPM (not reported), share of beneficiaries claiming that PNPMinfrastructure programs met their needs (95%), share of poorest communities involved inplanning and decision-making meetings (50%), share of villages providing feedback on healthand decision services (99%). The numbers in parenthesis reflect the targets of which all but the
first were achieved [Mostly achieved] Participation of women. Forty-five percent of women participated in planning/decision making
meetings (goal 50%) and 32 percent of women were members of community oversight teams(goal 30%). [Mostly Achieved]
Maternal and child health. The indicators measured the percentage of women receivingprenatal care visits and attending nutrition counseling sessions, percentage of children under 5weighted monthly, percentage of caregivers of children under 2 receiving counseling sessionson nutrition, and junior secondary enrollment rate. Three out of five indicators were met fully ormostly: surpassed for women’s prenatal care visits and junior enrollment rates, mostly met forweighing children. The remaining indicators were not met. [Partially Achieved].
The review concludes the objective was Mostly Achieved.
18. Objective #12 [Food security and rural development]. Increase access by smallholders toclient and market-oriented extension and marketing services, and enhance water security for
10
CLR Review Independent Evaluation Group
irrigation. The support for this objective consisted of four investment projects, IFC investments in agribusiness companies and two technical assistance programs, one on food security for the Ministry of Agriculture and the other for irrigation management modernization for the Ministry of Public Works. The expected results covered three areas:
Access to technology. It was expected that at least 10 percent of farmers would have access totechnology and market information through ICT. This goal was exceeded since 30% of targetedgroups have completed or are in the process of completing training to use technology andmarket information through ICT. [Achieved]
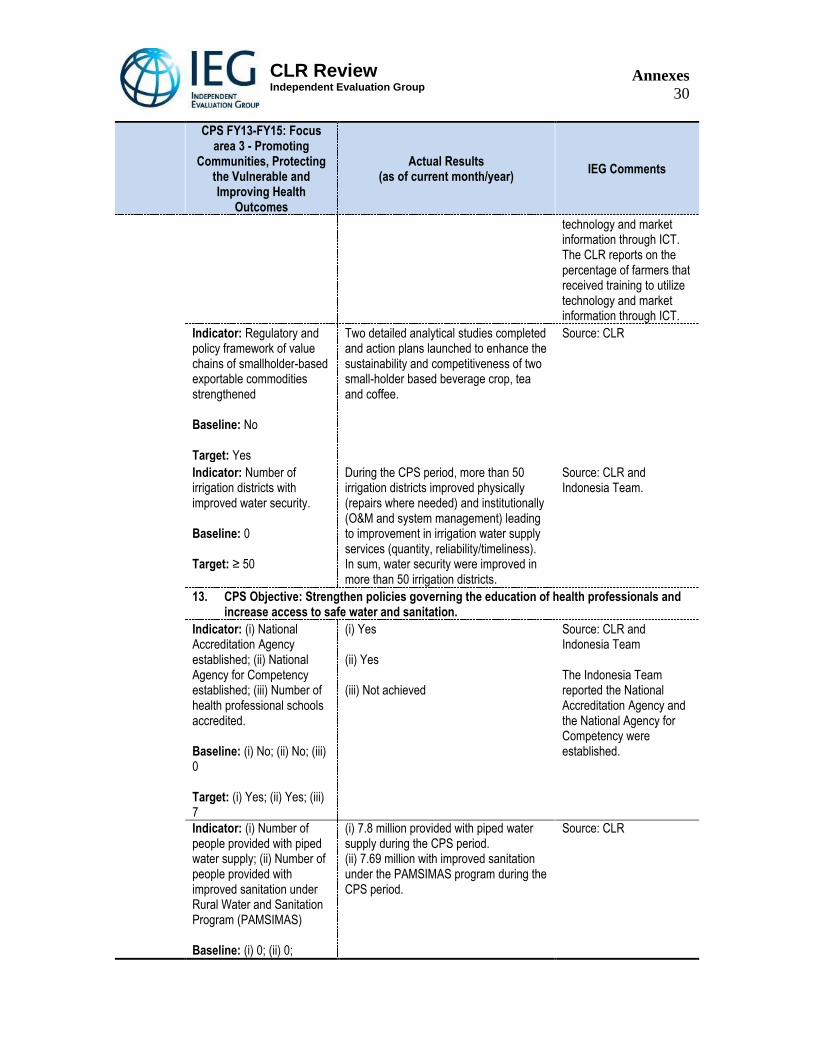
Regulation of value chains. It was expected that the regulatory and policy framework of valuechains of small-holder based exportable commodities would be strengthened. The CLR reportsthat two detailed analytical studies were completed and action plans launched to enhance thesustainability and competitiveness of tea and coffee, two small-holder based beverage crops.The indicator selected does not guarantee that the regulatory and policy framework has beenstrengthened. [Partially achieved].
Improved water security of irrigation districts. It was expected that at least 50 irrigation districtswould improve their physical and institutional conditions, with repairs as needed and operationand maintenance and system management in place. The target number was met and, as aresult, the quality of water supply services (quantity, reliability, and timeliness) improved.[Achieved].
The review concludes the objective was Mostly Achieved.
19. Objective #13 [Health Outcomes]. Strengthen policies governing the education of healthprofessionals and increase access to safe water and sanitation. The support for this objective consisted of four loans, a GPOBA grant for water supply in Jakarta and Surabaya, IFC financing for a private sector operator, and diverse analytical and advisory activities touching on universal health coverage, HIV/AIDS, sanitation and marketing, wastewater management, water and sanitation financing, water policy advice to Surabaya, TA to Lampung water project, and IFC advisory services for structuring water sector PPP projects. The expected results covered two areas:
Quality of health professionals. The results had to do with establishing national agencies foraccreditation and competency and for accrediting seven professional schools. The CLR does
not report on them. [Not Achieved]. Access to piped water and sanitation. The expected results were to provide piped water supply
to 7 million people (actual, 7.8 million) and 3.4 million people with improved sanitation under therural water and sanitation program (actual, 7.7 million people). [Achieved]
The review concludes the objective was Partially Achieved.
20. IEG rates the outcome under Focus Area III as Satisfactory. The assistance achieved ormostly achieved the objectives sought in protecting from shocks vulnerable groups, improving local governance and women participation in local activities, improving farmers’ access to technology and market information, and improving access to piped water and sanitation. The review notes that the Bank has been working successfully with communities for some time; therefore, it would be convenient to develop results indicators to assess the full impact of that work, which now appears successful but dispersed.
Focus Area IV – Ensuring Sustainable Development and Improving Disaster Resilience
21. Objective #14 [Environment, Natural Resources and Climate Change]. Implementing ofIndonesia’s Reducing Emissions from Deforestation and Forest Degradation (REDD+) strategy and improving protection for coral and marine resources. More than any other objective, this objective received the largest support in terms of number of instruments: (a) three loans (solid waste
11
CLR Review Independent Evaluation Group
management in regional metropolitan cities, landfill gas recovery, coral reef rehabilitation-plus GEF grant), (b) trust funds and grants (multi-donor for reducing emissions from deforestation and forest degradation-REDD-, forest investment program –FIP-, Japan social development fund, Forest Carbon Partnership Facility-FCPC-, the FIP dedicated grant management for indigenous peoples ); (c) analytical activities (wealth accounting and valuation of ecosystems –WAVES-, mapping and customary land rights, policy dialogue on green growth, forest and non-forest land, fisheries management and coral/marine ecosystem values); and (d) IFC project on Sustainable Forestry, geothermal investment, select green buildings, and advisory services on clean energy development, sustainable energy finance, and sustainable forestry/agribusiness. The three indicators selected to measure achievement of objective cannot tell if the objective was achieved. The indicators measure processes, an important step to achieve environmental outcomes but cannot measure the impact of Bank activities in the country. For the sake of this effort and of the WBG’s credibility, Bank interventions and its support must be backed with information that can show such effort produces results. The three indicators selected refer to:
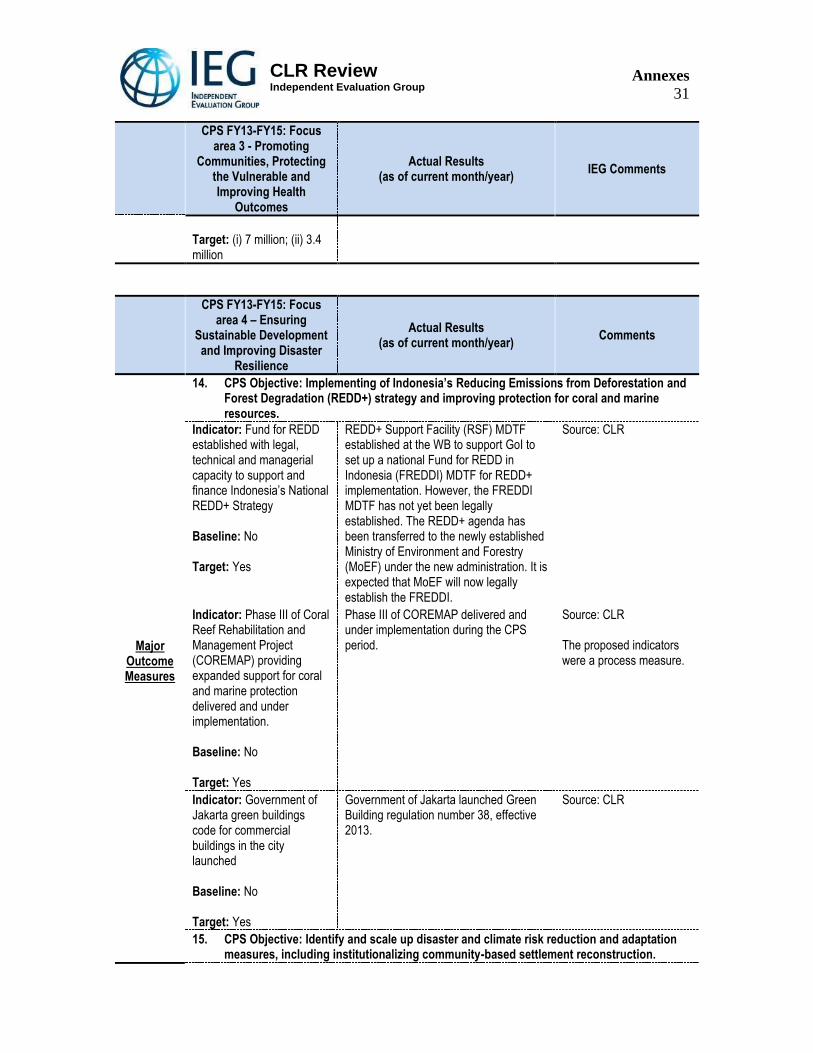
Fund for Reducing Emissions and Forest Degradation. The result was to establish the fund andhave legal, technical and managerial capacity to support Indonesia’s REDD+ strategy. A trustfund was established at the Bank to support the REDD+ Support Facility, and this would helpthe government to set up a fund for REDD in Indonesia to execute REDD, but this national fundhas not yet been established legally. REDD+ appeared as a result in the previous CAS,suggesting that insufficient attention has been paid to establishing the fund. [Not Achieved]
Coral Reef Management. The indicator selected, to deliver the Coral Reef Rehabilitation andManagement Project (COREMAP), was met. [Achieved]
Code for green buildings. The government of Jakarta launched Green Building regulationnumber 38, effective since 2013. An IFC AS green building project helped to the city of Jakartahave a green buildings code. Although the city is in the process of enacting the regulations, 109buildings have complied with green building code and received green buildings permits.[Achieved]
The review concludes the objective was Mostly Achieved.
22. Objective #15 [Disaster Risk Management]. Identify and scale up disaster and climaterisk reduction and adaptation measures, including institutionalizing community-based settlement reconstruction. The support for this objective consisted of three loans ( a national road improvement project for Western Indonesia and in two loans for the National Program for Community Empowerment), and knowledge activities for disaster risk reduction such as a national risk assessment/mapping, study and policy dialogue on disaster risk financing, building capacity for post-disaster risk assessment and recovery, and IFC advisory services for an insurance company to develop a new-index based insurance product –earthquake index insurance. Two indicators measured results for this objective:
Evidence-based examples of risk management. The idea was to have examples of disaster riskand recovery that could be scaled up and replicated nationally; the examples could be of saferschools, resilient villages, and urban wards with disaster risk and recovery plan and investmentprogram. Now resilience to disaster is integrated into community driven development, in postdisaster reconstruction, and in government school rehabilitation. Using the government’sSpecial Allocation Fund, adaptation and resilience issues have been mainstreamed in four highrisk provinces under the National Program for Community Empowerment in urban areas.[Achieved]
Community-based reconstruction as government program. The government adoptedcommunity-based housing reconstruction as a standard mechanism for funding post-disasterreconstruction. The government established a multi-donor trust fund to institutionalize thisprogram under the Ministry of Public Works and Public Housing. The Bank was appointed to
12
CLR Review Independent Evaluation Group
manage a funding window under that trust fund to provide grant financing to strengthen the mechanism. [Achieved]
The review concludes the objective was Achieved.
23. IEG rates the outcome under Focus Area IV as Satisfactory. The assistance achieved ormostly achieved the objectives sought in disaster risk management and in reducing emissions from deforestation and forest degradation. The review concurs with the CLR that the results achieved “were modest compared with the scope of the challenge.”
Overall Assessment and Rating
24. IEG rates overall outcome of the Indonesia CPS as Moderately Satisfactory. This is sobecause the program achieved or mostly achieved eight of the 15 objectives it sought. To be rated satisfactory, as the CLR does, the program should have fully achieved eight objectives, but it achieved two (objectives number 9 and 15). Of the 37 groups of results indicators, the review rates 15 as fully achieved and 6 as mostly achieved, and the remaining 16 as not achieved or partially achieved. These results are similar to the ratings for projects whose ICR was validated by IEG during the review period: of 22 projects, 12 of them (55 percent) had their outcome rated moderately satisfactory or higher. The review considers the more significant achievements the ones associated with focus areas II (skills, technology and social protection) and III (community development, protecting the vulnerable and health outcomes). The review considers that focus area IV (sustainable development and resilience to disaster) also presents achievements in terms of processes that must be carried out to advance in sustainable development and resilience to disaster, but a final verdict on the results of that effort must wait longer, to observe results. Focus area I (Pro-Growth) absorbed more than one third of the Bank’s financial support to Indonesia and shows mostly poor results. Six of its seven objectives were partially achieved (connectivity, competitiveness, strengthen public sector, local government, and macroeconomic and fiscal management) or not achieved (infrastructure). Good results are found in the financial sector and in logistic competence and border management (customs). In the financial sector the review highlights the improvement in financial stability, the increase in financial depth, the larger capital market and the improved access to financial services by SMES and lower income people.
6. WBG Performance
Focus Area and Objectives CLR Ratings IEG rating
I. Pro-Growth - Promoting Prosperity Moderately Satisfactory Unsatisfactory
Objective 1 not rated Partially Achieved
Objective 2 not rated Partially Achieved
Objective 3 not rated Mostly Achieved
Objective 4 not rated Not Achieved
Objective 5 not rated Partially Achieved
Objective 6 not rated Partially Achieved
Objective 7 not rated Partially Achieved
II. Pro-Jobs - Enhancing Skills andTechnology and Improving Social Protection
Satisfactory Satisfactory
Objective 8 not rated Mostly Achieved
Objective 9 not rated Achieved
III. Pro-Poor - Promoting Communities,Protecting the Vulnerable and Improving Health Outcomes
Satisfactory Satisfactory
Objective 10 not rated Mostly Achieved
Objective 11 not rated Mostly Achieved
13
CLR Review Independent Evaluation Group
Objective 12 not rated Mostly Achieved
Objective 13 not rated Partially Achieved
IV. Ensuring Sustainable Development andImproving Disaster Resilience (Pro-Green)
Moderately Satisfactory Satisfactory
Objective 14 not rated Mostly Achieved
Objective 15 not rated Achieved
Lending and Investments
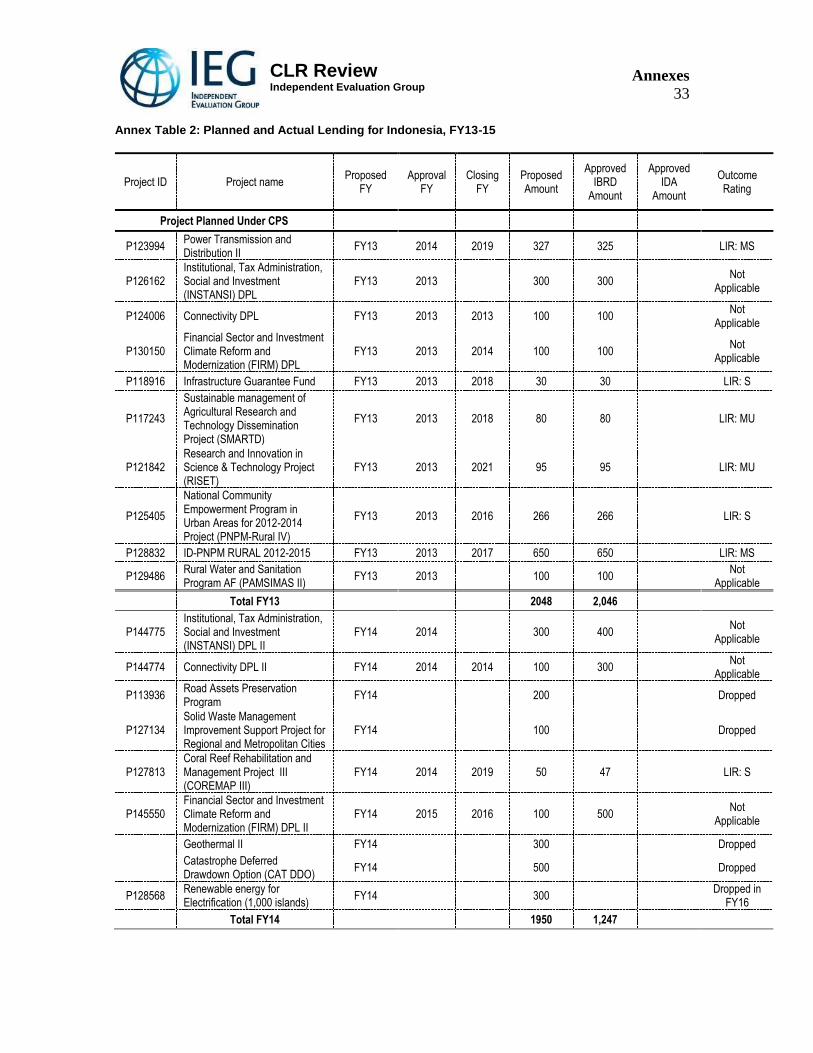
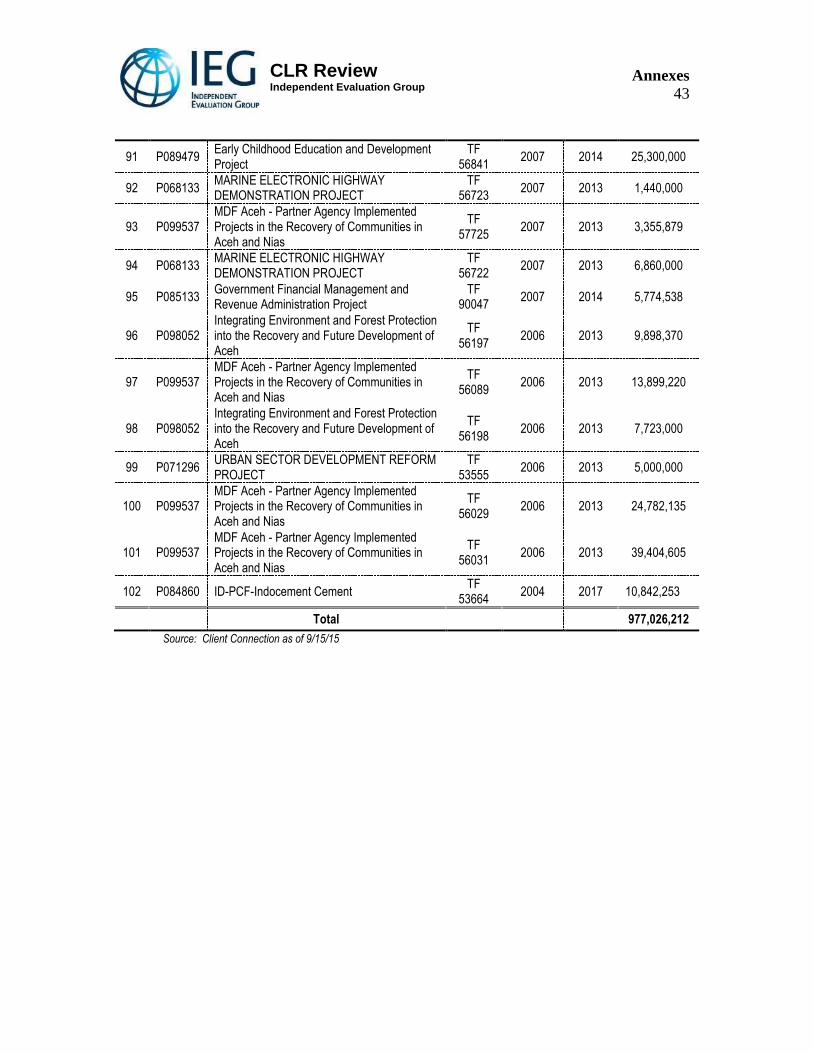
25. During the CPS period the Bank had 42 projects in operation, of which 27 came from previousCPSs. The total value of these loans reached $10.23 billion, of which $6.4 billion corresponded to loans from previous periods. As for new lending, the CPS planned to lend $6.34 billion for 31 loans but only $3.8 billion for 15 loans materialized; five DPLs accounted for $1 billion of loans. As regards trust funds, a total of 102 funds for a value of $977 million were in operation over the period. Fifteen and 30 trust funds accounted for 77 and 90 percent of the trust fund money. The bulk of the money in these 30 funds went for rural development, water and sanitation, early childhood education, community empowerment and Aceh province to help in the recovery of communities affected by the tsunami.
26. Based on the ratings of IEG ICR reviews, Indonesia presents a poorer record of performance ofclosed projects than EAP or the Bank portfolio. Of 22 projects closed during the CPS period IEG rated 12 of them as satisfactory or moderately satisfactory and the remaining 10 as unsatisfactory or moderately unsatisfactory. These ratings compared unfavorably with the EAP region and Bank wide portfolio, where 68 and 71 percent of projects had their outcomes rated S or MS. When using loan value to compare ratings, in Indonesia 49 percent of the value was rated S or MS while in EAP and Bank wide the numbers were 68 and 71 percent. The portfolio status in terms of number of projects at risk during FY13-15 is similar in Indonesia and EAP (18 and 19 percent) but lower than the Bank’s (21 percent); when measured by commitment at risk the numbers are 23 percent, 18 percent and 23 percent for Indonesia, EAP and Bank-wide.
27. There were 56 IFC investment projects, with US$808.3 million of net commitment, at theinception of the review period that were active during the review period. The two largest of these projects were with commercial banks. During the review period, IFC committed another US$1.03 billion through 27 investments, with largest investments for SME finance and hydroelectric power.
28. The CLR made no comments on the IFC portfolio. This review comments that all but twoprojects were being implemented as planned. IEG reviewed the three IFC investments and rated two of them Mostly Successful/Highly Successful and one Mostly Unsuccessful. Of the 56 investments in the portfolio during the review period, four were category C projects which did not require ESRR ratings and eleven projects have no ESRR rating yet because they were approved recently or IFC has yet to make a disbursement. Of the 41 projects with explicit ESRR ratings 34 (83%) were rated Excellent/Satisfactory, and 7 (17%) were rated Partially Unsatisfactory/Unsatisfactory. One IFC project has been placed on IFC High Risk List: the transition from an offshore operating environment (e.g. shipping) at approval to coal mining in a remote and environmentally challenging location represents, according to IFC documents, an “acute level of E&S risk and reputation exposure”.
29. MIGA gave coverage for US$407 million for two projects that supported hydroelectric powergeneration and nickel mining.
Analytic and Advisory Activities and Services
30. The analytical and advisory work consisted of 108 pieces, of which 22 were economic andsector work and 96 were technical assistance. The EWS was distributed over the three years of the CPS period, three of which were development policy reviews on financing local government,
14
CLR Review Independent Evaluation Group
subnational debt management performance assessment, and avoiding the middle income trap. The middle income trap report notes: “that with a few critical reforms in the six priority areas identified, Indonesia can climb the income ladder and join the rank of high-income economies within two decades, in an inclusive manner.” Notes and thematic studies constitute the rest of the ESW that covered topics such as education, environment, forestry, infrastructure investment, urban poverty, inequality, and the development diagnostics of the Sulawesi province. The technical assistance covered similar areas as the ESW but also aspects of rural development, health, financial sector, food security, sanitation, disaster and risk management, subnational development diagnostics, domestic trade, investment climate, and community empowerment. The bulk of the TA, 56 out 96 activities, was carried out in FY15.
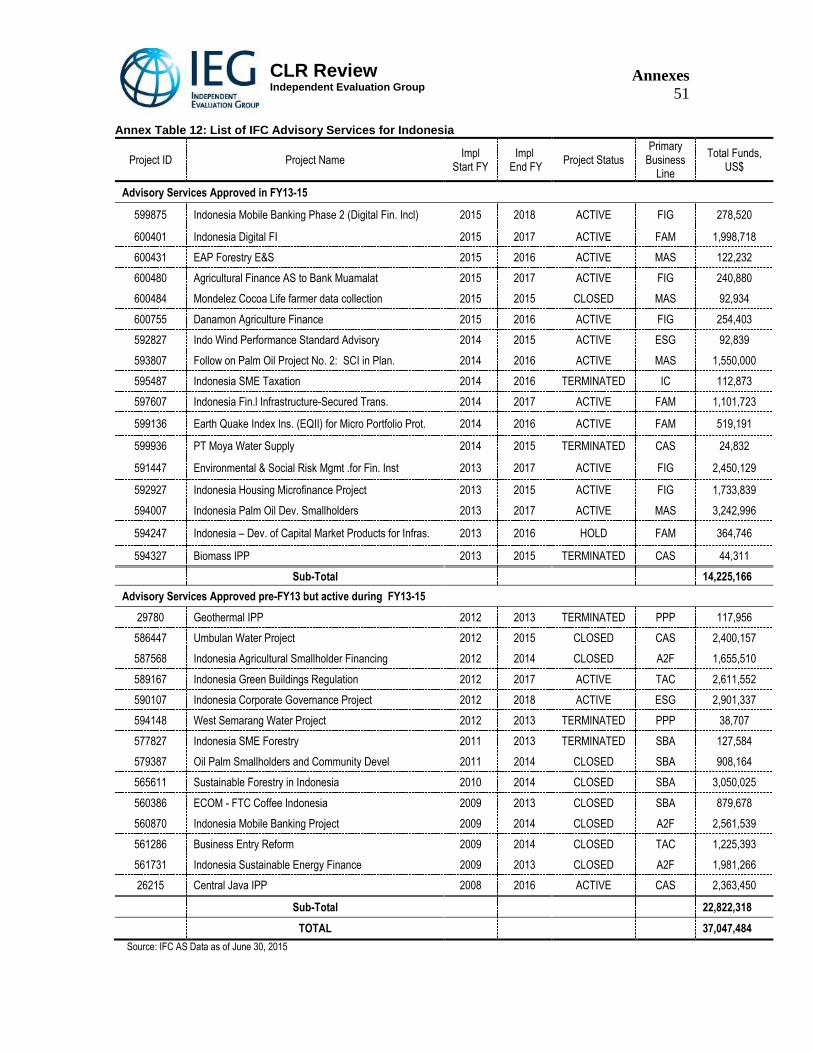
31. IFC had 14 advisory service (AS) projects approved before the review period for US$22.8million, which were implemented during the review period. During the review period, IFC approved 17 new AS projects amounting to over US$14.2 million. Of these 31 projects, six have been terminated, nine have closed, one is on hold and 15 are active. Of the nine closed projects, five were rated Mostly Unsuccessful/Unsuccessful at completion and IEG has validated one of them. Of the 15 active projects, the seven most recent ones also appear to have very little progress although it is too early to tell.
Results Framework
32. At first sight the results framework presents a reasonable chain between country developmentgoals, CPF objectives, interventions, and expected results. A reasonable chain of results, though, does not guarantee program consistency. For example, Focus Area I had four different groups of objectives seemingly unrelated to each other (connectivity, competitiveness and infrastructure as cost reducing interventions; financial sector; local government; and macro and public financial management), and some of which could have been placed in other focus areas. The outcome indicators were measurable, and had their dates, baseline and target values specified, but they rarely measured the results of the WBG program. Quite often they tended to measure results at the country level making it difficult, if not impossible, to disentangle the country result from the WBG program result and to know the true impact of the interventions. For example, in competitiveness there were two results indicators: an improved score in the LPI and reducing the number of days to start a business. The review questions if these are the appropriate indicators to judge if the objective “enhanced competitiveness” was achieved and whether achieving them will solve the plethora of issues and obstacles listed in the results matrix for that objective. With such shortcomings, it becomes difficult to learn from the WBG experience in Indonesia, since it is hard to know what worked and did not work, which results are truly outstanding and can be scaled up, and what areas the WBG should abandon or strengthen its effort to make its assistance effective. In summary, the results indicators were inadequate to measure achievement of objectives and to tell whether the problems enunciated in the column on issues and obstacles were solved or reduced.
Partnerships and Development Partner Coordination
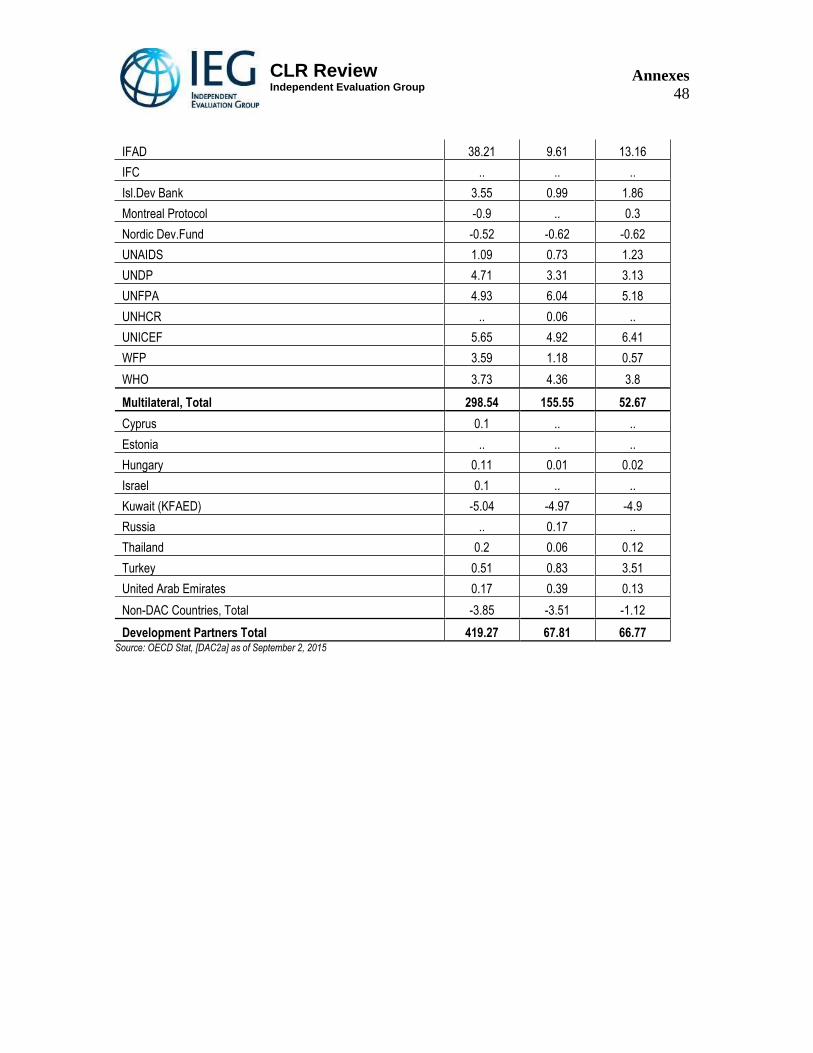
33. The Bank carries out part of its work in Indonesia with the support of other developmentpartners, both bilateral and multilateral. The Bank has partnered with bilateral donors to support government programs and CPS objectives. Partnerships with the Governments of Australia, Canada, Denmark, EU, the Netherlands, New Zealand, Norway, Sweden, Switzerland, UK and US helped deliver the CPS program. In development policy lending the Bank worked with ADB, KfW, Australia’s Department of Foreign Affairs and Trade, the French Development Agency, and the Government of Japan. The program also benefited from partnering with global trust funds which were either executed by the Bank ($61 million) or by the recipient ($166 million). The CLR does not report on how the coordination takes place.
15
CLR Review Independent Evaluation Group
Safeguards and Fiduciary Issues
34. In terms of safeguards and fiduciary issues Indonesia has a portfolio that consist of twoprojects in category “A”, eight projects in category “B”, seven projects in category “C”, and three Development Policy Financing operations. Documenting compliance with safeguard in category “A” projects is insufficient, particularly compliances with Involuntary Resettlement and Indigenous Peoples policies. For category “B” projects in the social development sector, environment safeguard supervision started late during the project implementation cycle, facilitators struggled to fill in safeguards forms correctly and showed low ownership of safeguards provisions; compliance with the Indigenous Peoples policy was not satisfactory in the CDD project as the review mission addressed social inclusion late. In the agriculture and rural development sector, the supervision of environment safeguard in the Agricultural Technology and Information project began in the fifth supervision mission without the ICR explaining why. Implementation of the Environmental Management Plan (EMP) also began late; for this loan, the ICR affirms that good and bad practices of environmental management were not well monitored and documented. In the environment sector, some projects triggered up to six safeguard policies, but there is inadequate information about policy compliance. For category “C” projects in the energy and mining sectors, the guidance note on safeguards obligations for geothermal investment transactions was not prepared as the pilot transaction was not implemented. In the education sector, the safeguard policy on Indigenous People was triggered and an Isolated Vulnerable Peoples’ Framework developed, but the ICR for the project does not clarify if there was full compliance with the policy.
Ownership and Flexibility
35. The WBG drew its program in consultation with stakeholders in Indonesia and aligned itsprogram with the government’s development plan. When a new government took over in 2014 and its priorities changed the Bank adjusted its program accordingly. The priorities in the CPS are aligned with government priorities and the government owns the strategy outlined in the CPS. Ownership at the higher level of government did not translate into ownership at its lower levels in all instances. As the CLR notes, the FY14 country performance portfolio review (CPPR, portfolio review), a joint exercise between the Bank, BAPPENAS (Planning Ministry) and the Ministry of Finance found, besides issues of project readiness, an “unclear ownership/commitment within implementing ministries”. Ownership of programs at the community level, though, seems to be substantial.
WBG Internal Cooperation
36. The CPS and the CPS Progress Report was a joint product of the World Bank, IFC and MIGA.The program outlined in the CPS report constitutes clear evidence of such collaboration in particular between IFC and the World Bank. The WBG engagement is based on four criteria to ensure the relevance of its support (CPS, p. 12), criteria which it applies to both the Bank and IFC limit their support or retire (such as the Bank did in health in agriculture and IFC limited corporate financing to top tier corporates). As Indonesia’s private sector continues to develop IFC changes its priorities in financing and advisory services to areas such as infrastructure, financial inclusion, climate change mitigation and agribusiness, complementing some of the Bank’s activities in these areas. IFC’s operations are integrated into the CPS and they form part of the CPS results framework. For IFC interventions to be seamlessly integrated into the CPS program it becomes necessary that the results indicators also reflect the expected contribution from IFC interventions.
Risk Identification and Mitigation
37. The CPS and CPSPR identified the following risks: vulnerability to economic shocks, naturaldisasters, weak institutional coordination, and governance arrangements, local conflicts, and complacency with economic outlook. The first four materialized. How did they impact the WBG’s program? For the risk of economic shocks, the WBG did not have a strategy to mitigate it but the
16
CLR Review Independent Evaluation Group
government managed its macroeconomic policy in a manner appropriate to maintain macro and financial stability. For natural disasters the Bank considered a CAT-DDO to help maintain expenditure in case of a natural catastrophe, an event that did not materialize. Other non-catastrophic natural disasters materialized, but the country’s increasing preparedness made it easier to deal with these emergencies, for which the Bank has been helping to build up capacity to deal with them. For institutional coordination the Bank tried to engage with counterparts more closely, one example being the portfolio review it carried out with BAPPENAS in 2014, which helped solve problems and uncover issues of ownership of programs in executing ministries. For governance, the Bank takes precautions in the operations it finances and works closely with INT in this matter.
Overall Assessment and Rating
38. IEG assesses overall WBG performance as good. The assessment rests on WBG performanceon design and implementation of the program. On design, the WBG selected objectives that would help support the government’s development program, and it chose a mix and level of interventions appropriate to deliver the program and achieve the objectives. The program was built on a close coordination between Bank and IFC activities. The results framework had a clear logic of interventions but fell short in the quality of the indicators to measure achievement, as they tended to rely on country outcomes rather than on program outcomes, on processes completed, and activities carried out. That weakness makes it difficult to assess the contribution of the WBG program to the country’s development outcomes and to learn what works, what does not work and why. The CPS and CPSPR incorporated the lessons learned from past experiences. The lessons did not include aspects of risk management, something that might have helped the CPS to pay more attention at what measures to take when the risks to the program materialized. On implementation, the WBG responded to changing circumstances and priorities, as indicated by its $985 million lending in FY15, the lowest in the previous five years, and a result of the outgoing government’s decision to scale down lending to let the incoming government decide on new borrowing from the Bank. That flexibility also reflected in the closing of the disaster response programs for Aceh, Nias and Java, moving from supporting pilot interventions through the National Program for Community Empowerment (PNPM), using the experience and knowledge gained in that program to concentrate in the Village Law program, and preparing for stepping up support for investments in infrastructure. The Bank paid some attention to program implementation, as attested by its year-long country portfolio performance review in FY14, which dealt with the risk and quality of the portfolio and timeliness of implementation. More attention to it, though, might have helped to implement projects in infrastructure that show long delays in execution. On the WBG side, that attention reflected in an appropriate division of labor between the Bank, IFC and MIGA. The CLR does not report on actions to align Bank and country systems nor on safeguards. On safeguards, as noted above (par. 34) the Bank could improve its performance; on fiduciary issues the CLR reports that the Bank supported measures to strengthen accountability and build fiduciary capacity, but does not report about the results from its support.
7. Assessment of CLR Completion Report
39. The CLR presents a complete survey of the WBG program in Indonesia and any reader whowants to know about the results of the program can do so, with effort. Its main text covers four topics: CPS development outcomes, WBG performance, alignment with WBG corporate goals, and lessons. Its Annexes inform in detail about achievements in each pillar or focus area, with a matrix at the end of each pillar that lists the results indicator and its assessment of achievement. Its narrative on CPS development outcomes informs about processes, WBG interventions and outcomes, all scrambled together without outcomes and objectives as its north. In the discussion about outcomes it is difficult to separate country and program outcomes, not a fault of the CLR but of the results indicators defined in the CPS results matrix. To find out the results for a particular part of the program the reader must go to the annexes of the CLR and work his or her way up through them. On the rating for the pillars and the
17
CLR Review Independent Evaluation Group
program it seems the CLR derives them from the number of indicators achieved (see table after paragraph 41) but not by the number of objectives achieved as the OPCS-IEG guidelines require. This explains why it rates Focus Area I as moderately satisfactory when so little was achieved and Focus Area IV as moderately satisfactory when its objectives were achieved or mostly achieved. The CLR does not discuss safeguard and conflicts of interest issues, and mentions fiduciary issues in a cursory way.
8. Findings and Lessons
40. IEG concurs with the findings and lessons in the CLR, rephrases some, and presents some ofits own.
o Good technical design alone does not ensure the success of a project or aprogram. Political economy aspects can make or break a well-designed project orprogram. Therefore, it is necessary to engage with counterparts that have the mandate tocommit and the institutional capacity to deliver a project or a program. In this regard it isnecessary to develop a clear understanding of the deciding and implementingenvironment and its risks. PINTAR, a project that had to be cancelled after many years ofinaction, exemplifies what happens when support for the project does not exist.
o WBG efforts to enhance the government’s ability to implement a project or aprogram are likely to increase their chances of success. This is particularly true forprograms heavy in infrastructure and institution building. Shortcomings in projectreadiness – particularly in terms of advanced procurement, land acquisition, safeguardrequirements, sponsor commitment, and ownership/commitment—delayed projectexecution, leading to meager results or outright failure. Therefore, to increase the chancesof success when engaging in large infrastructure projects the Bank must ensure that thebasic background work is in place (land acquisition, environmental permits, advancedprocurement, safeguard requirements, supporting legal requirements).
o Without proper measurement tools the Bank cannot track and assess the impact ofits long-term involvement at the regional level. In a large and diverse country likeIndonesia, a sequential approach to engagement that builds on early pilot interventionshas proved effective in providing support to regions and communities through a CDDapproach. Overtime, as the engagement matures it is convenient to develop measures ofaggregate impact at the local level rather than rely on isolated measures of multipleactivities.
o The experience of the CPS, especially Focus Area I, shows that pillars, areas ofengagement or objectives that bring together disparate issues reflect a lack of clearpriorities and selectivity. Once again, that experience shows that selectivity is important,more so when the Bank engages with an interim program, like the one under review. TheBank has engaged in Indonesia for decades and political change in the country mayrequire a new, and selective, basis for Bank engagement in areas it can have impact.Selectivity can be exercised by sequencing engagements rather than casting a wide net tohave dialogue with a new government.
o The next CPF will have to be more selective in its design, scope and results. Whilethe needs are great and the Government’s development agenda is necessarily broad, theWBG must have fewer areas of engagements to bring scale and impact to bear on theprogram. This entails to choose among alternatives, to make explicit the trade-offs, and tocorrect course during the CPF period.
Annexes
19
CLR Review Independent Evaluation Group
Annex Table 1: Summary Achievements of CAS/CPS Objectives
Annex Table 2: Planned and Actual Lending for Indonesia, FY13-15
Annex Table 3: Analytical and Advisory Work for Indonesia, FY13-15
Annex Table 4: Grants and Trust Funds Active in Indonesia, FY13-FY15
Annex Table 5: IEG Project Ratings for Indonesia, FY13-Present
Annex Table 6: IEG Project Ratings for Indonesia & Comparators, FY13-15
Annex Table 7: Portfolio Status for Indonesia and Comparators, FY13-15
Annex Table 8: Disbursement Ratio for Indonesia, FY13-15
Annex Table 9: Net Disbursements and Charges for Indonesia, FY13-15
Annex Table 10: Total Net Disbursements of Official Development Assistance & Official Aid
Annex Table 11: List of IFC Investments in Indonesia
Annex Table 12: List of IFC Advisory Services for Indonesia
Annex Table 13: IFC Net Commitment Activity for Indonesia
Annex Table 14: List of MIGA Activities
Annex Table 15: Economic and Social Indicators for Indonesia, 2013-2015
Annexes
20
CLR Review Independent Evaluation Group
CPS FY13-FY15: Focus area 1 -
Pro-Growth- Promoting Prosperity
Actual Results (as of current month/year)
IEG Comments
Major Outcome Measures
1. CPS Objective: Enhance Indonesia’s logistics performance, improve access to broadband and reduce costs for exporting and importing
Indicator: Ranking of Indonesia in the Logistics Performance Index (LPI) Baseline: 59 (2012) Target: < 59 (2015)
Indonesia’s 2014 LPI ranking has improved to 53
Source: CLR and LPI index
Indicator: Percentage of population with access to broadband internet services Baseline: 5% in 2011 Target: 30% by 2015
By end of CY2014 broadband internet access had reached 34.5% of the population and 37% penetration was expected by the end of CY2015. Improved access to broadband Internet (in Indonesia and elsewhere) is primarily attributable to increased investments in infrastructure and services by the private sector—Indonesia’s telecommunications service providers. The World Bank contributed to this increase by providing advice to the government on the enabling regulatory framework/environment for telecoms in particular on regulations that directly impact access to broadband, including: (a) allocation of radio spectrum (including reframing/reallocation of frequencies and moving away from technology-specific frequency allocation in certain bands) that has enabled more widespread deployment of mobile broadband (3G/4G); (b) advice on infrastructure-sharing in support of more efficient network rollout; (c) advice on PPP approaches to stimulate rollout in commercially less viable areas; (d) specific advice/analysis/needs assessment on broadband infrastructure deployment in Papua and West Papua in Eastern Indonesia. With the policy advice provided, the WBG supported government’s decision to make revisions to its policies and regulations on the allocation of spectrum for mobile broadband which contributed to the enhanced broadband access.
Indicator: Cost and time to export and import, as indicated in the Doing Business Survey Baseline: 2012: Export: 17 days, US$644 per container; Import: 27 days, US$660 per container Target: 2015: Export: >17 days, > US$644 per container; Import: > 27 days, > US$660 per container
2. CPS Objective: Improve the policy framework, regulatory environment, and coordinated interventions for productivity, competition and innovation
Indicator: Score in the following LPI indicators: (i) customs and (ii) logistics competence Baseline: 2012: customs: 2.53; logistics competence 2.85 Target: 2012: customs: 2.7; logistics competence 3.0
2014 LPI on logistics competence: 3.21 2014 LPI on customs: 2.87
Source: CLR and LPI index
Indicators: (i) Number of days to start a company; (ii) Number of days to enforce a contract Baseline: (i) 50 days to start a company; (ii) 570 days to enforce contract Target: (i) 30 days to start a company; (ii) less than 500 days to enforce contract
2015: 52.5 days to start a company 2015: 471 days to enforce a contract
Source: CLR and Doing Business 2015
Investment Policy Indicator: Coordinated investment policy formulation coordination and improved transparency in regulatory making Baseline: No Target: Yes
Investment Policy Consultative regulatory making process remains weak; investment policy coordination improved during the negative investment list (DNI) process. Investor Inquiry Handling Investor inquiry handling system improved at the Investment Coordination Board (BKPM).
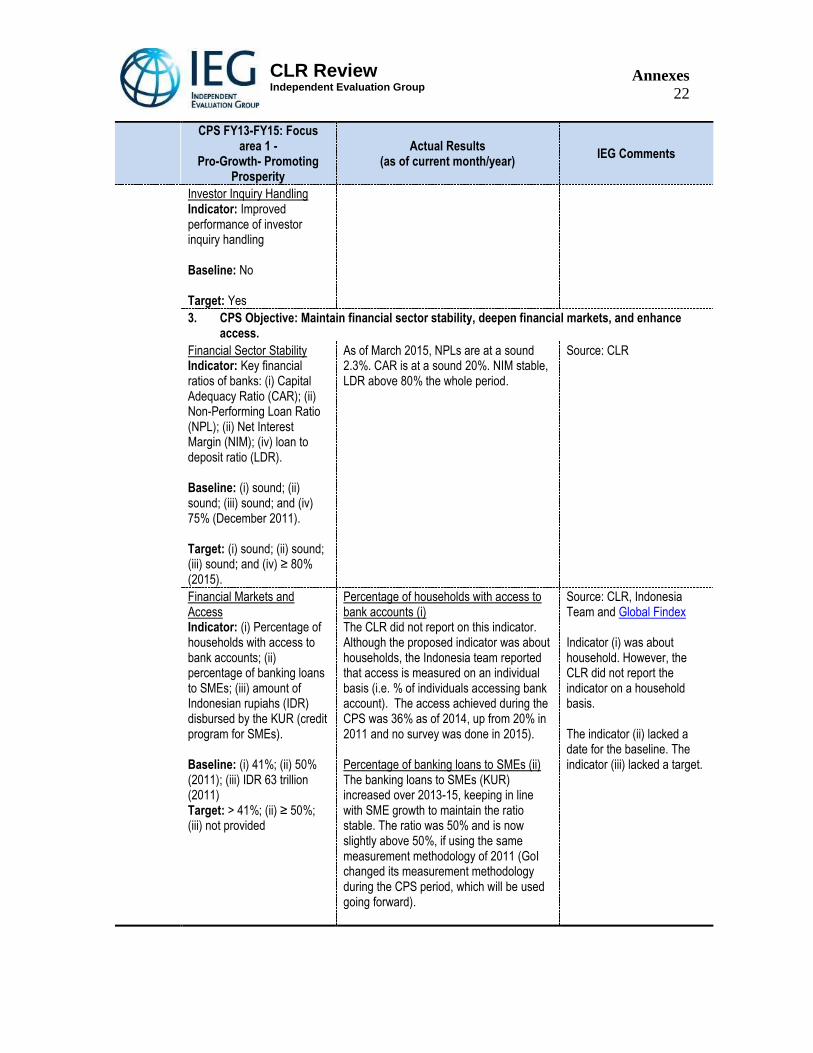
Financial Sector Stability Indicator: Key financial ratios of banks: (i) Capital Adequacy Ratio (CAR); (ii) Non-Performing Loan Ratio (NPL); (ii) Net Interest Margin (NIM); (iv) loan to deposit ratio (LDR). Baseline: (i) sound; (ii) sound; (iii) sound; and (iv) 75% (December 2011). Target: (i) sound; (ii) sound; (iii) sound; and (iv) ≥ 80% (2015).
As of March 2015, NPLs are at a sound 2.3%. CAR is at a sound 20%. NIM stable, LDR above 80% the whole period.
Source: CLR
Financial Markets and Access Indicator: (i) Percentage of households with access to bank accounts; (ii) percentage of banking loans to SMEs; (iii) amount of Indonesian rupiahs (IDR) disbursed by the KUR (credit program for SMEs). Baseline: (i) 41%; (ii) 50% (2011); (iii) IDR 63 trillion (2011) Target: > 41%; (ii) ≥ 50%; (iii) not provided
Percentage of households with access to bank accounts (i) The CLR did not report on this indicator. Although the proposed indicator was about households, the Indonesia team reported that access is measured on an individual basis (i.e. % of individuals accessing bank account). The access achieved during the CPS was 36% as of 2014, up from 20% in 2011 and no survey was done in 2015). Percentage of banking loans to SMEs (ii) The banking loans to SMEs (KUR) increased over 2013-15, keeping in line with SME growth to maintain the ratio stable. The ratio was 50% and is now slightly above 50%, if using the same measurement methodology of 2011 (GoI changed its measurement methodology during the CPS period, which will be used going forward).
Source: CLR, Indonesia Team and Global Findex Indicator (i) was about household. However, the CLR did not report the indicator on a household basis. The indicator (ii) lacked a date for the baseline. The indicator (iii) lacked a target.
Amount of Indonesian rupiahs (IDR) disbursed by the KUR (credit program for SMEs) (iii) As of end 2014, KUR grew into one of the world’s largest partial credit guarantee programs for MSMEs (IDR178.8 trillion disbursed to more than 12 million borrowers, with NPL of 3.3%, up from around IDR63 trillion in 2011).
4. CPS Objective: Increase the quantity and efficiency of national and subnational government spending on infrastructure, and increase private investment in infrastructure.
Roads Indicator: Kilometers of national roads (i) maintained; and (ii) developed Baseline: (i) 1,500 Km maintained through betterment works and, (ii) 3,000 Km developed. Target: Increase by 25% / year over 2011-2015 period.
(i) Cumulative Maintenance Achievement 2011-2014 by Directorate General of Highways (DG): 4,792 km (44% of the target of 25% increase per year). (ii) Cumulative Road Development Achievement 2011-2014 by Directorate General of Highways (DG): 12,270 km (57% of the target of 25% increase per year). As a measure of efficiency in government spending on infrastructure at the national level, the Indonesia team reported that the percentage of national roads in stable conditions increased from 87.72% in 2011 to 92% in 2014. No information was provided to assess efficiency at the subnational level. As a measure of increased spending on infrastructure by the national and subnational governments, the Indonesia team reported that expenditures for national road improvements increased from US$ 2750 million in 2011 to US$ 4000 million in 2014. No information was provided to assess spending at the subnational level.
Source: CLR and Indonesia Team. Data for 2015 not yet available. The proposed indicators did not measure the efficiency dimension the objective. The Indonesia team provided additional information in this respect. The proposed indicators did not measure the quantity of national and subnational spending. The Indonesia team provided additional information in this respect.
Energy Indicator: Yearly hours of power supply interruption time per customer (System Average Interruption Duration Index) Baseline: 5 hours per year (2012)
5.76 hours/customer (2013). 5.81 hours/customer in (2014)
Source: CLR and Indonesia Team.
Annexes 24
CLR Review Independent Evaluation Group
CPS FY13-FY15: Focus area 1 -
Pro-Growth- Promoting Prosperity
Actual Results (as of current month/year)
IEG Comments
Target: 2 hours per year (2015)
Private Investment Indicator: Increased private investment in infrastructure through the PPP framework.
The Viability Gap Funding (VGF) was established as a PPP framework to boost private investment in infrastructure. However, no PPP has yet succeeded in Indonesia.
Source: CLR The baseline and the target were not specified.
5. CPS Objective: Improved fiduciary, social and environmental management and technical performance of selected local governments in the delivery of basic services, and enhance the capacity of local institutions to monitor and assess subnational public expenditures.
(i) Indicator: Public Expenditure Analysis and Capacity Harmonization (PEACH) components enhanced and expanded Baseline: No Target: Yes (ii) Indicator: Capacity of local institutions to analyze and monitor public expenditure and PFM and to demand better local government performance in these areas enhanced Baseline: No Target: Yes
(i) PEACH was implemented and completed in all six targeted provinces. Most of these provinces benefited from the program and made improvements in the provinces’ fiduciary, social and environmental management as well as technical performance in the delivery of basic services. However, the program did not expand to new provinces since one of the donors decided to implement PEACH directly. (ii) LGDP/DAK supported improved quality of public spending on infrastructure at the local level. The 2014 mid-term evaluation for LGDP found that the performance-based design of the program incentivized participating local governments to increase matching capital investment from own-sources at a much higher rate than non-participating local governments. In the last year of the CPS a well-targeted set of subnational service delivery support initiatives, including using tools (RAAP and MiGestion) and global experience from the LCR region, were initiated.
Source: CLR
6. CPS Objective: Enhanced Government ability to meet its financing needs and maintain critical public expenditures, and use monitoring and evaluation to inform budget allocation.
(i) Access to Markets Indicator: Continued access to markets Baseline: No Target: Yes (ii) Level of maintenance and capital expenditures
(i) Access to Markets Targets met for 2012 and 2013 and on track in 2014 with net securities issuance reached 104% of the target based on the revised budget, with gross securities issuance at 100% (ii) Level of maintenance and capital expenditures
Source: CLR and Indonesia team (ii) Neither the CPS nor the CPSPR provided a baseline and target. The CLR does not report on this indicator.
Annexes 25
CLR Review Independent Evaluation Group
CPS FY13-FY15: Focus area 1 -
Pro-Growth- Promoting Prosperity
Actual Results (as of current month/year)
IEG Comments
Indicator: Maintenance and capital expenditures
The Indonesia team provided the following data on central government capital expenditures: 2010: Actual = 80.3 trillion Indonesian Rupiah 2011: Actual = 117.9 trillion Indonesian Rupiah 2012: Actual = 176.1 trillion Indonesian Rupiah 2013: Actual = 192 trillion Indonesian Rupiah
Use of monitoring and evaluation to inform budget allocation Indicator: (i) Budget allocations informed by monitoring and evaluations; (ii) number of line ministries and agencies reporting through BRISA (the monitoring and evaluation system) Baseline: (i) No; (ii) 0 (FY 2011) Target: (i) Yes; (ii) > 0
(i) Budget allocations were informed by BRISA. (ii) As of mid-2013, there were more than 70 line ministries and agencies that had reported their progress through the BRISA system. However, owing to leadership changes, the BRISA system has been made inactive since end of 2013. Currently, the government faces a lack of performance feedback for future planning and budgeting decisions.
Source: CLR and Indonesia team
7. CPS Objective: Strengthen the public sector by enhancing public financial management
While there was some progress on improving the transparency of the medium term expenditure framework (MTEF) process, it is unlikely to be sufficient to improve the C+ rating for PI-12
Source: CLR
Indicator: Percentage of line ministries receiving unqualified opinions for their annual financial statements: Baseline: 63% Target: 85% (FY2013)
74.71% for FY2013 based on BPK (Supreme Audit Institution) audit opinion report
Source: CLR
Indicator: New Financial Management Information System in all 177 Treasury Local Offices implemented
Automated budget and treasury system (SPAN) development completed in 2013 and rolled out to all 222 treasury offices with 100% of all financial transactions
Source: CLR
Annexes 26
CLR Review Independent Evaluation Group
CPS FY13-FY15: Focus area 1 -
Pro-Growth- Promoting Prosperity
Actual Results (as of current month/year)
IEG Comments
Baseline: No Target: Yes
conducted through the system as of February 2015.
CPS FY13-FY15: Focus Area 2: Enhancing Skills
and Technology, and Improving Social
Protection
Actual Results (as of current month/year)
IEG Comments
Major Outcome Measures
8. CPS Objective: Improve the education quality and performance of teachers, and improve the human resource capacity in R&D.
Indicator: Number of basic education teachers that meet academic qualification mandated by the Teacher Law (i.e. teachers that hold S1 degree or more). Baseline: 35% primary teachers (2011); 80% junior secondary teachers (2011) Target: 82% primary teachers (2011); 98% junior secondary teachers (2011)
(i) 1,377,760 or 82% of primary school teachers with an S1 degree (2015) (ii) 578,023 or 92% of junior secondary school teachers with an S1 degree (2015)
Source: CLR The baseline and target for primary teachers were revised downwards and upwards respectively at the CPSPR stage. The baseline and target of junior secondary teachers were revised upwards at the CPSPR stage.
Indicator: Percentage of Masters (S2 degree) or PhD (S3 degree) holders in public research institutes (LPNK) Baseline: 15% Target: 17%
As per the RISET Project Annual Work Plan 2015, the number of staff with S2 and S3 degrees is about 3,100 out of 14,498 total staff, or about 21%.
Source: CLR
9. CPS Objective: Conversion of the existing social insurance administrators into not-for-profit institutions and expand coverage and contributions.
Indicator: Employees Social Security System (Jamsostek) converted to a not-for-profit institution that can administer the National Social Security System Law (SJSN) pension and old age savings programs Baseline: No Target: Yes
Jamsostek transformed from a profit-based state owned enterprise to a not-for-profit entity reporting directly to the President.
Source: CLR
Annexes 27
CLR Review Independent Evaluation Group
CPS FY13-FY15: Focus Area 2: Enhancing Skills
and Technology, and Improving Social
Protection
Actual Results (as of current month/year)
IEG Comments
Indicator: Employees Social Security System (Jamsostek) membership expanded and contribution collection from the formal and informal sectors improved Baseline: No Target: Yes
Coverage Progress was made in enrolling informal sector workers and expanding the number of workers paid for by the government. The SJSN health program now covers civil servants, the poor, self-employed, and formal and informal workers totaling 133.4 million citizens as of Dec 31, 2014. Neither the CPS nor the CPSPR provided a baseline for this indicator. The Indonesia team reports that results achieved exceed the 121.6 million target that the Government had original set (the actual members in the SJSN Health program as of December 31, 2014 are 109.7% of the target). Contribution Mandatory inclusion of private sector and non-salaried/informal workers in SJSN Health program started on January 1, 2014. Based on BPJS Health’s audited annual financial report as of December 31, 2014, the total amount of contribution of private sector and non-salaried/informal workers was IDR 5.44 trillion (IDR 3.55 Trillion from private salaried Workers (mostly Ex-JPK Jamsostek members) and IDR 1.89 trillion from non-salaried/informal workers. Private sector and informal workers contributed to 13.4% of total collected contribution. This reflects an increase in contributions from workers (outside state apparatus, military and police officers).
Source: CLR and Indonesia Team. The indicator lacked a quantitative baseline and target.
Annexes
28
CLR Review Independent Evaluation Group
CPS FY13-FY15: Focus area 3 - Promoting
Communities, Protecting the Vulnerable and Improving Health
Outcomes
Actual Results (as of current month/year)
IEG Comments
Major Outcome Measures
10. CPS Objective: Enhanced capacity for detecting and responding to shocks that threaten vulnerable households, and increase the number of poverty programs using the national registry of poor and vulnerable households.
Indicator: National shock monitoring system developed and operational Baseline: No Target: Yes
A national crisis monitoring system was completed and adopted by the National Team for the Acceleration of Poverty Reduction (TNP2K), housed in the Office of the Vice President. The dashboard was uploaded to their internal website during early 2014 and is now in use.
Source: CLR
Indicator: Number of poverty programs management units using the national registry of poor and vulnerable households to identify beneficiaries Baseline: 0 Target: 4 programs by 2015
4 programs used the registry to identify beneficiaries.
Source: CLR
Indicator: Gross enrollment rate of 4-6 year olds in ECED Baseline: 33% (2010) Target: 72% (2015)
GER for 3-6 year-olds is 65.16% (since the figure of 65.16% is for 3-6 rather than 4-6 and with 3 year-olds less likely to be in ECED programs, the 72% target for 4-6 year-olds may have actually been met).
Source: CLR The baseline and target were revised downwards at the CPSPR stage.
11. CPS Objective: Improved local-level governance, greater participation by women, increased access to health and education, and participation in early childhood education and development
Local Governance Indicators: (i) Number of community members participating in the National Program for Community Empowerment (PNMP); (ii) Percentage of PNMP beneficiaries that that project investments reflected their needs; (iii) Percentage of poorest communities involved in planning and decision-making; (iv) Percentage of villages providing feedback on health and education services
(i) The Indonesia team reports that PNPM program reached and exceeded the target of reaching 2.5 million community members. (ii) 95% beneficiaries claimed that infrastructure programs in PNPM met their needs and 59% beneficiaries claimed that socio-economic programs in PNPM met their need (2012). (iii) 50% of poorest communities involved in planning and decision-making meetings (2012). (iv) 99% of targeted sub-districts had service providers attend MAD (Musyawar
Source: CLR, PNMP beneficiary survey, and Indonesia Team. Indicator (ii) and (iii) may have already been achieved before the CPS Period.
Annexes 29
CLR Review Independent Evaluation Group
CPS FY13-FY15: Focus area 3 - Promoting
Communities, Protecting the Vulnerable and Improving Health
Outcomes
Actual Results (as of current month/year)
IEG Comments
Baseline: (i) 0; (ii) 0; (iii) 0; (iv) 0 Target: (i) 2.5 million; (ii) 80%; (iii) >50%; (iv) 35%
Antar Desa) to discuss the status of health and education services (2015).
Participation of Women Indicator: (i) Percentage of women participating in planning / decision-making meetings; (ii) Percentage of women in community oversight teams Baseline: (i) 0; (ii) 0 Target: (i) 50%; (ii) 30%
(i) 45% of women in planning/decision-making meetings. (ii) 32% of women in community oversight teams.
Source: CLR
Indicator: (i) percentage of pregnant women receiving 4 prenatal care visit; (ii) percentage of children under 5 weighed monthly; (iii) percentage of pregnant women attending nutrition counseling session; (iv) percentage of caregivers of children under 2 attending nutrition counseling session; (v) junior secondary enrollment rate Baseline: (i) 0; (ii) 0; (iii) 0; (iv) 0; (v) Not provided Target: (i) >80%; (ii) 80%; (iii) 50%; (iv) 50%; (v) 70%
(i) 91% (ii) 75% (iii) 17.2% (iv) The CLR reports that 1.4% of male caregivers of children under 2 attending nutrition counseling session. No information is provided in the CLR with respect to female participation. The Indonesia team reported updated data indicating that the attendance rate for pregnancy classes was 16% and 84% for males and females respectively. In turn, the attendance rate for nutrition classes was 28% and 71% for males and females respectively. (v) 90%
Source: CLR and Indonesia Team Neither the CPS nor the CPSPR provided a baseline for the indicator on junior secondary enrollment rate. The Indonesia team provided a baseline which was 63%.
12. CPS Objective: Increase access by smallholders to client and market-oriented extension and marketing services, and enhance water security for irrigation.
Indicator: Percentage of farmers with access technology and market information through ICT. Baseline: < 10% Target: Not provided
The CLR reports that, as of March 2015, 30% 30% of targeted groups had completed or were in the process of completing training to utilize technology and market information through ICT.
Source: CLR and Indonesia Team. Neither the CPS nor the CPSPR provided a target for the indicator. The proposed indicator was about the percentage of farmers with access to
Annexes 30
CLR Review Independent Evaluation Group
CPS FY13-FY15: Focus area 3 - Promoting
Communities, Protecting the Vulnerable and Improving Health
Outcomes
Actual Results (as of current month/year)
IEG Comments
technology and market information through ICT. The CLR reports on the percentage of farmers that received training to utilize technology and market information through ICT.
Indicator: Regulatory and policy framework of value chains of smallholder-based exportable commodities strengthened Baseline: No Target: Yes
Two detailed analytical studies completed and action plans launched to enhance the sustainability and competitiveness of two small-holder based beverage crop, tea and coffee.
Source: CLR
Indicator: Number of irrigation districts with improved water security. Baseline: 0 Target: ≥ 50
During the CPS period, more than 50 irrigation districts improved physically (repairs where needed) and institutionally (O&M and system management) leading to improvement in irrigation water supply services (quantity, reliability/timeliness). In sum, water security were improved in more than 50 irrigation districts.
Source: CLR and Indonesia Team.
13. CPS Objective: Strengthen policies governing the education of health professionals and increase access to safe water and sanitation.
Indicator: (i) National Accreditation Agency established; (ii) National Agency for Competency established; (iii) Number of health professional schools accredited. Baseline: (i) No; (ii) No; (iii) 0 Target: (i) Yes; (ii) Yes; (iii) 7
(i) Yes (ii) Yes (iii) Not achieved
Source: CLR and Indonesia Team The Indonesia Team reported the National Accreditation Agency and the National Agency for Competency were established.
Indicator: (i) Number of people provided with piped water supply; (ii) Number of people provided with improved sanitation under Rural Water and Sanitation Program (PAMSIMAS) Baseline: (i) 0; (ii) 0;
(i) 7.8 million provided with piped water supply during the CPS period. (ii) 7.69 million with improved sanitation under the PAMSIMAS program during the CPS period.
Source: CLR
Annexes 31
CLR Review Independent Evaluation Group
CPS FY13-FY15: Focus area 3 - Promoting
Communities, Protecting the Vulnerable and Improving Health
Outcomes
Actual Results (as of current month/year)
IEG Comments
Target: (i) 7 million; (ii) 3.4 million
CPS FY13-FY15: Focus area 4 – Ensuring
Sustainable Development and Improving Disaster
Resilience
Actual Results (as of current month/year)
Comments
Major Outcome Measures
14. CPS Objective: Implementing of Indonesia’s Reducing Emissions from Deforestation and Forest Degradation (REDD+) strategy and improving protection for coral and marine resources.
Indicator: Fund for REDD established with legal, technical and managerial capacity to support and finance Indonesia’s National REDD+ Strategy Baseline: No Target: Yes
REDD+ Support Facility (RSF) MDTF established at the WB to support GoI to set up a national Fund for REDD in Indonesia (FREDDI) MDTF for REDD+ implementation. However, the FREDDI MDTF has not yet been legally established. The REDD+ agenda has been transferred to the newly established Ministry of Environment and Forestry (MoEF) under the new administration. It is expected that MoEF will now legally establish the FREDDI.
Source: CLR
Indicator: Phase III of Coral Reef Rehabilitation and Management Project (COREMAP) providing expanded support for coral and marine protection delivered and under implementation. Baseline: No Target: Yes
Phase III of COREMAP delivered and under implementation during the CPS period.
Source: CLR The proposed indicators were a process measure.
Indicator: Government of Jakarta green buildings code for commercial buildings in the city launched Baseline: No Target: Yes
Government of Jakarta launched Green Building regulation number 38, effective 2013.
Source: CLR
15. CPS Objective: Identify and scale up disaster and climate risk reduction and adaptation measures, including institutionalizing community-based settlement reconstruction.
Annexes 32
CLR Review Independent Evaluation Group
CPS FY13-FY15: Focus area 4 – Ensuring
Sustainable Development and Improving Disaster
Resilience
Actual Results (as of current month/year)
Comments
Indicator: Evidence-based examples of practical and concrete disaster and climate risk reduction and adaptation measures (e.g., safer schools, resilient villages and urban wards with DRR plan and investment program) that can be scaled up and replicated nationally created. Baseline: No Target: Yes
Disaster resilience is integrated into CDD, in post disaster reconstruction, and in Government school rehabilitation funded by the Special Allocation Fund (DAK). Mainstreaming adaptation and resilience issues into National Program for Community Empowerment (PNPM) in urban areas in 4 high risk provinces, and in safe school rehabilitation using Government’s DAK.
Source: CLR
Indicator: Community-based settlement reconstruction incorporated as a Government program Baseline: No Target: Yes
Community-based housing reconstruction is adopted as standard mechanism for Government funded post disaster reconstruction. GoI established a standing multi-donor trust fund (IMDFF-DR) aimed to institutionalize community-based housing reconstruction as a program under Ministry of Public Works and Public Housing. The World Bank was appointed to manage a funding window under the IMDFF-DR called the Disaster Management Fund/DMF to provide grant financing to strengthen the community-based housing reconstruction
Source: CLR
Annexes
33
CLR Review Independent Evaluation Group
Annex Table 2: Planned and Actual Lending for Indonesia, FY13-15
Project ID Project name Proposed
FY Approval
FY Closing
FY Proposed Amount
Approved IBRD
Amount
Approved IDA
Amount
Outcome Rating
Project Planned Under CPS
P123994 Power Transmission and Distribution II
FY13 2014 2019 327 325 LIR: MS
P126162 Institutional, Tax Administration, Social and Investment (INSTANSI) DPL
FY13 2013 300 300 Not
Applicable
P124006 Connectivity DPL FY13 2013 2013 100 100 Not
Applicable
P130150 Financial Sector and Investment Climate Reform and Modernization (FIRM) DPL
FY13 2013 2014 100 100 Not
Applicable
P118916 Infrastructure Guarantee Fund FY13 2013 2018 30 30 LIR: S
P117243
Sustainable management of Agricultural Research and Technology Dissemination Project (SMARTD)
FY13 2013 2018 80 80 LIR: MU
P121842 Research and Innovation in Science & Technology Project (RISET)
FY13 2013 2021 95 95 LIR: MU
P125405
National Community Empowerment Program in Urban Areas for 2012-2014 Project (PNPM-Rural IV)
2015 P113341 ID-Health Professional Education Quality
67.1 SATISFACTORY MODERATE
Total 2,387.7
Source: AO Key IEG Ratings as of 9/3/15
Annexes
45
CLR Review Independent Evaluation Group
Annex Table 6: IEG Project Ratings for Indonesia & Comparators, FY13-15
Region Total
Evaluated ($M)
Total Evaluated
(No)
Outcome % Sat ($)
Outcome % Sat (No)
RDO % Moderate or
Lower Sat ($)
RDO % Moderate or
Lower Sat (No)
Indonesia 2,387.7 22 48.8 54.5 72.2 54.5
EAP 9,135.1 91 78.4 68.1 75.0 62.6
World 38,735.8 501 84.7 70.5 65.6 48.8
Source: WB AO as of 9/3/15 * With IEG new methodology for evaluating projects, institutional development impact and sustainability are no longer rated separately
Annex Table 7 Portfolio Status for Indonesia and Comparators, FY13-15
Fiscal year 2013 2014 2015 Average
Indonesia
# Project 62 49 32 48
# Project At Risk 5 9 9 8
% Project At Risk 8.1 18.4 28.1 18.2
Net Comm Amt 7,803.0 6,763.9 6,461.7 7,009.5
Comm At Risk 803.0 1,814.5 2,020.0 1,545.8
% Commit at Risk 10.3 26.8 31.3 22.8
EAP
# Project 351 354 344 350
# Project At Risk 66 65 70 67
% Project At Risk 18.8 18.4 20.3 19.2
Net Comm Amt 30,542.3 31,852.5 32,386.0 31,593.6
Comm At Risk 5,089.2 5,270.3 6,412.3 5,590.6
% Commit at Risk 16.7 16.5 19.8 17.7
World
# Project 1,964 2,048 2,022 2,011
# Project At Risk 414 412 444 423
% Project At Risk 21.1 20.1 22.0 21.1
Net Comm Amt 176,202.6 192,610.1 201,045.2 189,952.6
Comm At Risk 40,805.6 40,933.5 45,987.7 42,575.6
% Commit at Risk 23.2 21.3 22.9 22.5
Source: WB AO as of 9/3/15
Annexes
46
CLR Review Independent Evaluation Group
Annex Table 8: Disbursement Ratio for the Indonesia, FY13-15
Fiscal Year 2013 2014 2015 Overall Result
Indonesia
Disbursement Ratio (%) 17.17
24.42
14.62
19.07
Inv Disb in FY 479.75
861.72
446.19
1,787.66
Inv Tot Undisb Begin FY 2,793.38
3,529.15
3,051.68
9,374.21
EAP
Disbursement Ratio (%) 19.64
19.85
20.48
20.00
Inv Disb in FY 3,232.76
3,539.60
3,670.26
10,442.62
Inv Tot Undisb Begin FY 16,461.68
17,830.82
17,923.58
52,216.09
World
Disbursement Ratio (%) 20.60
20.79
21.78
21.06
Inv Disb in FY 20,510.39
20,756.98
21,852.73
63,120.10
Inv Tot Undisb Begin FY 99,588.04
99,852.72
100,343.74
299,784.50
* Calculated as IBRD/IDA Disbursements in FY / Opening Undisbursed Amount at FY. Restricted to Lending Instrument Type = Investment. BW disbursement ratio table as of 9/3/15
Annex Table 9: Net Disbursement and Charges for Indonesia, FY13-15
Period Disb. Amt. Repay Amt. Net Amt. Charges Fees Net Transfer
Jul 2012 - Jun 2013 902,122,979
490,351,905
411,771,074
255,817,860
31,205,377
124,747,837
Jul 2013 - Jun 2014 1,497,682,064
422,655,957
1,075,026,107
233,645,034
30,861,599
810,519,474
Jul 2014 - Jun 2015 919,467,127
399,247,597
520,219,529
227,719,371
26,583,976
265,916,182
Report Total 3,319,272,170
1,312,255,459
2,007,016,710
717,182,266
88,650,952
1,201,183,493
Source: World Bank Client Connection 9/3/15
Annexes
47
CLR Review Independent Evaluation Group
Annex Table 10: Total Net Disbursements of Official Development Assistance and Official Aid for Indonesia
Development Partners 2011 2012 2013
Australia 447.46 606.4 549.33
Austria 0.6 1.18 2.13
Belgium -5.04 -4.1 -4.2
Canada 13.65 10.53 12.33
Czech Republic 0.02 0.03 ..
Denmark 22.53 13.84 7.87
Finland 2.73 3.74 4.46
France -42.5 -71.35 -31.23
Germany 74.72 33.28 36.21
Greece 0.03 0.03 ..
Ireland .. 0.03 0.12
Italy -13.4 -11.44 -0.53
Japan -633.73 -879.53 -820.93
Korea 24.29 37.23 31.5
Luxembourg 0.6 0.21 0
Netherlands 24.58 -2.42 -9.13
New Zealand 15.28 12.02 6.33
Norway 11.91 14.2 27.98
Poland 0.03 0.03 0.04
Portugal 0.41 0.12 0.22
Slovak Republic .. 0.03 ..
Spain -16.06 -9.38 -13.33
Sweden 6.2 7.12 4.64
Switzerland 11.11 12.93 24.74
United Kingdom -6.82 9.88 34.51
United States 185.98 131.16 152.16
DAC Countries, Total 124.58 -84.23 15.22
AsDB Special Funds 43.93 2.41 -85.53
Climate Investment Funds (CIF) .. .. 0.04
EU Institutions 131.89 134.55 67.16
GAVI .. 6.35 37.99
GEF 9.14 4.71 6.95
Global Green Growth Institute (GGGI) .. .. 1.79
Global Fund 79.33 55.07 96.28
IAEA 0.41 0.53 0.49
IBRD .. .. ..
IDA -30.2 -78.65 -107.52
Annexes
48
CLR Review Independent Evaluation Group
IFAD 38.21 9.61 13.16
IFC .. .. ..
Isl.Dev Bank 3.55 0.99 1.86
Montreal Protocol -0.9 .. 0.3
Nordic Dev.Fund -0.52 -0.62 -0.62
UNAIDS 1.09 0.73 1.23
UNDP 4.71 3.31 3.13
UNFPA 4.93 6.04 5.18
UNHCR .. 0.06 ..
UNICEF 5.65 4.92 6.41
WFP 3.59 1.18 0.57
WHO 3.73 4.36 3.8
Multilateral, Total 298.54 155.55 52.67
Cyprus 0.1 .. ..
Estonia .. .. ..
Hungary 0.11 0.01 0.02
Israel 0.1 .. ..
Kuwait (KFAED) -5.04 -4.97 -4.9
Russia .. 0.17 ..
Thailand 0.2 0.06 0.12
Turkey 0.51 0.83 3.51
United Arab Emirates 0.17 0.39 0.13
Non-DAC Countries, Total -3.85 -3.51 -1.12
Development Partners Total 419.27 67.81 66.77 Source: OECD Stat, [DAC2a] as of September 2, 2015
Annexes
49
CLR Review Independent Evaluation Group
Annex Table 11: List of IFC Investments in Indonesia Investments Committed in FY13-FY15
Project ID
Cmt FY
Project Status
Primary Sector Name
Grnfld Code
Project Size
Net Loan
Net Equity
Net Comm
32198 2015 Active Chemicals G 780,000 94,000 - 94,000
33212 2015 Active Finance & Insurance E 50,000 50,000 - 50,000
34215 2015 Active Finance & Insurance E 24,961 23,252 23,252
34329 2015 Active SME Finance E 300,000 300,000 - 300,000
34626 2015 Active SME Finance G 150,000 150,000 - 150,000
35833 2015 Active Transportation &
Warehousing E 19,696 19,646 19,646
36228 2015 Active Electric Power E 42 42 42
36507 2015 Active Industrial & Consumer
Products E 5,000 522 522
36558 2015 Active Industrial & Consumer
Products E 522 522 522
36876 2015 Active Finance & Insurance E 11,083 10,000 10,000
32311 2014 Active SME Finance E 75,000 75,000 - 75,000
32367 2014 Closed Mobile Telephony E 50,000 50,000 - 50,000
33018 2014 Active Construction &Real Estate G 50,000 10,076 - 10,076
33274 2014 Active Industrial & Consumer
Products G 7,000 7,000 7,000
33427 2014 Active Food & Beverages G 34,198 30,000 - 30,000
33853 2014 Active Hydroelectric Power E 292,750 79,018 7,500 86,518
34837 2014 Active Finance & Insurance E 250,000 30,000 - 30,000
34949 2014 Active Wind Power E 2,000 2,000 2,000
31705 2013 Active Microfinance E 3,932 3,932 3,932
32208 2013 Active Food & Beverages G 55,000 13,750 - 13,750
32778 2013 Closed Utilities: Water G 8,743 8,743 8,743