56
Flow, space and activity relationships I. Departmental Planning Manufacturing cells Clustering algorithms for cell formation
| Date post: | 06-May-2018 |
| Category: |
Documents |
| Upload: | truongquynh |
| View: | 215 times |
| Download: | 0 times |

Flow, space and activity relationships I.
Departmental Planning
Manufacturing cells Clustering algorithms for cell formation

Flow, Space and Activity Relationships
Flow◦ Flow into, within and from manufacturing facility
◦ Flow of materials, people, equipment, information, money, etc.
Space◦ The amount of space required in the facility
◦ Workstation specification, department specification and other space requirements
Activity relationships◦ Activity relationship is the key input in facilities
design
◦ Defined by flow relationships, organizational relationships, environmental relationships, process relationships and control relationships

Departmental planning
Production planning departments are collections of workstations to be grouped together during the facilities layout process
Combining workstations that perform similar functions:◦ Similar products or components◦ Similar processes
Classification of layouts based on product volume-variety:◦ Product layout (flow shop)◦ Fixed product layout◦ Group layout◦ Process layout (job shop)

Product layout (Flow shop)
Fixed product layout
Process layout (Job shop)
Group layout

Departmental planning
Product Layout Combining workstations
•Standardized•Large stable demand
•Product layout (flow shop)
•Combine all workstations required to produce the product
•Physically large•Awkward to move•Low sporadicdemand
•Fixed product layout
•Combine all workstations required to produce the product with the area required for staging the product
•Capable of being grouped into families of similar parts
•Group layout (product family
layout)
•Combine all workstations required to produce the family of products
•None of the above •Process layout (job shop)
•Combine identical workstations into departments•Combine similar departments

Production volume and product variety determines type of layout
Production
Volume
Production Variety
Product Layout Group Layout Process Layout
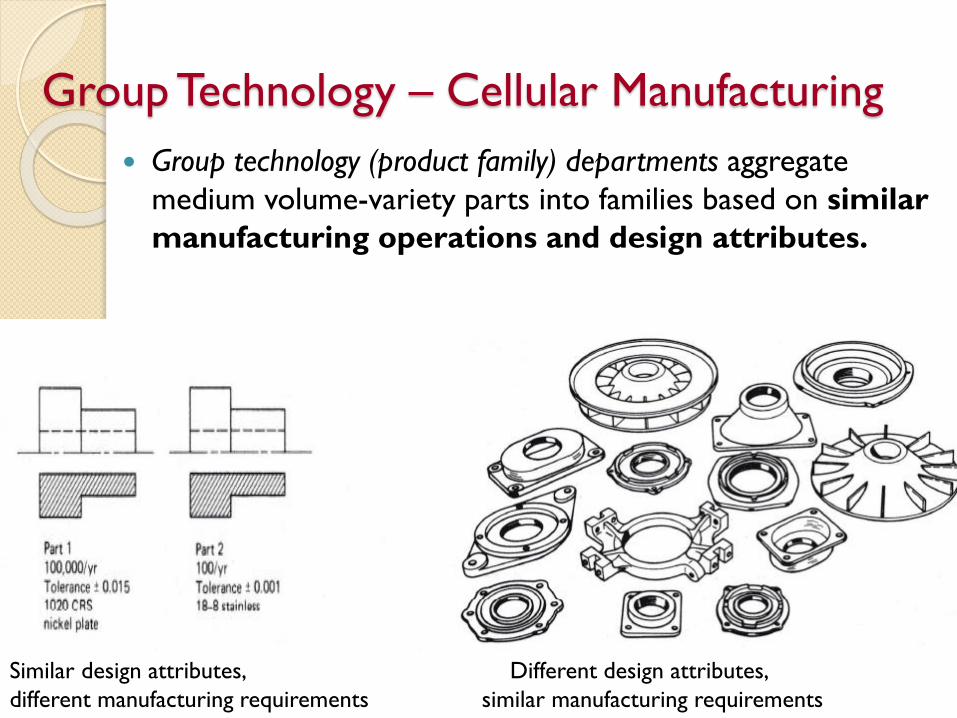
Group Technology – Cellular Manufacturing
Group technology (product family) departments aggregate
medium volume-variety parts into families based on similar
manufacturing operations and design attributes.
Similar design attributes, Different design attributes,
different manufacturing requirements similar manufacturing requirements
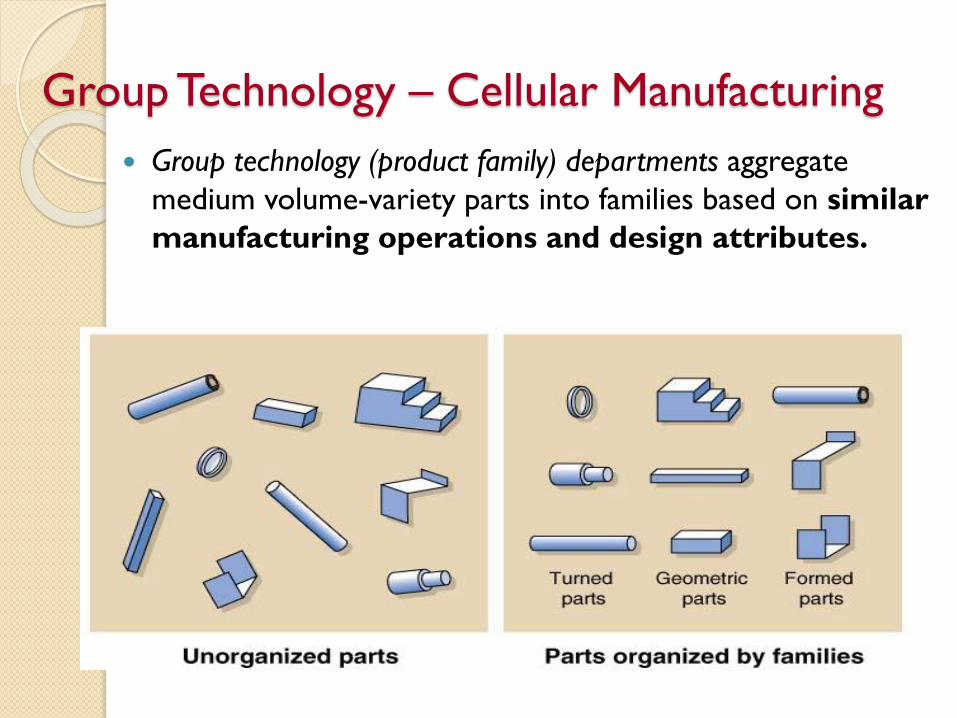
Group Technology – Cellular Manufacturing
Group technology (product family) departments aggregate
medium volume-variety parts into families based on similar
manufacturing operations and design attributes.

Group Technology – Cellular Manufacturing
Manufacturing cells group machines, employees, materials,
tooling and material handling and storage equipment to
produce families of parts.
Manufacturing cell operation needs minimum external support
Often designed, controlled and operated using JIT, TQM and TEI
Benefits of cell manufacturing:
◦ Reduction: inventories, space, paperwork, equipment,
transportation, etc.
◦ Simplification: communication, handling, scheduling, etc.
◦ Improvement: productivity, flexibility, quality, customer
satisfaction, etc.

• Evaluation of cell design decisionsSystem structure
System operation
Equipment and tooling investment Low
Equipment relocation cost Low
Inter and intra cell material handling cost Low
Floor space requirement Low
Extend to which parts are completed in a cell High
Flexibility High
Equipment utilization High
Work-in-process inventory Low
Queue lengths at each work station Low
Job throughput time Short
Job lateness Low
Cellular Manufacturing
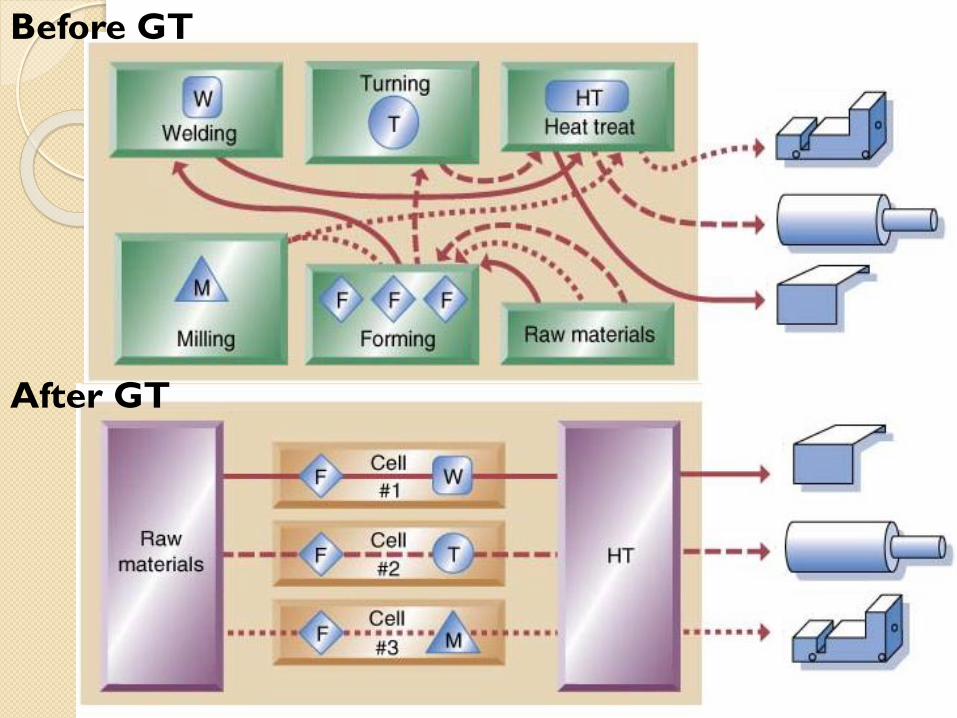
© Wiley 2007
Before GT
After GT

Before GT
After GT

Manufacturing cell forming
Successful implementation requires addressing selection, cell design, cell operation and cell control issues
Manufacturing cell forming:◦ Classification
◦ Production flow analysis
◦ Clustering methodologies
◦ Heuristic procedures
◦ Mathematical models
Cell forming is seldom the responsibility of a facility planner

Clustering methodologies
Group parts together
so that they can be
processed as a family
Links parts and
machines in
machine-part matrix
Machine-part matrix

Clustering methodologies
Group parts together
so that they can be
processed as a family
Links parts and
machines in
machine-part matrix
Machine-part matrix

Direct clustering algorithm (DCA)
1. Form machine-part matrix
2. Sum the 1s in each column & row
3. Order the rows in descending order
4. Order the columns in ascending order
5. Sort the columns (1 in the first row
moves left, then in the second row, etc.)
6. Sort the rows (1 in the first column
moves upward, then in the second
column, etc.)
7. Form sells
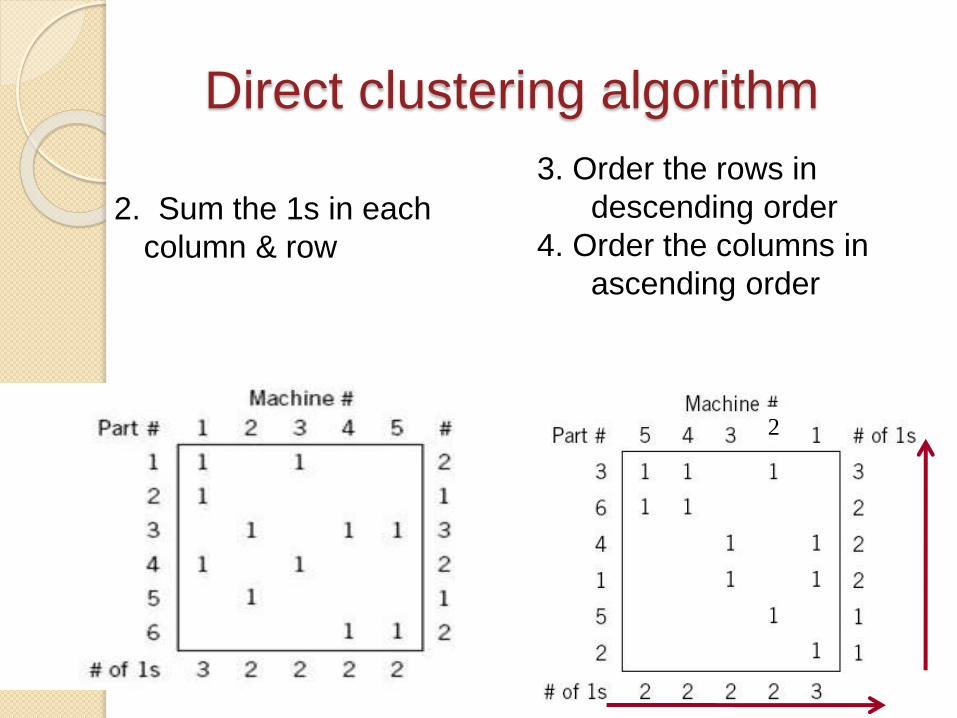
Direct clustering algorithm
2. Sum the 1s in each
column & row
3. Order the rows in
descending order
4. Order the columns in
ascending order
2

Direct clustering algorithm
5. Sort the columns (1 in the first row moves
the column to the left, then 1 in the second
row, etc.)
2

Direct clustering algorithm
6. Sort the rows (1 in the first column moves the
row upward, then 1 in the second column, etc.)

Direct clustering algorithm
7. Form cells
Cell #1:
◦ Machines 2,4 and 5
Cell #2:
◦ Machines 1and 3

Direct clustering algorithm “bottleneck machines”
Machine 2 which is needed for parts #3 and #5 creates conflicts!
DCA

Direct clustering algorithm “bottleneck machines”
Machine 2 which is needed for parts #3 and #5 creates conflicts!
What can we do?
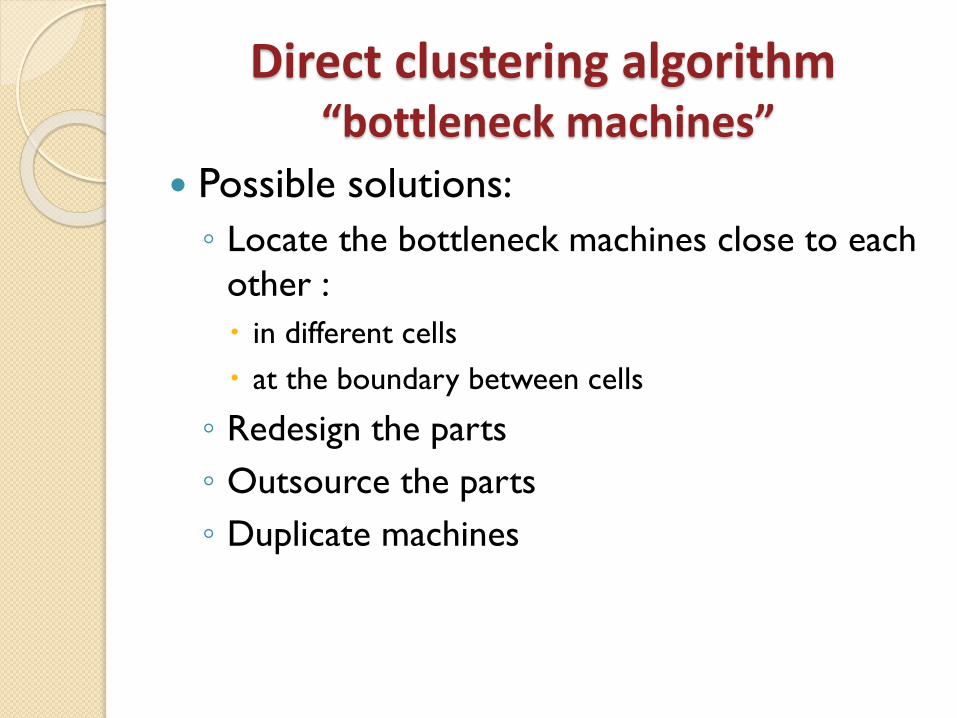
Direct clustering algorithm “bottleneck machines”
Possible solutions:
◦ Locate the bottleneck machines close to each
other :
in different cells
at the boundary between cells
◦ Redesign the parts
◦ Outsource the parts
◦ Duplicate machines

Direct clustering algorithm “bottleneck machines”
◦ Duplicating machines
4 2 3a 3b 1
Duplicated machine 2 Duplicated machine 3
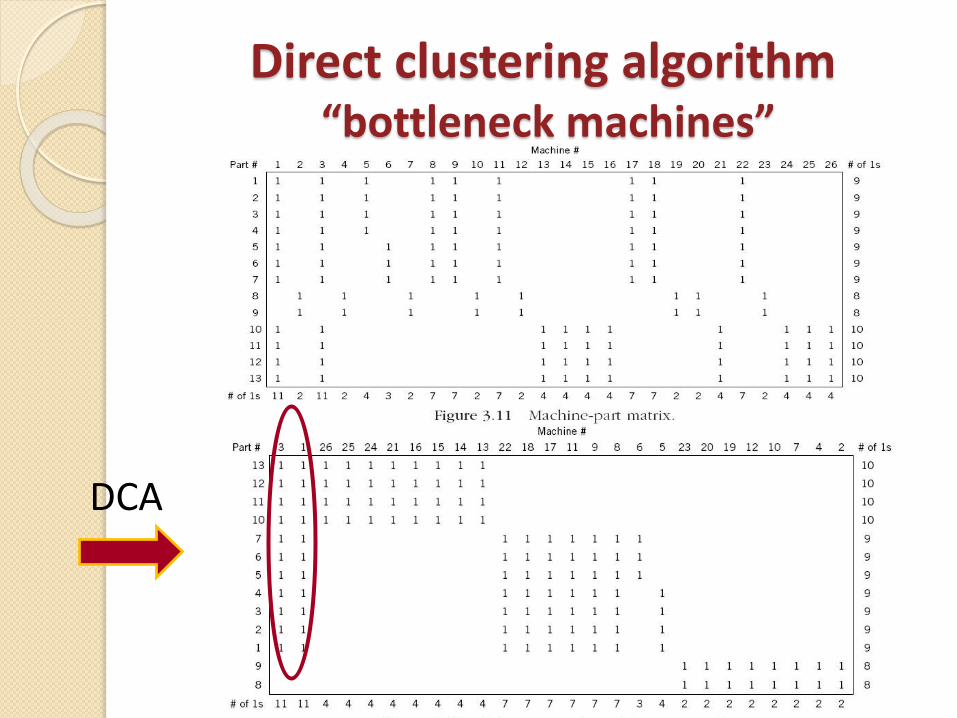
Direct clustering algorithm “bottleneck machines”
DCA

Create only 2 cells
Place the bottleneck machines at the boundary of the cells
Duplicate the bottleneck machines
Can the problem be solved by redesigning or outsourcing?

Binary Ordering Algorithm
Binary ordering algorithm (Rank ordering algorithm) considers the rows and columns as binary strings
Procedure: 1. Compute the decimal equivalent of the binary
strings for rows
2. Reorder the rows in decreasing order of their binary value
3. Compute the decimal equivalent of the binary strings for columns
4. Reorder the columns in decreasing order of their binary value
5. If the machine-part matrix is unchanged, then stop, else repeat

Binary Ordering Algorithm
Machine-part matrix

Binary Ordering Algorithm
1. Assign binary weights from right to left for components and calculate the decimal equivalent for each row (machine)
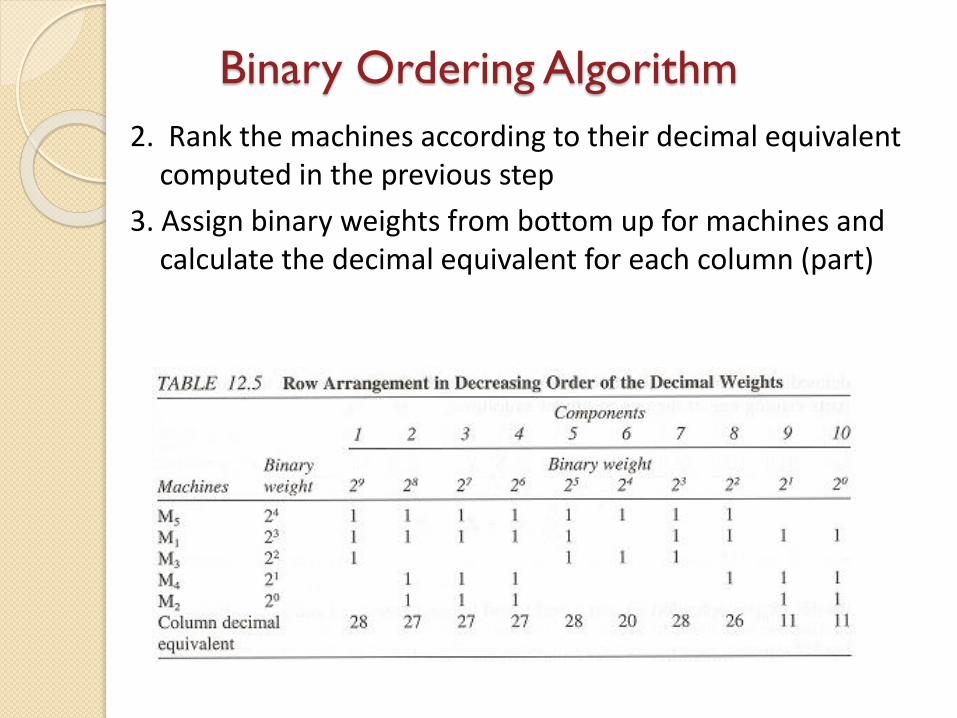
Binary Ordering Algorithm
2. Rank the machines according to their decimal equivalent computed in the previous step
3. Assign binary weights from bottom up for machines and calculate the decimal equivalent for each column (part)
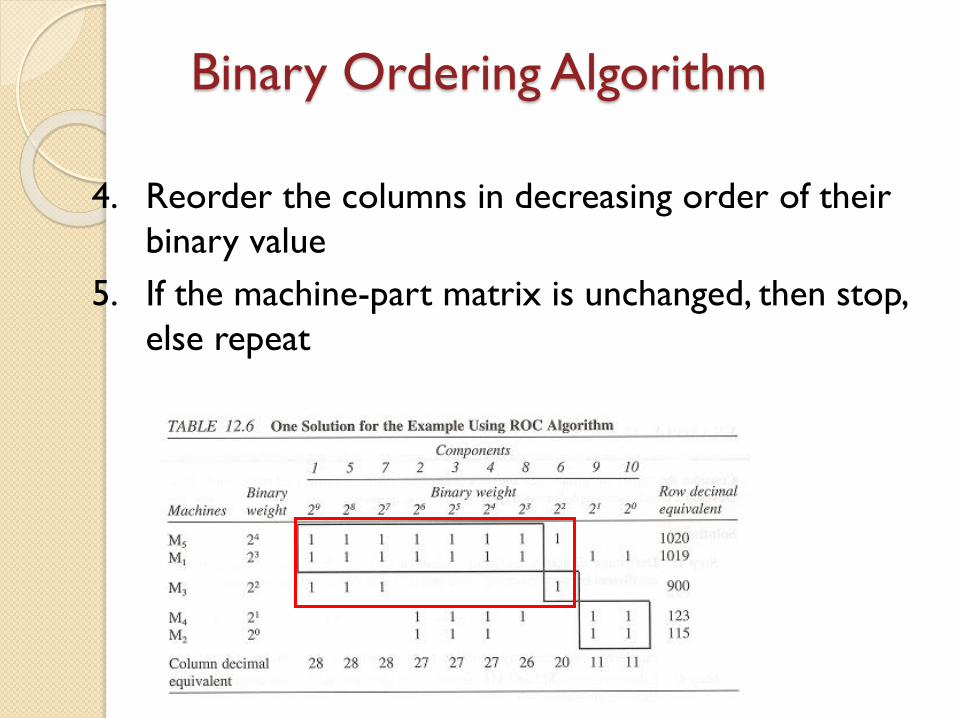
Binary Ordering Algorithm
4. Reorder the columns in decreasing order of their
binary value
5. If the machine-part matrix is unchanged, then stop,
else repeat

Cluster Identification algorithm
1. Select any row and cross it
2. For each crossed 1 make a vertical line
3. For each crossed 1 make a horizontal line
4. Repeat until all the 1s are crossed by a vertical line or by a horizontal line
5. Form a cell from all the machines and components which were crossed
6. Remove all the crossed elements (machines and components) and start again
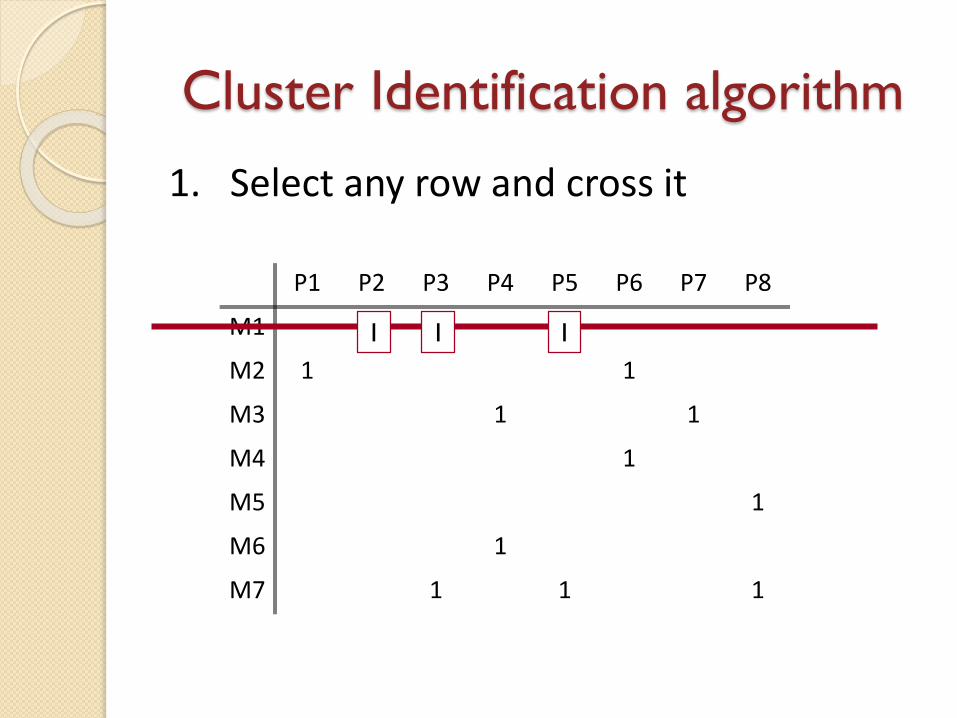
Cluster Identification algorithm
1. Select any row and cross it
P1 P2 P3 P4 P5 P6 P7 P8
M1 1 1 1
M2 1 1
M3 1 1
M4 1
M5 1
M6 1
M7 1 1 1
1 1 1
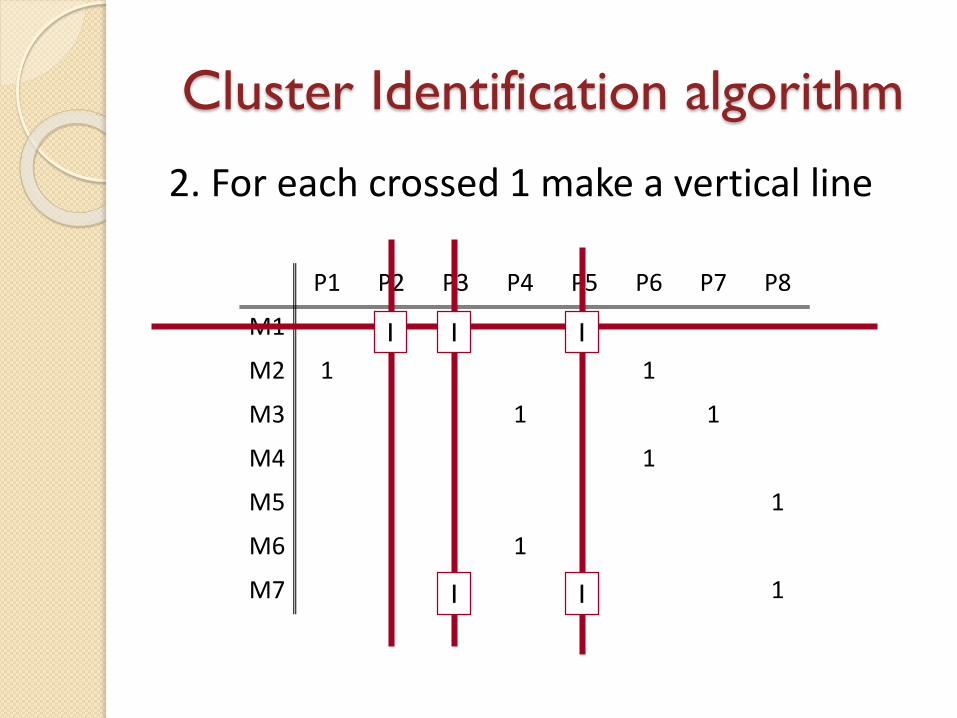
Cluster Identification algorithm
2. For each crossed 1 make a vertical line
P1 P2 P3 P4 P5 P6 P7 P8
M1 1 1 1
M2 1 1
M3 1 1
M4 1
M5 1
M6 1
M7 1 1 1
1 1 1
1 1

Cluster Identification algorithm
3. For each crossed 1 make a horizontal line
P1 P2 P3 P4 P5 P6 P7 P8
M1 1 1 1
M2 1 1
M3 1 1
M4 1
M5 1
M6 1
M7 1 1 11
1 1 1
1 1

Cluster Identification algorithm4. Repeat until all the 1s are crossed by a vertical
line or by a horizontal line
P1 P2 P3 P4 P5 P6 P7 P8
M1 1 1 1
M2 1 1
M3 1 1
M4 1
M5 1
M6 1
M7 1 1 1
1 1 1
1 1 1
1
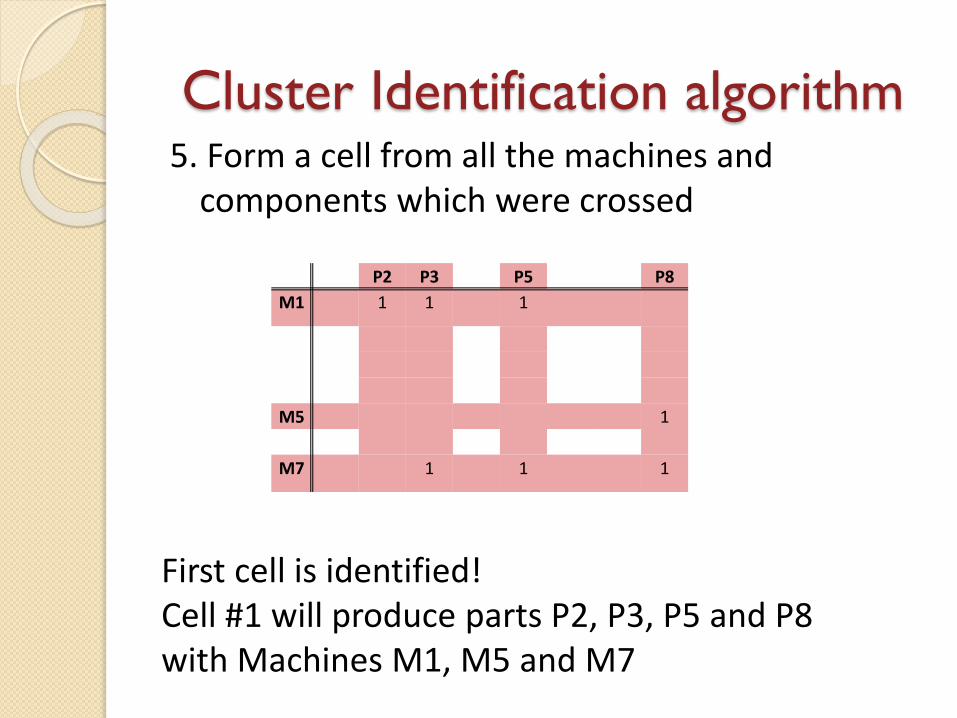
Cluster Identification algorithm5. Form a cell from all the machines and
components which were crossed
P2 P3 P5 P8
M1 1 1 1
M5 1
M7 1 1 1
First cell is identified!Cell #1 will produce parts P2, P3, P5 and P8 with Machines M1, M5 and M7
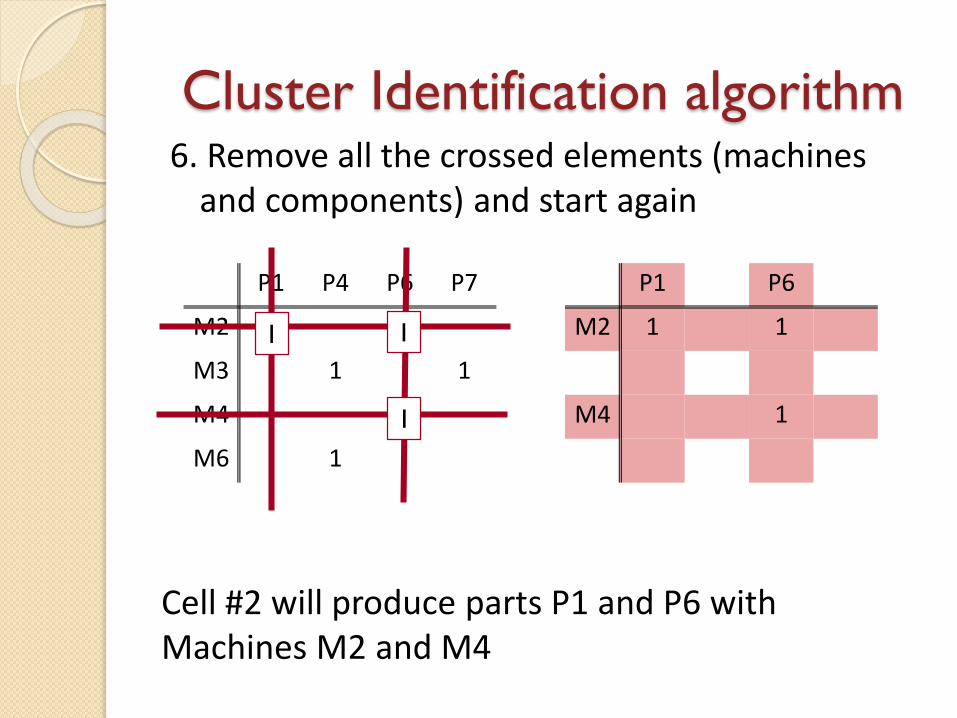
Cluster Identification algorithm6. Remove all the crossed elements (machines
and components) and start again
P1 P4 P6 P7
M2 1 1
M3 1 1
M4 1
M6 1
P1 P6
M2 1 1
M4 1
Cell #2 will produce parts P1 and P6 with Machines M2 and M4
1 1
1

Cluster Identification algorithm6. Remove all the crossed elements (machines
and components) and start again
P4 P7
M3 1 1
M6 1
P4 P7
M3 1 1
M6 1
Cell #3 will produce parts P4 and P7 with Machines M3 and M6
1
1
1
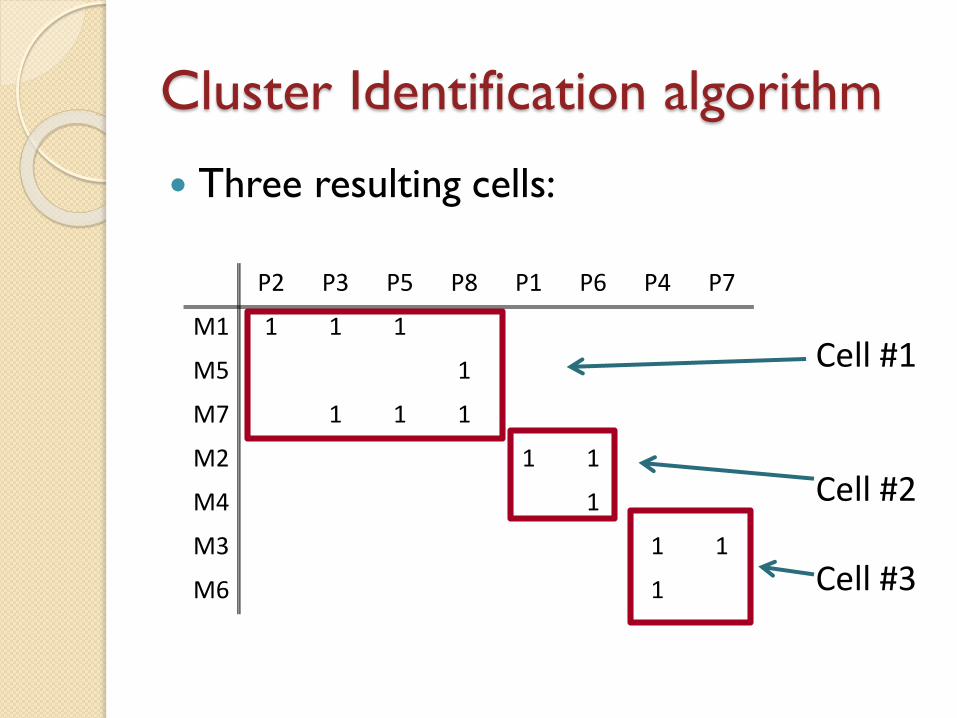
Cluster Identification algorithm
Three resulting cells:
P2 P3 P5 P8 P1 P6 P4 P7
M1 1 1 1
M5 1
M7 1 1 1
M2 1 1
M4 1
M3 1 1
M6 1
Cell #1
Cell #2
Cell #3

Cost Analysis Algorithm
In the real-world cases the solution will
rarely be straightforward. The algorithm
may determine all the parts to be
produced in one cell
Cost Analysis Algorithm allows to:
◦ determine the number of machines
◦ consider the cost of subcontracting
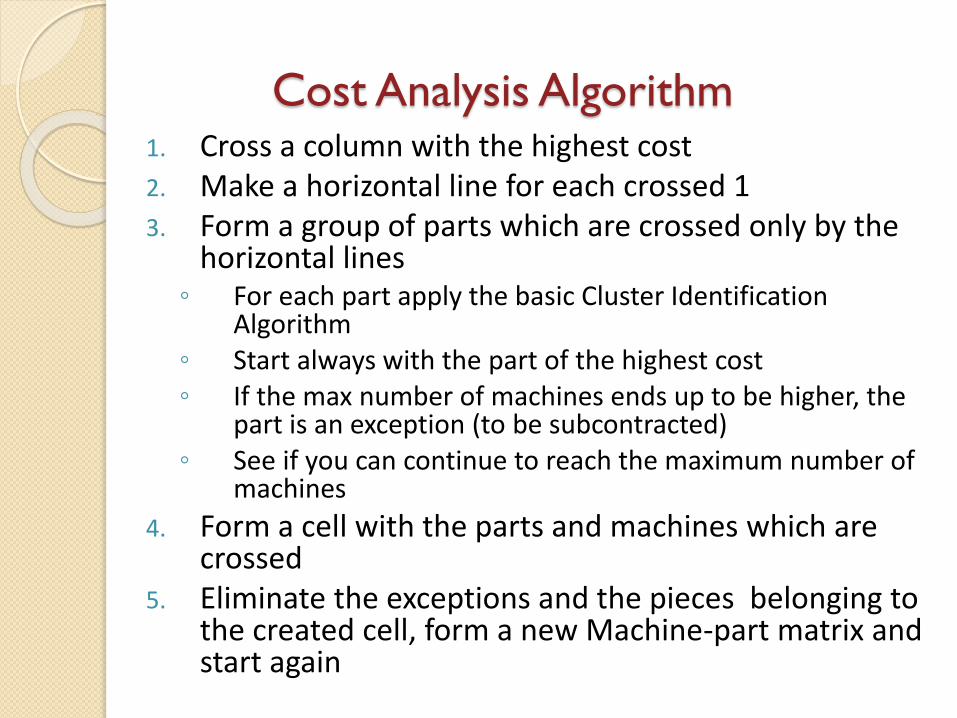
Cost Analysis Algorithm1. Cross a column with the highest cost2. Make a horizontal line for each crossed 13. Form a group of parts which are crossed only by the
horizontal lines ◦ For each part apply the basic Cluster Identification
Algorithm◦ Start always with the part of the highest cost◦ If the max number of machines ends up to be higher, the
part is an exception (to be subcontracted)◦ See if you can continue to reach the maximum number of
machines
4. Form a cell with the parts and machines which are crossed
5. Eliminate the exceptions and the pieces belonging to the created cell, form a new Machine-part matrix and start again
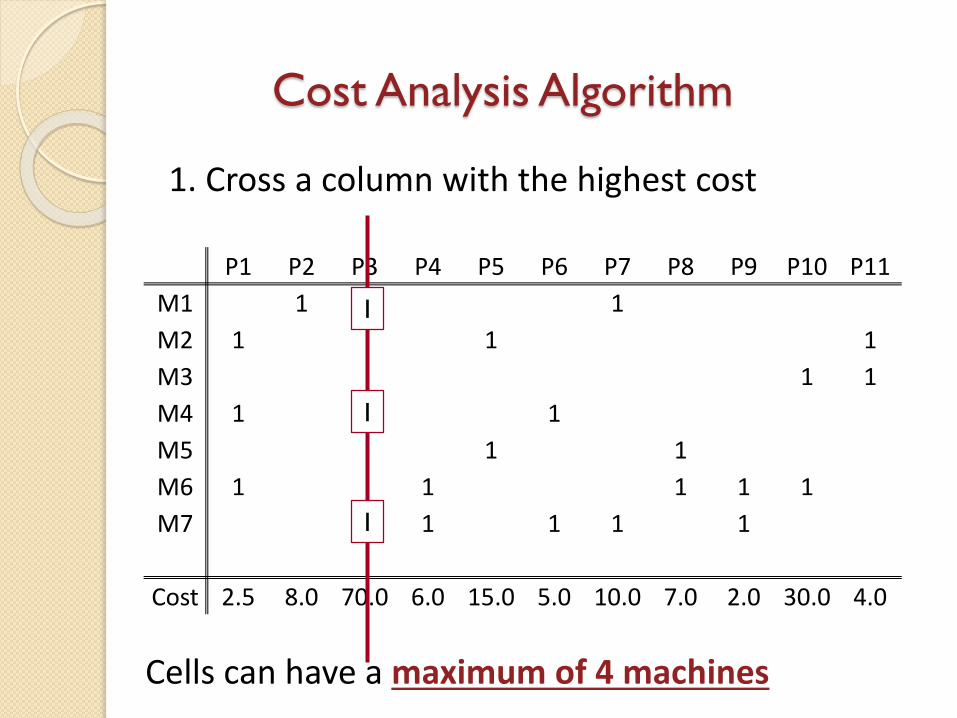
Cost Analysis Algorithm
P1 P2 P3 P4 P5 P6 P7 P8 P9 P10 P11
M1 1 1 1
M2 1 1 1
M3 1 1
M4 1 1 1
M5 1 1
M6 1 1 1 1 1
M7 1 1 1 1 1
Cost 2.5 8.0 70.0 6.0 15.0 5.0 10.0 7.0 2.0 30.0 4.0
1. Cross a column with the highest cost
Cells can have a maximum of 4 machines
1
1
1

Cost Analysis Algorithm
P1 P2 P3 P4 P5 P6 P7 P8 P9 P10 P11
M1 1 1 1
M2 1 1 1
M3 1 1
M4 1 1 1
M5 1 1
M6 1 1 1 1 1
M7 1 1 1 1 1
Cost 2.5 8.0 70.0 6.0 15.0 5.0 10.0 7.0 2.0 30.0 4.0
2. Make a horizontal line for each crossed 1
1
1
1
1 1
1 1 1 1
1 1

Cost Analysis Algorithm
P1 P2 P3 P4 P5 P6 P7 P8 P9 P10 P11
M1 1 1 1
M2 1 1 1
M3 1 1
M4 1 1 1
M5 1 1
M6 1 1 1 1 1
M7 1 1 1 1 1
Cost 2.5 8.0 70.0 6.0 15.0 5.0 10.0 7.0 2.0 30.0 4.0
3. Form a group of parts which are crossed only by the horizontal lines and for each part apply the basic algorithm
1
1
1
1 1
1 1 1 1
1 1

Cost Analysis Algorithm
P1 P2 P3 P4 P5 P6 P7 P8 P9 P10 P11
M1 1 1 1
M2 1 1 1
M3 1 1
M4 1 1 1
M5 1 1
M6 1 1 1 1 1
M7 1 1 1 1 1
Cost 2.5 8.0 70.0 6.0 15.0 5.0 10.0 7.0 2.0 30.0 4.0
3. Apply the basic algorithm for part P7 – P7 is ACCEPTED
1
1
1
1 1
1 1 1 1
1 1

Cost Analysis Algorithm
P1 P2 P3 P4 P5 P6 P7 P8 P9 P10 P11
M1 1 1 1
M2 1 1 1
M3 1 1
M4 1 1 1
M5 1 1
M6 1 1 1 1 1
M7 1 1 1 1 1
Cost 2.5 8.0 70.0 6.0 15.0 5.0 10.0 7.0 2.0 30.0 4.0
3. Apply the basic algorithm for part P2 – P2 is ACCEPTED
1
1
1
1 1
1 1 1 1
1 1
Cost Analysis Algorithm
P1 P2 P3 P4 P5 P6 P7 P8 P9 P10 P11
M1 1 1 1
M2 1 1 1
M3 1 1
M4 1 1 1
M5 1 1
M6 1 1 1 1 1
M7 1 1 1 1 1
Cost 2.5 8.0 70.0 6.0 15.0 5.0 10.0 7.0 2.0 30.0 4.0
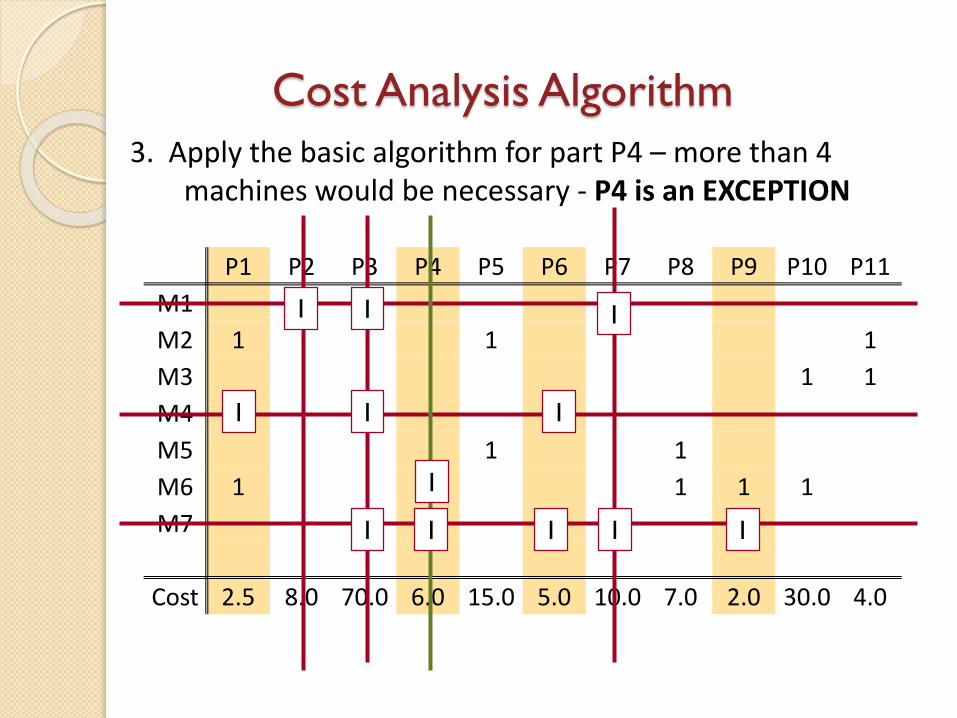
3. Apply the basic algorithm for part P4 – more than 4 machines would be necessary - P4 is an EXCEPTION
1
1
1
1 1
1 1 1 1
1 1
1
Cost Analysis Algorithm
P1 P2 P3 P4 P5 P6 P7 P8 P9 P10 P11
M1 1 1 1
M2 1 1 1
M3 1 1
M4 1 1 1
M5 1 1
M6 1 1 1 1 1
M7 1 1 1 1 1
Cost 2.5 8.0 70.0 6.0 15.0 5.0 10.0 7.0 2.0 30.0 4.0
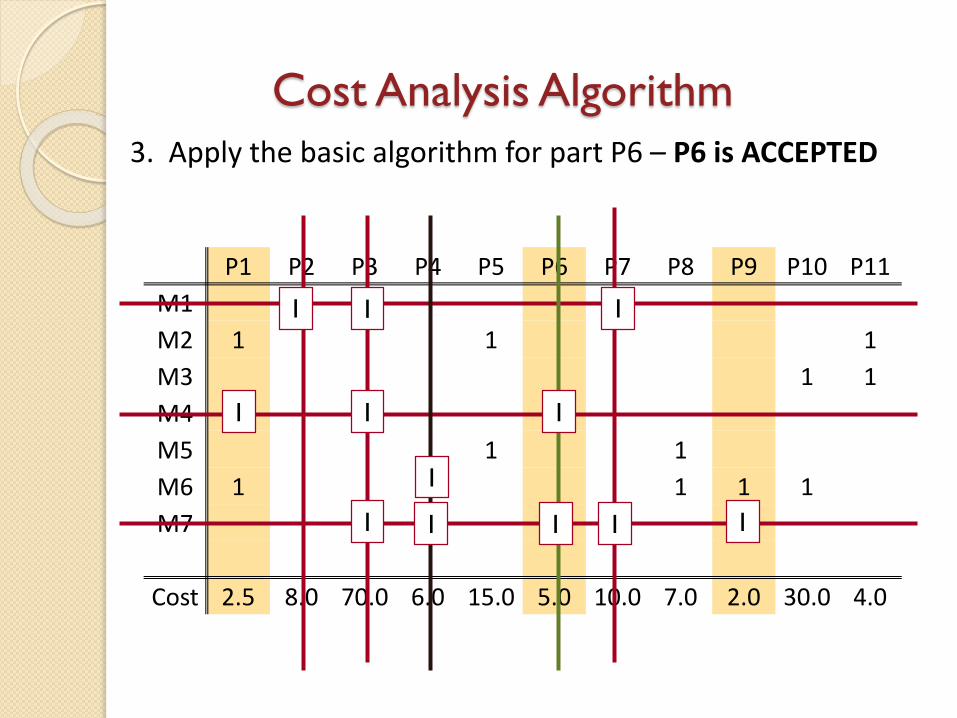
3. Apply the basic algorithm for part P6 – P6 is ACCEPTED
1
1
1
1 1
1 1 1 1
1 1
1

Cost Analysis Algorithm
P1 P2 P3 P4 P5 P6 P7 P8 P9 P10 P11
M1 1 1 1
M2 1 1 1
M3 1 1
M4 1 1 1
M5 1 1
M6 1 1 1 1 1
M7 1 1 1 1 1
Cost 2.5 8.0 70.0 6.0 15.0 5.0 10.0 7.0 2.0 30.0 4.0
3. Apply the basic algorithm for part P1 – more than 4 machines would be necessary - P1 is an EXCEPTION
1
1
1
1 1
1 1 1 1
1 1
1
1
1

Cost Analysis Algorithm
P1 P2 P3 P4 P5 P6 P7 P8 P9 P10 P11
M1 1 1 1
M2 1 1 1
M3 1 1
M4 1 1 1
M5 1 1
M6 1 1 1 1 1
M7 1 1 1 1 1
Cost 2.5 8.0 70.0 6.0 15.0 5.0 10.0 7.0 2.0 30.0 4.0
3. Apply the basic algorithm for part P9 – more than 4 machines would be necessary – P9 is an EXCEPTION
1
1
1
1 1
1 1 1 1
1 1
111
1

Cost Analysis Algorithm
P2 P3 P6 P7
M1 1 1 1
M4 1 1
M7 1 1 1
4. Form a cell with the parts and machines which are crossed
Cell #1 will produce parts P2, P3, P6 and P7 with Machines M1, M4 and M7

5. Eliminate the exceptions and the pieces belonging to the created cell, form a new Machine-part matrix and start again
Cost Analysis Algorithm
P5 P8 P10 P11
M2 1 1
M3 1 1
M5 1 1
M6 1 1
Cost 15 7 30 4
Cell #2 will produce parts P5, P8, P10 and P11 with Machines M2, M3, M5 and M6

Analysis of the exceptions: Parts P4, P1 and P9 – as discussed previously
Cost Analysis Algorithm
P2 P3 P7 P6 P11 P5 P8 P10 P1 P4 P9
M1 1 1 1
M7 1 1 1 1 1
M4 1 1 1
M2 1 1 1
M5 1 1
M3 1 1
M6 1 1 1 1 1
Cost 2.5 8.0 70.0 6.0 15.0 5.0 10.0 7.0 2.0 30.0 4.0
Two resulting cells:
Cell #1
Cell #2
Exceptions

Next lecture
Quiz
Next lecture
Activity relationships
Flow patterns
Flow planning
Measuring the flow
Space requirements


