1 CMA311S – NOTES 2010. UNIT 1: COST-VOLUME-PROFIT ANALYSIS Example 1: Tokio Ltd manufactures and sells only one product. The product is sold at N$10 per unit. Other details are as follows: Variable cost per unit N$5 Fixed cost per month N$20 000 Normal sales per month 6 000 units Required: 1. Calculate the contribution per unit. 2. Calculate the contribution ratio (P/V ratio). 3. Calculate the break-even point in units. 4. Calculate the break-even point in sales value (N$). 5. Calculate the margin of safety and the margin of safety ratio. 6. Draw a break-even graph which clearly indicates the break-even point. 7. Calculate the net profit per month if 5 000 units are sold. 8. Suppose the variable cost increases to N$6 per unit and the fixed cost decreases to N$18 000. 8.1 Calculate how many more units have to be sold in order to break-even. 8.2 Calculate the number of units to be sold in order to earn a net profit of N$7 500 per month. Solution to Example 1 1. Contribution per unit = Selling price per unit – variable cost per unit = N$10 – N$5 = N$5 2. Contribution ratio = Contribution per unit ÷ Selling price per unit = N$5 ÷ N$10 = 0,5 (or 50%) 3. Break-even point (in units) = Fixed cost ÷ Contribution per unit = N$20 000 ÷ N$5 = 4 000 units 4. Break-even point (in sales value) = Fixed cost ÷ Contribution ratio = N$20 000 ÷ 0,5 = N$40 000 OR Break-even point (in sales value) = Break-even units x Selling price per unit = 4 000 x N$10 = N$40 000 5. Margin of safety (in units) = Sales – Break-even sales = 6 000 – 4 000 = 2 000 units OR Margin of safety (in sales value) = Sales – Break-even sales = N$60 000¹ – N$40 000 = N$20 000 ¹ Normal sales = 6 000 units x N$10 Margin of safety ratio = (Margin of safety ÷ Sales) x 100% = (2 000 ÷ 6 000) x 100%
Transcript
1
CMA311S – NOTES 2010. UNIT 1: COST-VOLUME-PROFIT ANALYSIS Example 1: Tokio Ltd manufactures and sells only one product. The product is sold at N$10 per unit. Other details are as follows: Variable cost per unit N$5
Fixed cost per month N$20 000 Normal sales per month 6 000 units
Required: 1. Calculate the contribution per unit. 2. Calculate the contribution ratio (P/V ratio). 3. Calculate the break-even point in units. 4. Calculate the break-even point in sales value (N$). 5. Calculate the margin of safety and the margin of safety ratio. 6. Draw a break-even graph which clearly indicates the break-even point. 7. Calculate the net profit per month if 5 000 units are sold. 8. Suppose the variable cost increases to N$6 per unit and the fixed cost decreases to N$18 000. 8.1 Calculate how many more units have to be sold in order to break-even. 8.2 Calculate the number of units to be sold in order to earn a net profit of N$7 500 per month. Solution to Example 1
1. Contribution per unit = Selling price per unit – variable cost per unit = N$10 – N$5 = N$5 2. Contribution ratio = Contribution per unit ÷ Selling price per unit
= N$5 ÷ N$10 = 0,5 (or 50%)
3. Break-even point (in units) = Fixed cost ÷ Contribution per unit = N$20 000 ÷ N$5
= 4 000 units 4. Break-even point (in sales value) = Fixed cost ÷ Contribution ratio
= N$20 000 ÷ 0,5 = N$40 000 OR Break-even point (in sales value) = Break-even units x Selling price per unit = 4 000 x N$10 = N$40 000
5. Margin of safety (in units) = Sales – Break-even sales
= 6 000 – 4 000 = 2 000 units OR Margin of safety (in sales value) = Sales – Break-even sales = N$60 000¹ – N$40 000 = N$20 000
¹ Normal sales = 6 000 units x N$10
Margin of safety ratio = (Margin of safety ÷ Sales) x 100% = (2 000 ÷ 6 000) x 100%
2
= 33,3% OR
Margin of safety ratio = (Margin of safety ÷ Sales) x 100% = (N$20 000 ÷ N$60 000) x 100% = 33,3% 6. Graphical presentation of break-even point (break-even graph, break-even chart): Costs and revenue (N$’000)
Y
Profit area
60
Sales revenue
Break-even point Total cost line
40
Margin of Safety
Loss area Variable cost
20
Fixed cost
0 1 2 3 4 5 6 X
Units of Production and Sales (‘000) 7. Sales revenue (5 000 units x N$10) N$50 000 – Variable cost (5 000 units x N$5) N$25 000 = Contribution N$25 000 – Fixed cost N$20 000 = Net profit (net income) N$ 5 000 8.1 Break-even sales (in units) = Fixed cost ÷ Contribution per unit
= N$18 000 ÷ N$4 = 4 500 units New break-even point (4 500 units) less Previous break-even point (4 000 units)
= Difference (500 units) Thus: the company will have to sell 500 more units in order to break even.
8.2 If the company sells 4 500 units, the profit is zero (break-even point). However, for every additional unit in excess of 4 500, the profit is N$4. Therefore, in order to show a profit of N$7 500, the company will have to sell an additional 1 875 units per month (N$7 500 ÷ N$4).
Contribution chart This is an alternative presentation of the break-even point. In this case the variable cost line is drawn first. The fixed costs are represented by the difference between the total cost line and the variable cost line, with
3
the result that the total cost line is parallel to the variable cost line. The advantage of this form of presentation is that the total contribution is emphasised in the graph, and is represented by the difference between the total sales revenue line and the total variable cost line.
Cos
ts a
nd R
even
ue (N
$’00
0)
Y Profit area 60
Sales revenue
Break-even point Total cost
40
Loss area Fixed cost
Margin of
Safety
20
Variable cost
0 1 2 3 4 5 6 X
Units of Production and Sales (‘000) Profit-volume graph The break-even and contribution charts above do not highlight the profit or loss at different volume levels. To ascertain the profit or loss figures from a break-even chart, it is necessary to determine the difference between the total-cost and total-revenue lines. The profit-volume graph is a more convenient method of showing the impact of changes in volume on profit. The horisontal axis represents the various levels of sales volume, and the profits and losses for the period are recorded on the vertical scale. Y
20
Break-even point
Profit (N$’000)
Loss area Profit area
10
0
1 2 3 4 5 6 X
10
Units of Production and Sales
Loss (N$’000)
20 Y1
4
Expected profit after tax: Example 2 Easysteam Ltd manufactures and sells steam irons. The irons sell at N$190 per unit and the variable costs amount to N$81,70 per unit. The company’s fixed costs are N$108 000 per year and the current tax rate is 35%.
Required: Calculate what the company’s sales value (N$) must be if management expects a net income of N$125 000 after income tax.
Solution to Example 2 Fixed costs + [Expected after-tax profit ÷ (1 – Tax rate)] Required sales value = Marginal income ratio N$108 000 + [N$125 000 ÷ (1 – 0,35)] = N$108,30 ÷ N$190 N$108 000 + (N$97 500 ÷ 0,65) = 0,57 N$108 000 + N$192 308 = 0,57 N$300 308 = 0,57 = N$526 856 Activity 1: A summary of a manufacturing company’s budgeted profit statement for its next financial year, when it expects to be operating at 75% of capacity, is given below:
(N$) (N$) Sales 9 000 units at N$32 288 000 Less: Direct materials 54 000 Direct wages 72 000 Production overhead: Fixed 42 000 Variable 18 000 186 000 Gross Profit 102 000 Less: Administration, selling And distribution costs Fixed 36 000 Varying with sales volume 27 000 63 000 Net profit 39 000 Required: 1.1 Calculate the break-even point in units and in N$-value 1.2 Draw a contribution (profit-volume) graph which indicates what profit could be expected if the
company operated at full capacity. 1.3 It has been estimated that: 1.3.1 if the selling price per unit were reduced to N$28, the increased demand would utilise 90% of the
company’s capacity without any additional advertising expenditure; and
5
1.3.2 to attract sufficient demand to utilize full capacity would require a 15% reduction in the current selling price and a N$5 000 special advertising campaign.
You are required to present a statement showing the effect of the two alternatives compared with the original budget and to advise management which of the three possible plans should be adopted, i.e. the original budget plan or 10.4.1 above or 10.4.2 above.
1.4 An independent market research study shows that by spending N$15 000 on a special advertising
campaign, the company could operate at full capacity and maintain the selling price at N$32 per unit.
You are required to: 10.4.1 advise management whether this proposal should be adopted; and 10.4.2 state any reservations you might have.
Variable cost per unit = N$171 000 ÷ 9 000 units = N$19 per unit Fixed costs = N$42 000 + N$36 000 = N$78 000
Break-even point (in units) = Fixed cost ÷ Contribution per unit = N$78 000 ÷ (N$32 – N$19) = N$78 000 ÷ N$13 = 6 000 units Break-even point (in sales value) = B/E point in units x Selling price per unit = 6 000 x N$32 = N$192 000
1.2 Profit-volume graph 75% Capacity = Sales of N$288 000 (9 000 units) → This was given in the question N$288 000 (9 000 units) 100
Break-even point At sales of N$192 000 Profit area
Profit (N$’000)
80
Loss area
40
0
40
3 000 6 000 9 000 12 000 X Units of Production and Sales
Loss (N$’000)
80
Fixed cost = N$78 000
120
Y1
1.3.1 Proposal 1: Total contribution = (90% x 12 000 units x N$9) = N$97 200 Less fixed overheads = N$78 000 Net income = N$19 200 1.3.2 Proposal 2: Total contribution = (12 000 units x N$8,20) = N$98 400 Less fixed overheads = (N$78 000 + N$5 000) = N$83 000 Net income = N$15 400
Recommendation: Based on the above information management should adopt the original budget plan as this yields the largest profit.
1.4.1 Contribution = 12 000 units x N$13 = N$156 000 Less fixed costs (N$78 000 + N$15 000) = N$ 93 000 Net income = N$ 63 000
Recommendation: This proposal yields the largest profit and therefore should be accepted.
1.4.2 However, there is a risk that the estimated sales demand will not be obtained and this could result in a reduced profit since the N$15 000 will be a committed cost irrespective of the outcome. Management would need some assurance that the market research company is reliable and has a good track record.
7
Cost-volume-profit analysis: Multi-products In today’s complex production times no company produces a single product only. In other words, the previous discussions based on a single product were too simplistic. Often companies produce and sell more than one product. Breakeven analysis under these circumstances is somewhat more complex than discussed earlier in this chapter. The reason is that different products will have different selling prices, different costs, and different contribution margins. Consequently the breakeven point will depend on the mix in which the different products are sold.
Businesses try to achieve the combination (or mix) that will yield the greatest amount of profits. Most companies produce several products and often these products are not equally profitable. Where this is true, profits will depend to some extent on the company’s sales mix. Profits will be greater if high-margin rather than low-margin items make up a relatively large proportion of total sales.
Changes in sales mix can cause interesting variations in a company’s profits. A shift in the sales mix from high margin items to low margin items can cause total profits to decrease even though total sales may increase. Conversely, a shift in the sales mix from low margin items to high margin items can cause total profits to increase even though total sales may decrease. It is one thing to achieve a particular sales volume; it is quite a different thing to sell the most profitable mix of products!
Calculation of break-even point in units You will recall from the previous paragraphs above that the break-even point in units is calculated as follows: Total fixed costs Break-even point in units = Contribution per unit When there is more than one product, the formula is adjusted as follows:
Total fixed costs Break-even point in units = Average contribution per unit
Example 3 Hangana Ltd supplied the following information regarding its three products:
Product A Product B Product C Sales in units Selling price per unit Variable cost per unit
2 000 N$20 N$16
3 000 N$50 N$36
5 000 N$40 N$28
Total fixed cost = N$77 000 Required: Compute the company’s break-even point in units.
8
Solution to Example 3 Compute the average contribution per unit. This can be done in one of the following two ways: Method 1:
Product
Sales price per unit
– Variable cost per unit
= Contribution per unit
x Number of units
= Total contribution
A B C
N$20 N$50 N$40
N$16 N$36 N$28
N$ 4 N$14 N$12
2 000 3 000
5 000
N$ 8 000 N$ 42 000 N$ 60 000
Totals 10 000 N$110 000 Average contribution per unit (N$110 000 ÷ 10 000 units) N$11,00
Method 2:
Product Contribution per unit x Sales mix¹ = Weighted contribution² A B C
Average contribution per unit N$11,00 ¹ The sales mix is the proportion of each product’s sales in units to total sales in units. ² Each product has a different contribution, and it is necessary to reduce the separate contributions to a
weighted average contribution of all products. Note that the average contribution is not simply the sum of N$4, N$14 and N$12 divided by 3, because the products are not sold in equal proportions. The contribution of product C, which constitutes 50% of unit sales, must be weighted more heavily than the contributions of products A and B. The weighted average contribution, therefore, represents the contribution of all separate products with a specific sales mix. The break-even point can now be computed: Fixed costs Break-even point in units = Average contribution per unit N$77 000 = N$11 = 7 000 units Activity 2 Chem-Sol Ltd produces and sells two chemicals called Solvex and Dysolve. The following data regarding these two products is available:
Solvex Dysolve Selling price per unit Variable cost per unit Sales mix
N$10 N$ 7 60%
N$20 N$12 40%
Total fixed cost = N$29 700 Required: 2.1 Compute the company’s break-even point in units.
9
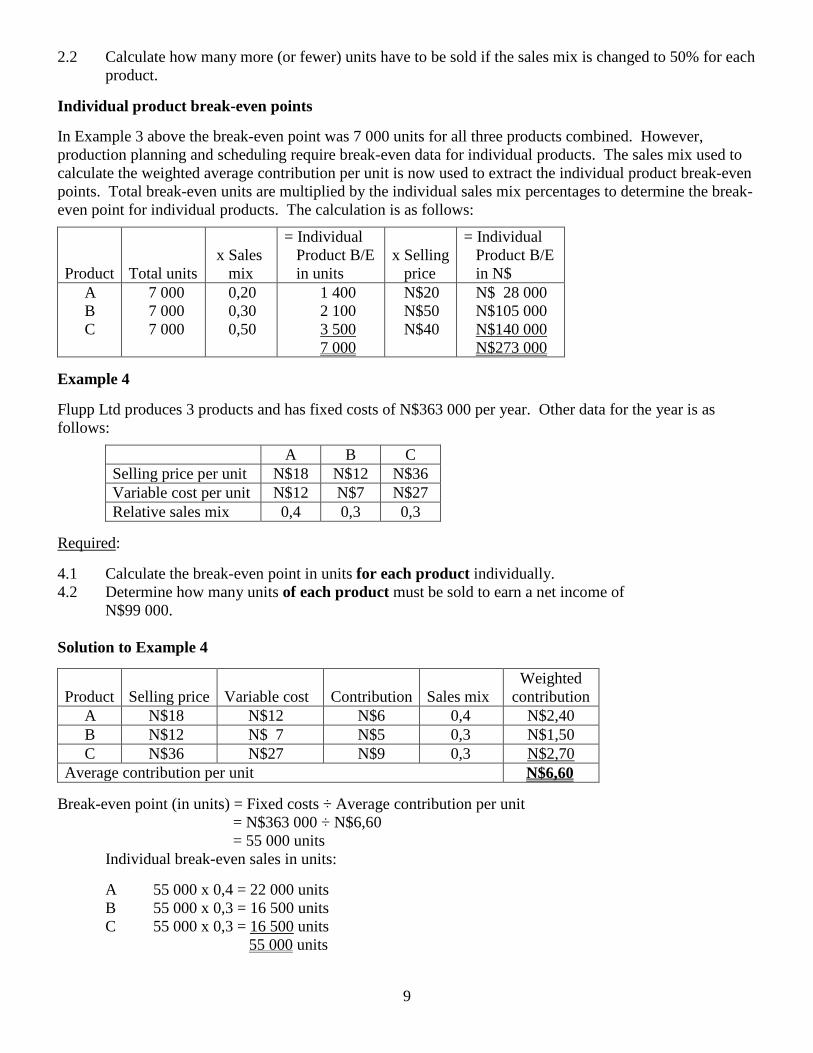
2.2 Calculate how many more (or fewer) units have to be sold if the sales mix is changed to 50% for each product.
Individual product break-even points In Example 3 above the break-even point was 7 000 units for all three products combined. However, production planning and scheduling require break-even data for individual products. The sales mix used to calculate the weighted average contribution per unit is now used to extract the individual product break-even points. Total break-even units are multiplied by the individual sales mix percentages to determine the break-even point for individual products. The calculation is as follows:
Product
Total units
x Sales mix
= Individual Product B/E in units
x Selling price
= Individual Product B/E in N$
A B C
7 000 7 000 7 000
0,20 0,30 0,50
1 400 2 100
3 500 7 000
N$20 N$50 N$40
N$ 28 000 N$105 000 N$140 000 N$273 000
Example 4 Flupp Ltd produces 3 products and has fixed costs of N$363 000 per year. Other data for the year is as follows:
A B C Selling price per unit N$18 N$12 N$36 Variable cost per unit N$12 N$7 N$27 Relative sales mix 0,4 0,3 0,3
Required: 4.1 Calculate the break-even point in units for each product individually. 4.2 Determine how many units of each product must be sold to earn a net income of
N$99 000. Solution to Example 4 Product
Selling price
Variable cost
Contribution
Sales mix
Weighted contribution
A N$18 N$12 N$6 0,4 N$2,40 B N$12 N$ 7 N$5 0,3 N$1,50 C N$36 N$27 N$9 0,3 N$2,70 Average contribution per unit N$6,60
Break-even point (in units) = Fixed costs ÷ Average contribution per unit = N$363 000 ÷ N$6,60 = 55 000 units
Individual break-even sales in units: A 55 000 x 0,4 = 22 000 units B 55 000 x 0,3 = 16 500 units C 55 000 x 0,3 = 16 500 units 55 000 units
10
4.2 Required sales = (Fixed costs + Expected profit) ÷ Average contribution per unit = (N$363 000 + N$99 000) ÷ N$6,60 = 70 000 units Individual break-even sales in units: A 70 000 x 0,4 = 28 000 units B 70 000 x 0,3 = 21 000 units C 70 000 x 0,3 = 21 000 units 70 000 units Activity 3 Dynatone Tape Company produces two types of blank recording tapes that it distributes through wholesalers or sells directly to large retailers. The following data apply to these products:
Required: 3.1 Calculate the break-even point in units and in N$ for each product individually. 3.2 Calculate the number of units and sales value in N$ of each product necessary to achieve a net
income of N$600. Calculation of break-even point in sales value In the previous paragraphs above you learned that the break-even point in sales value could be determined in two different ways:
Break-even point in sales value = Break-even point in units x Selling price per unit OR Total fixed costs Break-even point in sales value = Contribution ratio In a multi-product situation, the break-even point in sales value can also be calculated in two different ways by adjusting these two formulas.
• By using the weighted average selling price per unit One way of calculating the break-even point in sales value is to compute the weighted average selling price per unit and then applying the following formula:
Break-even sales value = Break-even quantity x Weighted average selling price per unit
Example 5 Refer to Example 3 above. Required: Compute the break-even point in sales value by first computing the weighted average selling price per unit.
11
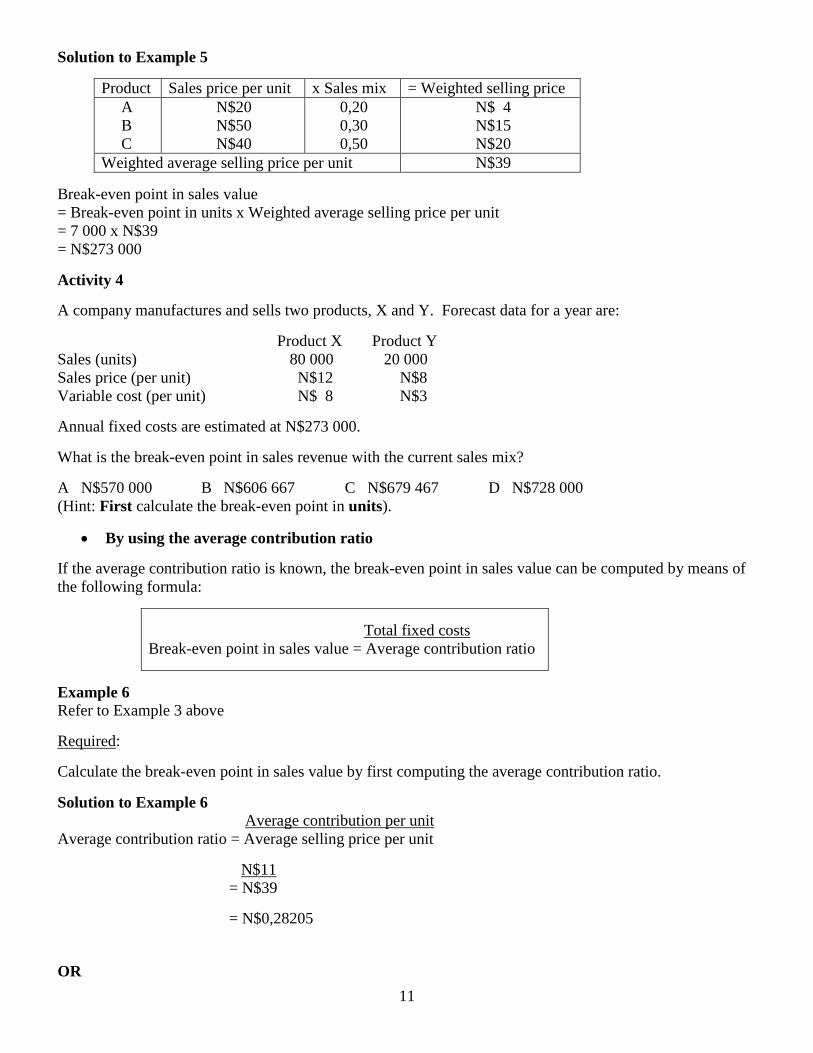
Solution to Example 5
Product Sales price per unit x Sales mix = Weighted selling price A B C
N$20 N$50 N$40
0,20 0,30 0,50
N$ 4 N$15 N$20
Weighted average selling price per unit N$39 Break-even point in sales value = Break-even point in units x Weighted average selling price per unit = 7 000 x N$39 = N$273 000 Activity 4 A company manufactures and sells two products, X and Y. Forecast data for a year are: Product X Product Y Sales (units) 80 000 20 000 Sales price (per unit) N$12 N$8 Variable cost (per unit) N$ 8 N$3 Annual fixed costs are estimated at N$273 000. What is the break-even point in sales revenue with the current sales mix? A N$570 000 B N$606 667 C N$679 467 D N$728 000 (Hint: First calculate the break-even point in units).
• By using the average contribution ratio If the average contribution ratio is known, the break-even point in sales value can be computed by means of the following formula:
Total fixed costs Break-even point in sales value = Average contribution ratio
Example 6 Refer to Example 3 above Required: Calculate the break-even point in sales value by first computing the average contribution ratio. Solution to Example 6 Average contribution per unit Average contribution ratio = Average selling price per unit N$11 = N$39 = N$0,28205
OR
12
Product Units x Sales price = Sales revenue – Variable cost = Contribution A B C
2 000 3 000 5 000
N$20 N$50 N$40
N$ 40 000 N$150 000 N$200 000
N$ 32 000 N$108 000 N$140 000
N$ 8 000 N$ 42 000 N$ 60 000
Totals 10 000 N$390 000 N$280 000 N$110 000 Total contribution Average contribution ratio = Total sales N$110 000 = N$390 000 = 0,28205 Fixed costs Break-even point in sales value = Average contribution ratio N$77 000 = 0,28205 = N$273 000 Activity 5 Refer to Activity 3 above. Repeat the question without first calculating the break-even point in units. Activity 6 H Limited manufactures and sells two products, J and K. Annual sales are expected to be in the ratio of J:1 and K:3. Total annual sales are planned to be N$420 000. Product J has a contribution to sales ratio of 40%, whereas that of product K is 50%. Annual fixed costs are estimated to be N$120 000. The budgeted break-even sales value (to the nearest N$1 000) is: A N$196 000; B N$200 000; C N$253 000; D N$255 000 E Cannot be determined from the above data. Activity 7 Z plc currently sells products Aye, Bee and Cee in equal quantities and at the same selling price per unit. The contribution to sales ratio for product Aye is 40%; for product Bee it is 50% and the total is 48%. If fixed costs are unaffected by mix and are currently 20% of sales, the effect of changing the product mix to: Aye 40%; Bee 25%; Cee 35% is that the total contribution : total sales ratio changes to: A 27,4% B 45,3% C 47,4% D 48,4% E 68,4% Activity 8 PE Limited produces and sells two products, P and E. Budgets prepared for the next six months give the following information:
13
Product P per unit Product E per unit Selling price N$10,00 N$12,00 Variable costs: Production and selling
N$ 5,00
N$10,00
Common fixed costs: Production and selling (for six months) N$561 600
You are required in respect of the forthcoming six months to: 8.1 state what the break-even point in N$’s will be and the number of each product this figure represents
if the two products are sold in the ration 4P to 3E; 8.2 state the break-even point in N$’s and the number of products this figure represents if the sales mix
changes to 4P to 4E (ignore fractions of products); 8.3 advise the sales manager as to which product mix should be better, that in 8.1 or that in 8.2 above. Graphical presentation for multiple products In the paragraphs above you learned that the relationship between cost, volume and profit could be presented by a graph. You also learned that there are three types of graphs namely the break-even chart, the contribution chart and the profit-volume graph. When the details of more than one product have to be presented graphically, more lines have to be drawn and this can become very cumbersome as well as confusing. However, the easiest method is to make use of the Profit-volume graph. Example 7 An enterprise supplied the following information regarding its three products:
Required: Plot the above information on a Profit-volume graph and indicate the break-even sales clearly. Solution to Example 7 Step 1: Calculate the contribution ratio of each product separately and rank them in order from the largest to the smallest: Product A Product B Product C Contribution ratio N$80 000 x 100% N$40 000 x 100% N$0 x 100% N$160 000 N$160 000 N$80 000 = 50% (0,5) = 25% (0,25) = 0% (0) Ranking = A, B, C.
14
Step 2: Determine the cumulative sales and cumulative profit figures in the order established in Step 1 above: A A + B A + B + C X-axis (Cumulative sales) N$0 N$160 000 N$320 000 N$400 000 Y-axis (Cumulative profit) (N$40 000) N$ 40 000 N$ 80 000 N$ 80 000 Step 3: The profit-volume graph can now be plotted as follows:
Net income N$’000
Product C
80 Profit area
70 Product B
60
50
40
30 Product A
20
10
0 50 100 150 200 250 300 350 400 450 500 550 600
-10 Volume (sales) units ‘000
-20 Break-even point (N$133 333,33)
-30
Loss area
-40 Fixed costs N$40 000
-50
15
Example 8 Nerina CC supplied the following information regarding their four products for the year 2005: 1. Sales, Variable costs and Contributions:
Product A Product B Product C Product D N$ N$ N$ N$
Sales Variable costs Contribution
200 000 205 000 (5 000)
400 000 350 000 50 000
200 000 175 000 25 000
100 000 70 000 30 000
2. Fixed costs: N$50 000 Required: 8.1 Plot the relevant information on a Profit-volume graph (P/V chart) and indicate the break-even sales
clearly. 8.2 Check the correctness of your answer by calculating the break-even sales with the aid of an
applicable formula. Solution to Example 8 Step 1: Calculation of individual as well as average contribution ratios:
Ranking = D, B, C, A. Step 2: Calculation of cumulative sales and cumulative net income: D D + B D + B + C D + B + C + A
N$ N$ N$ N$ N$ Sales (X-axis) 0 100 000 500 000 700 000 900 000 Net income (Y-axis) (50 000) (20 000) 30 000 55 000 50 000 Step 3: The profit-volume graph can now be plotted as follows:
Product A Product B Product C Product D Total Calculations N$ N$ N$ N$ N$ Sales Less Variable costs = Contribution Less Fixed costs = Net income
2. Fixed costs: N$50 000 Required: 10.1 Plot the relevant information on a Profit graph (P/V chart) and indicate the break-even sales clearly. 10.2 Check the correctness of your answer by calculating the break-even sales with the aid of an
applicable formula. Cost structure and the operating leverage factor The concept cost structure refers to the relative relationship between fixed and variable costs in an enterprise. During recent years the cost structure of manufacturing enterprises has changed in that costs have become more fixed as a result of automation. More machines and less manual labour are used in production. Enterprises with a high percentage fixed costs are more sensitive to changes in sales than enterprises with a low percentage fixed costs. For example, consider a firm with relatively high fixed costs (ie, relatively low variable costs and consequently a high profit-volume ratio). If sales should increase, profit will increase as a higher rate than for a firm with relatively low fixed costs, because of the high profit-volume ratio. However, if sales should drop, profit will also drop at a higher rate because, although variable costs will drop as well, the fixed costs (rent, salaries, etc) must still be paid.
18
Example 9 The following details regarding two different firms are available: Company A Company B N$ % N$ % Sales 60 000 100 60 000 100 – Variable cost 15 000 25 30 000 50 = Contribution 45 000 75 30 000 50 – Fixed cost 30 000 15 000 = Net profit 15 000 15 000 Required: 9.1 Calculate the increase in profit for each company if sales were to increase by 20%. 9.2 Calculate the decrease in profit for each company if sales were to decrease by 20%. Solution to Example 9
Sales – Variable cost = Contribution – Fixed cost = Net profit % increase in Profit
60 000 15 000 45 000 30 000 15 000
72 000 18 000 54 000 30 000 24 000 60%
60 000 30 000 30 000 15 000 15 000
72 000 36 000 36 000 15 000 21 000 40%
Conclusion: Company A has relatively high fixed costs. However, because it has a high P/V-ratio, profit will also increase at a higher rate than that of Company B.
Details
Company A Company B Presently 20% decrease Presently 20% decrease
N$ N$ N$ N$ Sales – Variable cost = Contribution – Fixed cost = Net profit % decrease in Profit
60 000 15 000 45 000 30 000 15 000
48 000 12 000 36 000 30 000 6 000 60%
60 000 30 000 30 000 15 000 15 000
48 000 24 000 24 000 15 000 9 000 40%
Conclusion: Company A has relatively high fixed costs. Therefore, because it has a high P/V-ratio, profit will also decrease at a higher rate than that of Company B. The operating leverage factor reflects how much influence a percentage change in sales volume has on net profit. A specific operating leverage factor is valid for a specific sales volume and changes as the sales volume changes. The operating leverage factor is calculated as follows:
Contribution Operating leverage factor = Net profit
19
The operating leverage is a management instrument that shows, relatively easily, the effect of a change in turnover on net income, without detailed statements having to be prepared. Example 10 The management of Shilongo Ltd supplied the following details:
N$ Sales 100 000 Variable cost 20 000 Fixed cost 40 000 Required: 10.1 Calculate the operating leverage factor 10.2 Use the operating leverage factor calculated in 10.1 above to compute the increase in net income if
sales were to increase by 15%. Solution to Example 10 10.1 Operating leverage factor = Contribution ÷ Net profit
= N$80 000 ÷ N$40 000 = 2
10.2 % increase in net income = % increase in sales x operating leverage factor = 15% x 2 = 30% Activity 11 The following income statement has been supplied to you: Sales revenue N$500 000 Less: Variable costs 300 000 = Contribution 200 000 Less: Fixed costs 150 000 = Net income 50 000 Required: 11.1 Show the firm’s cost structure by indicating the percentage of the firm’s revenue represented by each
item on the income statement. 11.2 Suppose the firm’s revenue declines by 15%. Use the contribution % to calculate the resulting
decrease in net income. 11.3 Compute the firm’s operating leverage factor when sales revenue is N$500 000. 11.4 Use the operating leverage factor to calculate the increase in net income resulting from a 20%
increase in sales revenue.
20
Activity 12 George Awarab recently opened a shop that specialises in car polish, a product that he has developed himself. He has just received a diploma in accounting and is anxious to apply the principles he has learned at the Polytechnic. As a first step, he has prepared the following analysis for his new store:
Sales price per tin N$40 Variable costs per tin 16 Marginal income per tin N$24 Fixed costs per year: Rent on building N$15 000 Depreciation on equipment 7 000 Selling expenses 20 000 Administrative expenses 18 000 Total fixed costs N$60 000 Required: 12.1 Determine how many tins of polish must be sold each year in order to break even. What does this
represent in total N$ sales? 12.2 George has decided that he must earn at least N$18 000 during the first year to justify his time and
effort. Determine how many tins of polish he must sell to reach this target profit. 12.3 George now has a part-time sales person working in the store. It will cost him an additional N$8 000
per year to convert the part-time position to a full-time post. George believes that the change would bring in an additional N$25 000 in sales each year. Determine whether he should convert the position. Use the incremental approach (do not prepare an income statement).
12.4 Refer to the original data. During the first year, the store sold only 3 000 tins of polish and reported the following operating results:
Sales (3 000 tins) N$120 000 Less variable costs 48 000 Marginal income 72 000 Less fixed costs 60 000 Net income N$ 12 000
12.4.1 Determine the store’s degree of operating leverage. 12.4.2 George is confident that with a more intense sales effort and with a more creative advertising
program he can increase sales by 50% next year. Determine what the expected percentage increase in net income would be (use the degree of operating leverage to compute your answer).
Cost-volume-profit analysis assumptions It is highly unlikely that selling price and variable costs per unit as well as fixed costs in total will remain constant for a given period. Therefore, certain assumptions are part of break-even analysis. These assumptions have given rise to criticism against CVP analysis. However, despite this criticism it remains a useful management tool for short-term decision-making and profit planning. Summary CVP analysis is a useful tool with which to do certain short-term investigations and make decisions. It puts an enterprise in a position to calculate its sales in order to make an expected profit level. It is therefore also useful in evaluating the effect of operating changes on profit. These changes include changes in the selling price and fixed costs. CVP analysis is liable to contain certain simplified assumptions that are necessary to make the analysis clear and understandable.
21
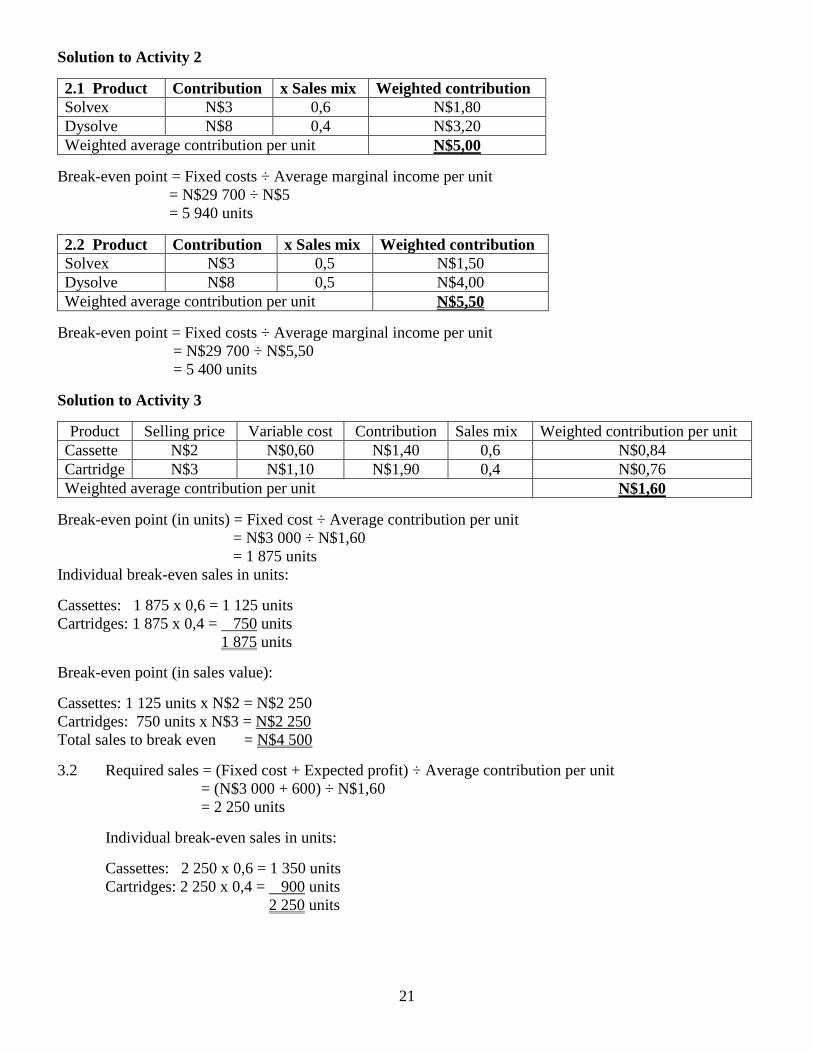
Solution to Activity 2
2.1 Product Contribution x Sales mix Weighted contribution Solvex N$3 0,6 N$1,80 Dysolve N$8 0,4 N$3,20 Weighted average contribution per unit N$5,00
Break-even point = Fixed costs ÷ Average marginal income per unit = N$29 700 ÷ N$5 = 5 940 units
2.2 Product Contribution x Sales mix Weighted contribution Solvex N$3 0,5 N$1,50 Dysolve N$8 0,5 N$4,00 Weighted average contribution per unit N$5,50
Break-even point = Fixed costs ÷ Average marginal income per unit = N$29 700 ÷ N$5,50 = 5 400 units Solution to Activity 3
Product Selling price Variable cost Contribution Sales mix Weighted contribution per unit Cassette N$2 N$0,60 N$1,40 0,6 N$0,84 Cartridge N$3 N$1,10 N$1,90 0,4 N$0,76 Weighted average contribution per unit N$1,60
Break-even point (in units) = Fixed cost ÷ Average contribution per unit = N$3 000 ÷ N$1,60 = 1 875 units Individual break-even sales in units: Cassettes: 1 875 x 0,6 = 1 125 units Cartridges: 1 875 x 0,4 = 750 units 1 875 units Break-even point (in sales value): Cassettes: 1 125 units x N$2 = N$2 250 Cartridges: 750 units x N$3 = N$2 250 Total sales to break even = N$4 500 3.2 Required sales = (Fixed cost + Expected profit) ÷ Average contribution per unit = (N$3 000 + 600) ÷ N$1,60 = 2 250 units
Individual break-even sales in units:
Cassettes: 2 250 x 0,6 = 1 350 units Cartridges: 2 250 x 0,4 = 900 units
2 250 units
22
Break-even point (in sales value):
Cassettes: 1 350 units x N$2 = N$2 700 Cartridges: 900 units x N$3 = N$2 700
Total sales to break even = N$5 400 Solution to Activity 4 Product Contribution per unit x Sales mix = Weighted contribution X Y
N$4 N$5
0,80 (80 000 ÷ 100 000) 0,20 (20 000 ÷ 100 000)
N$3,20 N$1,00
Weighted average contribution per unit N$4,20 Fixed costs Break-even point in units = Average contribution per unit N$273 000 = N$4,20 = 65 000 units Solution to Activity 5
Break-even point (in units) = Fixed cost ÷ Average marginal income = N$3 000 ÷ N$1,60 = 1 875 units Individual break-even sales in units: Cassettes: 1 875 x 0,6 = 1 125 units Cartridges: 1 875 x 0,4 = 750 units Break-even point (in sales value): Cassettes: 1 125 units x N$2 = N$2 250 Cartridges: 750 units x N$3 = N$2 250 Total sales to break even = N$4 500 5.2 Required sales = (Fixed cost + Expected profit) ÷ Average marginal income = (N$3 000 + 600) ÷ N$1,60 = 2 250 units
Individual break-even sales in units:
Cassettes: 2 250 x 0,6 = 1 350 units Cartridges: 2 250 x 0,4 = 900 units
Break-even point (in sales value):
Cassettes: 1 350 units x N$2 = N$2 700 Cartridges: 900 units x N$3 = N$2 700
Total sales to break even = N$5 400
23
Solution to Activity 6
Product Sales revenue x P/V ratio = Contribution J K
N$105 000¹ N$315 000²
0,4 0,5
N$ 42 000 N$157 500
Totals N$420 000 N$199 500 ¹ 1 N$420 000 4 X 1 ² 3 N$420 000 4 X 1 Total contribution Average contribution ratio = Total sales N$199 500 = N$420 000 = 0,475 Fixed costs Break-even point in sales value = Average contribution ratio N$120 000 = 0,475 = N$252 631,57 Therefore, answer = C Solution to Activity 7 The average contribution to sales ratio is 48% (given in question) 48% x 3 = 144% Therefore, Product Cee = 144% – (40% + 50%) = 54%
Weighted average contribution 0,474 (47,4%) Answer = C Solution to Activity 8
8.1 Product Contribution x Sales mix = Weighted contribution P N$5 4/7 2,857 E N$2 3/7 0,857
Weighted average contribution per unit 3,714 Break-even point (in units) = Fixed cost ÷ Average contribution per unit = N$561 600 ÷ 0,3714
24
= 151 212 units Individual break-even sales in units:
Product P = 151 212 x 4/7 = 86 407 units Product E = 151 212 x 3/7 = 64 805 units
151 212 units Break-even point in sales value: Product P = 86 407 units x N$10 selling price = N$ 864 070 Product E = 64 805 units x N$12 selling price = N$ 777 660 N$ 1 641 730 8.2 When the products are sold in equal proportions the average contribution is calculated by simply
dividing the total contribution by two. Thus:
Average contribution per unit = (N$5 + N$2) ÷ 2 = N$3,50
Break-even point (in units) = Fixed cost ÷ Average contribution per unit = N$561 600 ÷ N$3,50 = 160 457 units (consisting of 80 228 units of each product).
Break-even point in sales value: Product P = 80 228 units x N$10 selling price = N$ 802 280 Product E = 80 228 units x N$12 selling price = N$ 962 736 N$ 1 765 016 8.3 Advice to management:
The product mix in 9.1 above is preferable because it yields the higher average contribution per unit and consequently the break-even point is reached sooner.
9.2 Break-even sales = Fixed costs ÷ Contribution ratio = N$40 000 ÷ 0,08 = N$500 000 Solution to Activity 10 10.1 Calculations: Product A Product B Product C Total
Contribution ratio 0,30 0,10 0,067 0,10 A A + B A + B + C N$ N$ N$ N$ Sales 0 100 000 200 000 800 000 Net income (50 000) (20 000) 10 000 30 000 Contribution graph (Profit-volume chart):
Profit-volume graph (P/V chart):
Net income N$’000 Profit area
30 Product C
20
10
0 100 200 300 400 500 600 700 800
-10 Product B Volume (sales) units ‘000
-20 Break-even point (N$500 000)
-30 Product A
Loss area
-40
-50 Fixed costs
10.2 Break-even sales = Fixed costs ÷ Marginal income ratio = N$50 000 ÷ 0,10 = N$500 000
27
Solution to Activity 11 11.1 Income Statement Amount Percentage Sales revenue N$500 000 100% Less: Variable costs 300 000 60% = Contribution 200 000 40% Less: Fixed costs 150 000 30% = Net income 50 000 10% 11.2 Contribution = 40% of sales revenue = 40% of N$425 000 (N$500 000 less 15%) = N$170 000 Net income = Contribution – Fixed costs = N$170 000 – N%150 000 = N$20 000 Therefore, net income has decreased by 60% (from N$50 000 to N$20 000) 11.3 Operating leverage factor = Contribution ÷ Net profit
= N$200 000 ÷ N$50 000 = 4
11.4 % increase in net income = % increase in sales x operating leverage factor = 20% x 4 = 80% Solution to Activity 12 12.1 Break-even point (in units) = Fixed costs ÷ Marginal income per unit = N$60 000 ÷ N$24 = 2 500 tins Break-even point (in N$) = 2 500 x N$40 = N$100 000 12.2 Required sales = (Fixed costs + Target profit) ÷ Marginal income per unit = (N$60 000 + N$18 000) ÷ N$24 = N$78 000 ÷ N$24 = 3 250 tins 12.3 Incremental sales N$25 000. Incremental marginal income = N$15 000 Incremental fixed costs = 8 000 Incremental net income = N$ 7 000
Yes, he should convert this position because he will earn an extra N$7 000. 12.4.1 Operating leverage = Marginal income ÷ Net income = N$72 000 ÷ N$12 000 = 6 12.4.2 Percentage increase in net income = Percentage increase in sales x operating leverage = 50% x 6 = 300%