Darrell Wheeler (212) 816-8432 [email protected]New York JANUARY 2001 UNITED STA TES U N I T E D S T A T E S F I X E D - I N C O M E R E S E A R C H Commercial Mortgage-Backed Securities a A Guide to Commercial Mortgage-Backed Securities A Guide to Commercial Mortgage-Backed Securities This report can be accessed electronically via SSB Direct Yield Book E-Mail Please contact your salesperson to receive SSMB fixed-income research electronically.
Figure 4. Pooled Commercial Mortgage Pass-Throughs and CMBSs — Estimated Issuance, 1984–2001P (Dollars in Billions) .............11
Figure 5. Major CMBS Pool Types.................................... ...................................... ............................................. ....................................... .11
Figure 6. CMBS Issuance, 1999 and 2000 (US Dollars in Millions)............................................... .................................... ..........................12
Figure 7. Typical Cash Flow Underwriting Adjustments for a Commercial Property.................. ....................................... ..........................14
Figure 8. Loan Subordination, Using Default and Loss Matrix and Loan with 1.15 Times Coverage. ............................................ ............19
Figure 9. Ten-Year CMBSs — Spreads, 28 May 98, 8 Oct 98, and 29 Dec 00............................................. .............................................. 21
Figure 11. US Vacancy Rates by Product Type, 1991, 1990 and 2000F.................................. ............................................... ...................24
Figure 12. Cap Rate Spreads Versus Ten-Year Treasury Yield, 1983–2000................................................................................. .............25
Figure 13. CMBSs — Historic Investment-Grade Spread to Treasury Notes, Jan 96–Dec 00 .................................... ...............................26
Figure 14. Historical Ten-Year CMBS Triple-A Spread Versus the Ten-Year Swap, Jan 95–Dec 00 ........................................................27
Figure 15. Generic Tier 2 CMBS Spread Interrelationships for Relative Value Judgement, 29 Dec 00....... .............................................. 27
Figure 16. CMBS WAL and Price for Generic Tier 2 CMBS Issue Under Multiple Scenarios............................ ......................................... 30
Figure 17. CMBSs — Collateral by Origination Year .................................... ...................................... ........................................... ..............31
Figure 18. Outstanding Public CMBS Universe — Loss Severity of Defaulted Loans, as of 30 Sep 00.................................. ...................32
January 9, 2001 A Guide to Commercial Mortgage-Backed Securities
4
Commercial mortgage backed securities (CMBSs) have emerged as an
important market sector since 1996. With more than $250 billion of
outstanding issuance the CMBS sector has developed a broad investor base and
a liquid secondary market.
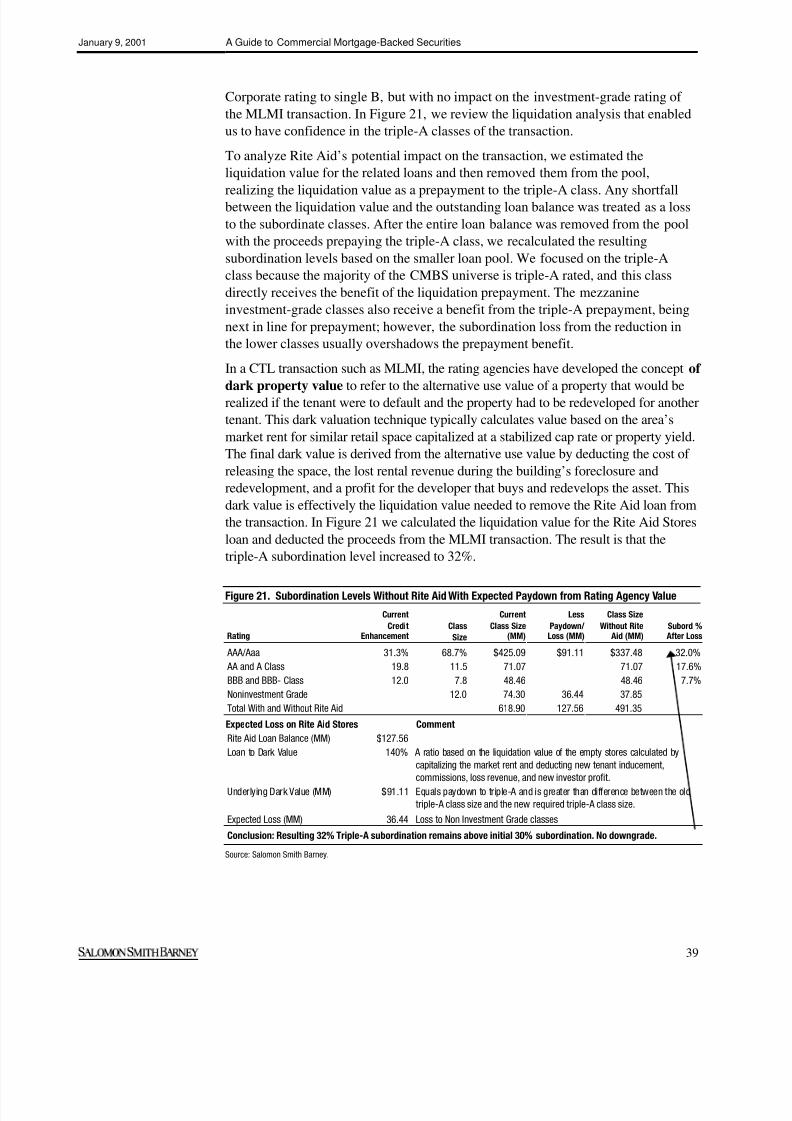
This report provides a description of commercial mortgage securities, discusses
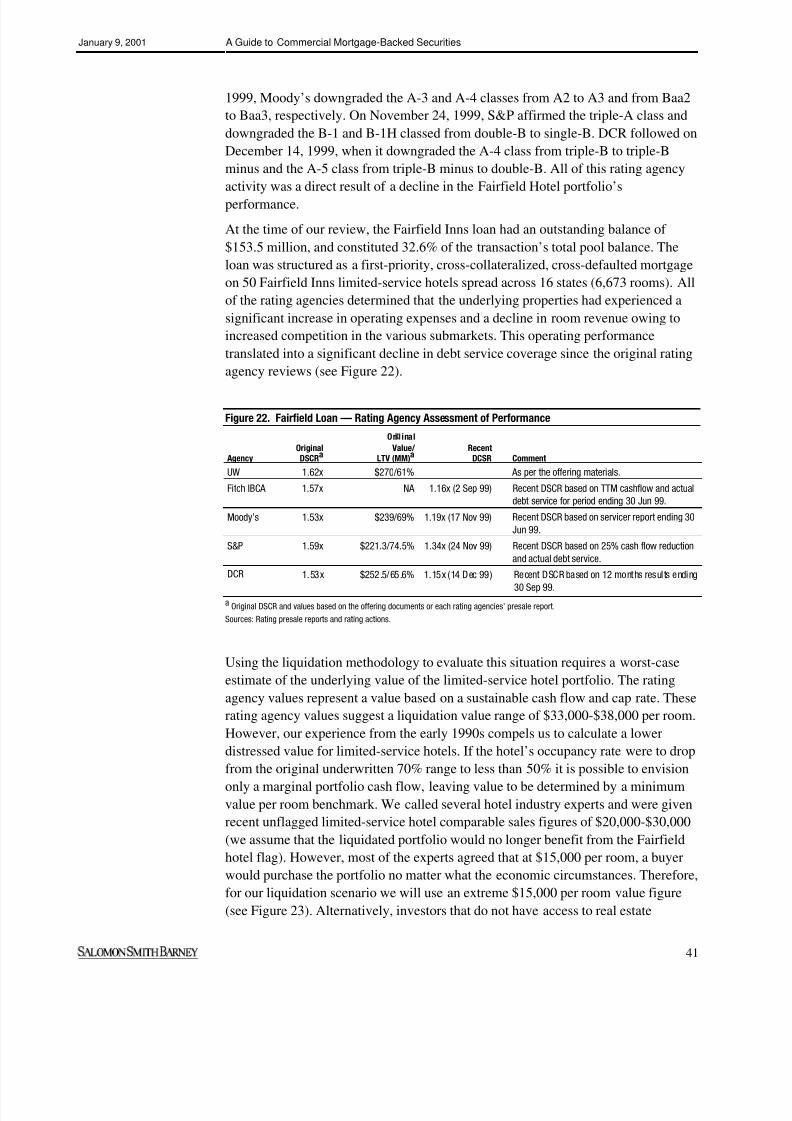
the credit analysis and rating methods of the rating agencies, discusses CMBSrelative value, and provides investors with some suggested analysis techniques.
Salient points include the following:
É Pooled commercial mortgage security payments to investors depend
primarily on the cashflow generated from the underlying commercial
properties, rather than on the credit of an issuer or borrower. The
current strength of this security is best reflected through the debt service
coverage ratio (DSCR). Strong commercial property fundamentals and the
long amortization terms of many commercial mortgages (typically 25 to 30
years) have made near-term loan defaults infrequent. To analyze final
balloon repayment risk, investors and rating agencies focus on the expected
balloon mortgage balances at maturity and possible refinance market
conditions at that time using the property’s loan-to-value ratio (LTV).
É The rating agencies’ credit enhancement models appear to provide
excess credit protection relative to the default and loss experience of
the latest real estate recession. The rating agencies have developed
methods for measuring the likelihood that a particular commercial
transaction will meet its scheduled payments to investors under various
economic scenarios. These methods focus on financial leverage statistics,
as well as on underwriting standards, property types, and property tenancy.
During the past four years, rating agencies have adjusted the commercial
models to compensate for the strong collateral performance and morerealistically reflect the commercial property default probability. We expect
that the rating agencies’ commercial credit enhancement levels will
continue to decline as the CMBS market experiences an economic
slowdown and gains maturity.
É A relatively low level of construction funding, in combination with the
economic expansion of the past few years, has created strong commercial real
January 9, 2001 A Guide to Commercial Mortgage-Backed Securities
5
A commercial mortgage security is backed by the cash flows of a mortgage or pool
of mortgages on commercial real estate and may take a variety of different structural
and legal forms. For purposes of this report, we focus on those securities that arebacked by pools of performing commercial mortgages.
The structure of a commercial mortgage security (not the underlying loans) is quite
similar to that of its single-family, residential counterpart. Principal and interest
payments on underlying loans, after the deduction of servicing expenses, are passed
through directly to the certificate holders in sequential payment order. Similar to
residential securities, excess interest payments are bundled and sold as IO
certificates. However, the cash flow of a CMBS IO certificate is more certain than
that of residential IOs because the underlying commercial mortgages are usually
locked out from prepayment for a portion of the loan term, and then the loans often
have a high prepayment penalty or a defeasance mechanism. Unlike an agency
residential mortgage security, CMBSs have no built-in implied governmentguarantee for the payment of principal and interest to the investor, making them
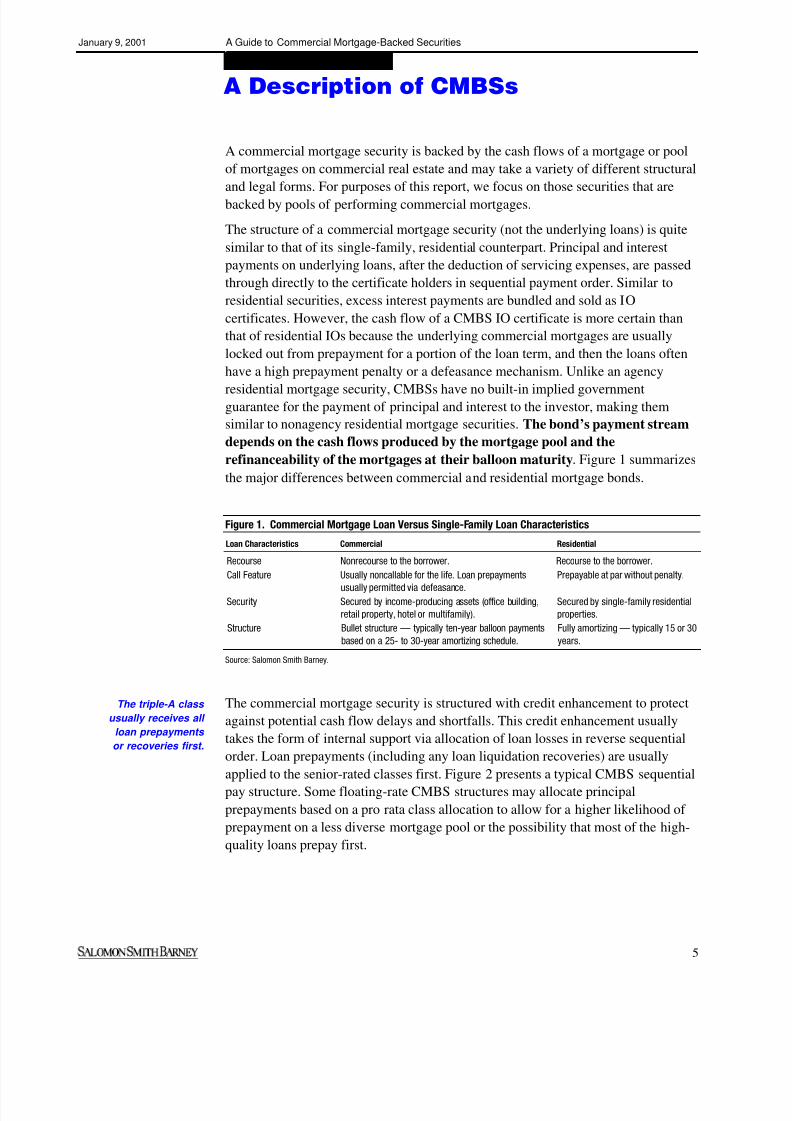
similar to nonagency residential mortgage securities. The bond’s payment stream
depends on the cash flows produced by the mortgage pool and the
refinanceability of the mortgages at their balloon maturity. Figure 1 summarizes
the major differences between commercial and residential mortgage bonds.
Figure 1. Commercial Mortgage Loan Versus Single-Family Loan Characteristics
Loan Characteristics Commercial Residential
Recourse Nonrecourse to the borrower. Recourse to the borrower.
Call Feature Usually noncallable for the life. Loan prepaymentsusually permitted via defeasance. Prepayable at par without penalty.
Security Secured by income-producing assets (office building,
retail property, hotel or multifamily).
Secured by single-family residential
properties.
Structure Bullet structure — typically ten-year balloon payments
based on a 25- to 30-year amortizing schedule.
Fully amortizing — typically 15 or 30
years.
Source: Salomon Smith Barney.
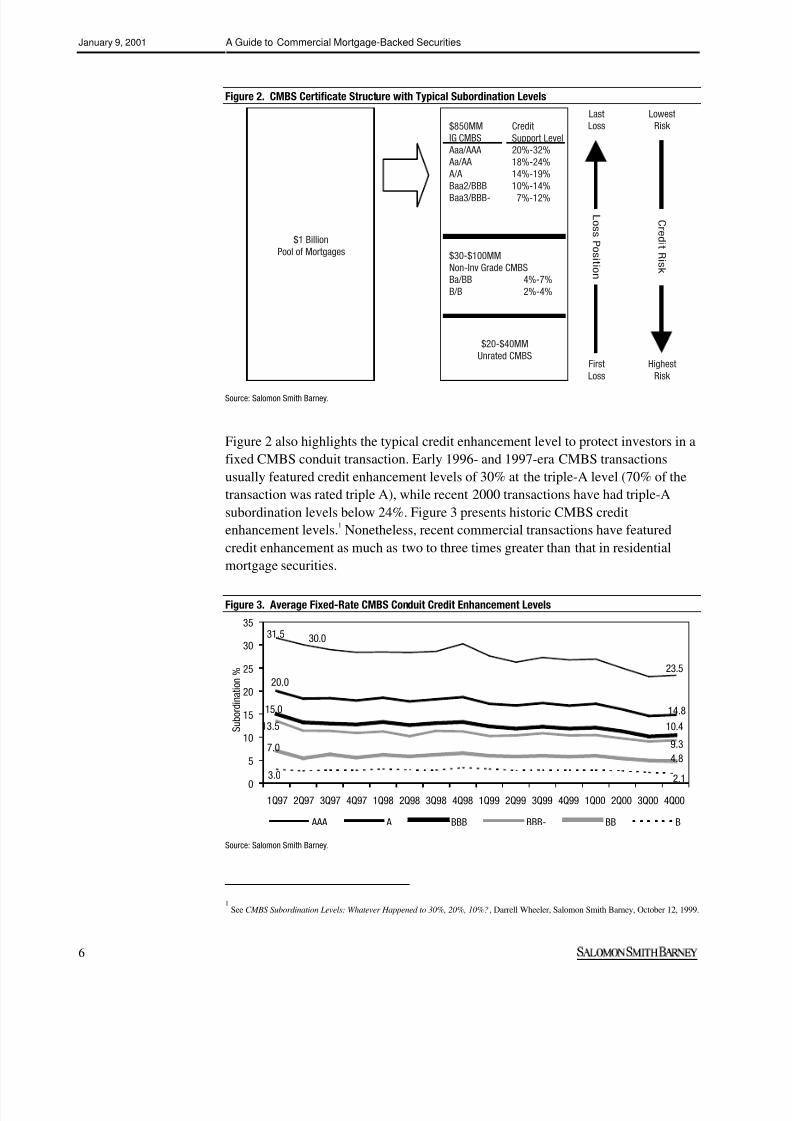
The commercial mortgage security is structured with credit enhancement to protect
against potential cash flow delays and shortfalls. This credit enhancement usually
takes the form of internal support via allocation of loan losses in reverse sequential
order. Loan prepayments (including any loan liquidation recoveries) are usually
applied to the senior-rated classes first. Figure 2 presents a typical CMBS sequentialpay structure. Some floating-rate CMBS structures may allocate principal
prepayments based on a pro rata class allocation to allow for a higher likelihood of
prepayment on a less diverse mortgage pool or the possibility that most of the high-
January 9, 2001 A Guide to Commercial Mortgage-Backed Securities
7
Later in this paper, once we fully review the credit enhancement process, we discuss
the adequacy of the credit protection contained in current CMBS transactions.
Loan Servicing and Advancing
Monthly mortgage debt service payments for CMBSs are collected and aggregated by
a “master servicer.” On a set monthly date this master servicer remits the payments to
the trustee, which makes the monthly payments to the certificate holders. If a loan
defaults, certificate holders are insulated from possible short-term cash flow shortfall
by the master servicer, which is obligated to make bond principal and interest
advances to the trustee and pay property taxes and insurance payments to the extent
that such advances are recoverable from the underlying mortgage obligation.
The “special servicer” is a separate entity from the master servicer and is responsible
for loan collections on defaulted loans. Any loan that has been in default for more
than 60 days is usually transferred to the special servicer, which has an obligation to
work out the loan with the objective of maximizing “the net present value of the
proceeds realized from the loan.” The special servicer is often an entity related to thesubordinate certificate investor, providing an additional motivation to minimize the
loan’s losses. The special servicer usually has extensive commercial real estate
expertise, enabling it to evaluate whether to foreclose and liquidate the loan or to
restructure the loan to enable it to be returned to the master servicer. During the loan
workout, certain trigger events require the special servicer to obtain a new appraisal
for the property. Usually, if the appraisal suggests that the property is worth less
than 90% of the outstanding loan balance and servicer advances, the special servicer
must reset the principal loan amount to the new appraisal value. This is referred to as
an appraisal reduction. This appraisal reduction is meant to preserve capital for the
senior-rated certificates, as it no longer makes sense to continue advances to the
junior classes that no longer have an economic interest in the loan.
The agreement and mechanics of how each CMBS transaction’s cash flows are
handled are outlined in a pooling and servicing agreement between the issuer,
servicer, special servicer and trustee. This agreement is intended to make every
element of converting the mortgage’s cash flow to bond cash flow very mechanical
January 9, 2001 A Guide to Commercial Mortgage-Backed Securities
8
Commercial mortgages differ from single-family residential loans in several ways.
Commercial mortgages are backed by income-producing properties, such as office
buildings, retail shopping centers, multifamily apartments, industrial/warehouseproperties, and hotels. In 2000, the average fixed-rate conduit had the following
other retail; 18.5%, office; 6.6%, industrial; 8.0%, hotels; 2.1%, healthcare; and
2.4%, manufactured housing. The mortgages on such properties tend to have shorter
stated maturities than their residential counterparts. Moreover, many of the
commercial mortgages are either nonamortizing or partially amortizing and, hence,
mature with a significant outstanding principal balance or “balloon.” In addition,
commercial mortgages are larger-sized loans, ranging in size from $300,000 to
several hundred million dollars. Finally, commercial mortgages, particularly
industrial/warehouse properties, may be subject to more environmental risk than
single-family properties.The typical commercial mortgage is a balloon loan, with a 30-year amortization
schedule and a balloon payment due after ten years. Unlike residential
mortgages, most fixed-rate commercial loans have very strong call protection (or
lock-out) on prepayments for several years and then a prepayment penalty or
defeasance for several more years. The mortgage loan may be structured to offer
prepayment flexibility via three mechanisms that are designed to maintain the
collateral pool’s cash flow or to compensate the investors for lost payment:
1 Yield maintenance, which makes the lender whole for the loss of an above-
market coupon on a net present value basis (so that in effect there is generally no
economic incentive for the borrower to refinance);2 Defeasance , which involves the borrower pledging to the holder of the mortgage
US Treasury securities whose cash flows equal or exceed that of the mortgage; or
3 Rarely, a declining fee proportional to the remaining balance; for example, a “5-4-
3-2-1” schedule means that the penalty is equal to 5% of the outstanding loan
balance in the first year of the penalty period, 4% during the second year, and so on.
An owner may make a voluntary prepayment and incur the yield maintenance or
defeasance cost if they have a compelling necessity to sell. In the case of yield
maintenance, the fee is usually distributed via a formula that will maintain each
certificate’s return and usually enhances the IO return. In many instances, the early
repayment may actually increase the IO holder’s yield. In the case of defeasance, theUS Treasury collateral remains in the trust and the bondholders receive their regular
monthly mortgage payments. Certificates from pools that have had a significant
number of loans defease are good candidates for rating agency upgrades as the
underlying loan collateral has been replaced with US Treasuries.
The intent of these prepayment restrictions was to create securities with low loan
prepayment expectations to maximize cash flow certainty. A typical 1997- or 1998-
era CMBS transaction would be MCFI 1998-MC3, a $908 million deal priced by
January 9, 2001 A Guide to Commercial Mortgage-Backed Securities
9
Salomon Smith Barney in December 1998. At the time of issuance, virtually all
(more than 99%) of the loans were balloons, the majority having the balloon payment
due after ten years. All of the loans have restrictions on prepayments: about 98%
have a lock-out period followed by either yield maintenance (about 78% of the
loans), defeasance (19% of the loans), or a declining fee schedule (just under 1% of
the loans). The remaining 2% of the loans have a prepayment penalty equal to thegreater of yield maintenance or 1% of the unpaid principal balance; for some loans,
this is followed by a declining fee penalty schedule. However, since 1998,
prepayment restrictions on most CMBS have relied heavily on defeasance with many
recent CMBS pools having all loans locked out until three months prior to maturity
only permitting mortgage prepayments via defeasance.
Restrictions on prepayments usually end about three to six months before the
balloon date, referred to as the free or open period. The objective is to allow the
borrower time to refinance the loan and, hence, make the balloon payment. Later in
this report, we will discuss how CMBS mortgage prepayments affect pricing
scenarios.
The borrower on larger mortgages (more than $1 million) is usually structured
as a special purpose entity (SPE) to insulate the property’s cash flow from the
parent company. The SPE is usually restricted via covenants to only owning and
operating the property and prevented from incurring further liabilities. Often, on
larger loans (more than $2 million), the SPE will have a special legal opinion that
says it is separate from its parent’s operating activities (bankruptcy remote) in an
effort to prevent the loan from being involved in any bankruptcy proceeding that
might evolve from a future troubled parent company. The loan may also have an
independent director as an additional safeguard to prevent fraudulent bankruptcy
filings by the SPE.
Commercial mortgages usually require the borrower to fund an escrow accountwith one month’s payment of debt service, as well as ongoing reserves for real
estate taxes and property insurance. On many commercial tenanted mortgage
loans there may also be an escrow reserve amount for future releasing costs such as
tenant inducement payments or leasing commissions. The borrower will also likely
be required to provide annual financial statements and tenant rent rolls to enable the
servicer to monitor property performance. The servicer usually uses these statements
to recalculate the loan’s debt service and makes that information available to
January 9, 2001 A Guide to Commercial Mortgage-Backed Securities
10
Prior to the early 1980s, a market for trading commercial mortgages existed, but it
was limited and the loans were typically not sold in security form. Instead, financial
institutions would trade such loans among themselves either as whole loans or ascommercial mortgage participations.
In the mid-1980s, however, commercial mortgage originators began to utilize the
securities market, albeit slowly. A few insurance companies turned to the Eurobond
market, where they issued securities that carried S&P ratings based on the credit of
the respective insurance company. The primary benefit that they received from
issuing in the Eurobond market was that they faced no Securities and Exchange
Commission (SEC) registration requirements. Securitization in the domestic market
also began in the mid-1980s, helped partly by the development of the collateralized
mortgage obligation (CMO), the introduction of the rating criteria for certain
commercial mortgage transactions, and the Tax Reform Act of 1986, which
authorized a new mortgage security vehicle known as a Real Estate MortgageInvestment Conduit (REMIC).
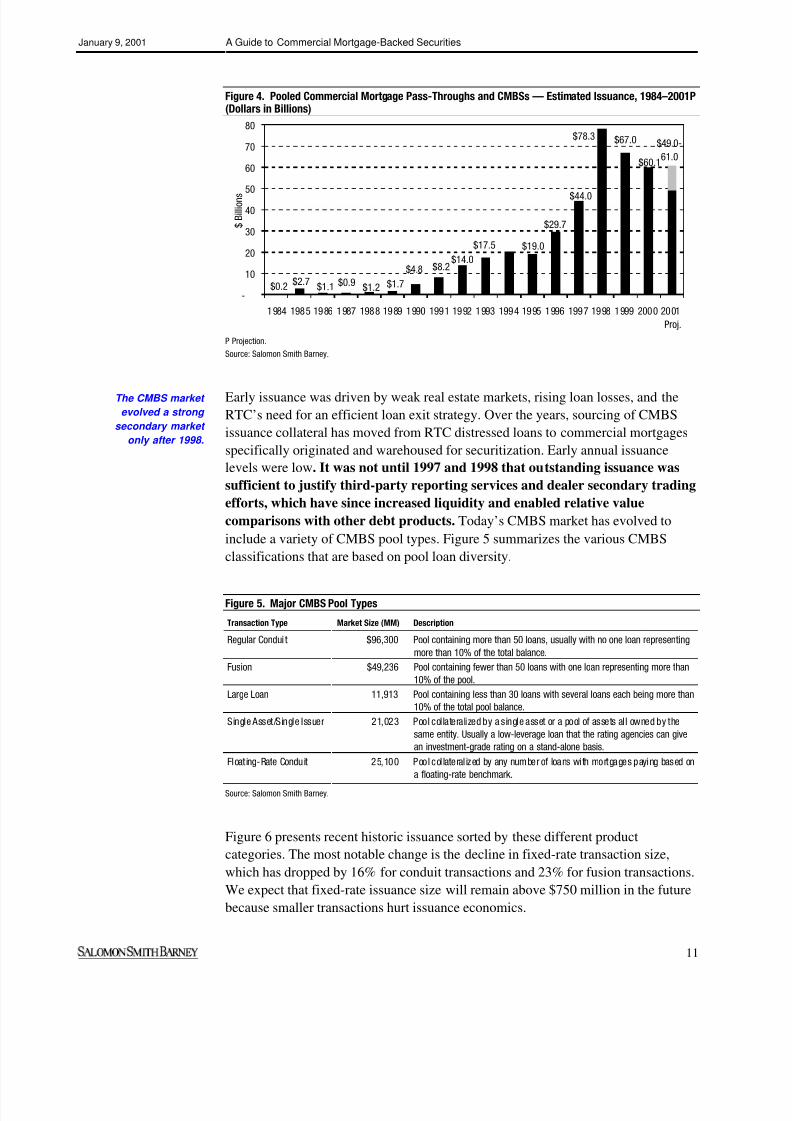
The first pooled commercial mortgage security was issued in 1984 — a $205-
million CMO issued by Penn Mutual Life Insurance Company. In 1985, estimated
issuance of pooled commercial mortgage securities totaled a healthy $2.7 billion.
Issuance slowed thereafter, however, totaling approximately $10.5 billion in
cumulative issuance by year-end 1991 (see Figure 4). Compared with the single-
family market, where roughly 50% of outstanding mortgages are securitized
(representing about $1.3 trillion), the proportion of securitized commercial
mortgages initially was quite small.
It wasn’t until the real estate recession of the early 1990s that CMBS issuanceincreased. The Financial Institutions Reform, Recovery and Enforcement Act
(FIRREA) of 1989 was the catalyst for the CMBS market, because it chartered the
Resolution Trust Corporation to manage and resolve insolvent thrifts formerly
insured by the Federal Saving and Loan Insurance Corporation (FSLIC) and placed
in receivership. FIRREA also included new regulations, making it more onerous for
savings institutions to hold certain amounts of commercial real estate loans. The new
capital standards required savings institutions to maintain total regulatory capital
equal to 7.2% of their total risk-weighted assets in 1992 and at least 8% thereafter.
Under FIRREA, commercial real estate loans held by commercial banks and thrifts
had a 100% risk-weighting classification.
In addition, the 1989 Act imposed categorical asset restrictions on savings
institutions, limiting secured nonresidential real property loans to 400% of
regulatory capital. The new requirements were onerous for many thrifts, which were
forced either to liquidate commercial mortgages or, at a minimum, to curtail
originating them. Figure 4, which shows CMBS issuance since 1984, demonstrates
the large increase in CMBS issuance that took place after 1990.
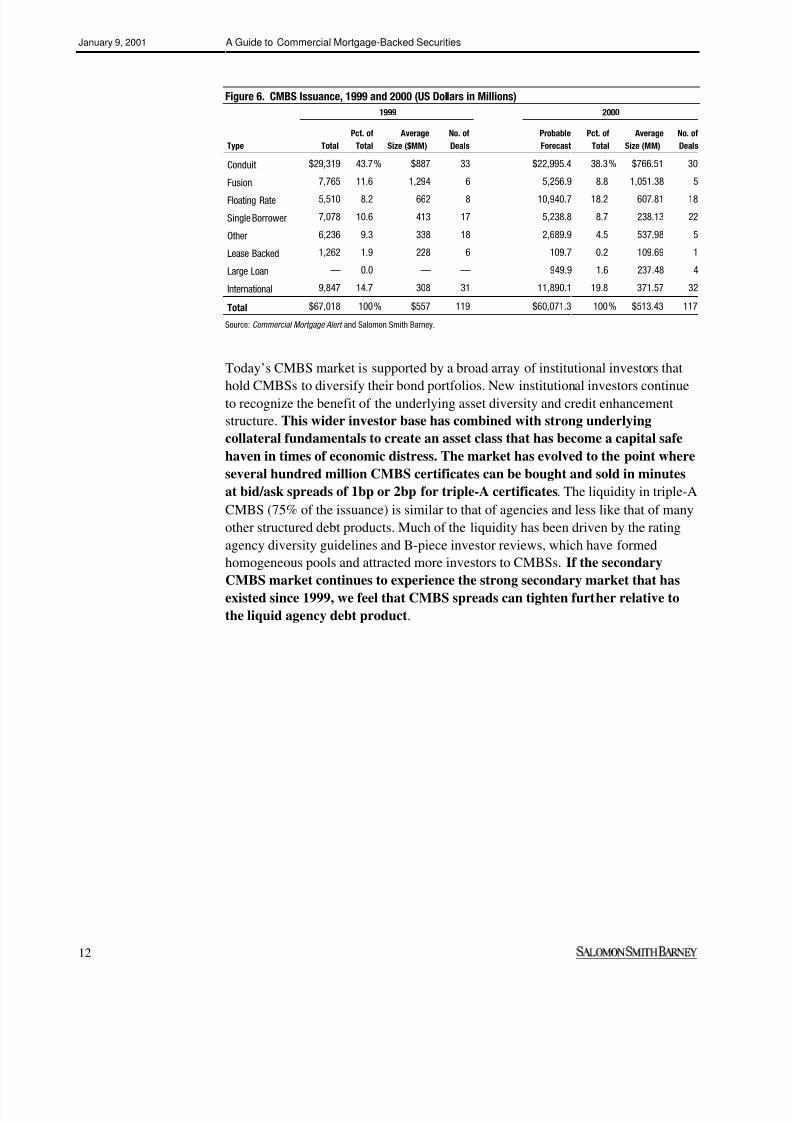
Single Borrower 7,078 10.6 413 17 5,238.8 8.7 238.13 22
Other 6,236 9.3 338 18 2,689.9 4.5 537.98 5
Lease Backed 1,262 1.9 228 6 109.7 0.2 109.69 1
Large Loan — 0.0 — — 949.9 1.6 237.48 4
International 9,847 14.7 308 31 11,890.1 19.8 371.57 32
Total $67,018 100% $557 119 $60,071.3 100% $513.43 117
Source: Commercial Mortgage Alert and Salomon Smith Barney.
Today’s CMBS market is supported by a broad array of institutional investors that
hold CMBSs to diversify their bond portfolios. New institutional investors continueto recognize the benefit of the underlying asset diversity and credit enhancement
structure. This wider investor base has combined with strong underlying
collateral fundamentals to create an asset class that has become a capital safe
haven in times of economic distress. The market has evolved to the point where
several hundred million CMBS certificates can be bought and sold in minutes
at bid/ask spreads of 1bp or 2bp for triple-A certificates. The liquidity in triple-A
CMBS (75% of the issuance) is similar to that of agencies and less like that of many
other structured debt products. Much of the liquidity has been driven by the rating
agency diversity guidelines and B-piece investor reviews, which have formed
homogeneous pools and attracted more investors to CMBSs. If the secondary
CMBS market continues to experience the strong secondary market that hasexisted since 1999, we feel that CMBS spreads can tighten further relative to
January 9, 2001 A Guide to Commercial Mortgage-Backed Securities
13
The rating agencies have developed analytical models that take much of the
investigative onus off the investor. After extensive analysis, the agencies provide
investors with a consistent measurement of the likelihood that cash flow fromunderlying mortgages will be sufficient to meet scheduled payments of principal and
interest on the security at each certificate rating. At higher rating levels, mortgage
cash flows are expected to hold up under increasingly severe economic conditions.
Thus, for a given pool, progressively greater credit support is needed at higher rating
levels. When the rating agencies initially developed their models the real estate
market was emerging from a severe recession, the commercial mortgage market
suffered from a lack of standardization, and there was a shortage of historical
delinquency and foreclosure data. As a result, the rating agencies developed
subordination models based on very conservative default and loss assumptions.
The process used to rate commercial mortgage securities is, in some respects, similarto the residential mortgage rating process: the primary focus of the analysis in each
case is on the credit quality of the underlying collateral; however, significant
differences exist. Commercial mortgages are nonrecourse loans, so securities are
backed only by income-producing properties whose profit-oriented owners’
motivation depends on different factors than those affecting a residential
homeowner. Of primary concern in analyzing a commercial mortgage is the
property’s underlying net operating income (NOI) and net cash flow (NCF), and all
factors that influence them. Therefore, an analysis of the credit quality of a
commercial loan requires a careful review of underlying tenants’ creditworthiness,
the structure and term of underlying leases, the historical level of vacancies and
rents on the property and on other properties in the region, and the real estate andeconomic cycle within the local market. All of this analysis feeds into a review of
the mortgage’s loan-to-value ratio (LTV) and debt service coverage ratio (DSCR).
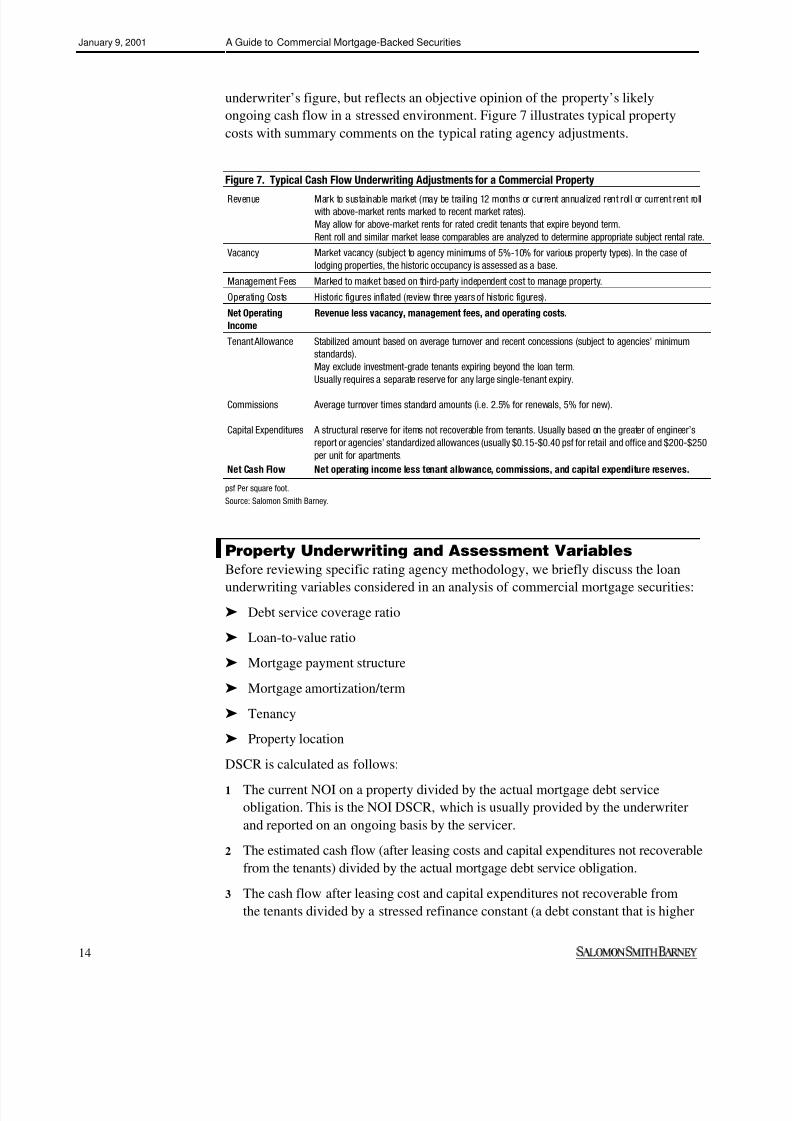
In reviewing a property’s cash flow, a rating agency will typically reduce the
property’s cash flow to the lower of the rental market or the contractual lease rent. A
higher contractual rent may be accepted as cash flow if the underlying tenant is
publicly rated and the term of the lease extends beyond the term of the mortgage
loan. The property’s occupancy may also be adjusted downward to reflect
surrounding market conditions on the assumption that even a fully occupied building
will eventually lose tenants and stabilize at the market occupancy rate. The
property’s operating costs are assessed at historic levels adjusted for inflation with
any lower-than-market costs increased to reflect a third party’s cost in anticipation
of the possibility the mortgagee may have to foreclose and operate the property. The
NOI, which is derived from revenues less operating expenses, is then further
adjusted by estimated annual market releasing commission and tenant inducement
costs that reflect the building’s scheduled lease expiries and releasing costs for
similar buildings. Finally, the agency subtracts a capital expenditure allowance in
anticipation of ongoing structural repair costs that will not be reimbursable from
tenants. The rating agencies’ resulting NCF is usually 3%-5% less than the
January 9, 2001 A Guide to Commercial Mortgage-Backed Securities
15
than the actual rate to account for potential unfavorable refinance conditions
when the balloon comes due). This is referred to as a “stressed DSCR” and is
used by rating agencies to perform their analysis.
LTV refers to the ratio of the outstanding loan balance on a property to the estimated
valuation of that property. LTV is assessed as an important indicator of potential
loss severity, because the analysis of how much will be lost upon default reliesheavily on the property value relative to the outstanding debt on that property.
Loss severity can also be affected by state foreclosure laws. If a state’s foreclosure
laws could delay the mortgage servicer’s property liquidation, the agency may
toughen the LTV parameters for that state. The rating agencies treat DSCR as the
best indicator of default probability, while LTV is viewed as the best indicator
of loss severity.
Similar to the residential market, floating-rate structures in the commercial market
are viewed as inherently more risky than fixed-rate structures. The potential
inability to meet undefined or floating debt service payments in the future
increases the risk that the borrower may default. The presence of a floating-rate
lessens somewhat the reliance of the analysis on a DSCR. To compensate, rating
agencies usually assess the loan's DSCR at a higher debt constant, creating a lower
DSCR that requires higher credit enhancement levels. If the borrower has the benefit
of an interest rate cap agreement, the rating agency may recognize the contract’s
benefit by using the contract interest rate to calculate DSCR. Furthermore, many
floating-rate commercial mortgages are secured by buildings that are in a value
enhancement stage, intensifying the default and refinance risks because cash flow
may never stabilize. Overall, floating-rate mortgages are viewed as more risky
by the agencies and carry significantly more credit enhancement.
Whereas most residential mortgages fully amortize over a 15- or 30-year life, many
domestic commercial mortgage structures either are partially amortizing or do notamortize at all (interest only). Most carry shorter terms than residential mortgages,
and a large majority mature with an outstanding balloon payment. From a credit
perspective, fully amortizing mortgages are the least risky. As a loan amortizes,
principal is paid down, reducing the indebtedness of the borrower and reducing the
risk of default (equity buildup is an important protector against default in the
commercial market, as well as minimizing loss severity). A partially amortizing loan
will have paid down only part of its principal by maturity, and a nonamortizing loan
will have paid only interest and no principal by maturity, translating into little or no
equity buildup. Partial or no-amortization loans will mature with a significant
remaining principal balance — a “balloon payment” — that must be made. For
example, after ten years of amortization a loan has usually only paid 15% of theprincipal, if the loan is on a 30-year amortization schedule. Typically, the borrower
will try to refinance that balance into a new mortgage, creating refinancing risk in the
credit equation.
Various factors may impair the borrower’s ability to refinance the remaining
January 9, 2001 A Guide to Commercial Mortgage-Backed Securities
16
2 A decline in property value
3 More restrictive underwriting criteria
4 A relatively large number of vacancies
5 Tight credit conditions
All, or any of these factors, may inhibit lenders in the primary market from
providing refinancing on the mortgage. Given this potential risk, the rating agencies
focus on the coupon rate of the mortgage and analyze the ability of the property to
support a new mortgage in the amount of the balloon at a potentially higher interest
rate level. Moody’s and Fitch use a maximum refinance interest constant for the
collateral, which is typically 9.25% for Moody’s and 8.88% to 11.33% for
Fitch, depending on the property type and loan amortization to the balloon.
These refinance constants are based on historic rates and reflect a worst-case DSCR.
The resulting stressed DSCR is usually 0.10-0.15 times lower than the underwriter’s
DSCR. For reference, a typical CMBS transaction may have a NOI DSCR of 1.35-
1.45, a CF DSCR of 1.20-1.40, and a “stressed DSCR” by an agency such as Fitch
of 1.05-1.20.
The rating agencies also look at the expiration dates for major leases on the property
relative to the maturity date of the mortgages to help determine vacancy potential
and, thus, the releasing risk exposure that will be evident on the balloon date. If
many leases expire near the loan maturity date, the loan will usually be structured to
accrue a sufficient releasing reserve to mitigate the risk. To the extent the rating
agencies perceive lease rollover risk, they will increase their probability of default
assessment and sometimes decrease their specific estimated loan recovery, leading
to higher subordination levels.
The rating agencies also take into account the structure of the loans to evaluate the level
of credit support necessary to protect against balloon risk. In many cases, the loans may
have an early permitted repayment date of ten years, after which the interest rate steps
up and all cash flows are captured in a lockbox controlled by the lender to amortize
principal (an anticipated repayment date (ARD) loan). The ARD loan structure provides
a built-in loan restructuring, because after the anticipated loan repayment date, the
lender receives all the property cash flow without having to foreclose.
The rating agencies also evaluate the flexibility of the servicer in situations where
refinancing risk is present. The question of whether a workout will be attempted is
an important one — in terms of whether a default will occur, and if it does, what the
loss severity will be. Traditionally, commercial lenders have maximized recoveries
when afforded flexibility in these loan workout situations. In some cases, they haveextended the term of the mortgage; in other cases, they have reduced the monthly
payments on the mortgage. While the servicer’s ability to extend loans may lead to a
maximum loan recovery, it also affects the certificate’s average life and has an
impact on the investor’s yield if they paid a premium or a discount for their bonds.
Sometimes a forced foreclosure and cash sale of property will result in much higher
losses than a workout negotiation whereby the current borrower is allowed to
continue under new terms. In addition to a potentially low sales price, the expenses
January 9, 2001 A Guide to Commercial Mortgage-Backed Securities
17
incurred in a foreclosure are generally higher than those associated with a
lender/borrower cooperative loan workout, particularly if the borrower uses
bankruptcy as a delaying method. Even in cases where the underlying property does
not support the outstanding loan balance, a reduction of the debt claim and
avoidance of the above-mentioned expenses may result in higher recovery levels.
Therefore, the ability of the servicer to manage a workout is a critical factor inminimizing potential loan losses. Such ability will be a function of servicer
experience, knowledge of the local markets and of the pertinent property type, and
finally, workout volume capacity. As previously mentioned, most recent CMBS
transactions give the special servicer the ability to modify loans subject to a
standard of care to maximize expected loan net present value. Therefore, rating
agencies assess the special servicer’s abilities and may adjust the credit
enhancement levels by 0% to 1% based on the evaluation.
Finally, the viability of an income-producing property depends on its tenants and the
property location’s ability to attract replacement tenants. The loss of a major tenant
can cause insolvency. Most recent commercial mortgage defaults have been
caused by either lease expiries or leases not being affirmed by a bankruptentity. Leases rolling over to lower market rents can create a lower DSCR and lead
to defaults. Thus, rating agency models favor multi-tenanted buildings and, in
addition, will look to the creditworthiness of the individual tenants, particularly the
anchor tenant in a transaction backed by mortgages on shopping centers. Single-
tenanted buildings are usually penalized with higher subordination levels to ensure
that there is sufficient loss recovery should the individual tenant vacate and cause a
default and loan liquidation. Tenant concentration may be somewhat offset by a
strong property location and the resulting ability to attract new replacement tenants
at low re-tenanting costs.
Rating Agency Model Mechanics
The number of mortgages in the pool and the relative size of the larger loans as a
percentage of the pool are major determinants of agency subordination. This is the
key reason that CMBS pools are classified by loan size. Smaller pools and pools
with loan or borrower concentrations merit closer scrutiny, because they represent
January 9, 2001 A Guide to Commercial Mortgage-Backed Securities
18
focus more on the pool’s anticipated cumulative lifetime defaults being similar to
the experience in the early-1990s default studies.2
Thus, the loan pool’s size diversity decides whether the rating agencies use a
property-specific approach (with the ratings based on each property’s
characteristics) or an actuarial analysis. The actuarial approach relies on an
evaluation of credit characteristics from a sample of the overall pool. Ananalysis of pool credit quality through aggregate loan characteristics generally will
be sufficient if the pool was originated with uniform underwriting standards,
contains a sufficiently large number of loans, and the distribution of the loan balance
is not widely skewed. To the extent any of these conditions is lacking, the rating
agency may rely more on a loan-by-loan analysis.
To determine the loss coverage required on a commercial mortgage pool, each rating
agency reviews a large sample (40%-60%) of the individual loans to assess the
pool’s cash flow underwriting and asset valuation by property type. This assessment
of cash flow underwriting by property type is extrapolated to the entire pool to
determine the DSCR and LTV characteristics. This leverage analysis is the core of
the agencies’ assessment — they feed the DSCR and LTV into a “base pool” loss
matrix that produces a foreclosure frequency and loss potential of the loans at
various rating levels. Thus, for a given LTV and DSCR, the rating agency’s base
matrix provides a foreclosure frequency and principal loss value.
The rating agencies view LTV as the key determinant of loss severity following loan
default. To estimate collateral values used in the calculation of LTV, the rating
agencies capitalize3
their estimated cash flow at yields that reflect property type,
property-specific characteristics, and local market conditions. The rating agencies
assess fixed and variable liquidation/workout expenses in the loss severity
calculation. For smaller loans, fixed expenses can have a significant impact on loss
severity. State foreclosure laws also affect loss severity. Accrued interest anddeteriorating property performance will increase losses; the longer it takes for the
mortgage servicer to gain control over the property and to liquidate it, the higher
those losses will be.
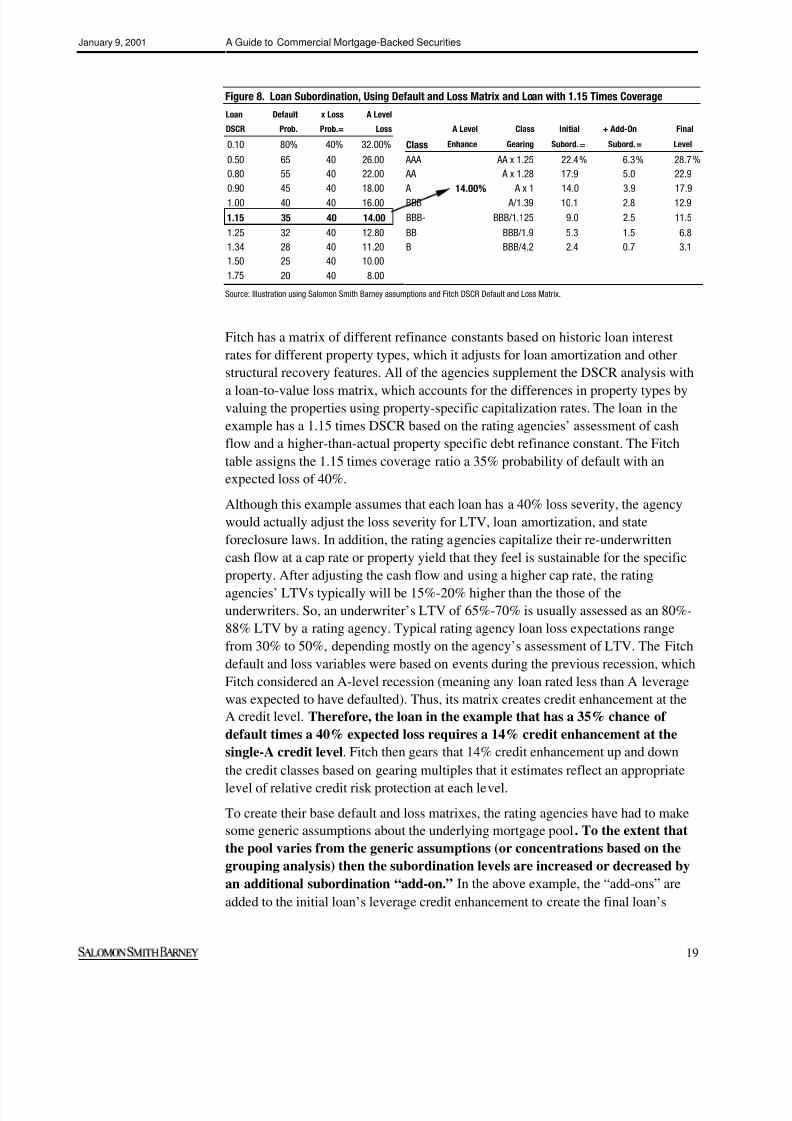
In Figure 8 we present a generic example of how a rating agency matrix might
translate debt service to an actual subordination level. For simplicity, the example is
based on an early Fitch default and loss table, which has since evolved considerably.
2
“Update to Commercial Mortgage Defaults,” Mark P. Snyderman, The Real Estate Finance Journal, Vol. 10, No. 1, Summer 1994.
3One of the simpler commercial real estate valuation methods is to divide a property’s expected cash flow by a required property
yield. The required property yield is commonly referred to as a “cap rate.”
January 9, 2001 A Guide to Commercial Mortgage-Backed Securities
19
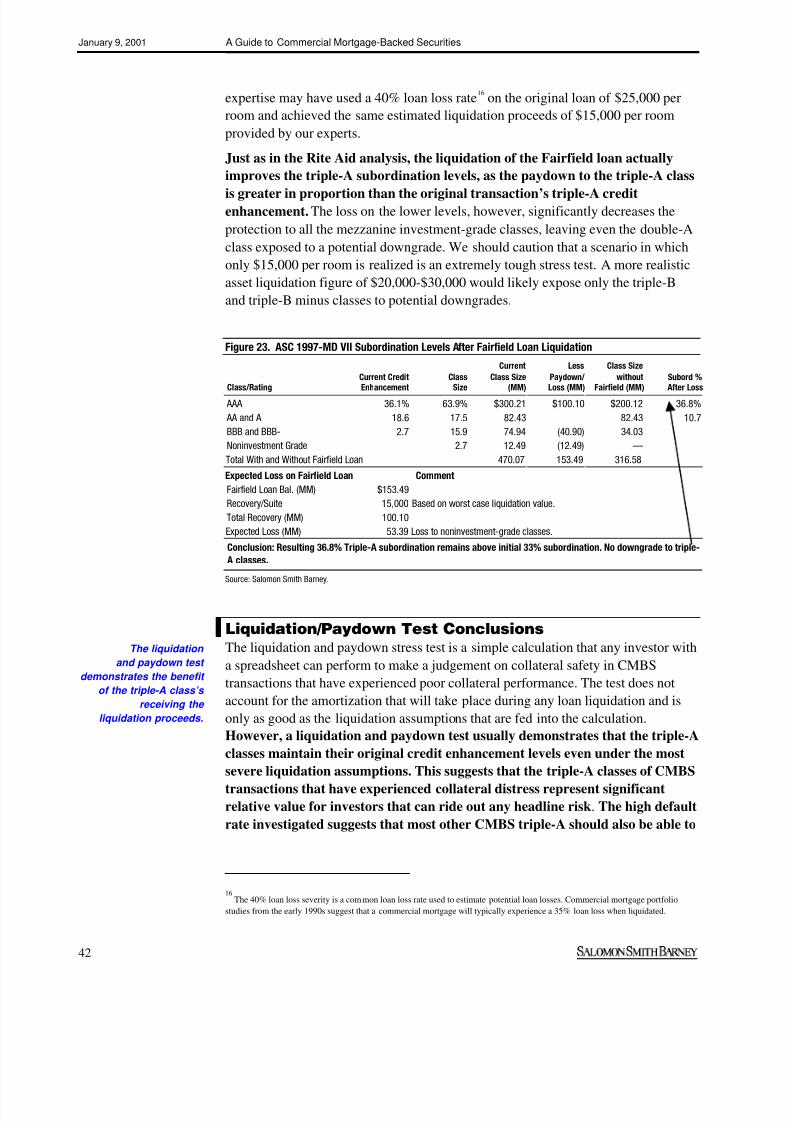
Figure 8. Loan Subordination, Using Default and Loss Matrix and Loan with 1.15 Times Coverage
Loan Default x Loss A Level
DSCR Prob. Prob.= Loss A Level Class Initial + Add-On Final
0.10 80% 40% 32.00% Class Enhance Gearing Subord.= Subord.= Level
0.50 65 40 26.00 AAA AA x 1.25 22.4% 6.3% 28.7%
0.80 55 40 22.00 AA A x 1.28 17.9 5.0 22.9
0.90 45 40 18.00 A 14.00% A x 1 14.0 3.9 17.91.00 40 40 16.00 BBB A/1.39 10.1 2.8 12.9
1.15 35 40 14.00 BBB- BBB/1.125 9.0 2.5 11.5
1.25 32 40 12.80 BB BBB/1.9 5.3 1.5 6.8
1.34 28 40 11.20 B BBB/4.2 2.4 0.7 3.1
1.50 25 40 10.00
1.75 20 40 8.00
Source: Illustration using Salomon Smith Barney assumptions and Fitch DSCR Default and Loss Matrix.
Fitch has a matrix of different refinance constants based on historic loan interest
rates for different property types, which it adjusts for loan amortization and other
structural recovery features. All of the agencies supplement the DSCR analysis with
a loan-to-value loss matrix, which accounts for the differences in property types byvaluing the properties using property-specific capitalization rates. The loan in the
example has a 1.15 times DSCR based on the rating agencies’ assessment of cash
flow and a higher-than-actual property specific debt refinance constant. The Fitch
table assigns the 1.15 times coverage ratio a 35% probability of default with an
expected loss of 40%.
Although this example assumes that each loan has a 40% loss severity, the agency
would actually adjust the loss severity for LTV, loan amortization, and state
foreclosure laws. In addition, the rating agencies capitalize their re-underwritten
cash flow at a cap rate or property yield that they feel is sustainable for the specific
property. After adjusting the cash flow and using a higher cap rate, the ratingagencies’ LTVs typically will be 15%-20% higher than the those of the
underwriters. So, an underwriter’s LTV of 65%-70% is usually assessed as an 80%-
88% LTV by a rating agency. Typical rating agency loan loss expectations range
from 30% to 50%, depending mostly on the agency’s assessment of LTV. The Fitch
default and loss variables were based on events during the previous recession, which
Fitch considered an A-level recession (meaning any loan rated less than A leverage
was expected to have defaulted). Thus, its matrix creates credit enhancement at the
A credit level. Therefore, the loan in the example that has a 35% chance of
default times a 40% expected loss requires a 14% credit enhancement at the
single-A credit level. Fitch then gears that 14% credit enhancement up and down
the credit classes based on gearing multiples that it estimates reflect an appropriatelevel of relative credit risk protection at each level.
To create their base default and loss matrixes, the rating agencies have had to make
some generic assumptions about the underlying mortgage pool. To the extent that
the pool varies from the generic assumptions (or concentrations based on the
grouping analysis) then the subordination levels are increased or decreased by
an additional subordination “add-on.” In the above example, the “add-ons” are
added to the initial loan’s leverage credit enhancement to create the final loan’s
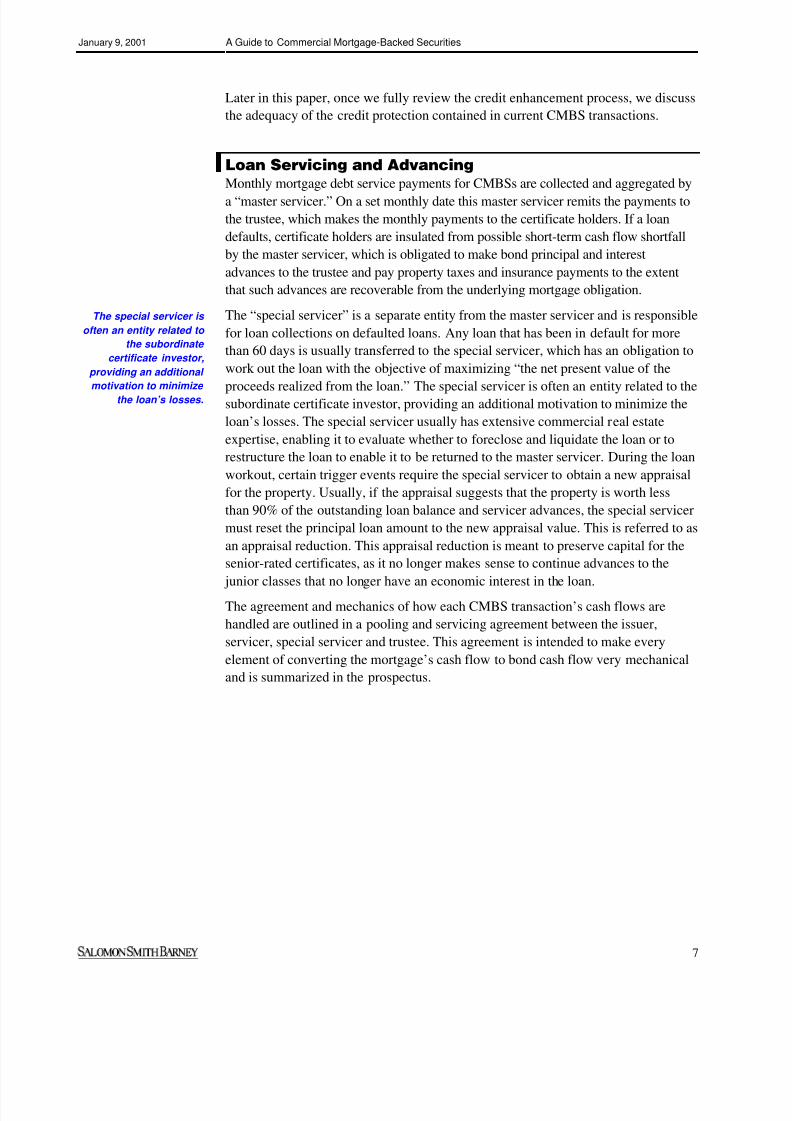
Figure 3 showed that CMBS credit enhancement levels declined from 30% in the
second quarter of 1997 to 23.4% in October of 2000. Our original report, CMBS
Subordination Levels — Whatever Happened to 30%, 20%, 10%,4
attributed two-
thirds of the decline in subordination to improved underwriting, decreased leverage,
and a declining proportion of volatile property types being underwritten in recent
years. With most of the decline in triple-A subordination levels occurring in the past
year, many investors are asking whether current subordination levels provide
sufficient credit protection.
Since October 1999 we have made only a couple of adjustments to Salomon Smith
Barney’s subordination model. One model adjustment accounted for the
amortization of the loan balance, a major change from determining the loss factors
based on the loan balance at origination. We feel that adjusting for loan balance
amortization is reasonable, given that loan defaults usually take place only after the
mortgage has had time to amortize to some extent. The rest of the subordination
level decline can still be accounted for by further improvements in the composition
of loan pool property types and decreased leverage. Overall, our original model,with the couple of adjustments, continues to match the rating agencies’ levels,
suggesting that there have been few other agency modifications caused by
“agency competition.”
So, what has caused underwriters to drastically improve their underwriting standards
over the past year, creating the improved subordination levels? The answer lies in
the 1998 bond market crisis, during which many subordinate CMBS buyers were
eliminated from the market, leaving a group of five or six buyers for the double-B,
single-B, and unrated CMBS classes. With limited competition, these B-piece
buyers have had tremendous buying clout and have been able to remove any
questionable loans from CMBS pools and request that certain property types (such
as limited service hotel) not be included. This has shaped underwriting standards and
the pools’ property composition.
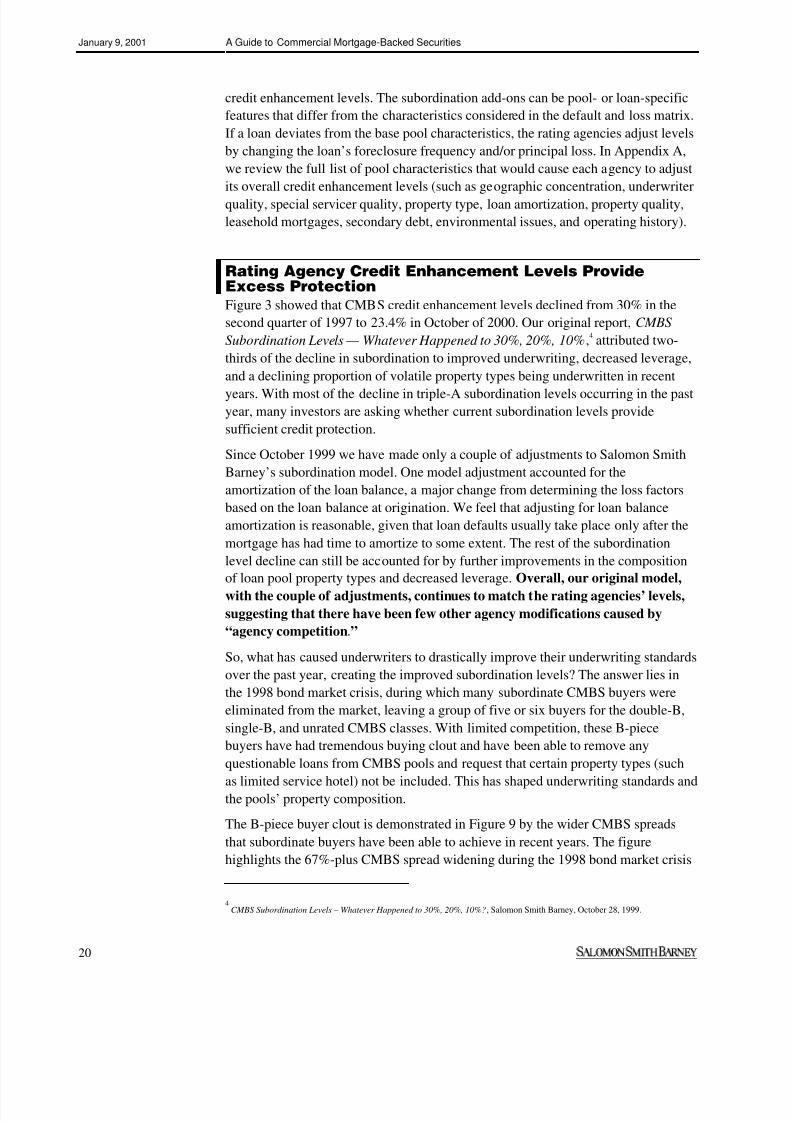
The B-piece buyer clout is demonstrated in Figure 9 by the wider CMBS spreads
that subordinate buyers have been able to achieve in recent years. The figure
highlights the 67%-plus CMBS spread widening during the 1998 bond market crisis
4 CMBS Subordination Levels – Whatever Happened to 30%, 20%, 10%?, Salomon Smith Barney, October 28, 1999.
January 9, 2001 A Guide to Commercial Mortgage-Backed Securities
21
and the relatively small contraction in noninvestment-grade spreads since the crisis.
This steepening of the credit slope between triple-A and unrated classes also
developed in the investment-grade CMBS classes, with the credit spread between
triple-B and triple-A CMBS classes still significantly higher than pre-crisis levels.
Figure 9. Ten-Year CMBSs — Spreads, 28 May 98, 8 Oct 98, and 29 Dec 00
Pre-Crisis Crisis Percentage Year-End Percentage
28 May 98 8 Oct 98 Increasea 29 Dec 00 Decreasea
AAA 77bp 205bp 166% 143bp 30%
A 110 300 173 178 41
BBB 145 350 141 231 34
BB 265 550 108 535 3
B 460-540 840-900 74 840-900 0
Unrated Yield 15%-18% 25%-30% 67 25%-30% 0
Credit Curve
BBB–AAA 68bp 145bp 88
BB–AAA 188 345 383
aPercentage change based on the midpoints.
Source: Salomon Smith Barney.
Issuers now report that as much as 5%-10% of a pool may be removed (“kicked
out”) from a transaction, usually based on leverage and property type. This B-piece
buyer screening is the major factor in improving underwritten pool quality,
which has driven the decline in subordination levels.
Evolving Rating Agency Models Reflect a Maturing Market
We classify the CMBS market as just at the end of its development phase, with the
rating agencies frequently adjusting their models to account for improved loanstructural features, the benefits of pool diversification, the stable real estate market,
and additional data from CMBS transactions. The original rating agency models
were based on the study of early-1990 life insurance company mortgage default and
loan recovery rates. These underlying life insurance loans were significantly
different from the structured mortgages currently placed in CMBS pools, leaving the
rating agencies to estimate subordination measures for the new structural features.
Given the untested nature of the CMBS market at this time, the rating agencies
tended to use conservative default and loss assumptions when creating their first
CMBS models. However, with today’s fundamentally strong commercial mortgage
market, many investors and rating agencies now expect that the next economic
slowdown will create a less severe real estate downturn. Considering the strong realestate market and conduit pool performance, it is not surprising that the rating
agencies have decided to make small adjustments to their models.
We should caution that not all rating agencies may have changed their models, and
yet, they may be able to match other rating agencies’ lower levels on recent
transactions. Their models may not have changed mathematically, but rather their
analysts may be interpreting the mortgage loan data with an eye to the strong
markets and improving property values. Overall, we believe that the contraction
January 9, 2001 A Guide to Commercial Mortgage-Backed Securities
22
in rating agency subordination models reflects flexibility and the realization by
the rating agencies that their initial models were too conservative in assessing
some pool characteristics.
Investor Implications
But what are the implications of the declining levels for investors? Even with the 6%
decline in triple-A CMBS subordination levels, CMBS pools can still withstand a
high frequency of defaults and loss severity prior to experiencing a loss. The credit
support built into 2000 CMBS transactions is well in excess of that found in high-
risk mortgage security products (subprime or home equity loans).
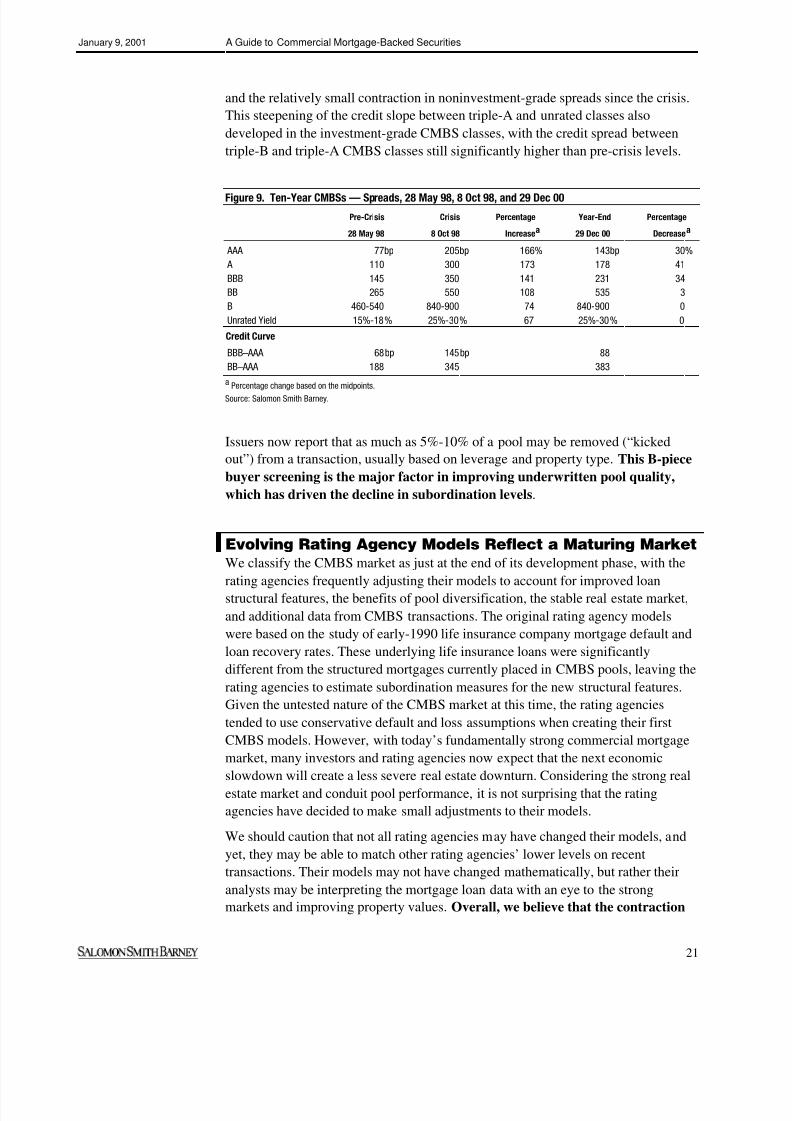
To illustrate this point, in Figure 10, we analyze average 2000 CMBS subordination
levels and the implied default rate at each credit enhancement level. To back out the
implied default rate, we divided each subordination level by a 40% expected loan loss.
As previously discussed, rating agencies use different expected loss rates, typically
ranging from 30% to 50%, depending on their actual assessment of the underlying real
estate. We felt the a 40% loss rate was conservative given the structural features of 2000 conduit mortgages and current, stable real estate market conditions. Specifically,
we believe that the currently strong real estate market will make it less likely that
borrowers will default, while professional servicing and the cash management
structure of current conduit loans should limit future foreclosure loan losses.
Figure 10. CMBSs — Implied Default Rates at 40% Loan Loss
2000 CMBS Divide Level Loan Defaults
Class Credit by Expected Required
Class Enhancement Loan Loss = for Loss
AAA 24.61% / 40.0% = 61.5%
AA 20.10 / 40.0 = 50.2
A 15.65 / 40.0 = 39.1
BBB 10.99 / 40.0 = 27.5
BBB- 9.61 / 40.0 = 24.0
BB 5.33 / 40.0 = 13.3
B 2.60 / 40.0 = 6.5
Source: Salomon Smith Barney.
Figure 10 demonstrates that an average 2000 mortgage pool experiencing a 40%
loan loss on every default would require 39% of the loans to default before the
single-A rated class lost any of its principal. Similarly, a 24% loan default rate is
required for a triple-B-minus loss and a 61.5% loan default rate is required for atriple-A class loss.
It is helpful to compare the implied default rates to those in the 1994 Snyderman
commercial default study.5This study tracked 10,955 commercial mortgage loans,
originated by eight insurance companies. The study observed a 13.8% default rate
over a five-year period and projected an 18.3% lifetime default rate for the entire
5
“Update to Commercial Mortgage Defaults,” Mark P. Snyderman, The Real Estate Finance Journal, Vol. 10, No. 1, Summer 1994.
January 9, 2001 A Guide to Commercial Mortgage-Backed Securities
23
pool. The study showed lifetime default rates that ranged from 7.6% to 21.5%,
depending on the period studied, the originator, and the lifetime projection method.
Therefore, it is clear that the investment-grade implied default rates in Figure 10
have a more than sufficient buffer when compared with the study’s worst case
lifetime default rate of 21.5%.
If we accept that a 40% expected loss is reasonable, then the projected defaultrates for triple-A through triple-B classes seem conservative relative to
historical default data and projections for the next real estate recession. The
realization that early credit enhancements models were tougher than current
subordination calculations helps explain why most CMBS spreads have tightened
significantly after only a couple years of seasoning. Investors looking at 2000
transactions should also take comfort from the fact that rating agencies have room to
with 20% subordination in the triple-A class. Therefore, we expect that 2000
issuance will become another vintage subordination level year with the
potential to season to tighter spreads. In contrast, we feel that double-B, single-
B, and unrated subordination levels have declined as far as they can. However,double-B and single-B CMBS investors buy at a discount to par and typically
receive a full return of their capital in the first few years of their investment.
January 9, 2001 A Guide to Commercial Mortgage-Backed Securities
24
Banks, real estate investors, and developers continue to watch for a real estate
recession, mindful of the last real estate market meltdown in 1991. This cautionary
approach to the real estate market has created a market in which speculativedevelopment is rare. US construction starts in office and industrial properties have
not returned to the levels of the late 1980s because construction financing has been
largely unavailable without significant preleasing.6
Another factor has been the
dearth of liquidity in the recent marketplace. Although 1999 and early-2000 retail,
multifamily, and hotel construction levels approached late-1980s levels, CMBS
investors have demonstrated good market awareness and avoided transactions with
large exposures to hotel, unanchored retail, and power centers.
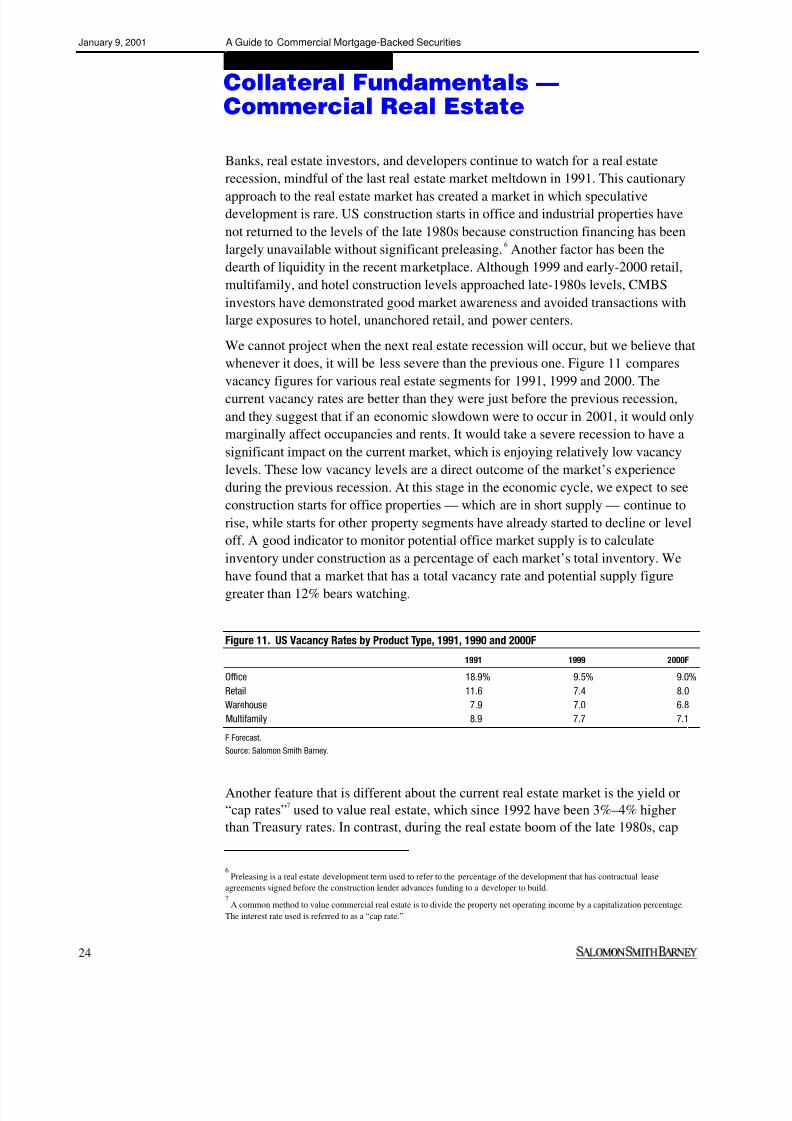
We cannot project when the next real estate recession will occur, but we believe that
whenever it does, it will be less severe than the previous one. Figure 11 compares
vacancy figures for various real estate segments for 1991, 1999 and 2000. Thecurrent vacancy rates are better than they were just before the previous recession,
and they suggest that if an economic slowdown were to occur in 2001, it would only
marginally affect occupancies and rents. It would take a severe recession to have a
significant impact on the current market, which is enjoying relatively low vacancy
levels. These low vacancy levels are a direct outcome of the market’s experience
during the previous recession. At this stage in the economic cycle, we expect to see
construction starts for office properties — which are in short supply — continue to
rise, while starts for other property segments have already started to decline or level
off. A good indicator to monitor potential office market supply is to calculate
inventory under construction as a percentage of each market’s total inventory. We
have found that a market that has a total vacancy rate and potential supply figuregreater than 12% bears watching.
Figure 11. US Vacancy Rates by Product Type, 1991, 1990 and 2000F
1991 1999 2000F
Office 18.9% 9.5% 9.0%
Retail 11.6 7.4 8.0
Warehouse 7.9 7.0 6.8
Multifamily 8.9 7.7 7.1
F Forecast.
Source: Salomon Smith Barney.
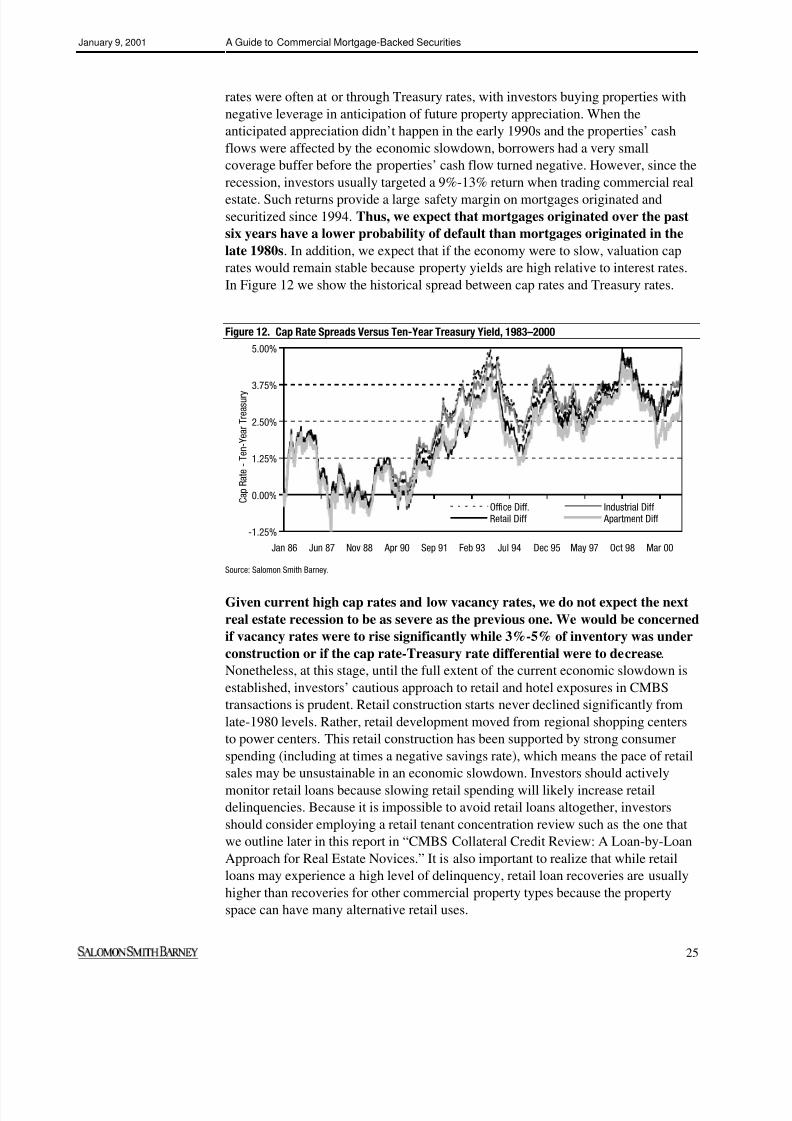
Another feature that is different about the current real estate market is the yield or
“cap rates”7
used to value real estate, which since 1992 have been 3%–4% higher
than Treasury rates. In contrast, during the real estate boom of the late 1980s, cap
6
Preleasing is a real estate development term used to refer to the percentage o f the development that has contractual lease
agreements signed before the construction lender advances funding to a developer to build.7
A common method to value commercial real estate is to divide the property net operating income by a capitalization percentage.
The interest rate used is referred to as a “cap rate.”
Given current high cap rates and low vacancy rates, we do not expect the next
real estate recession to be as severe as the previous one. We would be concerned
if vacancy rates were to rise significantly while 3%-5% of inventory was under
construction or if the cap rate-Treasury rate differential were to decrease.
Nonetheless, at this stage, until the full extent of the current economic slowdown is
established, investors’ cautious approach to retail and hotel exposures in CMBS
transactions is prudent. Retail construction starts never declined significantly from
late-1980 levels. Rather, retail development moved from regional shopping centers
to power centers. This retail construction has been supported by strong consumer
spending (including at times a negative savings rate), which means the pace of retail
sales may be unsustainable in an economic slowdown. Investors should activelymonitor retail loans because slowing retail spending will likely increase retail
delinquencies. Because it is impossible to avoid retail loans altogether, investors
should consider employing a retail tenant concentration review such as the one that
we outline later in this report in “CMBS Collateral Credit Review: A Loan-by-Loan
Approach for Real Estate Novices.” It is also important to realize that while retail
loans may experience a high level of delinquency, retail loan recoveries are usually
higher than recoveries for other commercial property types because the property
January 9, 2001 A Guide to Commercial Mortgage-Backed Securities
26
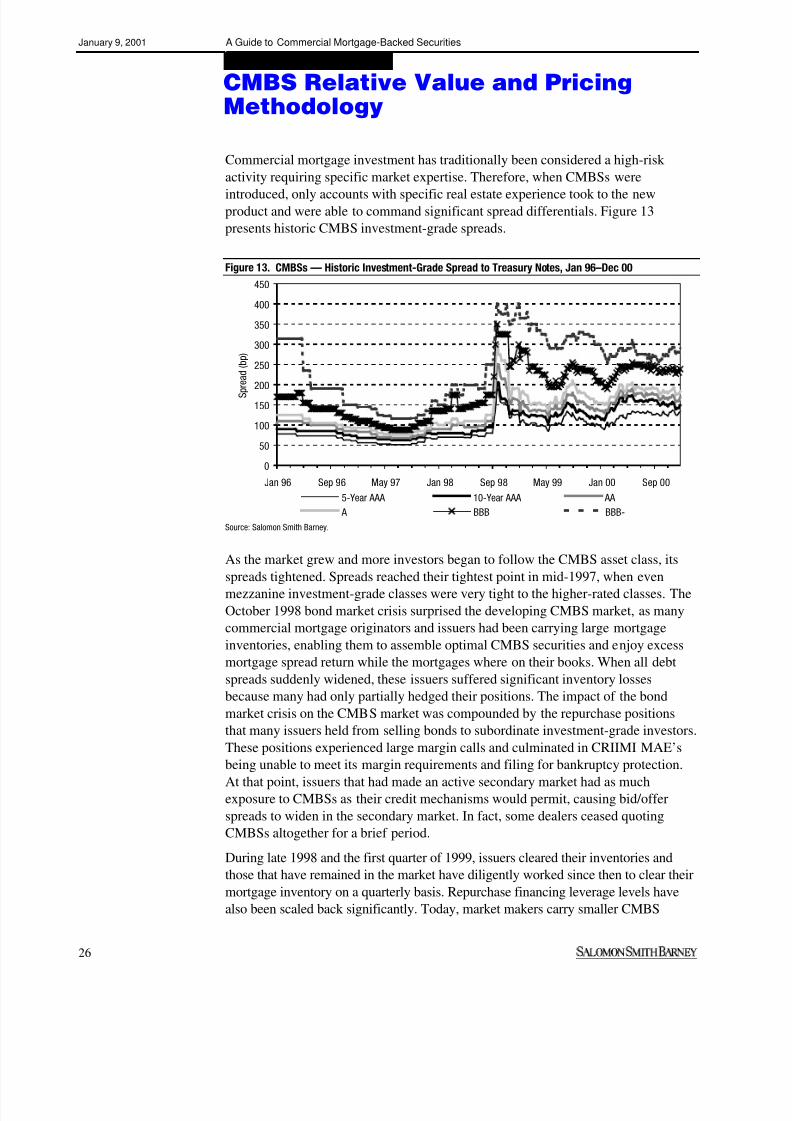
Commercial mortgage investment has traditionally been considered a high-risk
activity requiring specific market expertise. Therefore, when CMBSs were
introduced, only accounts with specific real estate experience took to the newproduct and were able to command significant spread differentials. Figure 13
presents historic CMBS investment-grade spreads.
Figure 13. CMBSs — Historic Investment-Grade Spread to Treasury Notes, Jan 96–Dec 00
0
50
100
150
200
250
300
350
400
450
Jan 96 Sep 96 May 97 Jan 98 Sep 98 May 99 Jan 00 Sep 00
S p r e a d ( b p )
5-Year AAA 10-Year AAA AA
A BBB BBB-
Source: Salomon Smith Barney.
As the market grew and more investors began to follow the CMBS asset class, its
spreads tightened. Spreads reached their tightest point in mid-1997, when evenmezzanine investment-grade classes were very tight to the higher-rated classes. The
October 1998 bond market crisis surprised the developing CMBS market, as many
commercial mortgage originators and issuers had been carrying large mortgage
inventories, enabling them to assemble optimal CMBS securities and enjoy excess
mortgage spread return while the mortgages where on their books. When all debt
spreads suddenly widened, these issuers suffered significant inventory losses
because many had only partially hedged their positions. The impact of the bond
market crisis on the CMBS market was compounded by the repurchase positions
that many issuers held from selling bonds to subordinate investment-grade investors.
These positions experienced large margin calls and culminated in CRIIMI MAE’s
being unable to meet its margin requirements and filing for bankruptcy protection.
At that point, issuers that had made an active secondary market had as much
exposure to CMBSs as their credit mechanisms would permit, causing bid/offer
spreads to widen in the secondary market. In fact, some dealers ceased quoting
CMBSs altogether for a brief period.
During late 1998 and the first quarter of 1999, issuers cleared their inventories and
those that have remained in the market have diligently worked since then to clear their
mortgage inventory on a quarterly basis. Repurchase financing leverage levels have
also been scaled back significantly. Today, market makers carry smaller CMBS
January 9, 2001 A Guide to Commercial Mortgage-Backed Securities
28
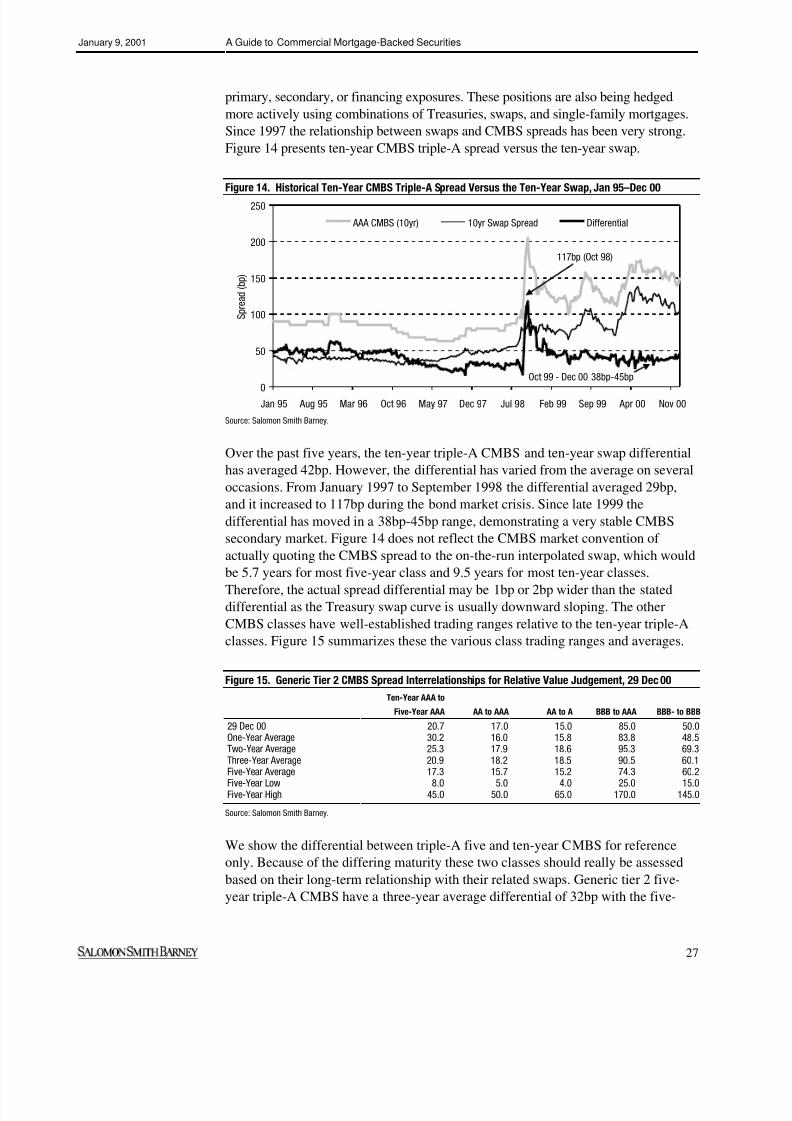
year swap. And as previously illustrated, the ten-year triple-A class has a five-year
average differential of 42bp with the ten-year swap.
If we look at the five-year average spread step-up for going down one class, Figure
15 demonstrates that investors should expect to pick up 15.7bp for investing in
double-As versus triple-As and 15.2bp for investing in single-As versus double-As.
The five-year differential between triple-Bs and triple-As is 74.3 but has been muchwider in recent years, averaging 95bp over the past three years. Meanwhile, the
recent strong collateralized bond offering bid leaves triple-B minus spreads trading
10bp inside their five-year average differential with triple-B.
We have provided these CMBS inter-relationship ranges and averages as a reference
point only. The high and low spread differentials have varied significantly from their
averages over different periods of time. The key to successful relative-value investing
is to spot the collateral feature or trend that will attract investors to one of the various
certificate classes and cause one of the relationships to move away from its established
average range.
Many investors and analysts compare triple-A CMBS to single-A corporate bonds.
We have never compared a CMBS class to anything other than the similarly rated
corporate class, because down-rated comparisons imply the CMBS class should be
trading wide of a lesser-rated security. Recent CMBS spreads, which have
demonstrated strong performance versus similarly rated corporate bonds, seem to
vindicate this relative-value credit approach. Given the credit protection provided
by the senior/subordinate structure of CMBSs and their strong underlying
collateral performance, these credits should prove as good as or better than
similarly rated corporate credits. Specifically, the CMBS structure means that any
CMBS downgrade usually only results in a one-notch downgrade for a certificate —
from single-A to single-A-minus (incrementally) for example — because of the
subordinate credit enhancement built into each transaction. By contrast, corporate
downgrades have demonstrated that they can move through multiple classes (single-A corporate ratings can become double-B or single-B) in a short time frame. Of
course, to perform a full relative-value analysis investors should still review
alternative investment opportunities.
In addition, the CMBS market continues to demonstrate strong liquidity that should
persist in an economic stress scenario as long as the underlying collateral
fundamentals remain strong. In an economic slowdown we would expect that cash
flow deterioration would be slow and, as Fitch highlighted in a recent study,8
partially offset by the loan diversification in the CMBS pools. However, as CMBSs
are a relatively new product, the market needs tangible evidence of how CMBS
collateral delinquencies and losses perform versus other debt products in an
economic stress scenario. Once CMBS have demonstrated the credit benefit of their subordinate structure, then their strong liquidity should ensure they trade on par
with similarly rated corporate classes.
8 Comparing CMBS and Corporate Bond Defaults, Diane Lans and Janet Price, Fitch, November 17, 2000.
January 9, 2001 A Guide to Commercial Mortgage-Backed Securities
29
Restrictions on prepayments, along with the time and cost (typically 3%-5% of the
loan balance) involved in refinancing a commercial loan, mean that CMBS investorsare unlikely to experience the sudden refinancings that afflict investors in MBSs
backed by residential loans. However, defaults and resulting liquidations of loans
can prepay principal to the upper-rated classes and create losses to the most
subordinate class. Therefore, many investors also supplement their spread analysis
with analysis that takes into consideration the potential of early bond prepayment
from voluntary or involuntary loan prepayments. Alternatively, if the loan defaults
occur at loan maturity, then the CMBS certificate holder can find the mortgages
being extended, increasing their average life.
Because of their potential cash flow volatility, many CMBS investors use collateral
cash flow services to evaluate the bonds under different prepayment, default, and
loss scenarios. The three major CMBS cash flow-modeling services are CharterResearch, Intex Solutions, and TREPP. Each of these services enables an investor to
model different prepayment speeds, delinquencies, and losses to evaluate CMBS
pricing and yield sensitivity. Because defaults have been random and unpredictable,
many investors feel that general overall default and prepayment rates, while
admittedly unrealistic, at least provide some baseline stress analysis. Investors
usually use four common pricing scenarios:
1 0% CDR9
and 0% CPY.10
Zero defaults, no prepayments during the loan lock-
out and yield maintenance periods, followed by no prepayments after the loans’
yield maintenance periods (0% CPY). Although unrealistic, this measure is the
most common starting point to reference CMBS pricing.
2 0% CDR and 100% CPY. Zero defaults, no prepayments during the lock-outand yield maintenance periods, followed by prepayment in full (an assumption
usually labeled 100% CPY). This is a common scenario and is also used by
investors as a base line.
3 0% CDR for 2 years, 1% CDR thereafter and 100% CPY. Zero defaults for
the first two years, followed by a 1% constant default rate (1% CDR) at a 40%
loss severity over a 12-month recovery period with no prepayments during the
lock-out and yield maintenance periods, followed by prepayment in full. A
default rate of 1% per year (or a CDR of 1%) implies a cumulative default rate of
9.5% after ten years, which we view as a likely scenario. Investors usually also
vary the loss rate from 30% to 50%.
4 0% CDR for 2 years, 2% CDR thereafter and 100% CPY. Zero defaults for
the first two years, followed by a 2% constant default rate (2% CDR) at a 40%
loss severity over a 12-month recovery period with no prepayments during the
lock-out and yield maintenance periods, followed by prepayment in full. A 2%
9
CDR refers to a constant default rate that is applied annually to the outstanding pool balance.10
CPY refers to constant prepayment rate following the yield maintenance period.
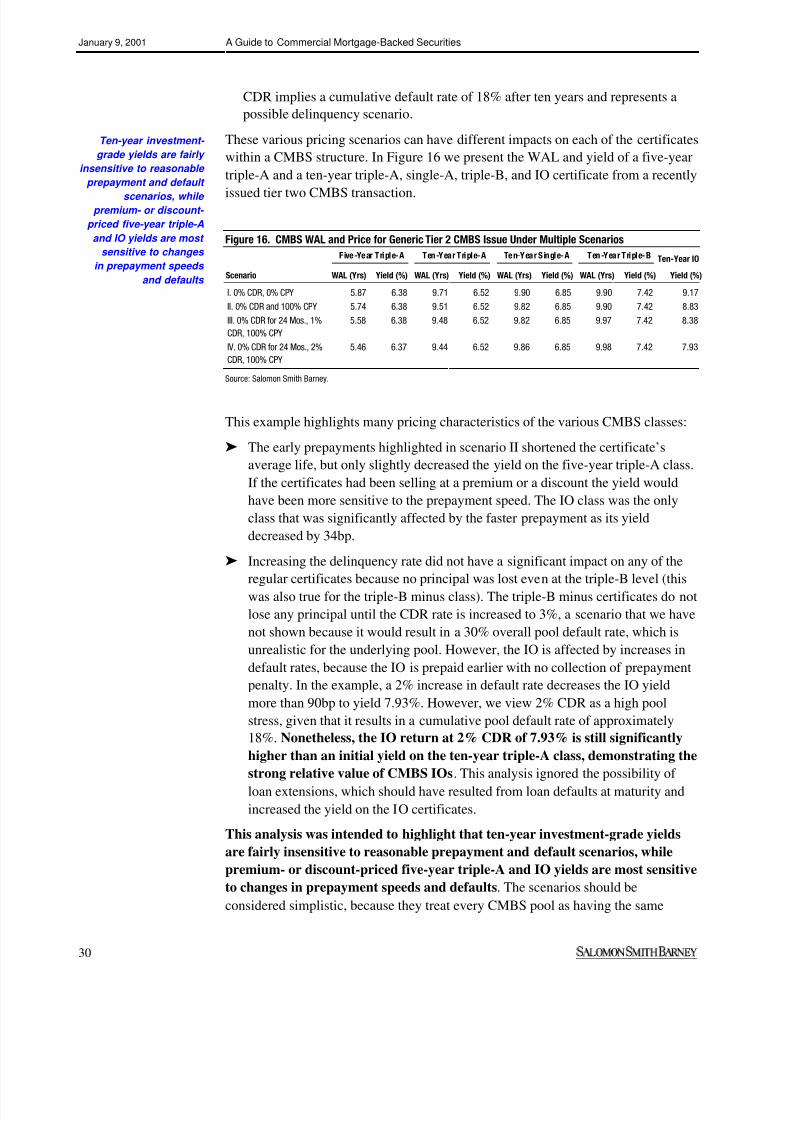
II. 0% CDR and 100% CPY 5.74 6.38 9.51 6.52 9.82 6.85 9.90 7.42 8.83
III. 0% CDR for 24 Mos., 1%
CDR, 100% CPY
5.58 6.38 9.48 6.52 9.82 6.85 9.97 7.42 8.38
IV. 0% CDR for 24 Mos., 2%
CDR, 100% CPY
5.46 6.37 9.44 6.52 9.86 6.85 9.98 7.42 7.93
Source: Salomon Smith Barney.
This example highlights many pricing characteristics of the various CMBS classes:
É The early prepayments highlighted in scenario II shortened the certificate’s
average life, but only slightly decreased the yield on the five-year triple-A class.
If the certificates had been selling at a premium or a discount the yield would
have been more sensitive to the prepayment speed. The IO class was the only
class that was significantly affected by the faster prepayment as its yield
decreased by 34bp.
É Increasing the delinquency rate did not have a significant impact on any of the
regular certificates because no principal was lost even at the triple-B level (thiswas also true for the triple-B minus class). The triple-B minus certificates do not
lose any principal until the CDR rate is increased to 3%, a scenario that we have
not shown because it would result in a 30% overall pool default rate, which is
unrealistic for the underlying pool. However, the IO is affected by increases in
default rates, because the IO is prepaid earlier with no collection of prepayment
penalty. In the example, a 2% increase in default rate decreases the IO yield
more than 90bp to yield 7.93%. However, we view 2% CDR as a high pool
stress, given that it results in a cumulative pool default rate of approximately
18%. Nonetheless, the IO return at 2% CDR of 7.93% is still significantly
higher than an initial yield on the ten-year triple-A class, demonstrating the
strong relative value of CMBS IOs. This analysis ignored the possibility of loan extensions, which should have resulted from loan defaults at maturity and
increased the yield on the IO certificates.
This analysis was intended to highlight that ten-year investment-grade yields
are fairly insensitive to reasonable prepayment and default scenarios, while
premium- or discount-priced five-year triple-A and IO yields are most sensitive
to changes in prepayment speeds and defaults. The scenarios should be
considered simplistic, because they treat every CMBS pool as having the same
January 9, 2001 A Guide to Commercial Mortgage-Backed Securities
31
probability of default and expected prepayment speeds. A more sophisticated
analysis would involve basing prepayments upon expected underlying equity
refinance “cash-out” objectives and defaults upon expected future LTVs. All three
of the major cash flow modeling companies provide data on the underlying
properties’ most recent reported NOI, enabling investors to adjust future expected
property cash flow based on property- or region-specific NOI growth assumptions.In addition, other third-party services can be tied into the three cash flow models,
providing cash flow growth and future valuation parameters based on their analysis
of property market conditions in each of the various regions.
CMBS Default Data
As discussed earlier, a good starting place to review CMBS defaults is the 1994
Snyderman commercial default study11
and our recent performance report of the
public universe of CMBS data.12
The Snyderman study tracked 10,955 commercial
mortgage loans, originated by eight insurance companies. The study observed a
13.8% default rate over a five-year period (equivalent to an annual rate of 2.6%
CDR) and projected an 18.3% lifetime default rate for the entire pool (1.7% CDR).
The study provided further expected lifetime default rates that ranged from 7.6%
(1% CDR) to 21.5% (2% CDR), depending on the period studied, the originator, and
the lifetime projection method. Our performance report shows that post-1993 CMBS
collateral has accrued a 0.28% delinquency rate after two years, a 0.55%
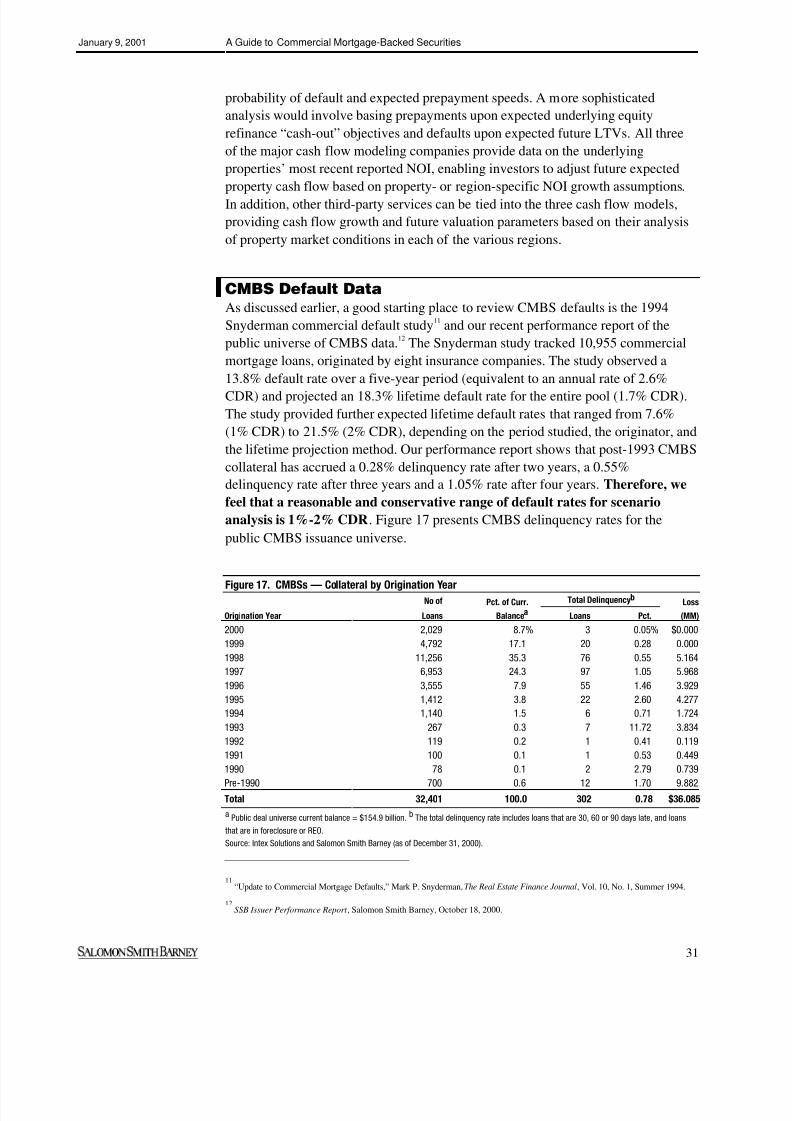
delinquency rate after three years and a 1.05% rate after four years. Therefore, we
feel that a reasonable and conservative range of default rates for scenario
analysis is 1%-2% CDR. Figure 17 presents CMBS delinquency rates for the
January 9, 2001 A Guide to Commercial Mortgage-Backed Securities
32
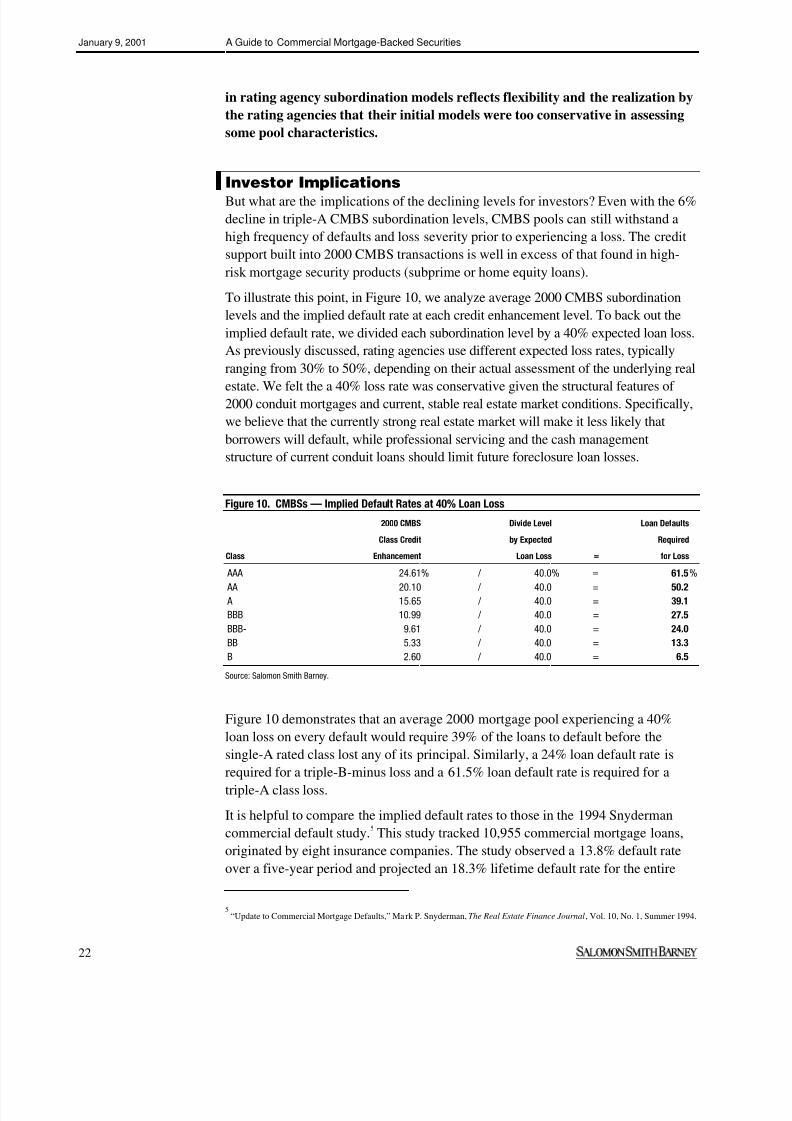
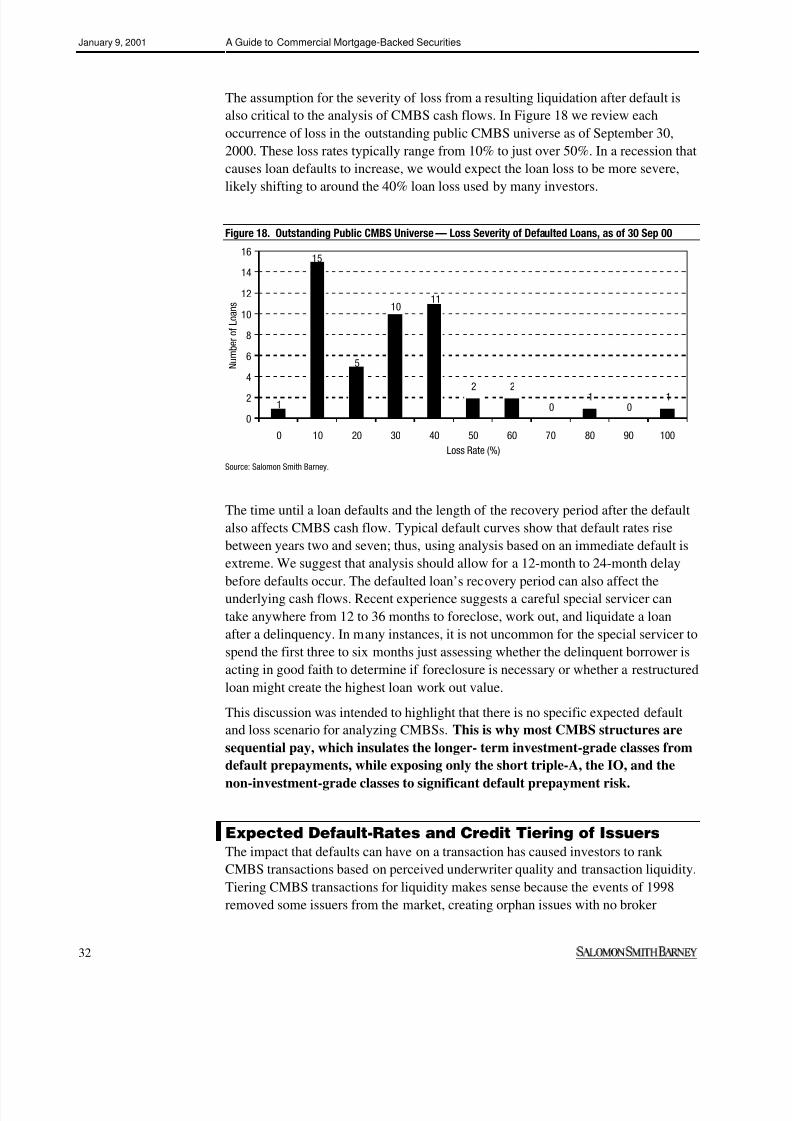
The assumption for the severity of loss from a resulting liquidation after default is
also critical to the analysis of CMBS cash flows. In Figure 18 we review each
occurrence of loss in the outstanding public CMBS universe as of September 30,
2000. These loss rates typically range from 10% to just over 50%. In a recession that
causes loan defaults to increase, we would expect the loan loss to be more severe,
likely shifting to around the 40% loan loss used by many investors.
Figure 18. Outstanding Public CMBS Universe — Loss Severity of Defaulted Loans, as of 30 Sep 00
2 2
01
01
5
1011
15
1
0
2
4
6
8
10
12
14
16
0 10 20 30 40 50 60 70 80 90 100
Loss Rate (%)
N u m b e r o f L o a n s
Source: Salomon Smith Barney.
The time until a loan defaults and the length of the recovery period after the default
also affects CMBS cash flow. Typical default curves show that default rates rise
between years two and seven; thus, using analysis based on an immediate default is
extreme. We suggest that analysis should allow for a 12-month to 24-month delay
before defaults occur. The defaulted loan’s recovery period can also affect theunderlying cash flows. Recent experience suggests a careful special servicer can
take anywhere from 12 to 36 months to foreclose, work out, and liquidate a loan
after a delinquency. In many instances, it is not uncommon for the special servicer to
spend the first three to six months just assessing whether the delinquent borrower is
acting in good faith to determine if foreclosure is necessary or whether a restructured
loan might create the highest loan work out value.
This discussion was intended to highlight that there is no specific expected default
and loss scenario for analyzing CMBSs. This is why most CMBS structures are
sequential pay, which insulates the longer- term investment-grade classes from
default prepayments, while exposing only the short triple-A, the IO, and the
non-investment-grade classes to significant default prepayment risk.
Expected Default-Rates and Credit Tiering of Issuers
The impact that defaults can have on a transaction has caused investors to rank
CMBS transactions based on perceived underwriter quality and transaction liquidity.
Tiering CMBS transactions for liquidity makes sense because the events of 1998
removed some issuers from the market, creating orphan issues with no broker
January 9, 2001 A Guide to Commercial Mortgage-Backed Securities
33
specifically committed to providing a market. Factoring in underwriter quality is
meant to account for the concept of “credit culture,” which the market suggests is
stronger in bank-based originators. Credit culture is the idea that some institutions
have underwriting checks by third parties whose compensation is in no way tied to
issuance volume. However, as discussed in the appendix of this report, the rating
agencies review the underwriter’s credit origination process and adjust creditenhancement levels to account for their analysis. Agencies’ opinions on an
underwriter are contained in the presale report and, in our experience, can cause a
subordination variance of up to 2% between transactions. The extra subordination
built into some transactions may mean that investors are overcompensating for
issuer quality if they also differentiate prices based on issuer. We have analyzed
CMBS default rates by issuer but, given the current strong real estate environment,
are unable to detect a meaningful relationship between issuer and loan performance.
Loan performance by issuer figures are provided in Appendix C of our quarterly SSB
Issuer Performance Report .13
To date, loan defaults could be best described as random events. In general, defaults
are higher in floating-rate transactions and on single-tenant retail properties. As of the third quarter 2000, the public CMBS universe showed losses of only $27 million
on an entire CMBS bond universe of $233 billion, which is impressive relative to
other asset-backed securities. However, the current economic environment is not a
good recession test of the CMBS credit-enhancement structure, and none of the
underlying pools has aged to the typical ten-year balloon test date. We expect that
when the next recession occurs, a default pattern will develop based on origination
year, underwriting quality, and property type.
Delinquency rates are important, because any large delinquency immediately affects
a CMBS transaction’s liquidity and causes CMBS spreads to widen. This spread
widening is well acknowledged to be illogical, given that some defaults are originallyprojected for all CMBS transactions and are unlikely to create an investment-grade
principal loss. However, given that spreads widen quickly on any bad, deal-
specific news, investors have actively bid for transactions with low expected
default rates, creating a small pricing difference between some issuers.
Although highly subordinated transactions may experience more defaults, they are
unlikely to remain on credit watch for long periods because the extra credit
enhancement usually enables the rating agency to affirm levels quickly. In 1999 a
good example of the benefits of high subordination came from three credit tenant lease
(CTL) transactions that contained a large amount of Rite Aid exposure.14
In November
1999 Moody’s downgraded Rite Aid to B1, putting the three CTL transactions on
credit watch. The largest Rite Aid exposure was contained in MLMI 1998 CTL, whichhad more than a 20% exposure, while two other CTL transactions had less than 10%
of their loans backed by Rite Aid. However, MLMI also contained almost twice the
13
SSB Issuer Performance Report , Darrell Wheeler and Jeffrey Berenbaum, Salomon Smith Barney, October 18, 2000.
14We presented a full analysis of this transaction in our article, “Pricing Tenant Concentration Risk into Credit Tenant Lease
Transactions,” Darrell Wheeler, Bond Market Roundup: Strategy, Janet Showers, et al., Salomon Smith Barney, November 12, 1999.
January 9, 2001 A Guide to Commercial Mortgage-Backed Securities
34
credit enhancement of the other CTL transactions, enabling Moody’s to quickly affirm
MLMI while the other transactions remained on credit watch.
Transactions vary and this simple example may not always apply. In general,
transactions with high credit subordination levels have extra default and loss
protection and may weather a recession better than a lower-leverage
transaction that has worse subordination levels. Specifically, a transaction with1% extra subordination at the triple-A level can withstand 2.5% more loan defaults
than a pool with lesser subordination (assuming a 40% loan loss rate).
In 1999 the market actively bid tier one and tier two issues, while tier three
transactions had limited liquidity. In 2000, the tiering price differential
narrowed as investors realized that tier two and three transactions offered
more default protection and greater relative value. As the CMBS market
experiences more defaults, investors should grow more comfortable with defaults
and further reduce any underwriter tiering differentiation in the market. Long-term
CMBS investors will find value in the lower-tier CMBS issuers, which have greater
subordination and wider spreads, while short-term CMBS investors that mark to
market should stick with the tier one and two categories to minimize defaults and the
resulting immediate spread widening caused by headline risk.
January 9, 2001 A Guide to Commercial Mortgage-Backed Securities
35
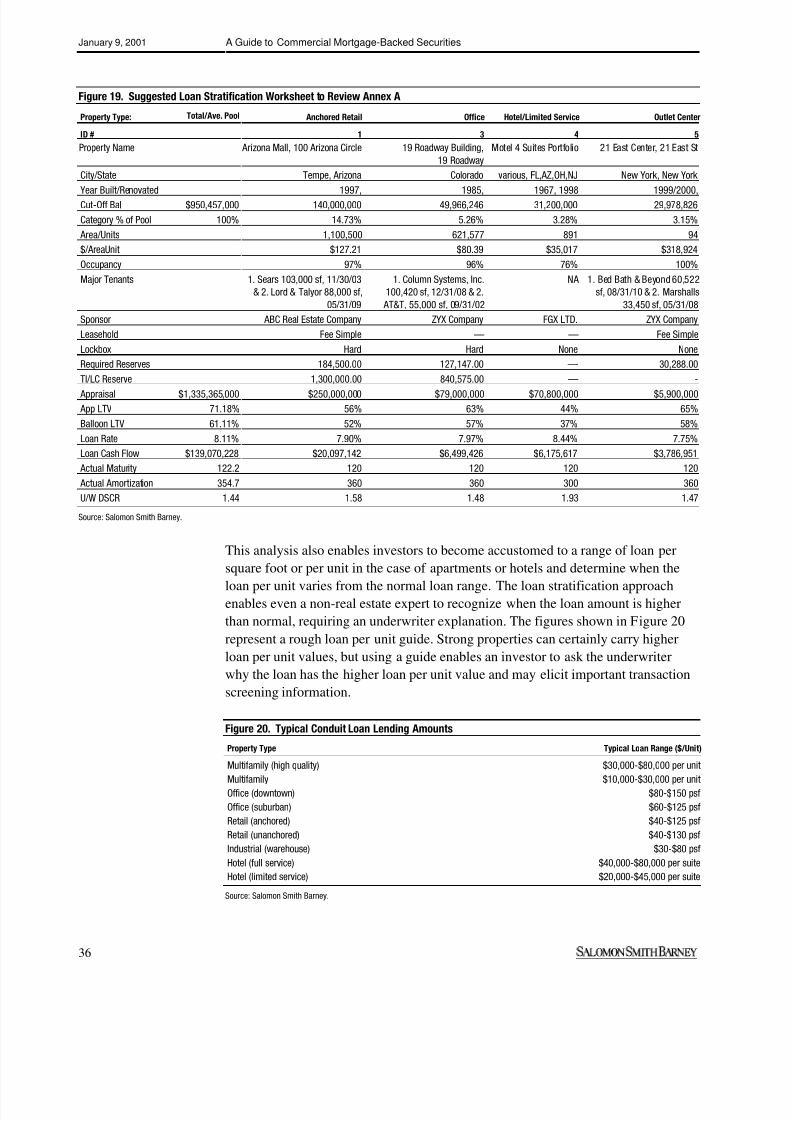
Even though CMBS transactions have significant credit enhancement and are well
diversified, it is still useful to review the underlying collateral to gain familiaritywith transactions and be able to compare one transaction to the next. The best way to
do this is by stratifying the property information provided in a spreadsheet using the
loan summary file from the issuer’s Schedule A. Given the information in Schedule
A, even a real estate novice can summarize and review the properties’ key loan data
in a consistent format to spot loan leverage or tenant irregularities.
We suggest that investors develop a format that takes Schedule A and extracts the
property type, loan name, address, balance, LTV, DSCR, building area, loan per
building area, and the top two tenants’ names with their square footage, lease expiry
dates, and other data. Once the data are in this format, an investor can quickly scan
all the properties in a transaction and determine what the major tenantconcentrations are, how much of the area they occupy, and when their leases expire.
On some property classifications such as anchored retail, this format also lets
investors get a sense of what the tenants and underwriter considered to be
“anchored” and how far the issuer felt it needed to stretch the definition. This tenant
analysis does not require significant real estate expertise, just a general knowledge
of the nation’s major retailers and corporations and an eye to question when one
tenant may account for too much of a loan’s square footage. Figure 19 shows a
typical loan stratification format that we would suggest.
We gain comfort when we see that the two largest tenants hold less than 6,000
square feet of any larger property, because it is easier to replace a smaller tenant
from the larger pool of potential replacement tenants. In addition, having moresmaller tenants means that the property’s revenues are more widely distributed than
a property with fewer, larger tenants.
This loan stratification technique is especially helpful in reviewing retail properties.
In a retail mall in which one or two large tenants represent more than 60% of the
loan’s rentable area, they likely provide the draw to the center that enables the
smaller tenants to pay high rents. Anchor tenants usually under-contribute to the
malls’ revenues (paying $2-$12 per square foot (psf)), while the smaller tenants
usually provide the bulk of the property’s income (paying rents of $15-$30 psf or
more). The real risk of anchored retail is that the loss of the anchor tenant can
leave the other smaller tenants without the necessary traffic to generate theirhigher rent payments. In the current strong economy an anchor tenant loss has not
presented a significant problem to borrowers, because in most cases a replacement
tenant has been available. However, in a slower economy, the loss of a large tenant
may have a severe impact.
CMBS Collateral Credit Review — ALoan-by-Loan Approach for RealEstate Novices
January 9, 2001 A Guide to Commercial Mortgage-Backed Securities
37
The ranges in Figure 20 will vary by geographic region and local market conditions.
In many areas where alternative development sites are plentiful and the economy is
weak, the figures will be too high and in other areas where there are limited infill
development sites and strong economies the figures will be too low. We have
discussed the loan stratification method as a means for investors to become familiar
with the underlying real estate information and to become comfortable with theassets. For investors that only buy the senior-rated classes of CMBS transactions, a
strong argument can be made that current subordination levels provide sufficient
credit protection and that they will never need to know the underlying real estate
properties of a diverse pool. However, for investors that wish to scratch below the
transaction surface, a loan stratification table is a good way to start.
January 9, 2001 A Guide to Commercial Mortgage-Backed Securities
38
Many CMBS investors are sophisticated real estate investors and find value in
reviewing the few distressed CMBS situations available in the market. In this lastsection of this report, we describe a simple methodology to review distressed CMBS
certificates and determine the underlying bonds’ collateral risk.
Given the strong economy of the past few years no CMBS conduit transactions have
experienced significant defaults. Therefore, to get an idea of how CMBSs will
perform in a distressed scenario we are forced to review lumpier fusion or CTL
transactions. Among these lumpier CMBS transactions a major collateral event can
cause a significant widening in spreads and loss of value.
This methodology assumes a worst-case liquidation value for the affected collateral
and then removes the distressed loans from the pool using the recovery to pay down
the triple-A classes and reducing the subordinate classes by the amount of the loss.Although this analysis is simplistic and ignores any loan amortization that may take
place before a default event, it enables investors to quickly estimate if distressed
loans represent principal or even rating agency downgrade risk. In the majority of
cases, using reasonable liquidation assumptions, the subordination to the triple-A
class actually improves after liquidating the affected loans. This paydown analysis
suggests the triple-A classes of CMBS transactions that have experienced a
collateral event have significant credit protection and offer excellent relative value.
Investors in the lower-rated classes can use the same methodology to assess
investment opportunities but must carefully calculate the affected loans’ estimated
liquidation value.
To illustrate how to analyze the liquidation of distressed loans, we review twotransactions that have experienced a major decrease in collateral quality.
Case 1. Rite Aid Exposure in MLMI 1998-C1-CTLThe first CMBS transaction we review is Merrill Lynch Mortgage Investors, Inc,
Series 1998-C1-CTL. This transaction is a CTL transaction15
that at the time of this
analysis had a 20.6% concentration of loans supported by a bondable lease with Rite
Aid Corporation. On October 18, 1999, Rite Aid announced that it would restate its
financial statements for each of its fiscal years ended 1999, 1998, and 1997 by as
much as $500 million. After the announcement, the market became illiquid with the
MLMI triple-A classes trading at triple-B spreads.
We first reviewed this transaction in the fall of 1999, when Rite Aid’s corporate
rating was downgraded from BBB-/Baa3 to BB/Ba2. At that time we said that we
expected the triple-A classes to continue to be rated triple-A even if Rite Aid were to
file for bankruptcy. Then in July of 2000, S&P and Moody’s downgraded Rite Aid’s
15
CTL transactions contain commercial mortgage loans secured by one or more properties leased to tenants that have a rating
agency credit rating. The credit tenant is usually responsible for all of the costs associated with operating the property and makesloan payments to fully amortize the loan. A fully structured credit tenant’s obligation enables the rating agencies to analyze a high-leverage mortgage loan as though it carried the rating of the underlying tenant.
Liquidation and Paydown — AnAnalysis Framework for DistressedCMBS Transactions
January 9, 2001 A Guide to Commercial Mortgage-Backed Securities
39
Corporate rating to single B, but with no impact on the investment-grade rating of
the MLMI transaction. In Figure 21, we review the liquidation analysis that enabled
us to have confidence in the triple-A classes of the transaction.
To analyze Rite Aid’s potential impact on the transaction, we estimated the
liquidation value for the related loans and then removed them from the pool,
realizing the liquidation value as a prepayment to the triple-A class. Any shortfallbetween the liquidation value and the outstanding loan balance was treated as a loss
to the subordinate classes. After the entire loan balance was removed from the pool
with the proceeds prepaying the triple-A class, we recalculated the resulting
subordination levels based on the smaller loan pool. We focused on the triple-A
class because the majority of the CMBS universe is triple-A rated, and this class
directly receives the benefit of the liquidation prepayment. The mezzanine
investment-grade classes also receive a benefit from the triple-A prepayment, being
next in line for prepayment; however, the subordination loss from the reduction in
the lower classes usually overshadows the prepayment benefit.
In a CTL transaction such as MLMI, the rating agencies have developed the concept of
dark property value to refer to the alternative use value of a property that would berealized if the tenant were to default and the property had to be redeveloped for another
tenant. This dark valuation technique typically calculates value based on the area’s
market rent for similar retail space capitalized at a stabilized cap rate or property yield.
The final dark value is derived from the alternative use value by deducting the cost of
releasing the space, the lost rental revenue during the building’s foreclosure and
redevelopment, and a profit for the developer that buys and redevelops the asset. This
dark value is effectively the liquidation value needed to remove the Rite Aid loan from
the transaction. In Figure 21 we calculated the liquidation value for the Rite Aid Stores
loan and deducted the proceeds from the MLMI transaction. The result is that the
triple-A subordination level increased to 32%.
Figure 21. Subordination Levels Without Rite Aid With Expected Paydown from Rating Agency Value
Current Current Less Class Size
Credit Class Class Size Paydown/ Without Rite Subord %Rating Enhancement Size (MM) Loss (MM) Aid (MM) After Loss
AAA/Aaa 31.3% 68.7% $425.09 $91.11 $337.48 32.0%
AA and A Class 19.8 11.5 71.07 71.07 17.6%
BBB and BBB- Class 12.0 7.8 48.46 48.46 7.7%
Noninvestment Grade 12.0 74.30 36.44 37.85
Total With and Without Rite Aid 618.90 127.56 491.35
Expected Loss on Rite Aid Stores Comment
Rite Aid Loan Balance (MM) $127.56
Loan to Dark Value 140% A ratio based on the liquidation value of the empty stores calculated by
capitalizing the market rent and deducting new tenant inducement,
commissions, loss revenue, and new investor profit.
Underlying Dark Value (MM) $91.11 Equals paydown to triple-A and is greater than difference between the old
triple-A class size and the new required triple-A class size.
Expected Loss (MM) 36.44 Loss to Non Investment Grade classes
January 9, 2001 A Guide to Commercial Mortgage-Backed Securities
40
However, the downgrade risk in MLMI increases in the investment-grade classes as
one goes down the credit classes. In the example, a rating agency committee would
likely not downgrade the double-A or single-A classes based on 2.2% less
subordination after liquidating the Rite Aid loans. However, investors in the double-
A or single-A class of a transaction that has already experienced significant losses
should undertake independent liquidation analysis to ensure that they arecomfortable with the classes’ downgrade potential. We do not see any principal loss
risk in the double-A and single-A rated classes. In this liquidation scenario the
triple-B and triple-B minus classes could likely be downgraded a notch because they
lose a larger proportion of subordinate protection (12% subordination before the
liquidations becomes 7.7% after).
This example assumes that Rite Aid defaults on all the locations. A more likely
scenario might involve Rite Aid’s filing for bankruptcy and then affirming only the
leases on the better retail locations where the company has achieved its best sales.
This type of scenario would leave the special servicer with a smaller number of
below-average store locations to liquidate. Investors can use this methodology to
default and liquidate different combinations of Rite Aid and other tenants at higherloan to dark values ranging from 140% to 200%, and determine that the triple-A
class of the transaction is unlikely to be downgraded. In one of our worst-case
liquidation scenarios, the triple-A subordination decreased to 25.5%, which we think
would be a borderline point for the rating agencies to consider downgrading the
triple-A class.
Secondary investors that bought the triple-A paper at a discount should actually
want a tenant default and liquidation, because the early principal paydown will
increase their yield to maturity without triggering a downgrade to their security. The
liquidation analysis suggests that the triple-A class of the transaction is an excellent
long-term value given its current wide spread premium. The fact that thistransaction can weather 20% of the underlying loans defaulting highlights the
strength of the senior prepayment structure and is why most triple-A CMBS
certificates should trade with strong liquidity in a recession or during any deal
specific distress.
Case 2. Asset Securitization Corporation, 1997 MD VII(Limited Service Hotel Exposure)
ASC 1997 MD VII is a large loan transaction containing seven mortgages on 71
properties. The loans range in size from 5% to 33% of the pool. All four of the rating
agencies originally rated various classes of the transaction, determining that the
loans were well-structured low-leverage loans. On August 31, 1999, the largest
loan’s borrower, Fairfield Inns by Marriott LP, requested possible loan
modifications, causing the loan to be transferred to the special servicer. Since the
initial inquiry, no formal request was received from the borrower, so the loan was
transferred back to the master servicer. However, the request caused the four
agencies to review the loan and adjust their opinion of the collateral.
On September 2, 1999, Fitch IBCA downgraded the A-5 and A-6 classes, originally
rated triple-B minus, to double-B and single-B, respectively. On November 17,
January 9, 2001 A Guide to Commercial Mortgage-Backed Securities
41
1999, Moody’s downgraded the A-3 and A-4 classes from A2 to A3 and from Baa2
to Baa3, respectively. On November 24, 1999, S&P affirmed the triple-A class and
downgraded the B-1 and B-1H classed from double-B to single-B. DCR followed on
December 14, 1999, when it downgraded the A-4 class from triple-B to triple-B
minus and the A-5 class from triple-B minus to double-B. All of this rating agency
activity was a direct result of a decline in the Fairfield Hotel portfolio’sperformance.
At the time of our review, the Fairfield Inns loan had an outstanding balance of
$153.5 million, and constituted 32.6% of the transaction’s total pool balance. The
loan was structured as a first-priority, cross-collateralized, cross-defaulted mortgage
on 50 Fairfield Inns limited-service hotels spread across 16 states (6,673 rooms). All
of the rating agencies determined that the underlying properties had experienced a
significant increase in operating expenses and a decline in room revenue owing to
increased competition in the various submarkets. This operating performance
translated into a significant decline in debt service coverage since the original rating
agency reviews (see Figure 22).
Figure 22. Fairfield Loan — Rating Agency Assessment of Performance
Ori inal
Original Value/ RecentAgency DSCRa LTV (MM)a DCSR Comment
UW 1.62x $270/61% As per the offering materials.
Fitch IBCA 1.57x NA 1.16x (2 Sep 99) Recent DSCR based on TTM cashflow and actual
debt service for period ending 30 Jun 99.
Moody’s 1.53x $239/69% 1.19x (17 Nov 99) Recent DSCR based on servicer report ending 30
Jun 99.
S&P 1.59x $221.3/74.5% 1.34x (24 Nov 99) Recent DSCR based on 25% cash flow reduction
and actual debt service.
DCR 1.53x $252.5/65.6% 1.15x (14 Dec 99) Recent DSCR based on 12 months results ending
30 Sep 99.
a Original DSCR and values based on the offering documents or each rating agencies’ presale report.
Sources: Rating presale reports and rating actions.
Using the liquidation methodology to evaluate this situation requires a worst-case
estimate of the underlying value of the limited-service hotel portfolio. The rating
agency values represent a value based on a sustainable cash flow and cap rate. These
rating agency values suggest a liquidation value range of $33,000-$38,000 per room.
However, our experience from the early 1990s compels us to calculate a lower
distressed value for limited-service hotels. If the hotel’s occupancy rate were to drop
from the original underwritten 70% range to less than 50% it is possible to envisiononly a marginal portfolio cash flow, leaving value to be determined by a minimum
value per room benchmark. We called several hotel industry experts and were given
recent unflagged limited-service hotel comparable sales figures of $20,000-$30,000
(we assume that the liquidated portfolio would no longer benefit from the Fairfield
hotel flag). However, most of the experts agreed that at $15,000 per room, a buyer
would purchase the portfolio no matter what the economic circumstances. Therefore,
for our liquidation scenario we will use an extreme $15,000 per room value figure
(see Figure 23). Alternatively, investors that do not have access to real estate
January 9, 2001 A Guide to Commercial Mortgage-Backed Securities
42
expertise may have used a 40% loan loss rate16
on the original loan of $25,000 per
room and achieved the same estimated liquidation proceeds of $15,000 per room
provided by our experts.
Just as in the Rite Aid analysis, the liquidation of the Fairfield loan actually
improves the triple-A subordination levels, as the paydown to the triple-A class
is greater in proportion than the original transaction’s triple-A creditenhancement. The loss on the lower levels, however, significantly decreases the
protection to all the mezzanine investment-grade classes, leaving even the double-A
class exposed to a potential downgrade. We should caution that a scenario in which
only $15,000 per room is realized is an extremely tough stress test. A more realistic
asset liquidation figure of $20,000-$30,000 would likely expose only the triple-B
and triple-B minus classes to potential downgrades.
Figure 23. ASC 1997-MD VII Subordination Levels After Fairfield Loan Liquidation
Current Less Class Size
Current Credit Class Class Size Paydown/ without Subord %
Class/Rating Enhancement Size (MM) Loss (MM) Fairfield (MM) After Loss
AAA 36.1% 63.9% $300.21 $100.10 $200.12 36.8%
AA and A 18.6 17.5 82.43 82.43 10.7
BBB and BBB- 2.7 15.9 74.94 (40.90) 34.03
Noninvestment Grade 2.7 12.49 (12.49) —
Total With and Without Fairfield Loan 470.07 153.49 316.58
Expected Loss on Fairfield Loan Comment
Fairfield Loan Bal. (MM) $153.49
Recovery/Suite 15,000 Based on worst case liquidation value.
Total Recovery (MM) 100.10
Expected Loss (MM) 53.39 Loss to noninvestment-grade classes.
Conclusion: Resulting 36.8% Triple-A subordination remains above initial 33% subordination. No downgrade to triple-
A classes.
Source: Salomon Smith Barney.
Liquidation/Paydown Test Conclusions
The liquidation and paydown stress test is a simple calculation that any investor with
a spreadsheet can perform to make a judgement on collateral safety in CMBS
transactions that have experienced poor collateral performance. The test does not
account for the amortization that will take place during any loan liquidation and is
only as good as the liquidation assumptions that are fed into the calculation.
However, a liquidation and paydown test usually demonstrates that the triple-A
classes maintain their original credit enhancement levels even under the most
severe liquidation assumptions. This suggests that the triple-A classes of CMBStransactions that have experienced collateral distress represent significant
relative value for investors that can ride out any headline risk. The high default
rate investigated suggests that most other CMBS triple-A should also be able to
16
The 40% loan loss severity is a common loan loss rate used to estimate potential loan losses. Commercial mortgage portfolio
studies from the early 1990s suggest that a commercial mortgage will typically experience a 35% loan loss when liquidated.
January 9, 2001 A Guide to Commercial Mortgage-Backed Securities
43
withstand a significant increase in delinquencies without incurring significant
rating agency downgrade risk.
The analysis can also be used to investigate the principal safety of the lower-rated
classes of CMBS transactions to the extent these lower classes are not eliminated by
the estimated loss reduction at the bottom of the transaction. However, using the tool
to estimate downgrade potential in the mezzanine investment-grade classes is moreuncertain, because firm rules are not established as to how much subordination can
be lost before a rating agency credit committee deems a class downgrade necessary.
Finally, investors in distressed transactions should consider using one of the cash flow
modeling programs that are available to phase in expected losses and allow for
amortization of the loans during workouts. In our examples, cash flow analysis
demonstrated a reduction in loan loss and a significant yield pickup in the triple-A classes,
which are selling at a discount and, therefore, benefit from the early default prepayment.
January 9, 2001 A Guide to Commercial Mortgage-Backed Securities
44
Overall, we feel that investors reviewing CMBSs should understand the following points:
É The rating agencies have developed methods for measuring the likelihood that a
particular commercial transaction will meet its scheduled payments to investorsunder various economic scenarios. These methods focus on financial leverage
statistics, as well as on underwriting standards, property types, and property
tenancy. Overall, the rating agencies’ credit enhancement models appear to
provide excess credit protection relative to the default and loss experience
of the previous real estate recession. During the past four years rating
agencies have adjusted their commercial models to compensate for the
strong collateral performance and to more realistically reflect the
commercial property default probability. We expect that commercial credit
enhancement levels will continue to decline even as the CMBS market
experiences an economic slowdown and gains maturity.
É Current CMBS collateral fundamentals are strong because of the relatively low
level of construction funding. Seasoned CMBS transactions have benefited
the most from the strong real estate market as the underlying properties
have experienced significant appreciation since the loans were securitized,
and yet, the loans are precluded from prepayment by strong prepayment
penalties. These conditions mean that it could take several years of low
economic activity to significantly affect the credit quality of existing CMBSs.
É Relative-value analysis comparison with other spread products suggests that
CMBSs offer significant excess return. Considering the CMBS market’s
improved liquidity over the past 24 months and given similar credit risk
relative to that of other rated structured debt products, CMBS would seemto have collateral structure and market characteristics that justify a tighter
overall spread (this is especially true for the triple-A rated classes including
IO). If during the next few years CMBS collateral performs well during a
slowing economy, we expect strong investor demand will continue to push
January 9, 2001 A Guide to Commercial Mortgage-Backed Securities
45
In this section we describe the potential subordination add-ons to CMBS pools to
assist investors in reading rating agency presale reports. If any pool characteristic ishighlighted as a negative in an agency presale, investors should not be overly
concerned; rather, the discussion means that the rating agency caught a specific item
and increased subordination levels to account for the feature. This extra credit
subordination in transactions that have specific issues may cause them to price
behind the standard generic CMBS transactions offering extra relative value.
Most of the adjustments reflect specific characteristic concentrations, which are a
direct function of the overall pool size. In general, the more diversified and less
dependent a pool is on any one entity, the less concentrated the credit exposure
and the lower the subordination levels.
Diversity
As previously discussed, diversity is a measure of the loan concentration or
“lumpiness” of the pool, which can affect subordination from 0% to 20%.
Moody’s uses a Herfindahl index to measure the pool’s loan concentration and then
scales its subordination add-on accordingly. The Herfindahl score is calculated by
taking the inverse of the sum of the squares of each mortgage loan as percentage of
the overall pool.
∑=
2 pool)(loan/loan
1 Index Herfindahl
Most recent fixed-rate conduit transactions have had a Herfindahl score of 75 to 85,while a Herfindahl score of 100 is considered to be diverse and requires no add-on.
Pools with a Herfindahl score below 60 should be considered lumpy, requiring
significant extra credit enhancement. Investors in these lumpy pools are protected by
the extra credit enhancement, but should make an effort to understand the larger
underlying loans in case a default causes headline risk.
In the past, Fitch has looked at the three largest loans as a percentage of the pool and
assumed that they will default to create an add-on factor; thus, the larger the
percentage represented by the three loans, the larger the subordination add-on is.
Similar to Moody’s Fitch has just adjusted its model to look beyond the largest three
loans by also using a statistical measure of the pool’s loan diversity. Fitch then
attaches a scale to its diversity measure to reflect a pool add-on of 0% to 15%,depending upon the lumpiness of the mortgage pool.
Property Type (Loan Specific)
The agencies believe that the optimal credit consists of a pool perfectly diversified
by property type. Given a less than perfectly diversified pool, the agencies make a
credit assessment based on assumptions regarding the credit risk of each property
category. To do this, the rating agencies assign the property types different default
probabilities or loss severity based on property-specific valuation property yields or
January 9, 2001 A Guide to Commercial Mortgage-Backed Securities
46
DSCRs. In general, the property types listed from least risky to most volatile are
multifamily, mobile home, anchored retail, industrial, office, unanchored retail, full-
service hotel, self-storage, nursing home or health care, and limited-service hotels.
The agencies may also penalize the more volatile property types with a higher
probability of default in addition to the tougher valuation parameters to reflect their
less stable cash flows.Recently, Moody’s and Fitch have extended this property type analysis to reflect the
individual MSA property market vacancy and expected rental growth projections,
while S&P is on the record as stating that individual property inspections are the
best property assessment method. S&P’s property review methodology is valid to
the extent that an agency is able to sample a large enough sample of the property
pool being reviewed. As the market matures, the agencies have been sampling
smaller portions of the overall pools, which the Moody’s and Fitch’s MSA
methodology is meant to address.
Geographic Concentrations
Similar to property type, a commercial mortgage pool diversified by geographiclocation will reduce risk and, thus, required loss coverage. The agencies have
developed a variety of methodologies to increase or decrease a CMBS transaction’s
subordination levels to account for geographic diversity. In most cases, once a pool
is located more than 20% in one state, a subordination penalty will be scaled to the
concentration (California is usually divided into two states, north and south, to
account for its economic diversity and large population size). In addition, within the
past year, Moody’s and Fitch have each introduced pool scoring methodologies to
account for the pool’s diversity by property type and industry concentration, which
they use to adjust their geographical diversity score and the pool’s overall
subordination levels. Moody’s has taken this logic one step further with its measure
of economic diversity that also looks at the pool’s exposure to specific industrieswithin each geographic region.
17
Underwriting Quality
This evaluation reviews whether the underwriter carefully reviewed the underlying
property and its market and required appropriate loan structural features. For
example, a loan with significant lease expiries may require an escrowed releasing
reserve or even a hard lock box and cash trap in cases where a loan default is
considered highly probable.
Underwriter review also requires analysis of the underwriting criteria, appraisal
standards, special hazard policies, and workout policies of the originator and
servicer. The agencies will focus closely on the following areas in their evaluation:
1 Property appraisal standards and procedures.
2 Originator quality, based on historical portfolio performance.
17
See CMBS: Conduit Economic Diversity Update for 2000, Sally Gordon, John Chen and Natasa Agathocleous, Moody’s Investors
January 9, 2001 A Guide to Commercial Mortgage-Backed Securities
47
3 Originator’s area of expertise, by mortgage purpose (for example, refinance
versus new construction), property type and property location.
4 Servicing standards and policies, including those regarding balloon mortgages.
5 Approval procedure. Approval procedures that require third-party non-business
line credit reviews are seen as objective and receive subordination credit.
6 Documentation procedures and loan tracking systems.
In cases in which all or some of the above data are unavailable, increased credit levels
protect investors from potentially increased credit exposure. The rating agencies review
the underwriter’s work and may adjust subordination levels by plus or minus 2% to
reflect their opinion of the underwriter’s credit and loan structuring skills.
Special Servicing
The transaction’s master servicer is usually required to transfer servicing to the
special servicer after a loan has been in default for 60 days. The special servicer is
responsible to deal with the defaulted loans to restructure the loan or recover the loan
proceeds based on its assessment of the best method to maximize the net presentvalue of loan proceeds. The workout negotiation of a defaulted commercial loan is a
complex analysis and negotiation that can benefit from a special servicer’s previous
experience and ability to focus resources on the loan file. In our opinion, one person
can handle five to 20 defaulted files at any one time depending on the complexity of
the loan files. Therefore, the rating agencies may review each special servicer’s
human resources and experience and adjust subordination levels by 0% to 1.00% to
reflect their opinion of the special servicer. The issuers realize that their issuance
levels can suffer from having a poorly assessed special servicer and since 1997 have
only used special servicers that the agencies have evaluated favorably and that have
the resources to handle the next real estate recession.
Environmental Risk
When the issuer’s underwriter reviews a loan for approval, part of the loan due
diligence requires that the property undergo a Phase 1 Environmental Assessment. A
Phase I assessment usually involves a physical inspection of the property by an
engineer to detect common signs of potential environmental contamination. The
engineer will usually determine a history of the property’s past uses and investigate
related potential environmental contamination. Typical Phase I investigation may
involve soil sampling, paint inspection, and a sampling of other building materials
such as tiles or insulation. If the Phase I testing determines that there are potential
environmental issues, then a full-scale Phase II Environmental Assessment would be
undertaken during which any test needed to determine the extent of contaminationwould be conducted and a site clean-up assessment would be performed.
Any environmental clean-up costs determined in either report would have to be
reserved by 125% (to ensure a contingency buffer) before a mortgage loan is
approved. This environmental assessment procedure has become standard mortgage
loan due diligence for CMBS conduits and regular portfolio lenders, because many
state environmental laws now have site clean-up standards that can create costs in
excess of the mortgage value or even the property value. Sometimes small-balance
commercial loans may be approved without a Phase I environmental review. In this
January 9, 2001 A Guide to Commercial Mortgage-Backed Securities
48
case the rating agency may adjust the specific loan’s subordination levels up by 5%-
10% depending on its assessment of likely contamination in the loan. However,
most times when an issuer securitizes a loan, or group of loans, that have not had an
environmental assessment, the issuer will obtain an environmental insurance policy
that provides protection from preexisting, but undetected, contamination, and any
liabilities that may result from the contamination.
Loan Amortization (Loan Specific)
Most fixed-rate conduit commercial mortgages are ten-year balloon loans with 30-
year amortization schedules. Sometimes the underwriter may create a loan with a
shorter amortization period (20 or 25 years) to reduce the balloon refinance risk for
one of the more volatile property types. Or, the loan may be interest only with no
amortization. The rating agencies adjust their loan credit enhancement levels to
account for amortization differential by changing their assessment of loss potential
or default risk at expiry. For instance, Fitch may assess a regular ten-year term 30-
year amortization loan a 36% loss severity and an interest-only loan a full 40% loss
severity. These assessments could change the loan’s credit support by 2%-4%.
Leasehold Interests (Loan Specific)
When the mortgaged property is encumbered by a ground lease, the rating agencies
carefully review the terms and rights of the ground tenant and the landlord. The
rating agencies will look to see if the ground owner’s rights are subordinate to the
leasehold mortgage, as is typical. If the ground lease is not subordinate to the
mortgage, the mortgagee should have the right of notice of borrower’s default and
the ability to cure that default. In addition most mortgage loans will not have a
balloon mortgage maturity within 20 years of a ground lease expiry, because that
would limit the borrower’s economic interest in managing the property and put the
mortgagee’s principal at risk. To the extent that the rating agency believes a land
lease hinders mortgage security, the agency may increase subordination on a loan by
5%-20% to account for the detrimental ground lease. If a ground lease is fullysubordinate to the mortgage, there may be no subordination penalty, and penalties
greater than 10% are rare, because underwriting standards prevent mortgages with
no notice and cure rights.
Property Quality Assessment (Loan Specific)
The agencies will visit and assign a property quality score based on their
assessments of the property’s location, competition, physical condition, tenancy, and
market position. S&P and Moody’s use a scale of 1 to 5, with 1 being good and 5
being worst, while Fitch assesses a property grade A through C- with most high-
quality pools being assessed a B+, typical conduit pools being B- and poor
properties at C or worse. This property score can affect the overall subordination
levels by 1%-3%, but usually only account for a 0.5%-1% difference between poolsbecause most recent conduit transactions are of similar quality.
Secondary Financing (Loan Specific)
Many borrowers use secondary financing to leverage their property beyond the
limits imposed by the rating agencies’ first mortgage guidelines. These secondary
January 9, 2001 A Guide to Commercial Mortgage-Backed Securities
49
Mezzanine Debt or Preferred Equity
Mezzanine debt is the most common form of additional financing used by
borrowers. A mezzanine loan is a loan secured by the equity interests of the first
mortgage borrower, so it can only foreclose on the equity in the mortgage borrower,
leaving the first mortgage unaffected. Another version of mezzanine financing is a
preferred equity interest whereby the borrower issues preferred equity that earns a
fixed rate of return and converts to common equity in the borrower SPE if interest
payments are deferred.
A/B Note Structures
In the A/B notes structure, one loan is divided into a senior participation interest,
which is deposited in the securitization vehicle, while the junior participation
interest is privately placed outside of the securitization vehicle. In recent years
issuers have used A/B notes to delever larger loans, permitting the A-note to be
shadow rated investment grade, improving the CMBS transaction’s overall credit
levels, and attracting a broader investor base. Investors interested in the implications
of A/B notes should read “A/B Note Structures in CMBS Transactions.”18
Second Mortgage Loans
A subordinate mortgage is secured by a lien on the property that is subordinate in
priority to the first-mortgage lien. If a second mortgage exists on a property, the
rating agencies usually require an inter-creditor agreement that subordinates the
second mortgage lender’s rights to the first mortgage lender.
Any form of additional property leverage increases the property’s obligations,
reducing the cash flow available to improve the property and, thus, increasing the
first mortgage’s probability of default. To reflect this increased default risk, the
agencies generally raise the first mortgage’s required subordination. Each of the
rating agencies has published materials that detail the subordination add-ons created
by subordinate financing.
Operating History (Loan Specific)
The cash flow stability of a new property can differ significantly from that of a
property that has been in operation for a number of years. Newly developed
properties may have many of their leases expire in the same year, leaving significant
lease rollover risk if the tenants find that they signed leases that are uneconomic
versus justifiable rents for the new untested property. A property that has operated
for a number of years has likely stabilized tenant rental levels and diversified
tenancy lease expiry over a number of years. Therefore, the rating agencies usually
require three years of financial statements to review the property’s cash flow
stability and adjust their underwritten cash flow based on the property’s operating
history. Any property that has been newly built and has no operating statement ispenalized, while properties that have no statements because they were recently
purchased are penalized to a lesser extent.
18
“A/B Note Structures in CMBS Transactions,” Darrell Wheeler, Bond Market Roundup: Strategy, Janet Showers, et al., February
For securities recommended in this report, Salomon Smith Barney (SSB), including its parent, subsidiaries, and/or affiliates (the Firm), usually makes a
market, may sell to or buy from customers as principal, and may from time to time perform investment banking or other services for or solicit
investment banking or other business from any company mentioned in this report. Securities recommended, offered, or sold by SSB: (i) are not insured
by the Federal Deposit Insurance Corporation; (ii) are not deposits or other obligations of any insured depository institution (including Citibank); and
(iii) are subject to investment risks, including the possible loss of the principal amount invested. The Firm, or any individuals preparing this report, may
at any time have a position in any securities or options of any of the issuers in this report. An employee of the Firm may be a director of a company
mentioned in this report.
Although information has been obtained from and is based upon sources SSB believes to be reliable, the Firm does not guarantee the accuracy of the
information, and it may be incomplete or condensed. All opinions and estimates included in this report constitute SSB’s judgment as of the date of this
report and are subject to change without notice. This report is for informational purposes only and is not intended as an offer or solicitation with
respect to the purchase or sale of any security. This report does not take into account the investment objectives, financial situation, or particular needs
of any particular person. Investors should obtain individual financial advice based on their own particular circumstances before making an investment
decision on the basis of the recommendations in this report. Investors who have received this report from the Firm may be prohibited in certain states
from purchasing securities mentioned in this report from the Firm. Please ask your Financial Consultant for additional details.
This publication has been approved for distribution in the United Kingdom by Salomon Brothers International Limited, which is regulated by the
Securities and Futures Authority. The investments and services contained herein are not available to private customers in the UK. This report was
prepared by SSB and, if distributed by Nikko Salomon Smith Barney Limited, is so distributed under license. This report is made available in Australia
through Salomon Smith Barney Australia Securities Pty. Ltd. (ACN 003 114 832), a Licensed Securities Dealer, and in New Zealand through Salomon
Smith Barney New Zealand Limited, a member firm of the New Zealand Stock Exchange.