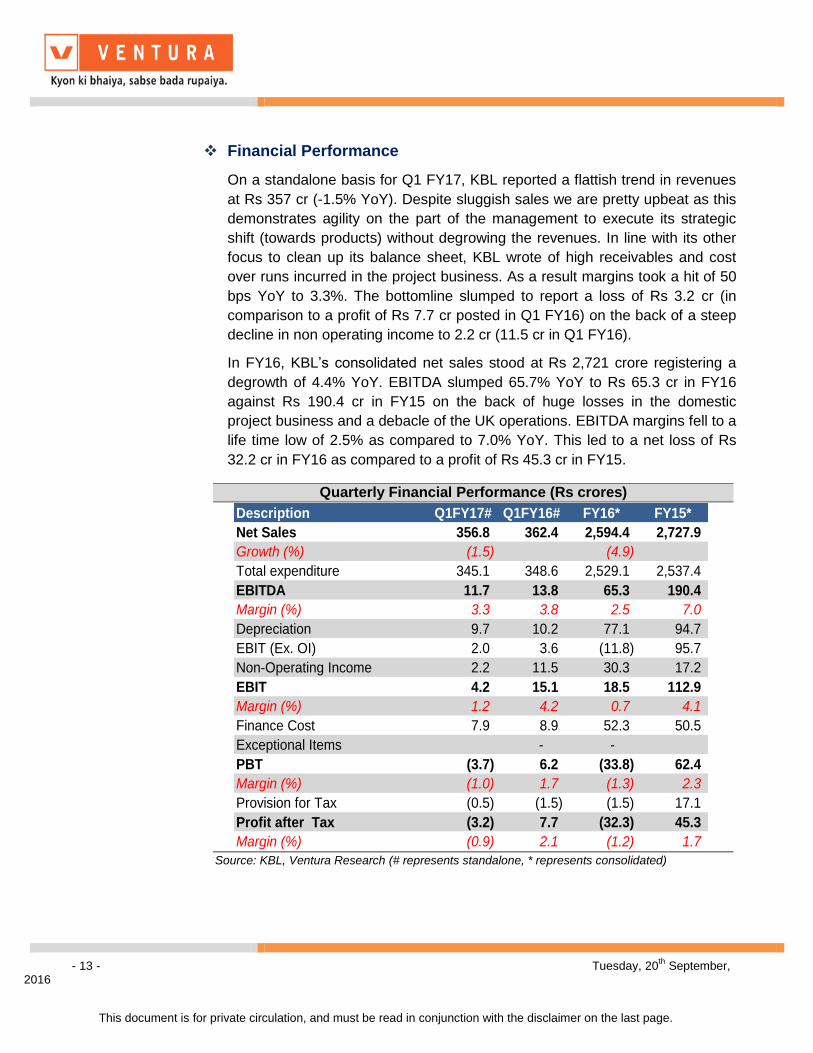
Kirloskar Brothers Ltd BUY - 1 - Tuesday, 20 th September, 2016 This document is for private circulation, and must be read in conjunction with the disclaimer on the last page. STOCK POINTER Target Price ` 317 CMP ` 153 FY19E PE 9.4X Index Details Kirloskar Brothers Ltd (KBL) faced a rough patch in 2016. The sharp sell off in crude oil prices disrupted the business model of its most profitable operations (SPP Pumps Ltd, UK). Further the prolonged drought and challenges of working with Indian Government bodies sharply impacted its domestic operations. For FY16, The company reported a net loss of Rs 32.2 crore, which came as a wakeup call for the management. With a view to stem losses and turnaround its business operations, the company has undertaken a massive restructuring exercise across all verticals. This in our opinion is a favourable move and should restore KBL back to profitability. In addition the Government’s thrust on agriculture and infrastructure augurs well for growth, and KBL being the largest pump player is expected to be the biggest beneficiary. We expect consolidated sales to grow at a CAGR of 6.6% over FY17- 19 from Rs 2,594 cr in FY16 to Rs 3,139 cr by FY19 on the back of healthy growth in the product business (expected CAGR growth of 8.6% to Rs 2,770 cr by FY19). While EBITDA is expected to grow at a CAGR of 57.9% from Rs 65.3 cr in FY16 to Rs 257 cr by FY19, earnings are expected to grow at a faster clip of 263.1% CAGR to Rs 139.7 cr over the same period. We Initiate coverage on KBL Brothers as a BUY with the price objective of Rs 317- representing a potential upside of 107% from the CMP of Rs 153. At the CMP of Rs 153 the stock is trading at 12.7X and 9.0X its estimated earnings for FY18 and FY19. We have assigned a PE multiple of 18X (average PE multiple of 18X) on FY19 EPS of Rs 17.6 to arrive at the target price We are optimistic about the company’s prospects given that: 1. The share of the unorganized sector in the pump market has fallen from 60% in FY10 to 44% in FY15. We expect the share to further fall to 35% by FY18. This shift is expected to drive revenue growth for the products business of KBL. Sensex 28,634 Nifty 8,808 Industry Industrial Machinery Scrip Details MktCap (` cr) 1,217.7 BVPS (`) 121.8 O/s Shares (Cr) 7.94 AvVol 76,167 52 Week H/L 219/113 Div Yield (%) 0.3 FVPS (`) 2.0 Shareholding Pattern Shareholders % Promoters 65.4 Public 34.6 Total 100.0 KBL vs. Sensex 0 50 100 150 200 250 300 350 0 5000 10000 15000 20000 25000 30000 35000 Sep-13 Dec-13 Mar-14 Jun-14 Sep-14 Dec-14 Mar-15 Jun-15 Sep-15 Dec-15 Mar-16 Jun-16 Sep-16 KBL Sensex Key Financials (` in Cr) Y/E Mar Net Sales EBITDA PAT EPS (`) EPS Growth (%) RONW (%) ROCE (%) P/E (x) EV/EBITDA (x) 2016 2,594.4 65.3 (33.2) -4.2 -180.9 -3.4 1.4 NA 24.6 2017E 2,756.5 125.4 35.8 4.5 207.6 3.6 6.5 36.6 12.6 2018E 2,914.0 204.0 98.9 12.5 176.7 9.2 12.5 13.2 7.3 2019E 3,139.2 256.9 139.7 17.6 41.2 11.7 16.3 9.4 5.4
Transcript
Kirloskar Brothers Ltd BUY
- 1 - Tuesday, 20th September, 2016
This document is for private circulation, and must be read in conjunction with the disclaimer on the last page.
ST
OC
K P
OIN
TE
R
Target Price ` 317 CMP ` 153 FY19E PE 9.4X
Index Details Kirloskar Brothers Ltd (KBL) faced a rough patch in 2016. The sharp
sell off in crude oil prices disrupted the business model of its most
profitable operations (SPP Pumps Ltd, UK). Further the prolonged
drought and challenges of working with Indian Government bodies
sharply impacted its domestic operations. For FY16, The company
reported a net loss of Rs 32.2 crore, which came as a wakeup call for
the management. With a view to stem losses and turnaround its
business operations, the company has undertaken a massive
restructuring exercise across all verticals. This in our opinion is a
favourable move and should restore KBL back to profitability. In
addition the Government’s thrust on agriculture and infrastructure
augurs well for growth, and KBL being the largest pump player is
expected to be the biggest beneficiary.
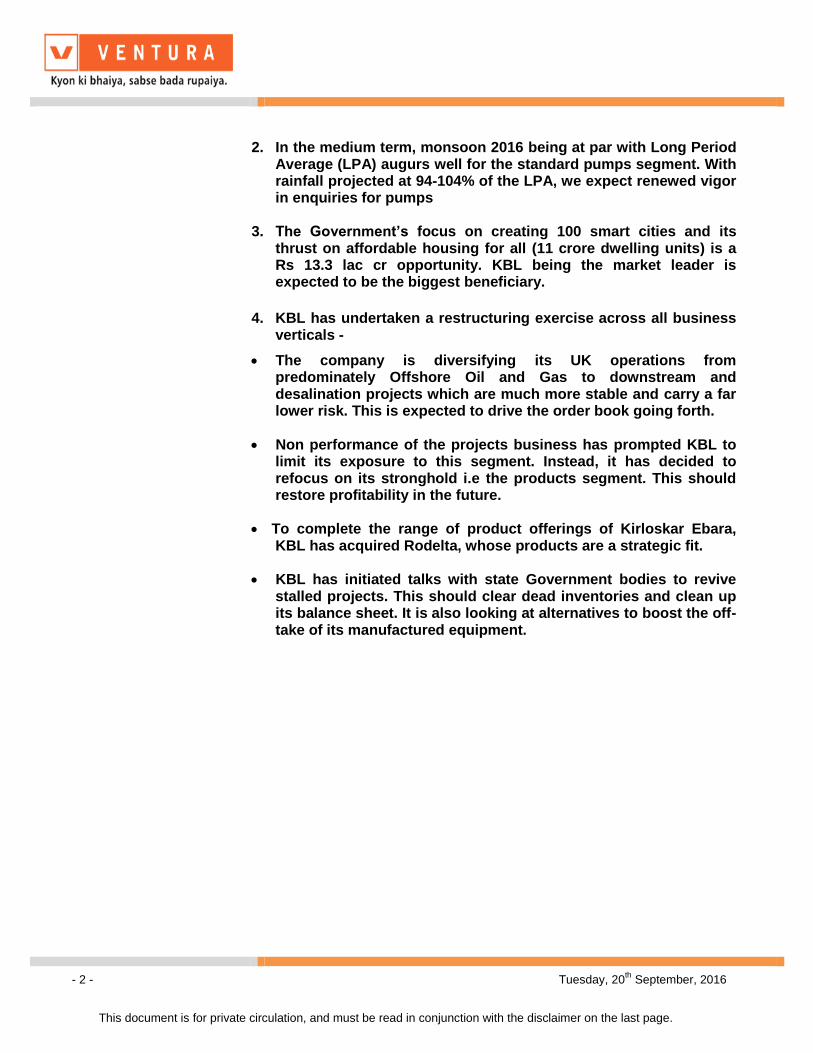
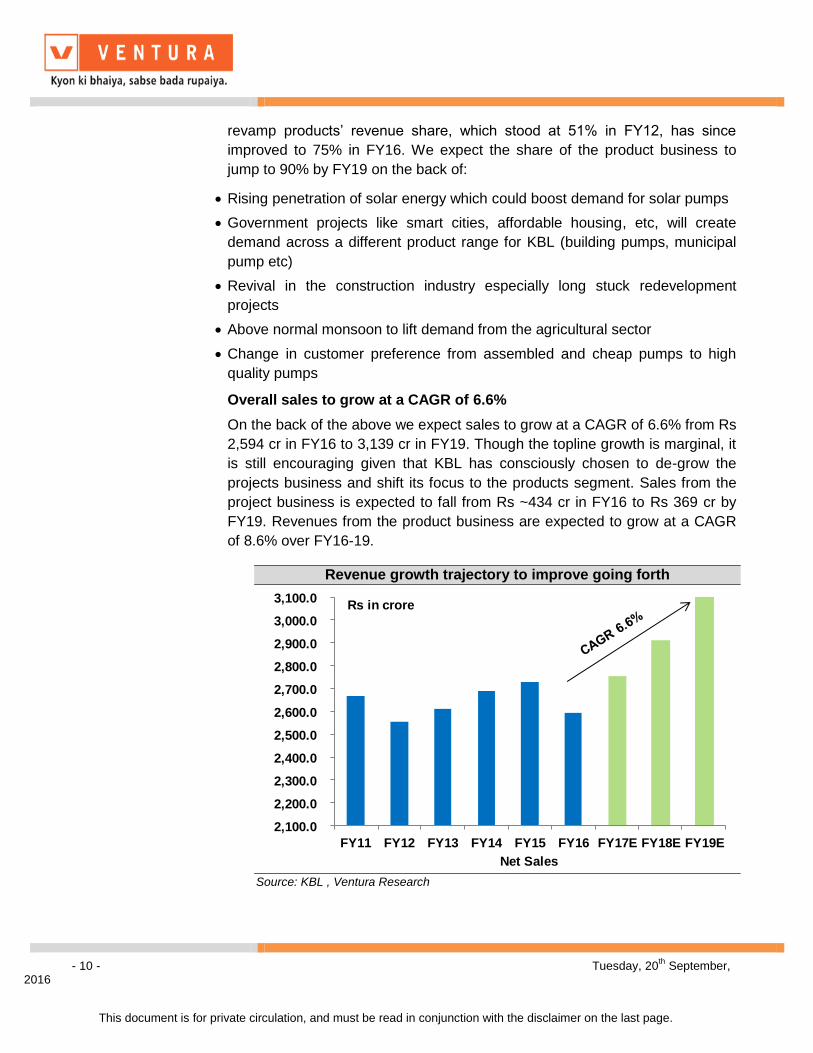
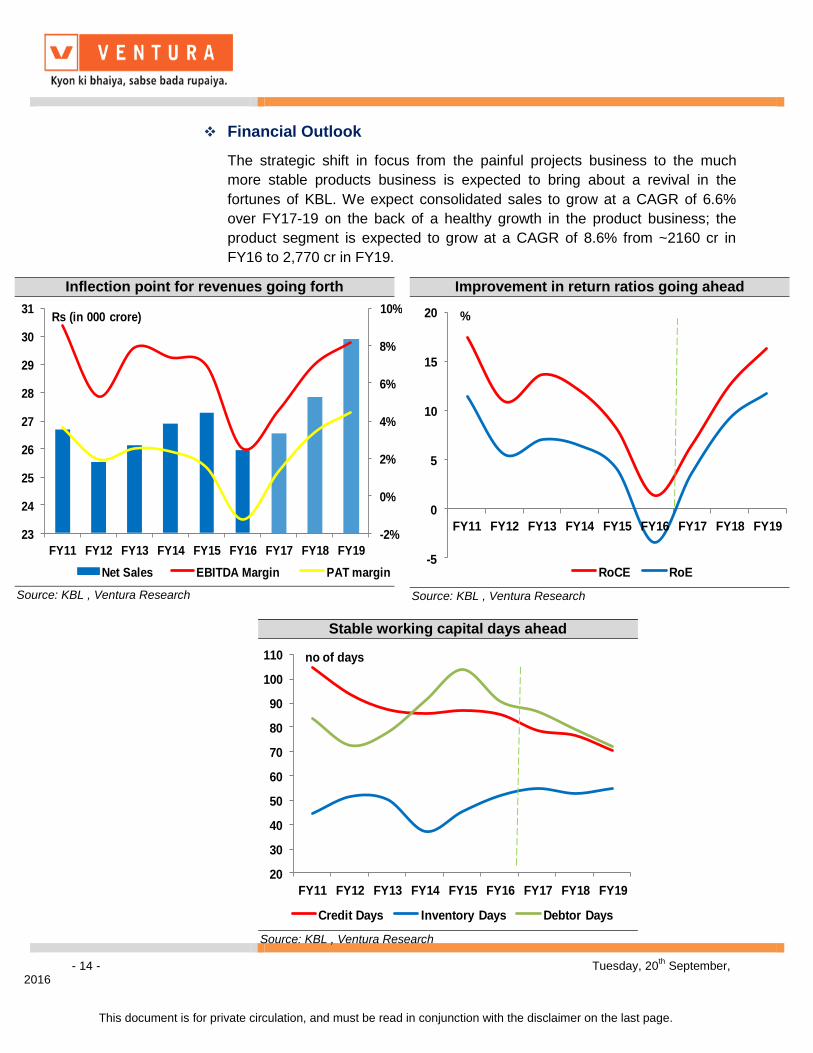
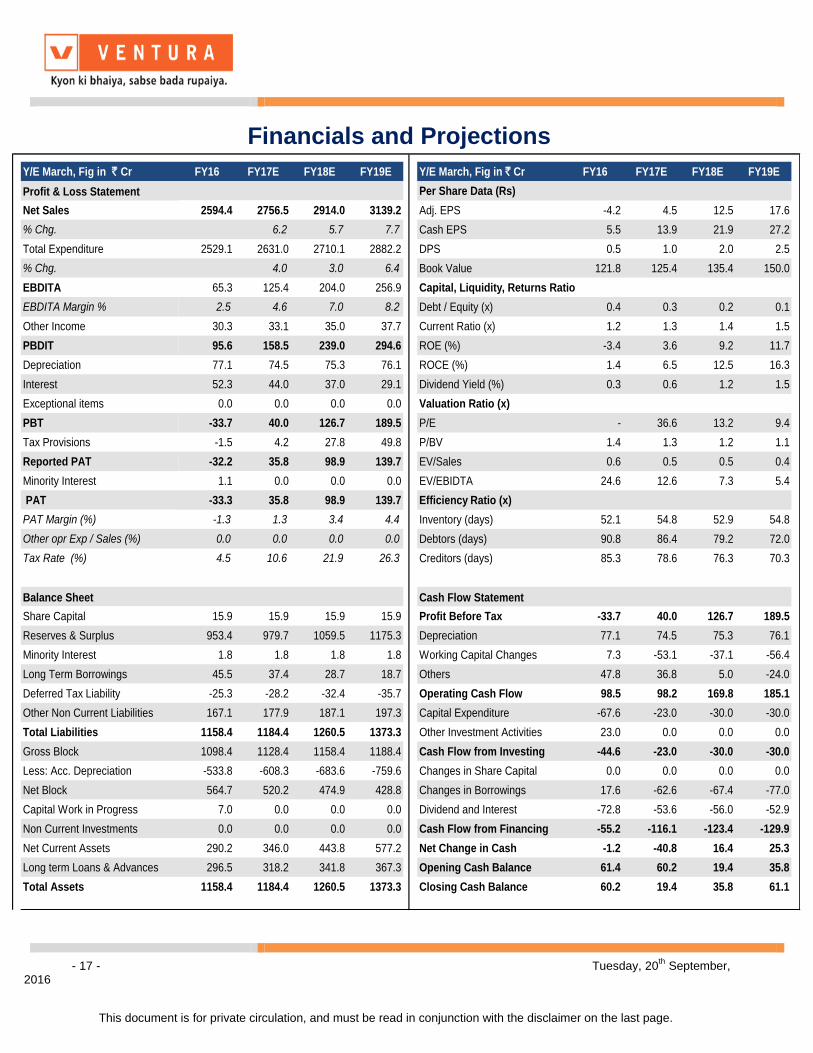
We expect consolidated sales to grow at a CAGR of 6.6% over FY17-
19 from Rs 2,594 cr in FY16 to Rs 3,139 cr by FY19 on the back of
healthy growth in the product business (expected CAGR growth of
8.6% to Rs 2,770 cr by FY19). While EBITDA is expected to grow at a
CAGR of 57.9% from Rs 65.3 cr in FY16 to Rs 257 cr by FY19,
earnings are expected to grow at a faster clip of 263.1% CAGR to Rs
139.7 cr over the same period.
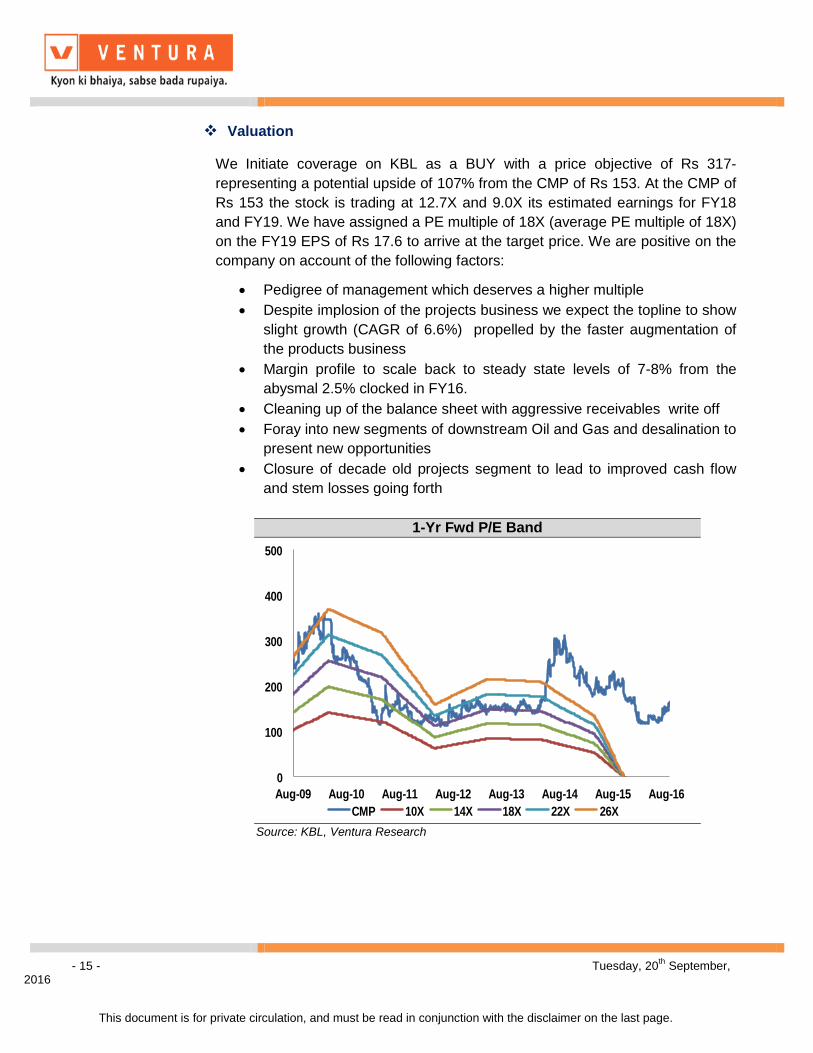
We Initiate coverage on KBL Brothers as a BUY with the price
objective of Rs 317- representing a potential upside of 107% from
the CMP of Rs 153. At the CMP of Rs 153 the stock is trading at
12.7X and 9.0X its estimated earnings for FY18 and FY19. We have
assigned a PE multiple of 18X (average PE multiple of 18X) on FY19
EPS of Rs 17.6 to arrive at the target price
We are optimistic about the company’s prospects given that:
1. The share of the unorganized sector in the pump market has fallen from 60% in FY10 to 44% in FY15. We expect the share to further fall to 35% by FY18. This shift is expected to drive revenue growth for the products business of KBL.
This document is for private circulation, and must be read in conjunction with the disclaimer on the last page.
2. In the medium term, monsoon 2016 being at par with Long Period
Average (LPA) augurs well for the standard pumps segment. With rainfall projected at 94-104% of the LPA, we expect renewed vigor in enquiries for pumps
3. The Government’s focus on creating 100 smart cities and its
thrust on affordable housing for all (11 crore dwelling units) is a Rs 13.3 lac cr opportunity. KBL being the market leader is expected to be the biggest beneficiary.
4. KBL has undertaken a restructuring exercise across all business verticals -
The company is diversifying its UK operations from predominately Offshore Oil and Gas to downstream and desalination projects which are much more stable and carry a far lower risk. This is expected to drive the order book going forth.
Non performance of the projects business has prompted KBL to limit its exposure to this segment. Instead, it has decided to refocus on its stronghold i.e the products segment. This should restore profitability in the future.
To complete the range of product offerings of Kirloskar Ebara, KBL has acquired Rodelta, whose products are a strategic fit.
KBL has initiated talks with state Government bodies to revive stalled projects. This should clear dead inventories and clean up its balance sheet. It is also looking at alternatives to boost the off-take of its manufactured equipment.
- 3 - Tuesday, 20th September, 2016
This document is for private circulation, and must be read in conjunction with the disclaimer on the last page.
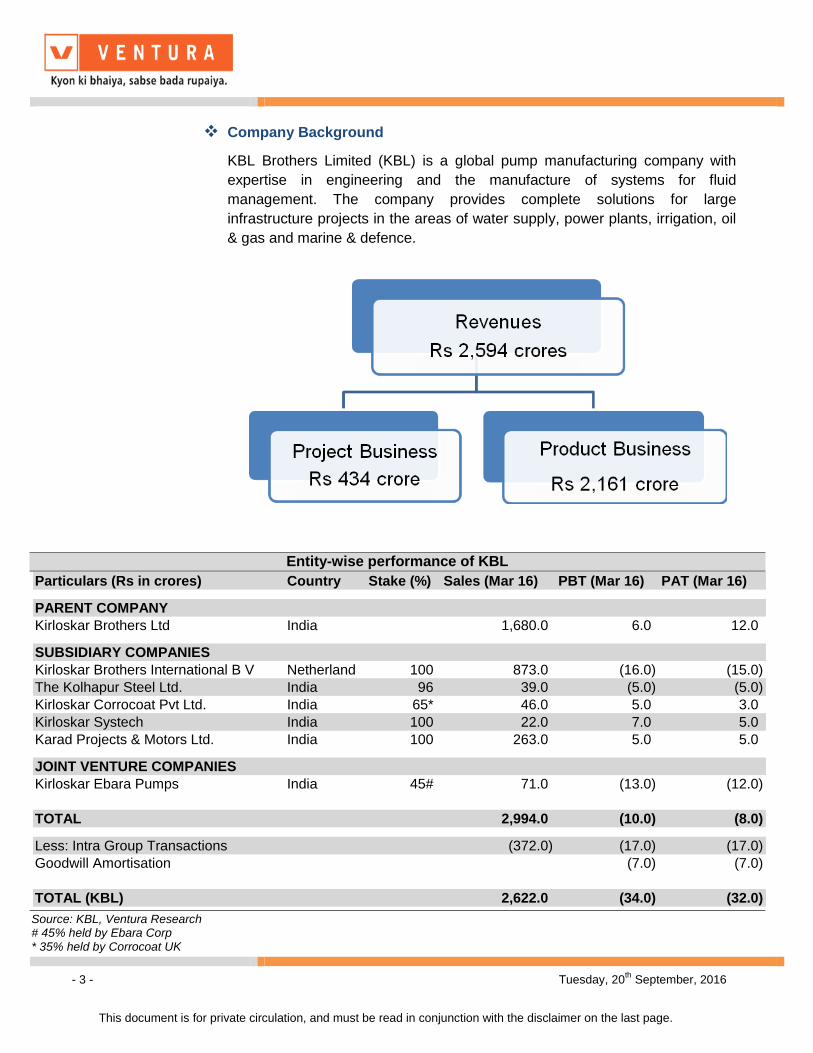
Company Background
KBL Brothers Limited (KBL) is a global pump manufacturing company with
expertise in engineering and the manufacture of systems for fluid
management. The company provides complete solutions for large
infrastructure projects in the areas of water supply, power plants, irrigation, oil
& gas and marine & defence.
Entity-wise performance of KBL
Particulars (Rs in crores) Country Stake (%) Sales (Mar 16) PBT (Mar 16) PAT (Mar 16)
PARENT COMPANY
Kirloskar Brothers Ltd India 1,680.0 6.0 12.0
SUBSIDIARY COMPANIES
Kirloskar Brothers International B V Netherland 100 873.0 (16.0) (15.0)
The Kolhapur Steel Ltd. India 96 39.0 (5.0) (5.0)
Kirloskar Corrocoat Pvt Ltd. India 65* 46.0 5.0 3.0
Kirloskar Systech India 100 22.0 7.0 5.0
Karad Projects & Motors Ltd. India 100 263.0 5.0 5.0
JOINT VENTURE COMPANIES
Kirloskar Ebara Pumps India 45# 71.0 (13.0) (12.0)
TOTAL 2,994.0 (10.0) (8.0)
Less: Intra Group Transactions (372.0) (17.0) (17.0)
Goodwill Amortisation (7.0) (7.0)
TOTAL (KBL) 2,622.0 (34.0) (32.0)
Source: KBL, Ventura Research # 45% held by Ebara Corp * 35% held by Corrocoat UK
- 4 - Tuesday, 20th September, 2016
This document is for private circulation, and must be read in conjunction with the disclaimer on the last page.
Key Investment Highlights
Indian pumps sector set for robust growth
Estimates on the size of the Indian pump market vary from Rs 8,500-12,000 cr
as not much data is available [as bulk of the market ~44% is unorganized]. In
comparison to the global market, which is pegged to grow at a 6% CAGR to
USD 56 bn in CY 2017 from USD 47 bn in CY 2014, the Indian market is
expected to grow at a robust rate of 10-12% CAGR by FY19.
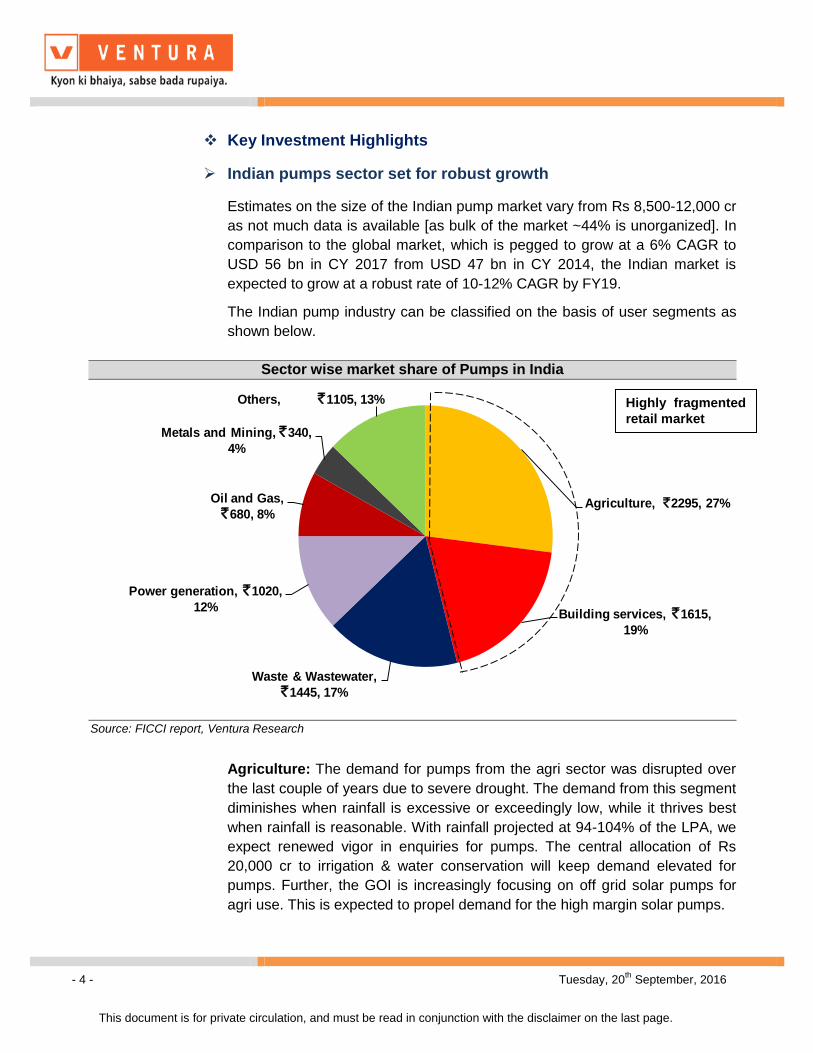
The Indian pump industry can be classified on the basis of user segments as
shown below.
Agriculture: The demand for pumps from the agri sector was disrupted over
the last couple of years due to severe drought. The demand from this segment
diminishes when rainfall is excessive or exceedingly low, while it thrives best
when rainfall is reasonable. With rainfall projected at 94-104% of the LPA, we
expect renewed vigor in enquiries for pumps. The central allocation of Rs
20,000 cr to irrigation & water conservation will keep demand elevated for
pumps. Further, the GOI is increasingly focusing on off grid solar pumps for
agri use. This is expected to propel demand for the high margin solar pumps.
Sector wise market share of Pumps in India
Agriculture, ̀ 2295, 27%
Building services, `1615,
19%
Waste & Wastewater,
`1445, 17%
Power generation, `1020,
12%
Oil and Gas,
`680, 8%
Metals and Mining, `340,
4%
Others, `1105, 13%
Source: FICCI report, Ventura Research
Highly fragmented
retail market
- 5 - Tuesday, 20th September, 2016
This document is for private circulation, and must be read in conjunction with the disclaimer on the last page.
Modi Govt’s thrust on irrigation & energy efficient pumps to further fuel
demand
The central government has clearly spelt out its aim to increase the irrigation
penetration domestically. In the Union Budget FY16-17, the Government
allocated Rs 5,840 cr to irrigation. Moreover it has laid emphasis on fast
tracking of 89 irrigation projects under the Accelerated Irrigation Benefit
Programme (outlay of ~Rs 17,000 crore in FY17) and a further Rs 86,500
crore has been earmarked to be spent over the next five years. This should
propel demand going ahead for KBL.
Building Services: Increasing urbanization has led the horizontal expansion
of India's cities, putting stress on their infrastructure. However with
urbanization expected to only accelerate, vertical growth is the only option.
This should foster the growth of Building services. Further the Govt is focused
on creating 100 smart cities and affordable housing for all (expected to lead to
the construction of 11 crore dwelling units) by 2022. This massive
infrastructure push would need investments to the tune of Rs 13.3 lac crore.
With pumps being an integral part of building services, the demand is only
expected to be strong. And KBL, by virtue of being the largest player, is
expected to be the biggest beneficiary.
Water & Wastewater: The ambitious Smart Cities project, Swacch Bharat
Mission and the emphasis on better sanitation, safe disposal of waste/sewage,
clean water for all is expected to propel the demand for pumps.
Power Generation: The installed capacity for power is projected to grow to
463.54 GW by 2022 from the current 275 GW. Increased usage of washed
coal and expansion of nuclear power should boost the demand for pumps.
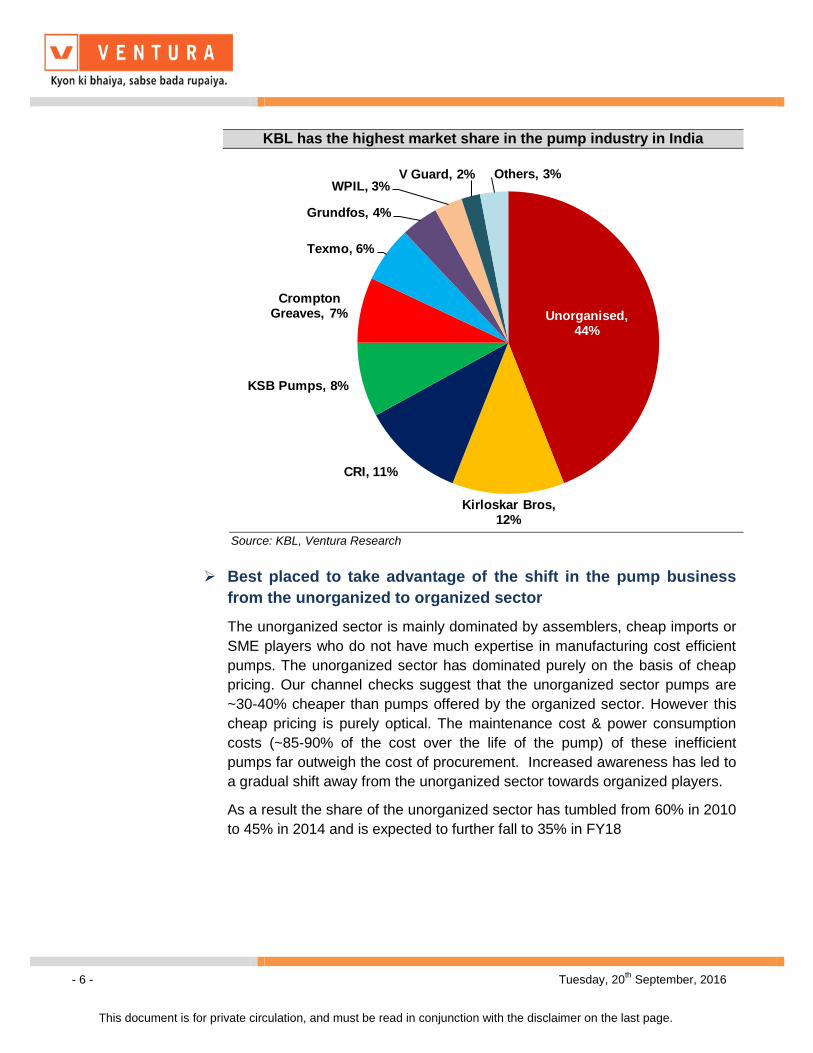
KBL’s market share dominance in the pump sector to continue
KBL, by virtue of its century old experience in pumps, commands the highest
market share of 12%. Considering the fact that ~44% of the pump market is
unorganized, KBL has a 21.5% market share within the organized sector. We
expect KBL to retain its market leadership position in the domestic pump
business due to its wide product range and superior distribution network.
- 6 - Tuesday, 20th September, 2016
This document is for private circulation, and must be read in conjunction with the disclaimer on the last page.
Best placed to take advantage of the shift in the pump business
from the unorganized to organized sector
The unorganized sector is mainly dominated by assemblers, cheap imports or
SME players who do not have much expertise in manufacturing cost efficient
pumps. The unorganized sector has dominated purely on the basis of cheap
pricing. Our channel checks suggest that the unorganized sector pumps are
~30-40% cheaper than pumps offered by the organized sector. However this
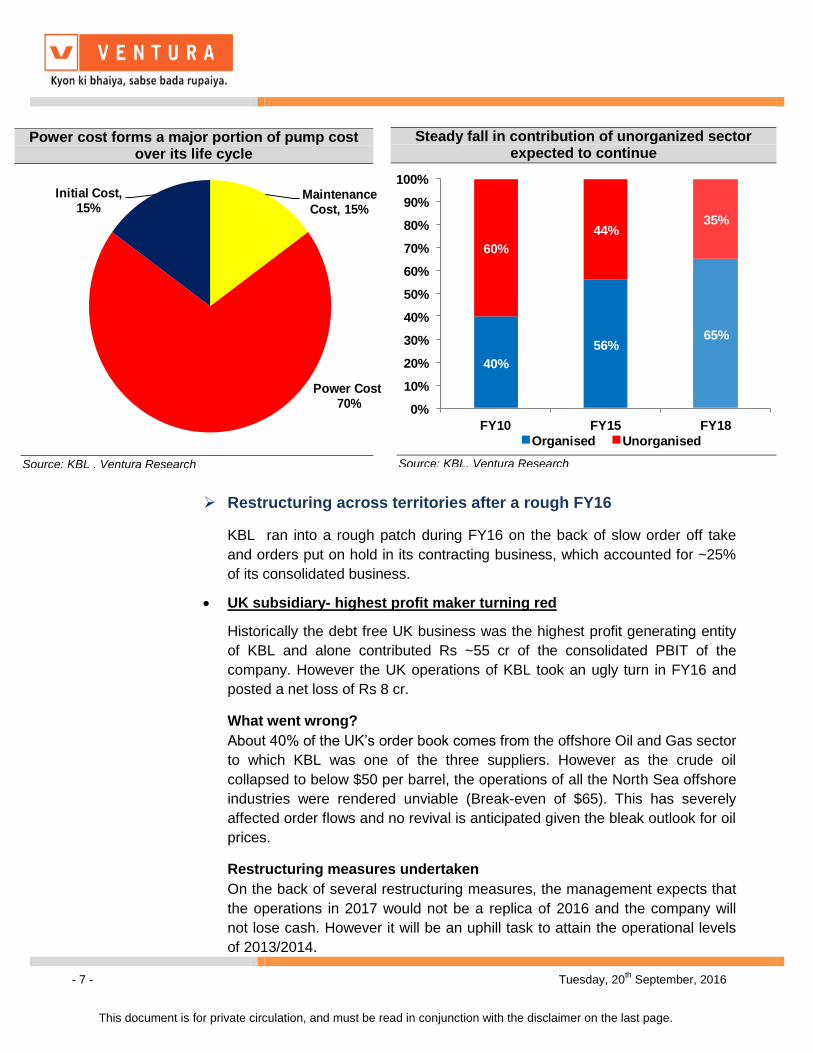
cheap pricing is purely optical. The maintenance cost & power consumption
costs (~85-90% of the cost over the life of the pump) of these inefficient
pumps far outweigh the cost of procurement. Increased awareness has led to
a gradual shift away from the unorganized sector towards organized players.
As a result the share of the unorganized sector has tumbled from 60% in 2010
to 45% in 2014 and is expected to further fall to 35% in FY18
KBL has the highest market share in the pump industry in India
Unorganised, 44%
Kirloskar Bros, 12%
CRI, 11%
KSB Pumps, 8%
Crompton Greaves, 7%
Texmo, 6%
Grundfos, 4%
WPIL, 3%V Guard, 2% Others, 3%
Source: KBL, Ventura Research
- 7 - Tuesday, 20th September, 2016
This document is for private circulation, and must be read in conjunction with the disclaimer on the last page.
Restructuring across territories after a rough FY16
KBL ran into a rough patch during FY16 on the back of slow order off take
and orders put on hold in its contracting business, which accounted for ~25%
of its consolidated business.
UK subsidiary- highest profit maker turning red
Historically the debt free UK business was the highest profit generating entity
of KBL and alone contributed Rs ~55 cr of the consolidated PBIT of the
company. However the UK operations of KBL took an ugly turn in FY16 and
posted a net loss of Rs 8 cr.
What went wrong?
About 40% of the UK’s order book comes from the offshore Oil and Gas sector
to which KBL was one of the three suppliers. However as the crude oil
collapsed to below $50 per barrel, the operations of all the North Sea offshore
industries were rendered unviable (Break-even of $65). This has severely
affected order flows and no revival is anticipated given the bleak outlook for oil
prices. Restructuring measures undertaken
On the back of several restructuring measures, the management expects that
the operations in 2017 would not be a replica of 2016 and the company will
not lose cash. However it will be an uphill task to attain the operational levels
of 2013/2014.
Power cost forms a major portion of pump cost over its life cycle
Maintenance Cost, 15%
Power Cost, 70%
Initial Cost, 15%
Source: KBL , Ventura Research
Steady fall in contribution of unorganized sector expected to continue
40%
56%65%
60%
44%35%
FY10 FY15 FY18
0%
10%
20%
30%
40%
50%
60%
70%
80%
90%
100%
Organised Unorganised
Source: KBL, Ventura Research
- 8 - Tuesday, 20th September, 2016
This document is for private circulation, and must be read in conjunction with the disclaimer on the last page.
In order to revive the UK operations the management has pivoted from the
offshore Oil and Gas industry to the downstream Oil and Gas segment and
desalination projects. These businesses are much more stable and carry far
lower risk. KBL has been receiving favourable enquiries from players in the
downstream and desalination industry. These could convert into sales
considering the rich expertise of KBL in complex pumps, which require a lot of
commissioning support.
Acquisition of Rodelta temporarily dented bottomline for FY16
KBL acquired Rodelta in July 2015, when it was in receivership mode
(equivalent of a BIFR case in India).The Acqusition of Rodelta is strategically
very important as it is an almost exact fit to the missing products in KBL
Ebara’s (Indian Subsidiary of KBL) portfolio. Further Rodelta also holds
approvals from Statoil and Shell and this was something KBL Ebara was
seeking since long. The acquisition is strategic not only from the customer
access perspective but from the angle of completion of KBL Ebara's portfolio
as well.
Rodelta’s order book was zero on the date of acquisition as the company had
gone into receivership seven months prior to it. The company had
accumulated losses of ~ Rs 7.5 cr for 2015 which were absorbed by KBL in its
consolidated numbers.
Shifting focus from the less certain project business to the steady
products segment
KBL which historically was only into the products business, forayed into the
project business sighting the high margins. The lack of execution experience
and inability to deal with the vagaries of Govt methods of working and
changing policies took its toll on the profitability of KBL. Slower economic
growth, unavailability of land, unviable projects initiated by contractees and
customers’ inability to take delivery due to the liquidity crunch further
hampered the projects business.
Restructuring of business operation to stem losses from the project
business
KBL has consciously chosen to avoid projects which entail considerable
amount of civil works. Further as a policy it has chosen to focus strictly on its
skills set and supply systems to existing EPC players. These contracts are
entered only if they fall in the framework of their terms and conditions.
- 9 - Tuesday, 20th September, 2016
This document is for private circulation, and must be read in conjunction with the disclaimer on the last page.
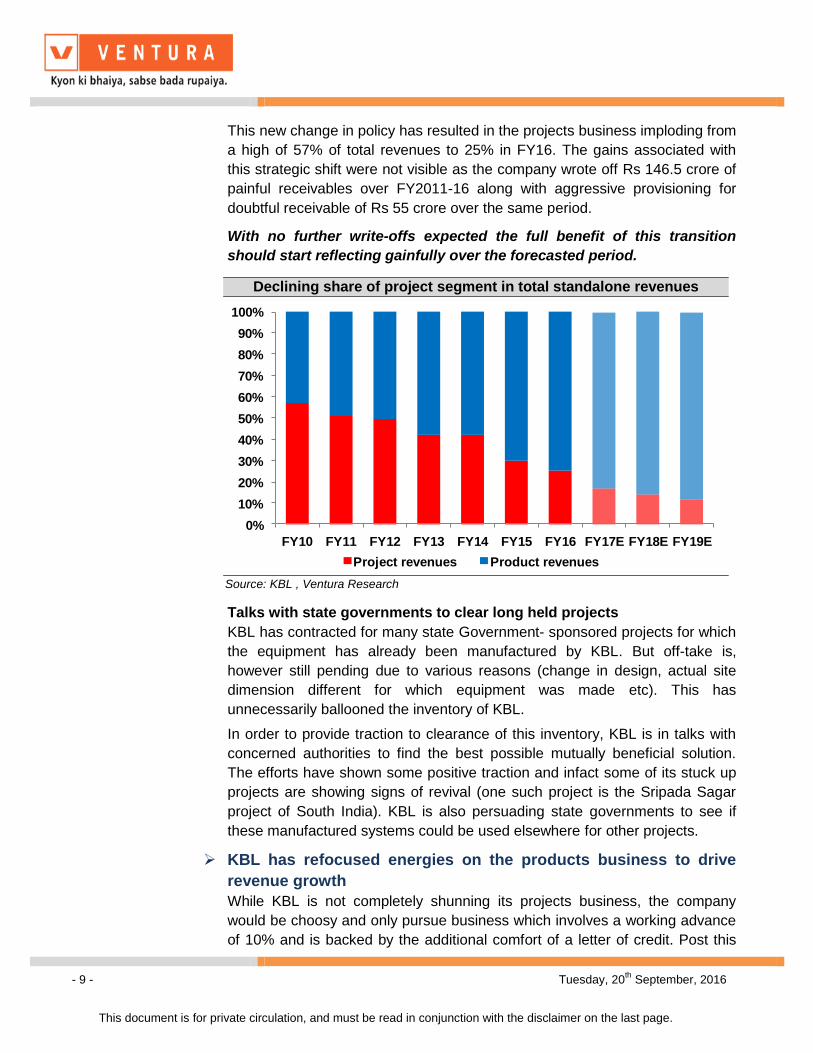
This new change in policy has resulted in the projects business imploding from
a high of 57% of total revenues to 25% in FY16. The gains associated with
this strategic shift were not visible as the company wrote off Rs 146.5 crore of
painful receivables over FY2011-16 along with aggressive provisioning for
doubtful receivable of Rs 55 crore over the same period.
With no further write-offs expected the full benefit of this transition
should start reflecting gainfully over the forecasted period.
Talks with state governments to clear long held projects
KBL has contracted for many state Government- sponsored projects for which
the equipment has already been manufactured by KBL. But off-take is,
however still pending due to various reasons (change in design, actual site
dimension different for which equipment was made etc). This has
unnecessarily ballooned the inventory of KBL.
In order to provide traction to clearance of this inventory, KBL is in talks with
concerned authorities to find the best possible mutually beneficial solution.
The efforts have shown some positive traction and infact some of its stuck up
projects are showing signs of revival (one such project is the Sripada Sagar
project of South India). KBL is also persuading state governments to see if
these manufactured systems could be used elsewhere for other projects.
KBL has refocused energies on the products business to drive
revenue growth
While KBL is not completely shunning its projects business, the company
would be choosy and only pursue business which involves a working advance
of 10% and is backed by the additional comfort of a letter of credit. Post this
Declining share of project segment in total standalone revenues
This document is for private circulation, and must be read in conjunction with the disclaimer on the last page.
Disclosures and Disclaimer Ventura Securities Limited (VSL) is a SEBI registered intermediary offering broking, depository and portfolio management services to clients. VSL is member of BSE, NSE and MCX-SX. VSL is a depository participant of NSDL. VSL states that no disciplinary action whatsoever has been taken by SEBI against it in last five years except administrative warning issued in connection with technical and venial lapses observed while inspection of books of accounts and records. Ventura Commodities Limited, Ventura Guaranty Limited, Ventura Insurance Brokers Limited and Ventura Allied Services Private Limited are associates of VSL. Research Analyst (RA) involved in the preparation of this research report and VSL disclose that neither RA nor VSL nor its associates (i) have any financial interest in the company which is the subject matter of this research report (ii) holds ownership of one percent or more in the securities of subject company (iii) have any material conflict of interest at the time of publication of this research report (iv) have received any compensation from the subject company in the past twelve months (v) have managed or co-managed public offering of securities for the subject company in past twelve months (vi) have received any compensation for investment banking merchant banking or brokerage services from the subject company in the past twelve months (vii) have received any compensation for product or services from the subject company in the past twelve months (viii) have received any compensation or other benefits from the subject company or third party in connection with the research report. RA involved in the preparation of this research report discloses that he / she has not served as an officer, director or employee of the subject company. RA involved in the preparation of this research report and VSL discloses that they have not been engaged in the market making activity for the subject company. Our sales people, dealers, traders and other professionals may provide oral or written market commentary or trading strategies to our clients that reflect opinions that are contrary to the opinions expressed herein. We may have earlier issued or may issue in future reports on the companies covered herein with recommendations/ information inconsistent or different those made in this report. In reviewing this document, you should be aware that any or all of the foregoing, among other things, may give rise to or potential conflicts of interest. We may rely on information barriers, such as "Chinese Walls" to control the flow of information contained in one or more areas within us, or other areas, units, groups or affiliates of VSL. This report is for information purposes only and this document/material should not be construed as an offer to sell or the solicitation of an offer to buy, purchase or subscribe to any securities, and neither this document nor anything contained herein shall form the basis of or be relied upon in connection with any contract or commitment whatsoever. This document does not solicit any action based on the material contained herein. It is for the general information of the clients / prospective clients of VSL. VSL will not treat recipients as clients by virtue of their receiving this report. It does not constitute a personal recommendation or take into account the particular investment objectives, financial situations, or needs of clients / prospective clients. Similarly, this document does not have regard to the specific investment objectives, financial situation/circumstances and the particular needs of any specific person who may receive this document. The securities discussed in this report may not be suitable for all investors. The appropriateness of a particular investment or strategy will depend on an investor's individual circumstances and objectives. Persons who may receive this document should consider and independently evaluate whether it is suitable for his/ her/their particular circumstances and, if necessary, seek professional/financial advice. And such person shall be responsible for conducting his/her/their own investigation and analysis of the information contained or referred to in this document and of evaluating the merits and risks involved in the securities forming the subject matter of this document. The projections and forecasts described in this report were based upon a number of estimates and assumptions and are inherently subject to significant uncertainties and contingencies. Projections and forecasts are necessarily speculative in nature, and it can be expected that one or more of the estimates on which the projections and forecasts were based will not materialize or will vary significantly from actual results, and such variances will likely increase over time. All projections and forecasts described in this report have been prepared solely by the authors of this report independently of the Company. These projections and forecasts were not prepared with a view toward compliance with published guidelines or generally accepted accounting principles. No independent accountants have expressed an opinion or any other form of assurance on these projections or forecasts. You should not regard the inclusion of the projections and forecasts described herein as a representation or warranty by VSL, its associates, the authors of this report or any other person that these projections or forecasts or their underlying assumptions will be achieved. For these reasons, you should only consider the projections and forecasts described in this report after carefully evaluating all of the information in this report, including the assumptions underlying such projections and forecasts. The price and value of the investments referred to in this document/material and the income from them may go down as well as up, and investors may realize losses on any investments. Past performance is not a guide for future performance. Future returns are not guaranteed and a loss of original capital may occur. Actual results may differ materially from those set forth in projections. Forward-looking statements are not predictions and may be subject to change without notice. We do not provide tax advice to our clients, and all investors are strongly advised to consult regarding any potential investment. VSL, the RA involved in the preparation of this research report and its associates accept no liabilities for any loss or damage of any kind arising out of the use of this report. This report/document has been prepared by VSL, based upon information available to the public and sources, believed to be reliable. No representation or warranty, express or implied is made that it is accurate or complete. VSL has reviewed the report and, in so far as it includes current or historical information, it is believed to be reliable, although its accuracy and completeness cannot be guaranteed. The opinions expressed in this document/material are subject to change without notice and have no obligation to tell you when opinions or information in this report change. This report or recommendations or information contained herein do/does not constitute or purport to constitute investment advice in publicly accessible media and should not be reproduced, transmitted or published by the recipient. The report is for the use and consumption of the recipient only. This publication may not be distributed to the public used by the public media without the express written consent of VSL. This report or any portion hereof may not be printed, sold or distributed without the written consent of VSL. This document does not constitute an offer or invitation to subscribe for or purchase or deal in any securities and neither this document nor anything contained herein shall form the basis of any contract or commitment whatsoever. This document is strictly confidential and is being furnished to you solely for your information, may not be distributed to the press or other media and may not be reproduced or redistributed to any other person. The opinions and projections expressed herein are entirely those of the author and are given as part of the normal research activity of VSL and are given as of this date and are subject to change without notice. Any opinion estimate or projection herein constitutes a view as of the date of this report and there can be no assurance that future results or events will be consistent with any such opinions, estimate or projection. This document has not been prepared by or in conjunction with or on behalf of or at the instigation of, or by arrangement with the company or any of its directors or any other person. Information in this document must not be relied upon as having been authorized or approved by the company or its directors or any other person. Any opinions and projections contained herein are entirely those of the authors. None of the company or its directors or any other person accepts any liability whatsoever for any loss arising from any use of this document or its contents or otherwise arising in connection therewith. The information contained herein is not intended for publication or distribution or circulation in any manner whatsoever and any unauthorized reading, dissemination, distribution or copying of this communication is prohibited unless otherwise expressly authorized. Please ensure that you have read “Risk Disclosure Document for Capital Market and Derivatives Segments” as prescribed by Securities and Exchange Board of India before investing in Securities Market. Ventura Securities Limited