159
Fiscal Year 2002 CMS Financial Report U.S. DEPARTMENT OF HEALTH AND HUMAN SERVICES

Fiscal Year 2002
CMS Financial Report
U.S. DEPARTMENT OF HEALTH AND HUMAN SERVICES

The CMS is the largest purchaser ofhealth care in the world. TheMedicare, Medicaid, and StateChildren’s Health Insurance programsthat we administer provide healthcare for one in four Americans.Medicare enrollment has increasedfrom 19 million beneficiaries in 1966to over 40 million beneficiaries.Medicaid enrollment has increasedfrom 10 million beneficiaries in 1967to 39 million beneficiaries.
The CMS outlayed $381.7 billion (netof offsetting receipts and Payments tothe Health Care Trust Funds) in fiscalyear (FY) 2002, 19 percent of totalFederal outlays. The only agency thatoutlayed more is the Social SecurityAdministration.
The CMS has approximately 4,500 Federal employees, but does most of its workthrough third parties. The CMS and its contractors process 998 million Medicare claimsannually, monitor quality of care, provide States with matching funds for Medicaidbenefits, and develop policies and procedures designed to give the best possible serviceto beneficiaries. We also assure the safety and quality of medical facilities, providehealth insurance protection to workers changing jobs, and maintain the largestcollection of health care data in the United States.
THE CENTERS FOR MEDICARE &MEDICAID SERVICES AT A GLANCE
2002 Program Enrollment
2002 Federal Outlays

A Message from the Administrator
The Centers for Medicare & Medicaid Services (CMS) Financial Report for Fiscal Year (FY) 2002demonstrates how effectively CMS managed outlays of over $400 billion and provided quality health careservices to over 80 million beneficiaries through Medicare, Medicaid, and the State Children’s HealthInsurance Program (SCHIP). We have been steadfast in meeting our mission: assuring health caresecurity for beneficiaries. We have refined our vision to emphasize quality and efficiency in an evolvinghealth care system. We have identified five core values—public service, integrity, accountability,excellence, and respect—that will guide us in accomplishing our mission and goals.
I am pleased with the progress that we have made after a full year with our new name and new structurefocused on our three major lines of business—traditional fee-for-service Medicare, Medicare beneficiary-centered choice, and state-administered programs, such as Medicaid and SCHIP. We continue to raise theservice level of our programs through a series of routinely scheduled Open Door Forums and ListeningSessions held around the country that have shown great success. We service each state with two accountrepresentatives to help troubleshoot, resolve disputes, ease communication, and resolve bureaucraticbottlenecks. We have created the CMS Quarterly Provider Update to provide the health care communitywith regular and predictable information on new developments in CMS programs. We have also launchedseveral provider outreach efforts to make it easier and less burdensome for physicians, other health careprofessionals, and providers to deliver high quality services. The CMS continues to work toward aprescription drug benefit for our Medicare beneficiaries.
We are continuing our national advertising campaign as part of our education initiative to assureMedicare beneficiaries understand information resources available to them so they can become betterinformed participants in their health care choices. We also continue to offer call center services at1-800-MEDICARE (1-800-633-4227) 24 hours a day, 7 days a week and a Medicare consumerinformation web site, www.medicare.gov, to assist our beneficiaries in understanding the health careoptions available to them at their convenience. We have many strategic goals designed to support thePresident’s Management Agenda. For example, our strategic goal of promoting the fiscal integrity of CMSprograms and being an accountable steward of public funds will improve financial performance. We havealso delayered the Agency and taken other initiatives to strategically manage our human capital.
I look forward with confidence that CMS and its partners will continue to provide the best health carepossible for our Nation’s beneficiaries.
Thomas A. ScullyJanuary 2003
i
DEPARTMENT OF HEALTH & HUMAN SERVICES Centers for Medicare & Medicaid Services
Administrator Washington, DC 20201

A Message from the Deputy Administrator andChief Operating Officer
As CMS’s Deputy Administrator and Chief Operating Officer, I am pleased to join the Administrator and theCFO in presenting CMS’s Financial Report for FY 2002. The report discusses CMS’s FY 2002 performanceand outlines programmatic, financial and management issues in order to assess accountability in meeting ourmission of assuring health care security for beneficiaries.
We have carried out the commitments of President George W. Bush and the Department of Health andHuman Services (HHS) Secretary Tommy Thompson to improve the delivery of public services. Forexample, we continue to deploy resources in a more customer-oriented way. We have identified six strategicgoals, eight program objectives, and twelve operational objectives that support the President’s ManagementAgenda. We have continued to review the Agency’s functions and where appropriate have reorganizedresponsibilities and operations to be more responsive to our customers and partners. We have created a newfinancial management infrastructure to support the Healthcare Integrated General Ledger Accounting System(HIGLAS) project. The HIGLAS project is a critical CMS initiative that will significantly improve ouroversight of contractor accounting systems. The new system will also strengthen Medicare’s management ofits accounts receivable and allow more timely and effective collection activities on outstanding debts. Theproject includes pilots at two Medicare contractors before national implementation.
Since our reorganization in June 2001, we have focused on six primary objectives: 1) restructuring,2) integrating budget and performance, 3) enhancing strategic management of human capital, 4) increasingcompetitive sourcing, 5) improving financial performance, and 6) expanding electronic government. Ourrestructuring has increased manager span of control. In addition, we have redeployed resources to move theAgency toward being citizen-centered, results oriented, market aware, and effective. Our new projectmanagement team and internal audit function have improved the performance of CMS components and ourcontractors. They have strengthened the internal control environment and enhanced contractors’ ability to bemore effective at safeguarding taxpayer dollars, more accurate and prompt in making payments to providers,and more efficient at processing beneficiaries’ claims for health care services.
Timely and consistent communication is a hallmark of an effective organization. Our focus is to be open andresponsive; to that end, CMS has created mechanisms that will give our employees a greater opportunity toreceive and act on feedback from our constituencies. I look forward to hearing the concerns and individualsuggestions for improvement from physicians and other health care providers, from the people who deal withCMS in communities and facilities on a daily basis, and from seniors who rely upon Medicare and Medicaidfor their health care needs.
Ruben J. King-Shaw, Jr.January 2003
ii
CHAPTER TITLEDEPARTMENT OF HEALTH & HUMAN SERVICES Centers for Medicare & Medicaid Services
Deputy Administrator andChief Operating Officer Baltimore, MD 21244-1850

A Message from the Chief Financial Officer
As the Chief Financial Officer (CFO), I am pleased to present the CMS Financial Report for FY 2002. The
CMS continues to proactively collaborate with the Department of Health and Human Services (DHHS), the
Office of Inspector General (OIG), State agencies, Medicare contractors, and our beneficiaries to manage the
financial complexity of our programs. This report reflects the steady progress that our Agency has made in
achieving our financial management goals. As a result of these efforts, I am pleased to report that CMS’s
financial statements received an unqualified audit opinion for the fourth consecutive year. This report presents
the financial health of Medicare’s Hospital Insurance and Supplementary Medical trust funds separately, based
on standards in effect at the time of the audit. Going forward, the Administration plans to develop a more
comprehensive measure of Medicare’s and Medicaid’s financial position that will analyze the Medicare
program as a whole.
A key element of our strategic vision is to implement a state-of-the-art financial management system that fully
integrates CMS’s accounting system with those of our Medicare contractors. This project is called the
Healthcare Integrated General Ledger Accounting System (HIGLAS). The HIGLAS will also strengthen
Medicare’s management of its accounts receivable and allow more effective collection activities on outstand-
ing debt. This project is well underway—using International Business Machines, Oracle Corporation, and
Electronic Data Systems as teaming partners.
We updated and enhanced the Chief Financial Officer Comprehensive Plan for Financial Management for FY
2002 to coordinate our financial management goals. With respect to these goals and other financial initiatives,
FY 2002 was a successful year for the financial management of the Agency. During the year, CMS:
• Reduced fraud, waste, and abuse in the Medicare program by reducing the Medicare payment error rate
since 1996. For FY 2002, the OIG reported that the Medicare fee-for-service error rate is 6.3%.
• Initiated the Medicaid payment accuracy measurement project with nine States.
• Continued to make substantive progress in implementing the Debt Collection Improvement Act. We
referred a total of $5.5 billion of delinquent debt for collection to the Department of Treasury. We have
referred about 90% of all eligible delinquent debt to Treasury.
• Revised and issued a Medicare contractor financial management manual on the Internet.
• Hosted two national CFO training conferences to ensure that our Medicare contractors understand new
policies and procedures so that their reported information is accurate, reliable, and uniform.
• Created four workgroups to address key Medicare contractor financial oversight areas including
Corrective Action Plans, CMS 1522 Cash Reconciliation, Trend Analysis, and Certification Package for
Internal Controls.
iii
DEPARTMENT OF HEALTH & HUMAN SERVICES Centers for Medicare & Medicaid Services
Baltimore, MD 21244-1850

• Improved/strengthened our oversight of Medicare contractors’ financial management processes and
financial data.
• Increased Medicaid financial management audits.
While we have made many improvements in FY 2002, we will continue to further refine and improve our
financial management goals. As the CFO, I remain committed to the stewardship responsibilities needed to
maintain the highest level of accountability for the management of the Agency’s financial resources.
Michelle SnyderJanuary 2003
iv

v
FINANCING OF CMS PROGRAMS AND OPERATIONS

A Message from the Administrator . . . . . . . . . . . . . . . . . . . . . . . . . . . . . . i
A Message from the Deputy Administrator and Chief Operating Officer . . . . ii
A Message from the Chief Financial Officer. . . . . . . . . . . . . . . . . . . . . . . iii
Financing of CMS Programs and Operations . . . . . . . . . . . . . . . . . . . . . . . v
Agency Organization. . . . . . . . . . . . . . . . . . . . . . . . . . . . . . . . . . . . . . . viii
Management’s Discussion and Analysis . . . . . . . . . . . . . . . . . . . . . . . . . . 1
Overview . . . . . . . . . . . . . . . . . . . . . . . . . . . . . . . . . . . . . . . . . . . . . . . 1
Programs . . . . . . . . . . . . . . . . . . . . . . . . . . . . . . . . . . . . . . . . . . . . . . . 3
Medicare . . . . . . . . . . . . . . . . . . . . . . . . . . . . . . . . . . . . . . . . . . . . . 3
Medicaid . . . . . . . . . . . . . . . . . . . . . . . . . . . . . . . . . . . . . . . . . . . . . 5
State Children’s Health Insurance. . . . . . . . . . . . . . . . . . . . . . . . . . . . . . 8
Other Activities . . . . . . . . . . . . . . . . . . . . . . . . . . . . . . . . . . . . . . . . . 9
Performance Goals . . . . . . . . . . . . . . . . . . . . . . . . . . . . . . . . . . . . . . . 11
Protect and Improve Beneficiary Health and Satisfaction . . . . . . . . . . . . . . 12
Foster Appropriate and Predictable Payments and High Quality Care . . . . . . 15
Promote Understanding of CMS Programs Among Beneficiaries,
the Health Care Community, and the Public . . . . . . . . . . . . . . . . . . . .15
Promote the Fiscal Integrity of CMS Programs and be an Accountable Steward
of Public Funds . . . . . . . . . . . . . . . . . . . . . . . . . . . . . . . . . . . . . .17
Foster Excellence in the Design and Administration of CMS Programs. . . . . . . 19
Provide Leadership in the Broader Health Care Marketplace to . . . . . . . . . .
Improve Health . . . . . . . . . . . . . . . . . . . . . . . . . . . . . . . . . . . . . . 22
Financial Accomplishments and Statement Highlights . . . . . . . . . . . . . 23
Chief Financial Officer Comprehensive Plan and Project Plans . . . . . . . . . . 23
CFO Audit . . . . . . . . . . . . . . . . . . . . . . . . . . . . . . . . . . . . . . . . . . . . 24
Debt Management. . . . . . . . . . . . . . . . . . . . . . . . . . . . . . . . . . . . . . . 25
Medicare Contractor Oversight . . . . . . . . . . . . . . . . . . . . . . . . . . . . . . . 26
Financial Management and Reporting . . . . . . . . . . . . . . . . . . . . . . . . . . 28
Healthcare Integrated General Ledger Accounting System . . . . . . . . . . . . . 31
Financial Statement Highlights . . . . . . . . . . . . . . . . . . . . . . . . . . . . . . 32
Principal Statements and Notes . . . . . . . . . . . . . . . . . . . . . . . . . . . . . . . 35
Consolidated Balance Sheet . . . . . . . . . . . . . . . . . . . . . . . . . . . . . . . . . 35
Consolidated Statement of Net Cost. . . . . . . . . . . . . . . . . . . . . . . . . . . . 36
TABLE OF CONTENTS
Consolidated Statement of Changes in Net Position. . . . . . . . . . . . . . . . . . 36
Combined Statement of Budgetary Resources. . . . . . . . . . . . . . . . . . . . . . 37
Consolidated Statement of Financing . . . . . . . . . . . . . . . . . . . . . . . . . . 38
Notes . . . . . . . . . . . . . . . . . . . . . . . . . . . . . . . . . . . . . . . . . . . . . . . 39
Required Supplementary Stewardship Information . . . . . . . . . . . . . . . . 65
Actuarial Projections . . . . . . . . . . . . . . . . . . . . . . . . . . . . . . . . . . . . . 66
Actuarial Present Values . . . . . . . . . . . . . . . . . . . . . . . . . . . . . . . . . . . 71
Actuarial Assumptions and Sensitivity Analysis. . . . . . . . . . . . . . . . . . . . 73
Trust Fund Finances and Sustainability . . . . . . . . . . . . . . . . . . . . . . . . . 84
Required Supplementary Information. . . . . . . . . . . . . . . . . . . . . . . . . . . 86
Consolidating Balance Sheet . . . . . . . . . . . . . . . . . . . . . . . . . . . . . . . . 86
Consolidating Statement of Net Cost . . . . . . . . . . . . . . . . . . . . . . . . . . . 87
Consolidating Statement of Changes in Net Position . . . . . . . . . . . . . . . . . 87
Combining Statement of Budgetary Resources . . . . . . . . . . . . . . . . . . . . . 88
Gross Cost and Exchange Revenue . . . . . . . . . . . . . . . . . . . . . . . . . . . . 89
Consolidated Intragovernmental Balances . . . . . . . . . . . . . . . . . . . . . . . 89
Audit Opinion and Management Response . . . . . . . . . . . . . . . . . . . . . . . 90
Report of Independent Auditors on Financial Statements . . . . . . . . . . . . . . 94
Report of Independent Auditors on Compliance with Laws and Regulations . . . . . . 96
Report of Independent Auditors on Internal Control . . . . . . . . . . . . . . . . . . 98
Management Response . . . . . . . . . . . . . . . . . . . . . . . . . . . . . . . . . . . 115
Other Congressional Reports . . . . . . . . . . . . . . . . . . . . . . . . . . . . . . . . . 116
Federal Managers’ Financial Integrity Act . . . . . . . . . . . . . . . . . . . . . . . 116
Medicare’s Validation Program for JCAHO Accredited Hospitals . . . . . . . . . 118
Clinical Laboratory Improvement Validation Program . . . . . . . . . . . . . . . 124
Quality Improvement Organizations . . . . . . . . . . . . . . . . . . . . . . . . . . 129
2002 Top CMS Management Issues List . . . . . . . . . . . . . . . . . . . . . . . . 130
Glossary . . . . . . . . . . . . . . . . . . . . . . . . . . . . . . . . . . . . . . . . . . . . . . . . 140
TABLE OF CONTENTS

DEPA
RT
MEN
T O
F H
EA
LTH
AN
D H
UM
AN
SER
VIC
ES
CEN
TER
SFO
RM
ED
ICA
RE
& M
ED
ICA
IDSE
RV
ICES
ADM
INIS
TRAT
OR
DEPU
TYAD
MIN
ISTR
ATOR
and
Chie
f Ope
ratin
g Of
ficer
Mid
wes
tern
Con
sort
ium
Sout
hern
Con
sort
ium
Nort
heas
tern
Cons
ortiu
m
Prog
ram
Inte
grity
Gro
up
Offic
e of
Fin
anci
alM
anag
emen
tOf
fice
of In
form
atio
nSe
rvic
esOf
fice
of In
tern
alCu
stom
er S
uppo
rt
Offic
e of
Equ
alOp
port
unity
and
Civ
ilRi
ghts
Offic
e of
Ope
ratio
nsM
anag
emen
t
Wes
tern
Con
sort
ium
Regi
onal
Offi
ces
Denv
er,S
an F
ranc
isco
,and
Seat
tle
Regi
onal
Offi
ces
Chic
ago
and
Kans
as C
ityRe
gion
al O
ffice
sAt
lant
a an
d Da
llas
Regi
onal
Offi
ces
Bost
on,N
ew Y
ork,
and
Phila
delp
hia
Appr
oved
Str
uctu
reAs
of J
anua
ry 2
003
Cent
er fo
r Med
icai
dan
d St
ate
Oper
atio
nsCe
nter
for M
edic
are
Man
agem
ent
Cent
er fo
r Ben
efic
iary
Choi
ces
Publ
ic A
ffairs
Offi
ceOf
fice
of L
egis
latio
nOf
fice
of S
trat
egic
Oper
atio
ns a
ndRe
gula
tory
Affa
irs
Offic
e of
the
Actu
ary
Offic
e of
Res
earc
h,De
velo
pmen
t &In
form
atio
n
Offic
e of
Clin
ical
Stan
dard
s an
d Qu
ality

1
Management’sDiscussion and
Analysis
Management’sDiscussion and
Analysis
OVERVIEWThe Centers for Medicare & Medicaid Services (CMS), a component of the Departmentof Health and Human Services (HHS), administers Medicare, Medicaid, State Children’sHealth Insurance Program (SCHIP), and the Clinical Laboratory Improvement Validationprogram. Along with the Departments of Labor and Treasury, CMS also implements theinsurance reform provisions of the Health Insurance Portability and Accountability Actof 1996 (HIPAA).
The CMS is the largest purchaser of health care in the world. Medicare, Medicaid, andSCHIP outlays, including State funding, represent 33 cents of every dollar spent on healthcare in the United States (U.S.)—or looked at from three different perspectives, 59 cents of

every dollar spent on nursing homes, 47cents of every dollar received by U.S.hospitals, and 28 cents of every dollarspent on physician services.
The CMS outlays totaled $381.7billion (net of offsetting receipts) in FY2002. Our expenses totaled $410.9billion, of which $2.6 billion (less than 1percent) were administrative expenses.
We establish policies for programeligibility and benefit coverage, process998 million Medicare claims annually, provide States with funds for Medicaid andSCHIP, ensure quality of health care for beneficiaries, and safeguard funds from fraud,waste, and abuse. Of our approximately 4,500 Federal employees, about 1,600 work in10 regional offices (ROs) around the country to provide direct services to Medicarecontractors, State agencies, health care providers, beneficiaries, and the general public.Approximately 2,900 of our employees work in Baltimore, MD and Washington, DC,where they provide funds to Medicare contractors; write policies and regulations; setpayment rates; safeguard the fiscal integrity of the Medicare and Medicaid programs toensure that benefit payments for medically necessary services are paid correctly the firsttime; recover improper payments; assist law enforcement agencies in the prosecution offraudulent activities; monitor contractor performance; develop and implement customerservice improvements; provide education and outreach activities to beneficiaries, surveyhospitals, nursing homes, labs, home health agencies and other health care facilities;work with State insurance companies; and assist States and Territories with Medicaidand SCHIP. We also maintain the Nation's largest collection of health care data andprovide technical assistance to the Congress, the Executive Branch, universities, andother private sector researchers.
Many important activities are also handled by third parties: (1) State employeesadminister Medicaid and SCHIP; (2) 22,100 employees at 47 Medicare contractorsprocess Medicare claims, provide technical assistance to providers and servicebeneficiaries’ needs, including premium billing, and respond to inquiries; (3) 6,100 Stateemployees inspect hospitals, nursing homes, and other facilities to ensure that healthand safety standards are met; and (4) employees at 53 Quality ImprovementOrganizations (QIOs) conduct a wide variety of quality improvement programs to ensurequality of care provided to Medicare beneficiaries.
2
CMS MANAGEMENT’S DISCUSSION AND ANALYSIS FY 2002
Expenses are computed using the accrualbasis of accounting that recognizes costswhen incurred and revenues when earnedregardless of the timing of cash receivedor disbursed. Expenses include the effectof accounts receivable and accountspayable on determining the net cost ofoperations. Outlays refer to cashdisbursement made to liquidate anexpense regardless of the fiscal year theexpense was incurred.

PROGRAMS
Medicare
Introduction
Established in 1965 as title XVIII of the Social Security Act, Medicare was legislated as acomplement to Social Security retirement, survivors, and disability benefits, andoriginally covered people aged 65 and over. In 1972, the program was changed to coverthe disabled, people with end-stage renal disease (ESRD) requiring dialysis or kidneytransplant, and people age 65 or older who elect Medicare coverage.
Medicare processes 998 million fee-for-service claims a year, is the nation’s largestpurchaser of managed care, and accounts for more than 11 percent of the FederalBudget. Medicare is a combination of three programs: Hospital Insurance,Supplementary Medical Insurance, and Medicare+Choice. Since 1966, Medicareenrollment has increased from 19 million to over 40 million beneficiaries.
Hospital Insurance
Hospital Insurance, also known as HI or Medicare Part A, is usually providedautomatically to people aged 65 and over who have worked long enough to qualify forSocial Security benefits and to most disabled people entitled to Social Security orRailroad Retirement benefits. HI pays for hospital, skilled nursing facility, home health,and hospice care.
3
CMS MANAGEMENT’S DISCUSSION AND ANALYSIS FY 2002

The HI program is financed primarilyby payroll taxes paid by workers andemployers. The taxes paid each year areused mainly to pay benefits for currentbeneficiaries. Funds not currently neededto pay benefits and related expenses areheld in the HI trust fund, and invested inU.S. Treasury securities.
Inpatient hospital spendingaccounted for 71 percent of HI benefitsoutlays. Managed care spendingcomprised 13 percent of total HIoutlays. During FY 2002, HI benefitoutlays grew by 4.5 percent. The HIbenefit outlays per enrollee increasedby 2.9 percent to $3,633.
Supplementary Medical Insurance
Supplementary Medical Insurance, also known as SMI or Medicare Part B, is available tonearly all people aged 65 and over, the disabled, and people with ESRD who are entitledto Part A benefits. The SMI program pays for physician, outpatient hospital, homehealth, laboratory tests, durable medical equipment, designated therapy, and otherservices not covered by HI. The SMI coverage is optional and beneficiaries are subject to
monthly premium payments. About95 percent of HI enrollees elect toenroll in SMI.
The SMI program is financedprimarily by transfers from thegeneral fund of the U.S. Treasuryand by monthly premiums paid bybeneficiaries. Funds not currentlyneeded to pay benefits and relatedexpenses are held in the SMI trustfund, and invested in U.S. Treasurysecurities.
During FY 2002, SMI benefitoutlays grew by 9.8 percent.Physician services, the largestcomponent of SMI, accounted for 41percent of SMI benefit outlays. TheSMI benefit outlays per enrolleeincreased 9.3 percent to $2,820.
4
CMS MANAGEMENT’S DISCUSSION AND ANALYSIS FY 2002

Medicare+Choice
The Balanced Budget Act of 1997 (BBA) created the Medicare+Choice (M+C) program,which was designed to provide more health care coverage choices for Medicarebeneficiaries. Those who are entitled because of age (65 or older) or disability maychoose to join an M+C plan if they are entitled to Part A and enrolled in Part B, if thereis a plan available in their area. Those who are entitled to Medicare because of ESRDmay join an M+C plan only under special circumstances.
Medicare beneficiaries have long had the option to choose to enroll in prepaidhealth care plans that participate in Medicare instead of receiving services undertraditional fee-for-service (FFS) arrangements. Managed care organizations have theirown providers or a network of contracting health care providers who agree to providehealth care services for health maintenance organizations (HMO) or prepaid healthorganizations’ members. Managed care organizations currently serve Medicarebeneficiaries through coordinated care plans, which include HMOs, point-of-service(POS) plans offered by HMOs, preferred provider organizations (PPOs), and provider-sponsored organizations (PSOs). Under M+C, beneficiaries may also choose to join aprivate FFS plan that is available in twenty-five States. Managed care demonstrationprojects, as well as cost and Health Care Prepayment Plans (HCPPs) options, also exist.
All M+C plans are paid a per capita premium, assume full financial risk for all careprovided to Medicare beneficiaries, and must provide all Medicare covered services. ManyM+C plans offer additional services such as prescription drugs, vision and dental benefitsto beneficiaries. Cost contractors are paid a pre-determined monthly amount per beneficiarybased on a total estimated budget. Adjustments to that payment are made at the end of theyear for any variations from the budget. Cost plans must provide all Medicare-coveredservices, but do not always provide the additional services that some risk M+C plans offer.HCPPs are paid in a manner similar to cost contractors, but cover only non-institutionalPart B Medicare services. Section 1876 cost-based contractors and HCPPs, with certainlimited exceptions, phase out under the BBA provisions.
Managed care expenses are estimated to be $33.5 billion of the total $252.6 billionin Medicare benefit payment expenses in FY 2002.
Medicaid
Introduction
Medicaid is the means-tested health care program for low-income Americans,administered by CMS in partnership with the States. Enacted in 1965 as title XIX of theSocial Security Act, Medicaid was originally legislated to provide medical assistance torecipients of cash assistance. Over the years, Congress incrementally expanded Medicaidwell beyond the traditional population of the low-income elderly and the blind anddisabled. Today, Medicaid is the primary source of health care for a much largerpopulation of medically vulnerable Americans, including poor families, the disabled,
5
CMS MANAGEMENT’S DISCUSSION AND ANALYSIS FY 2002

and persons with developmental disabilities requiring long-term care. The averageenrollment for Medicaid was 39 million in FY 2002, about 13 percent of the U.S.population. Nearly 7 million people are dually eligible, that is, covered by both Medicareand Medicaid.
The CMS provides matching payments to States and Territories to cover theMedicaid program and related administrative costs. State medical assistance paymentsare matched according to a formula relating each State’s per capita income to thenational average. In FY 2002, the Federal matching rate for Medicaid program costsamong the States ranged from 50 to 76 percent, with a national average of 57 percent.Federal matching rates for various State and local administrative costs are set by statute,and in FY 2002 averaged 55 percent. Medicaid payments are funded by Federal generalrevenues provided to CMS through the annual Labor/HHS/Education appropriations act.There is no cap on Federal matching payments to States, except with respect to thedisproportionate share program and payments to Territories.
States set eligibility, coverage, and payment standards within broad statutory andregulatory guidelines that include providing coverage to persons receiving SupplementalSecurity Income (disabled, blind, and elderly population), low income families, themedically needy, pregnant women, young children, low-income Medicare beneficiaries,and certain other groups; and covering at least 10 services mandated by law, includinghospital and physician services, laboratory tests, family planning services, nursingfacility services, and comprehensive health services for individuals under age 21. Stategovernments have a great deal of programmatic flexibility to tailor their Medicaidprograms to individual State circumstances and priorities. Accordingly, there is a widevariation in the services offered by States.
Medicaid is the largest single source of payment for health care services for personswith Acquired Immune Deficiency Syndrome (AIDS). Medicaid now serves over 50percent of all AIDS patients and pays for the health care costs of most of the childrenand infants with AIDS. Medicaid spending for AIDS care and treatment in FY 2002 isestimated to be about $7.7 billion. In addition, the Medicaid programs of all 50 Statesand the District of Columbia provide coverage of all drugs approved by the Food andDrug Administration for treatment of AIDS.
Payments
Under Medicaid, State payments for both medical assistance payments (MAP) andadministrative (ADM) costs are matched with Federal funds. In FY 2002, State and FederalADM gross outlays were $14 billion, about 5.4 percent of the gross Medicaid outlays.State and Federal MAP gross outlays are estimated at $244.5 billion or 95 percent of totalMedicaid gross outlays, an increase of 12.4 percent over FY 2001. Thus, State and FederalMAP and ADM outlays for FY 2002 totaled $258.5 billion. The CMS share of Medicaidexpenses totaled $146.9 billion in FY 2002.
6
CMS MANAGEMENT’S DISCUSSION AND ANALYSIS FY 2002

Enrollees
About 39 million persons were enrolled in Medicaid in 2002. Children comprise nearly50 percent of Medicaid enrollees, but account for only 16 percent of Medicaid outlays.In contrast, the elderly and disabled comprise 30 percent of Medicaid enrollees, butaccounted for 66 percent of program spending. The elderly and disabled use moreexpensive services in all categories, particularly nursing home services.
Service Delivery Options
Many States are pursuing managed care as an alternative to the FFS system for theirMedicaid programs. Managed health care provides several advantages for Medicaidbeneficiaries, such as enhanced continuity of care, improved preventive care, andprevention of duplicative and contradictory treatments and/or medications. Most Stateshave taken advantage of waivers provided by CMS to introduce managed care planstailored to their State and local needs, and 48 States now offer a form of managed care.
The number of Medicaid beneficiaries enrolledin managed care has grown from slightly under15 percent in 1993 to over 56 percent by 2001.
The CMS and the States have worked inpartnership to offer managed care to Medicaidbeneficiaries. Moreover, as a result of the BBA,States may amend their State plan to requirecertain Medicaid beneficiaries in their State toenroll in a managed care program, such as amanaged care organization or primary care casemanager. Medicaid law provides for three kindsof waivers of existing Federal statutes to allowfor the implementation of managed care:
7
CMS MANAGEMENT’S DISCUSSION AND ANALYSIS FY 2002

1) State health reform waivers—Section 1115 of the Social Security Act provides broaddiscretion to waive certain provisions of Medicaid law for experimental, pilot, ordemonstration projects. In August 2001, the President announced a section 1115initiative, known as Health Insurance Flexibility and Accountability, to promoteadditional coverage of the uninsured.
2) Freedom of choice waivers—Section 1915(b) of the Social Security Act allows certainprovisions of Medicaid law to be waived to allow States to develop innovativemanaged health care delivery or reimbursement systems.
3) State plan exceptions—Section 1932(a) of the Social Security Act allows States tomandate managed care enrollment for certain groups of Medicaid beneficiaries.States may elect to include the Program of All-Inclusive Care for the Elderly (PACE)as a State plan option. The PACE is a prepaid, capitated plan that providescomprehensive health care services to frail, older adults in the community, who areeligible for nursing homes according to State standards.
State Children’s Health Insurance
The State Children’s Health Insurance Program (SCHIP) was createdthrough the BBA to address the fact that nearly 11 million Americanchildren—one in seven—were uninsured and therefore at increasedrisk for preventable health problems. Many of these children werein working families that earned too little to afford private insuranceon their own, but too much to be eligible for Medicaid. Congressand the Administration agreed to set aside $24 billion over fiveyears, beginning in FY 1998, to create SCHIP—the largest healthcare investment in children since the creation of Medicaid in 1965.
These funds cover the cost of insurance, reasonable costs for administration, andoutreach services to get children enrolled. To make sure that funds are used to cover asmany children as possible, funds must be used to cover previously uninsured children,and not to replace existing public or private coverage. Important cost-sharing protectionswere also established so families would not be burdened with out-of-pocket expensesthey could not afford.
The statute sets the broad outlines of the program's structure, and establishes apartnership between the Federal and State governments. States are given broadflexibility in tailoring programs to meet their own circumstances. States can create orexpand their own separate insurance programs, expand Medicaid, or combine bothapproaches. States can choose among benchmark benefit packages, develop a benefitpackage that is actuarially equivalent to one of the benchmark plans, use the Medicaidbenefit package, or a combination of these approaches.
8
CMS MANAGEMENT’S DISCUSSION AND ANALYSIS FY 2002

States also have the opportunity to set eligibility criteria regarding age, income, andresidency within broad Federal guidelines. The Federal role is to ensure that Stateprograms meet statutory requirements that are designed to ensure meaningful coverageunder the program.
We work closely with States, Congress, the Health Resources and ServicesAdministration, and Federal agencies to meet the challenge of implementing thisprogram and defining its parameters, while at the same time approving State planamendments as quickly as possible. CMS provides extensive guidance and interiminstructions so States can further develop their plans and use Federal funds to insure asmany children as possible. Since September 30, 1999, all 50 States, the District ofColumbia, and the Territories had approved child health plans. Of these, 21 are Medicaidexpansions, 20 are separate State Child Health plans, and 15 are combination plans. Inaddition, 144 amendments and 11 section 1115 waivers have been approved that provideSCHIP funds to States to cover pregnant women and parents of children enrolled inMedicaid or SCHIP.
Other Activities
In addition to making health care payments on behalf of our beneficiaries, CMS makesother important contributions to the delivery of health care in the U.S.
Survey and Certification Program
We are responsible for assuring the safety and quality of medical facilities, laboratories,providers, and suppliers by setting standards, conducting inspections, certifyingproviders as eligible for program payments, and ensuring that corrective actions aretaken where deficiencies are found. The survey and certification program is designed toensure that providers and suppliers comply with Federal health, safety, and programstandards. We administer agreements with State survey agencies to conduct onsitefacility inspections. Funding is provided through the Program Management and theMedicaid appropriations. Only certified providers, suppliers, and laboratories are eligiblefor Medicare or Medicaid payments.
Since 1985, there has been growth in the number of Medicare-certified facilities,with the largest increases in skilled nursing facilities, home health agencies, hospices,and end-stage renal dialysis facilities. The number of these types of facilities increasedfrom about 20,000 in FY 1985 to about 45,000 in FY 2002.
Clinical Laboratory Improvement Program
The Clinical Laboratory Improvement Amendments of 1988 (CLIA) expanded survey andcertification of clinical laboratories from Medicare-participating and interstate commercelaboratories to all facilities testing specimens from the human body. We regulate alllaboratory testing (whether provided to beneficiaries of CMS programs or to others)including those in physicians’ offices. In partnership with the States, we certify and
9
CMS MANAGEMENT’S DISCUSSION AND ANALYSIS FY 2002

inspect more than 14,000 laboratories each year. The CLIA program isa 100 percent user-fee financed program. The CLIA program is jointlyoperated by three HHS components: (1) CMS provides financialmanagement of the program, contracts with surveyors to inspect labs,and offers general administrative support, (2) The Centers for DiseaseControl and Prevention (CDC) provides research support, and (3) TheFood and Drug Administration (FDA) oversees test categorization.
Quality of Care
Through QIOs, ESRD Networks, State agencies, and others, CMS collaborates withhealth care providers and suppliers to promote the improved health status of Medicareand Medicaid beneficiaries in both FFS and managed care settings. These collaborativeprojects often employ a sequential process that includes setting priorities, collecting andanalyzing data, identifying opportunities to improve care, establishing performanceexpectations, and selecting and managing one or more improvement strategies. One ofthe tools for improving patient care is the development and dissemination of qualityindicators and the publication of performance information.
In addition, as we revise our conditions of participation or conditions of coverage forproviders and suppliers, we are focusing on outcome-patient requirements that focus onthe patient. We continue to believe that providers and suppliers must ensure that thereis an effective quality assessment and performance improvement program to evaluatethe provisions of patient care.
Coverage Policy
In today's health care market, every insurer and health care purchaser must deal withcoverage policy. We established a process that provides current information on coverageissues on the CMS coverage Web site and also facilitates input from all stakeholders,including beneficiaries, through the Medicare Coverage Advisory Committee (MCAC).The MCAC holds open meetings and includes consumer and industry members. We alsorely on state-of-the-art technology assessment and support from other Federal agencies,as well as considerable staff expertise.
Medicare is a leader in evidence-based decision making for coverage policy. Ourown extensive payment data contain additional useful information that is used by theAgency for Healthcare Research and Quality (AHRQ) and others for assessing theeffectiveness of a variety of medical treatments.
Insurance Oversight and Data Standards
We have primary responsibility for setting standards for the Medigap insurance offered toMedicare beneficiaries to help pay the coinsurance and deductibles that Medicare does notcover. We work with State insurance commissioners’ offices to ensure that suspectedviolations of the laws governing the marketing and sales of Medigap are addressed.
10
CMS MANAGEMENT’S DISCUSSION AND ANALYSIS FY 2002

We are also responsible for implementing the data standardsprovision of HIPAA, which is aimed at reducing administrative costsand burdens in the health care industry. It requires HHS to adoptnational uniform standards for the electronic transmission of certainhealth information. We are working with both public and privateorganizations to develop the best standards possible with strongsafeguards to ensure privacy of records. Although HIPAA does notmandate the collection or electronic transmission of any health
information, it does require that adopted standards be used for any electronictransmission of specified transactions.
As a result of the insurance reform provisions of HIPAA, CMS has assumed a newrole in relationship to State regulation of health insurance and health coverage. We workwith the State Insurance Commissioners offices, the U.S. Department of Labor, and theInternal Revenue Service to implement these provisions. The common goal is to improveaccess to the group and individual health insurance markets for certain eligibleindividuals who move from job to job, or who lose their group health insurancecoverage and must purchase coverage in the individual insurance market. These newconsumer protections affect an estimated 160 million individuals.
PERFORMANCE GOALSThe CMS mission is to assure health care security for beneficiaries. The CMS StrategicPlan is developed in conjunction with the Strategic Plan of HHS and outlines our goals forachieving this mission. The CMS strategic planning process and the enactment of theGovernment Performance and Results Act (GPRA) have emphasized the themes ofaccountability, stewardship, and a renewed focus on the customer. The CMS visionreflects our commitment to work in partnership with others to serve the beneficiaries ofCMS programs: “In serving beneficiaries, we will open our programs to full partnershipwith the entire health community to improve quality and efficiency in an evolving healthcare system.” As we strive to improve both our programs and operations, we havearticulated a set of core values (public service, integrity, accountability, excellence, andrespect) that underlie our work. The values help clarify for ourselves and others how CMSstaff need to operate to achieve our mission.
We assess progress toward achieving our strategic goals and objectives throughCMS’s Annual Performance Plan (APP) and Report. Our approach to performancemeasurement under GPRA has been to develop an annual performance plan with goalsthat are representative of our vast responsibilities. Consistent with GPRA principles,CMS identified a set of meaningful, outcome-oriented performance goals that speak tofundamental program purposes and to our role as a steward of billions of taxpayerdollars. The APP describes CMS performance goals and their linkage to longer-termstrategic goals, our reinforcement of the President’s Management Agenda (PMA), andthe CMS budget. The PMA is reflected throughout our goals. For example, improvement
11
CMS MANAGEMENT’S DISCUSSION AND ANALYSIS FY 2002

in strategic management of human capital will come from our goal to improve ourworkforce planning and improved financial performance will come from such goals asreducing the percentage of improper payments made under the Medicare fee-for-serviceprogram and increasing referral of eligible delinquent debt for cross servicing. The planincludes the steps to accomplish each performance goal, and establishes a method anddata source for measuring and reporting. The FY 2002 performance plan includes 35goals for CMS programs that highlight major program areas and budget categories. Itreflects key Administration and CMS priorities for the next several years. Ourperformance goals reflect a sensitivity to customer needs and an awareness that meetingthose needs will require flexibility and imagination, as well as sound business sense.
We are confident that performance measurement under GPRA will substantiallyimprove our programmatic and administrative performance. Performance results provideconstructive information about the success of CMS programs, activities, and initiatives.This information is useful in making policy and management choices in both the shortand long term. In the following section, we highlight our FY 2002 performance goalsand outcomes. Our progress will be submitted with the Annual Performance Reportalong with the President's budget request for FY 2004.
Strategic Goal Protect and Improve Beneficiary Health and Satisfaction
Improve heart attack survival rates.
This nationwide, multi-year effort focuses on implementing known successfulinterventions for properly treating heart attacks and preventing subsequent heartattacks. Our target is to increase the 1-year survival rate following hospitalization for aheart attack by decreasing the mortality rate to 27.4 percent. The final data from 2000(heart attacks occurred between August 1999–July 2000) show a mortality rate of 33.2percent, which is up from the baseline of 31.2 percent (1995-1996). Many complexvariables may have contributed to the survival rate, including the gradual phased-inefforts in this area and the possible change in concomitant diseases. Further, the agedistribution of the Medicare population has increased, which could require riskadjustment. No clear explanation exists for these disappointing trends.
We will continue to report our results for this goal through FY 2002, but we arediscontinuing this goal beginning in FY 2003. We will continue to encourage andmonitor research in this area to determine what may be causing these disappointingtrends. The FY 2001 data is expected in June 2003.
Increase the percentage of Medicare beneficiaries age 65 years and older whoreceive an annual influenza (flu) vaccination and a lifetime vaccination forpneumococcal.
Complications arising from influenza and pneumococcal disease kill more than30,000 people a year in the United States and result in more deaths per year than allother vaccine-preventable diseases combined. For persons age 65 or older, the Advisory
12
CMS MANAGEMENT’S DISCUSSION AND ANALYSIS FY 2002

Committee on Immunization Practices and other leading authorities recommend anannual vaccination for influenza (flu) and a lifetime vaccination for pneumococcal.
The FY 2002 targets are to achieve a vaccination rate of 72 percent for flu and 66percent for pneumococcal. Data will not be available until the end of 2003. Our FY 2001targets were to increase annual influenza vaccination rates to 72 percent and lifetimepneumococcal vaccination rates to 63 percent. The 1994 baselines were 59 percent forflu and 24.6 percent for pneumococcal pneumonia. We are still awaiting final data forour FY 2001 goal based on the Medicare Current Beneficiary Survey data.
Increase the percentage of Medicare beneficiaries age 65 years and olderreceiving a biennial mammogram.
A mammogram is a safe, low-dose x-ray of the breast and is the most effectivemeans of detecting breast cancer while it is still in an early, treatable stage. Since olderwomen face a greater risk of developing breast cancer than younger women, CMSefforts to encourage regular mammograms is critical to reducing breast cancer amongwomen of Medicare age.
We exceeded our FY 2001 target to increase biennialmammography rates for women age 65 years and older to 51percent. Based on the National Claims History File, weachieved 51.6 percent. Our 1997-1998 baseline for this goal was45 percent. We expect to receive data about whether wereached our FY 2002 target of 52 percent in August 2003.
Increase the rate of diabetic eye exams.
Diabetes is another highly prevalent condition in the Medicare population, andmany complications of the disease, such as blindness, can be prevented or delayed withappropriate monitoring or treatment. This goal is to increase special eye exams givenbiennially for our diabetic beneficiaries in order to prevent a form of blindnessassociated with this disease. The baseline from the National Claims History File is 67.8percent (1997–1999). We surpassed our FY 2001 target of 68.3 percent by reaching 68.9percent. Data for our FY 2002 target of 68.6 percent is expected Spring 2003.
Decrease the prevalence of restraints in nursing homes.
Reducing the use of physical restraints is one of our major quality initiatives.Achieving low prevalence of physical restraint use is an accepted indicator of quality ofcare and considered a proxy for measuring quality of life for nursing home residents.The use of restraints can cause incontinence, pressure sores, loss of mobility, and othermorbidities. The FY 2001 target to decrease the prevalence of restraints in nursinghomes to 10 percent was reached successfully. In FY 2002, the target was again set at 10percent. Final data is expected in March 2003.
Decrease the prevalence of pressure ulcers in nursing homes.
The development of pressure ulcers is an undesirable outcome that can be preventedin most nursing home residents, except in those whose clinical condition impedes the
13
CMS MANAGEMENT’S DISCUSSION AND ANALYSIS FY 2002

prevention of pressure ulcer development. Reduction of facility-acquired pressure ulcersremains a high priority of CMS.
We are developing a program to educate providers how to more accurately assessand code residents’ conditions, including pressure ulcers. We are also developingprotocols, including onsite audit procedures, to assess the accuracy of nursing homes’Minimum Data Set assessments. Additionally, CMS has convened a panel of nationalclinical experts in pressure sore treatment and prevention to help CMS revise theguidelines and investigative protocols used by surveyors, and to improve surveyortraining. The FY 2001 target was to decrease the prevalence of pressure ulcers in nursinghomes to 9.6 percent; however, our performance was 10.5 percent. We expect to receivedata on whether our FY 2002 target of 9.5 percent was reached in March 2003.
Decrease the number of uninsured children by working with States toimplement the State Children’s Health Insurance Program and by enrollingchildren in Medicaid.
The SCHIP makes an unprecedented investment to improve thequality of life for millions of vulnerable, uninsured, low-income chil-dren. States were given the option to expand their Medicaid program,establish a separate SCHIP, or use a combination of both. The CMS goalis to increase the number of children (up to age 19 for SCHIP; age 21 forMedicaid) who are enrolled in regular Medicaid or SCHIP by one millionover the previous year’s level. As of FY 2001, there were approximately27.1 million children enrolled in SCHIP and Medicaid. Due to the over-whelming support for the program, we expect to increase enrollment by1 million in FY 2002. We expect FY 2002 data by early 2003.
Increase the percentage of Medicaid 2-year-old children who are fully immunized.
Three groups of States, staggered over four years, will develop State-specific base-lines, methods, and 3-year targets to increase childhood immunization rates for theirStates’ Medicaid 2-year olds. All 16 Group I States have completed development of theirmethodologies, baselines, and 3-year targets. For FY 2001, 15 of the 16 have reported ontheir progress; the final State will report in January 2003. For FY 2002, 5 of the 16 Statesreported their second remeasurement.
The ten Group II States made excellent progress during their developmental period.These States have defined their State-specific methodologies and all have set their base-line and 3-year target rates. Two of the 10 States reported their first remeasurement forFY 2002. Recruitment efforts for the final group of States (Group III) have beensuccessful and these States are working on defining their State-specific measures duringtheir developmental period.
Improve satisfaction of Medicare beneficiaries with the health care they receive.
Our FY 2002 target of directing efforts to improve beneficiary satisfaction in bothmanaged care (MC) and FFS was met by continuing to collect and share ConsumerAssessment Health Plans Surveys (CAHPS) information from beneficiaries with health
14
CMS MANAGEMENT’S DISCUSSION AND ANALYSIS FY 2002

plans, and QIOs and beneficiaries. Our measures, set on baselines from CY 2000, includeachieving targets by CY 2004 of 93 percent (MC) and 95 percent (FFS) of beneficiaries foraccess to care, and 86 percent (MC) and 85 percent (FFS) of beneficiaries for access to aspecialist. In order for the increases to be statistically significant, these are long-termtargets with reporting due at the end of the 5-year period.
Strategic Goal Foster Appropriate and PredictablePayments and High Quality Care
Sustain Medicare payment timeliness consistent with statutory floor and ceilingrequirements.
We will continue to maintain payment timeliness performance at a level that meetsthe statutory requirement of Medicare intermediaries and carriers who must pay 95percent of clean electronic media claims between 14 and 30 days from the date ofreceipt. We exceeded our FY 2002 target (intermediaries equal 99.7 percent; carriersequal 99.5 percent).
Develop new Medicare payment systems in fee-for-service and Medicare+Choice.
This goal was designed to measure our progress towards the development ofadditional payment systems in FFS and M+C. We met our FY 2002 goal to implement aprospective payment system for inpatient rehabilitation facilities. A revised risk adjustmentmodel has been selected that incorporates both inpatient and ambulatory data.
Strategic Goal Promote Understanding of CMS Programs AmongBeneficiaries, the Health Care Community, and the Public
Improve effectiveness of dissemination of Medicare information tobeneficiaries.
We place a high priority on educating our beneficiaries aboutMedicare program options and provisions. This performance goal andthe following goal measure our efforts to educate Medicarebeneficiaries. We expect to yield positive results for both of thesegoals through the following CMS efforts: national media campaigns,phone service availability for 1-800-MEDICARE, web-based capabilities
to help consumers compare health plan choices, and a publicity campaign on the newchoices and new ways to obtain information.
With clear baselines in place, we continue to track our beneficiary education effortstoward our 5-year target for beneficiary accessibility and understanding of educational
15
CMS MANAGEMENT’S DISCUSSION AND ANALYSIS FY 2002

efforts regarding the M+C program. Our goal is that by FY 2004, 77 percent ofbeneficiaries (a 10 percent increase over FY 1999) will report that the information theyreceived answered their questions and 57 percent (also a 10 percent increase over FY1999) will know that most people covered by Medicare can select from among differenthealth plan options within Medicare.
Improve beneficiary understanding of basic features of the Medicare program.
Our goal is to improve beneficiary awareness of (1) the core features of the Medicareprogram and (2) the CMS sources available to obtain additional information. Wecompleted all our targeted actions necessary to design and field survey questions tomeasure our efforts in these areas. We expect to meet our goal for FY 2002 of settingbaselines and targets by early 2003 once the analyzed survey data is available.
Improve effectiveness of dissemination of Medicare information to beneficiariesin fee-for-service through implementation of the Medicare Summary Notice.
National implementation of the Medicare Summary Notice (MSN) is expected toimprove the effectiveness of information for beneficiaries enrolled in the FFS program.Because this monthly information will be in a more understandable format thanprevious multiple notices, it is also expected to be easier for beneficiaries to spotinconsistencies or instances of potential fraud. In FY 2002, CMS reached its goal ofnational implementation of MSN.
Improve Medicare’s administration of the beneficiary appeal process.
The appeal process is a critical safeguard available to all Medicare beneficiaries,which allows them to challenge denial of service. The 2002 target for this goal wasdevelopmental. In FY 2002, CMS planned to issue an Operational Policy Letter withinstructions for the Medicare+Choice Organizations (M+COs) to begin reporting appealsdata. In response to industry concerns however, CMS reassessed the need to collect dataat the MCO level. The FFS data collection is currently being reevaluated to determinedata needs mandated by the Benefits Improvement and Protection Act (BIPA) of 2000.We are also considering the benefit of a system that can use both FFS and M+C data.
Increase awareness about the opportunity to enroll in the Medicare Savings Programs.
Although Medicare provides beneficiaries with a basic set of health benefits, thebeneficiaries are still responsible for out-of-pocket premiums, deductibles, and co-insurance. These costs can be prohibitive for many beneficiaries, particularly for theapproximately 12 percent who do not have private or public supplemental insurance.This performance goal will seek to increase awareness of State programs that can assistlow-income Medicare beneficiaries with their Medicare cost-sharing expenses. Initiallythis goal will focus on individuals who are eligible for the Qualified MedicareBeneficiary and Specified Low Income Medicare Beneficiary programs. The target for FY2002 is to develop a baseline and set future targets to increase awareness. We willreceive this information in early 2003.
16
CMS MANAGEMENT’S DISCUSSION AND ANALYSIS FY 2002

Strategic Goal Promote the Fiscal Integrity of CMS Programsand be an Accountable Steward of Public Funds
Maintain CMS’s improved rating on financial statements.
With one of the largest budgets in the Federal government, CMS has a specialobligation to ensure that we spend each dollar, whether for benefits or administration,as wisely as possible. In FY 1999, FY 2000, and FY 2001, CMS received an unqualifiedaudit opinion. We have continued to meet our target of obtaining an unqualifiedopinion on the FY 2002 financial statements.
Reduce the percentage of improper payments made under the Medicare fee-for-service program.
The purpose of this goal is to continue to reduce the percentage of improperpayments made under the Medicare FFS program. One of our key goals is to pay claimsproperly the first time. This means paying the right amount to legitimate providers, forcovered, reasonable and necessary services provided to eligible beneficiaries. Payingclaims right the first time saves resources required to recover improper payments andensures the proper expenditure of valuable Medicare trust fund dollars. We havevirtually cut the Medicare FFS error rate in half over the past few years. In FY 2000 weachieved a Medicare FFS error rate of 6.8 percent. We continued this successful trend ofreducing the error rate by achieving a 6.3 percent level in FY 2001 and FY 2002.
Increase Medicare Secondary Payer (MSP) credit balance recoveries and/ordecrease recovery time to recoup dollar recoveries.
Medicare Secondary Payer (MSP) activities ensure that payment forhealth care services for beneficiaries is made by the appropriate payer.MSP activity attempts to collect timely and accurate information onthe proper order of payers to ensure that Medicare pays only for thoseclaims where it has primary responsibility. We met our FY 2002 goal,which is focused on developing improved processes and controls forthe credit balance recovery process, to be utilized by the contractors toensure consistency and timely recoveries.
Develop and implement methods for measuring program integrity outcomes.
We are developing better methods to measure fraud, waste, and abuse in the Medicareprogram. For FY 2001, CMS implemented a provider compliance rate (PCR) to measurethe appropriateness of claims submitted prior to their payments. In addition, CMS devel-oped a Comprehensive Error Rate Testing (CERT) program that will produce contractor,provider, and benefit specific error rates. The error rates can be aggregated to producenational level estimates similar to the CFO audit Medicare FFS error rate, but with greater
17
CMS MANAGEMENT’S DISCUSSION AND ANALYSIS FY 2002

precision. Both PCR and CERT are being implemented simultaneously in several phases.We did not meet our FY 2002 target to develop a model fraud rate program.
Assist States in conducting Medicaid payment accuracy studies for the purposeof measuring and ultimately reducing Medicaid payment error rates.
We are committed to assisting interested States in developing methodologies andconducting pilot studies to reduce Medicaid payment error rates. The FY 2002 target was toconduct a pilot payment accuracy study working with nine States. The data from thesestudies would be used to help refine payment accuracy measurement methodologies andassess the feasibility of constructing a single methodology usable by all States. No acceptedmethodology for Medicaid payment accuracy measurement now exists and only a handfulof States have done work in this area. The FY 2002 goal was met as nine States developedpayment accuracy methodologies as part of their participation in the pilot study.
Improve the management of the survey and certification budget developmentand execution process.
Our goal to improve the survey and certification budget process moved CMS fromthe “cost” based approach to a “price” based methodology, which uses nationalstandard measures of workload and costs to project individual State workloads andbudgets. We analyzed the combined national average survey times for long-term carefacilities. Any State that exceeded the combined national average survey time for long-term care facilities by 15 percent or more was provided an FY 2002 base budget thatassumed the FY 2001 funding level. All other States received a FY 2002 base budgetincrease that did not exceed RO State budget recommendations.
We met our FY 2002 target to allocate the FY 2002 budget increase to the Statesurvey and certification budget using a price-based methodology. Survey qualityperformance measures to enhance the survey process were communicated to ROs andStates in FY 2002.
Increase referral of eligible delinquent debt for cross servicing.
Our goal was to refer 100 percent of all eligible delinquent debt in compliance withthe Debt Collection Improvement Act of 1996. Through the end of FY 2002, CMSreferred over $5.5 billion in delinquent debt. However, due to the various manualprocesses used to track and report Medicare debt, the referral process was more timeconsuming and labor intensive than originally anticipated and therefore we modifiedour goal to 80 percent. We referred about 90 percent of our eligible delinquent debt bythe end of the fiscal year with the balance to be referred in FY 2003.
Assess program integrity customer service.
The CMS is developing a goal to measure and ultimately improve customersatisfaction with the manner in which our program integrity (PI) activities areconducted. This goal focuses on our PI activities with respect to two distinct groups:the provider community and the beneficiary community.
18
CMS MANAGEMENT’S DISCUSSION AND ANALYSIS FY 2002
The provider community interacts with CMS and its contractors in many ways.Many providers view the enrollment process as burdensome because of the amount ofinformation that must be supplied. Providers have voiced concern that they do notreceive consistent feedback from CMS and its contractors regarding billing issues. Theyare also concerned that simple billing errors can result in criminal findings. Part of theaim of this goal is to ensure that providers who are subjects of PI-related reviews aresatisfied with the manner in which their cases were handled, even though they may notbe satisfied with the outcome.
The CMS, in partnership with the American Association for Retired Persons (AARP),has encouraged beneficiaries to be aware of services billed on their behalf and to reportany instances of suspected fraud. This goal will strive to ensure that beneficiarycontacts with CMS and its contractors are handled in a courteous, professional, andattentive manner.
A survey of providers and beneficiaries was conducted in FY 2002. Targets and abaseline are being developed from these data.
Improve the provider enrollment process.
The purpose of this goal is to improve the certified provider enrollment process atthe Medicare contractors. We need to make sure that Medicare contractors only enrollproviders and suppliers who are qualified and that only legitimate individuals andentities receive the right to participate in the Medicare program.
During FY 2002, we created a streamlined and more uniform process of revalidatingapplications from certified providers for Medicare that will continue to promote the typeof payment safeguards we implemented in 1996-1997 with the first nationallystandardized enrollment application process. Our target for FY 2002 was to develop theProvider Enrollment Chain Ownership System (PECOS), implement the revised CMS-855enrollment form, and issue a regulation pertaining to establishing and maintainingbilling privileges. The PECOS will provide CMS and its contractors the ability to obtain acomplete history of any provider or supplier that has or had a business relationshipwith the Medicare program and the role or roles the individual or organization played inthat relationship (e.g., physician, owner, manager, billing agent, etc.). We expect todetermine the success of meeting this goal in early 2003.
Strategic Goal Foster Excellence in the Designand Administration of CMS Programs
Process Medicare+Choice organization elections in compliance with the BBAbeneficiary election provisions.
For FY 1999 through FY 2001, this performance goal measured the timeliness of CMSsystems’ processing of Medicare beneficiary enrollment transactions received fromM+COs as specified by the BBA. The FY 2002 performance goal measured the processing
19
CMS MANAGEMENT’S DISCUSSION AND ANALYSIS FY 2002
of enrollment and disenrollment transactions received from M+COs in compliance withthe beneficiary election provisions of the BBA effective in 2002. Due to the passage of theBioterrorism Preparedness Act of 2001, the implementation of the lock-in provisions hasbeen statutorily delayed until FY 2005, so this goal could not be achieved in FY 2002 andhas been discontinued.
Improve CMS’s information systems security.
As CMS broadens the scope of its on-line activity with increased numbers ofbusiness partners and technological complexity, the protection of confidentialinformation becomes even more critical. We are committed to fulfilling our stewardshipresponsibilities for the information contained in our data systems and transported acrossour networks.
In FY 2002, CMS’s goal was to achieve zero material weaknesses in the electronicdata processing (EDP) portion of the FY 2002 CFO audits. In addition, evaluations of thehighest risk Medicare contractors’ security profiles against a comprehensive baseline ofsecurity requirements were completed. Application of the baseline to the CMS businesspartners has begun. The CMS strategy is to complete the evaluation process of all otherMedicare contractors over the next three to four years and to close the gaps identified.Lastly, an intrusion detection capability was implemented in April 2002.
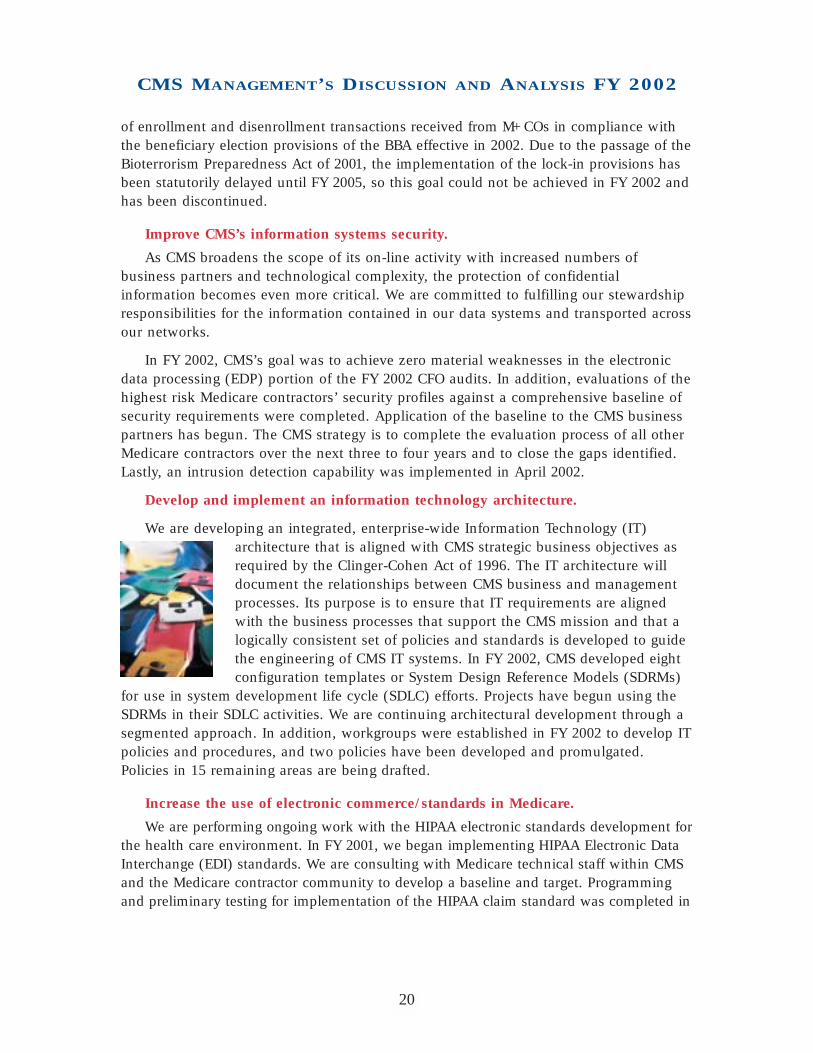
Develop and implement an information technology architecture.
We are developing an integrated, enterprise-wide Information Technology (IT)architecture that is aligned with CMS strategic business objectives asrequired by the Clinger-Cohen Act of 1996. The IT architecture willdocument the relationships between CMS business and managementprocesses. Its purpose is to ensure that IT requirements are alignedwith the business processes that support the CMS mission and that alogically consistent set of policies and standards is developed to guidethe engineering of CMS IT systems. In FY 2002, CMS developed eightconfiguration templates or System Design Reference Models (SDRMs)
for use in system development life cycle (SDLC) efforts. Projects have begun using theSDRMs in their SDLC activities. We are continuing architectural development through asegmented approach. In addition, workgroups were established in FY 2002 to develop ITpolicies and procedures, and two policies have been developed and promulgated.Policies in 15 remaining areas are being drafted.
Increase the use of electronic commerce/standards in Medicare.
We are performing ongoing work with the HIPAA electronic standards development forthe health care environment. In FY 2001, we began implementing HIPAA Electronic DataInterchange (EDI) standards. We are consulting with Medicare technical staff within CMSand the Medicare contractor community to develop a baseline and target. Programmingand preliminary testing for implementation of the HIPAA claim standard was completed in
20
CMS MANAGEMENT’S DISCUSSION AND ANALYSIS FY 2002

FY 2001. However, implementation was delayed into 2003 due to project reprioritizationand limitation of contractor programming hours.
The targets for the FY 2002 goal were to: maintain Electronic Media Claim levels of97 percent for intermediaries and 80 percent for carriers; complete the implementationand testing at Medicare contractor sites of the HIPAA EDI standards for electronic claimsand coordination of benefits, and the electronic remittance advice; and begin theimplementation activities for the eligibility inquiries and response, and claims statusinquiry and response transactions. We met our FY 2002 target.
Improve CMS oversight of Medicare fee-for-service contractors.
Medicare FFS contractors are paid to process claims and administer benefit outlays.Contractors also handle appeals; respond to inquiries from providers and beneficiaries;enroll, educate, and train providers and suppliers; educate and assist beneficiaries; andperform other responsibilities on behalf of CMS. In an effort to improve performance andoversight of these contractors, CMS has established several performance objectives in thisarea. Through the use of performance information to guide our contractor oversightactivities, we are looking forward to continued improvement. Better oversight can beobtained by using a standardized, uniform evaluation process, which is under develop-ment. In FY 2002, CMS continued to build on its progress in developing this goal.
Improve beneficiary telephone customer service.
A recent change in our priorities and the strategy for telephone customer servicerequired a redirection of funding from the national caller satisfaction survey to a pilotoperation in Pennsylvania (beneficiaries calling a single 800 number) in early FY 2002.This important pilot is a model for how CMS will handle calls in the future, and the futurefocus of this goal will track the nationwide implementation of this toll free number.
The CMS also made developing and implementing a standard desktop for customerservice representatives at contractor call centers one of its highest priorities in telephonedelivery. Scheduled to be rolled out to the call centers during FY 2003–2004, the desktopwill result in significant improvements in the call centers by increasing the consistencyand accuracy of responses to beneficiary inquiries, ultimately increasing their satisfactionwith the telephone interaction. Since CMS refocused its priorities, the caller satisfactionand accessibility measures have been discontinued at this time. Thus, the FY 2002 targetto complete the data collection and set baseline targets was only partially met due to ourrefocused approach.
Improve CMS’s workforce planning.
To meet the rising challenge of maintaining a workforce with the specific skillsnecessary to accomplish our goals, and consistent with the President’s Managementpriorities, CMS is instituting a systematic approach to assessing and addressing skills andknowledge needs. In FY 2000, CMS developed a competency catalogue of skills and
21
CMS MANAGEMENT’S DISCUSSION AND ANALYSIS FY 2002

knowledge required to accomplish our functions. This catalogue was used in FY 2001 toinventory current employee competencies.
Since the skills inventory was taken, CMS has been implementing strategies to addressthe gaps in seven targeted knowledge and skill areas. The level of skill or knowledge willbe increased by strategic activities to recruit, develop, retain, and/or re-deploy employees.These activities will be evaluated to determine their effectiveness in increasing knowledgeor skills.
The CMS met its FY 2002 target to build an automated workforce planning systembased on work roles. Having this prototype system available will help CMS determinewhether or not to move forward with building a CMS-specific workforce planning systemor to use tools specified by the Office of the Secretary as part of the “One HHS”consolidation. If a decision is made to move forward with a CMS system, completion isexpected in FY 2003. Full implementation, in FY 2004, will give CMS data on knowledgeand skill gaps that can be tracked over time.
Strategic Goal Provide Leadership in the BroaderHealth Care Marketplace to Improve Health
Provide to States linked Medicare and Medicaid data files for dually eligiblebeneficiaries.
This goal was designed to provide a complete picture of Medicare and Medicaidservice use and expenditures. Individuals who are dually eligible for Medicare andMedicaid are an important and growing segment of beneficiaries. In 2002, there wereapproximately 7 million individuals dually eligible for Medicare and Medicaid.Although dually eligible beneficiaries represent about 17 percent of the Medicarepopulation, they account for 30 percent of total Medicare expenditures. We met our goalfor FY 2002 by making Medicare use data available to all 50 States and 6 Territories.
Assess the relationship between CMS research investments and programimprovements.
The purpose of CMS research program is to provide CMS and the health care policycommunity with objective analyses and information to develop, test and implement newhealth care financing policies and to evaluate the impact of CMS programs on itsbeneficiaries, providers, States, and other customers and partners. A regular systematicreview and assessment of CMS research program is important to ensure that CMSbeneficiaries obtain maximum benefits from research and development spending. Ourperformance on this goal is measured using a formal annual internal assessment that isreviewed and evaluated by external experts. In FY 2001, we met our goal to perform aninternal assessment and an external review. We anticipate completing the internalassessment and external review for FY 2002 by early 2003.
22
CMS MANAGEMENT’S DISCUSSION AND ANALYSIS FY 2002

Sustain improved laboratory testing accuracy.
The Clinical Laboratory Improvement Amendments of 1988(CLIA) strengthened quality performance requirements under thePublic Health Service Act and extend these requirements to alllaboratories that test specimens derived from humans. UnderCLIA, CMS will continue its partnership with the States to certifyand inspect laboratories that test specimens from the humanbody for health purposes. The CMS performance goal is to sustain improved laboratorytesting accuracy by having 90 percent of laboratories enrolled in proficiency testing (PT)with no failures and having 95 percent of laboratories enrolled and participating in PT.We surpassed our CY 2001 targets by having 92.5 percent of laboratories enrolled in PTwith no failures, and by having 96.4 percent of laboratories enrolled and participating inPT. We expect to receive CY 2002 data in March 2003, and based on the performancewe have seen thus far, we anticipate continued success.
FINANCIAL ACCOMPLISHMENTS ANDSTATEMENT HIGHLIGHTSFor the fourth consecutive year, we received an unqualified audit opinion on ourfinancial statements. We continue to meet our goals to achieve an unqualified opinionfrom the auditors, indicating that our financial statements are fairly presented in allmaterial respects and to improve our internal controls and systems. Our strategic visionfor financial management is: To develop and maintain a strong financial managementoperation to meet the changing requirements and challenges of the twenty-first centuryas we continue to safeguard the assets of the Medicare trust funds. To accomplish thisvision, we follow several financial management initiatives, projects, and activities toimprove financial reporting and contractor oversight so that CMS management and otherdecision makers have reliable and accurate financial information. All of our financialmanagement efforts are focused on meeting this challenge.
Chief Financial Officer Comprehensive Plan and Project Plans
We updated our previous comprehensive plan and issued the Chief Financial OfficerFY 2002 Comprehensive Plan for Financial Management. The plan supports ourstrategic vision by outlining the activities necessary to ensure that we meet our responsi-bilities to our nation’s citizens in establishing a strong and effective financial operation atCMS. It contains 8 goals and 24 initiatives to achieve our strategic vision. The four keyfinancial management objectives of our plan are to: (1) improve financial reporting, guid-ance, and oversight by providing timely, reliable, and accurate financial information thatwill enable CMS managers and other decision makers to make timely and accurate pro-gram and administrative decisions, (2) design and implement effective financial manage-ment systems that comply with the Federal Financial Management Improvement Act
23
CMS MANAGEMENT’S DISCUSSION AND ANALYSIS FY 2002

(FFMIA), (3) improve debt collection and internal accounting operations, and (4) validatekey financial data to ensure its accuracy and reliability.
We used project plans to measure our progress in achieving the goals and initiativesin the comprehensive plan. The project plans identified the milestones for achieving theComprehensive Plan goals and initiatives, as well as the detailed activities that supportthe milestones. Each goal and initiative has a project leader, who reports on theirprogress monthly to the CFO and the Deputy CFO. Project management is essential toany successful business and CMS has endorsed project planning enthusiastically.
CFO Audit
We received our first unqualified audit opinion on our financialstatements in FY 1999. While obtaining an unqualified opinionremains an important goal, we recognize that further efforts arenecessary to continue financial management improvements. Wehave taken steps to improve internal controls and the underlying
financial reporting processes to ensure that we can generate accurate financial data onan on-going and timely basis. However, our auditors continue to have concerns overmany aspects of contractor financial reporting. One of the major issues remaining is thestatus of accounts receivable, most of which are maintained on our behalf by our fiscalintermediaries (FI) and carriers. These organizations, commonly referred to as Medicarecontractors, have contracted with CMS to administer the day-to-day operations of theMedicare program. They pay claims, audit provider cost reports, and establish andcollect overpayments. Because the systems used by the Medicare contractors have notalways produced data that were adequately supported, our auditors have had difficultyvalidating their accounts receivable balances.
Accounts Receivable
To continue receiving an unqualified opinion, we recognize that our financial statementshave to properly reflect accounts receivable at their true economic value based onprovisions provided within the Office of Management and Budget Circular A-129,Managing Federal Credit Programs. Medicare accounts receivable consist primarily ofprovider and beneficiary overpayments, and Medicare Secondary Payer (MSP)receivables of paid claims that we subsequently determined that Medicare should havebeen the secondary rather than the primary payer.
While we have made significant improvements in financial reporting, our auditorscontinue to report a material weakness in the Medicare accounts receivable area. Ourlong-term solution to this material weakness is the Healthcare Integrated GeneralLedger Accounting System (HIGLAS). The HIGLAS will provide CMS with an integratedfinancial management system that conforms to government-wide requirements and willstrengthen management of Medicare accounts receivable. Until this system isimplemented, we will continue projects and activities aimed at compensating for thelack of a modernized system.
24
CMS MANAGEMENT’S DISCUSSION AND ANALYSIS FY 2002

Revised Reporting Policy
During FY 2002, we continued a major initiative to reviseand issue Medicare contractor financial reportinginstructions. These instructions include policies regarding thedefinition of an accounts receivable, the treatment of unfiledcost reports and allowance for uncollectible accounts, andrecognizing and reporting non-MSP and MSP currently not collectible (CNC) debt. Inaddition, these revisions included the reformatting of financial reports to enableMedicare contractors, CMS central office (CO), and ROs to provide more detailedfinancial data.
Adjustments to Previously Reported Receivables
In addition to revising policies, we continued to use independent certified publicaccountants (CPAs) as consultants to review Medicare contractor accounts receivablebalances in order to validate the receivable amounts reported to CMS and the adequacyof their internal controls. For FY 2002, the consultants conducted reviews at 15 Medicarecontractors, which comprised about 64 percent of the accounts receivable balancereflected in last year’s financial statements. Additionally, the scope of these reviewsincluded the timely implementation of Medicare contractors’ financial managementcorrective action plans (CAPs).
The consultants’ reviews disclosed a total of $285 million errors ($208 million non-MSP and $77 million MSP) resulting in the accounts receivable being overstated by$61.6 million ($25 million non-MSP and $36.6 million MSP). While there is clearly roomfor improvement, these amounts continue to indicate significant progress and reflect ourenduring commitment to generate accurate financial statements.
Debt Management
We collect the majority of our debt because most overpayments are recognized timely,thus allowing future claims to be offset against current overpayments. Debts that are 181days delinquent are subject to the Debt Collection Improvement Act (DCIA). Under theDCIA, Federal agencies are required to refer debts to the Treasury Offset Program (TOP)and to a designated debt collection center (DCC) for cross-servicing. Debts referred tothe TOP are housed in the National Interactive Database and matched to Federalpayments for potential offset. Debts referred to a DCC for cross-servicing can have avariety of collection activities, including sending additional demand letters, referringdebts to the TOP, referring debts to private collection agencies, negotiating repaymentagreements, and eventually referring some debts to the Department of Justice forlitigation, if necessary. The HHS Program Support Center (PSC) serves as the DCC for allCMS debts. The majority of all CMS debts (MSP and non-MSP) are referred to Treasury,via the PSC, for cross-servicing and referral to TOP.
Our debt referral process encompasses all Medicare contractors, CO, and ROs, whoforward demand letters to the delinquent debtors and input the debt information into
25
CMS MANAGEMENT’S DISCUSSION AND ANALYSIS FY 2002

our Debt Collection System (DCS) to refer the debt electronically to the PSC andTreasury. During FY 2002, we referred approximately $1.4 billion of delinquent debt tothe PSC and Treasury for cross-servicing and TOP. This brought our total grossdelinquent debt referred to the PSC and Treasury to approximately $5.5 billion by theend of FY 2002, which is about 90 percent of the total net eligible to be referred. Ourultimate goal is to have 100 percent of our eligible delinquent debt referred for cross-servicing and TOP by the end of the second quarter of FY 2003.
Medicare Contractor Oversight
Medicare contractors administer the day-to-day operations ofthe Medicare program by paying claims, auditing provider costreports, and establishing and collecting overpayments. As partof these activities, Medicare contractors are required to main-tain a vast array of financial data. Due to the materiality of thisdata, we must have assurances as to its validity and accuracy.
In FY 2001, the financial statement auditors reported that CMS did not clearlydelineate the roles and responsibilities of CO and RO staff for the financial oversight ofits Medicare contractors. As a result, CMS did not perform certain procedures to helpensure that financial information provided by the contractors was reliable, accurate,and complete.
To address these concerns, we created workgroups comprised of CO and ROconsortia staff responsible for addressing four key areas identified by auditors: follow upon CAPs, reconciliations of funds expended to paid claims, trend analysis, and internalcontrols. The objectives of each workgroup are to clearly define CO and RO roles andresponsibilities, as well as develop the national strategic plans to strengthen ourMedicare contractor financial management oversight in these areas.
Corrective Action Plans
The annual CFO audits have identified financial management and electronic dataprocessing (EDP) weaknesses that limit our ability to effectively manage the Medicareand Medicaid programs. Correcting these deficiencies is essential to demonstrate ourcommitment to improve financial management and internal controls. Therefore, auditresolution is a top priority at CMS. Medicare contractors, ROs, and CO components arerequired to prepare a CAP, which describes activities to correct prior year findings, for alldeficiencies identified. Quarterly updates to the CAPs are also required. The CAPs (andtheir updates) are reviewed by CO for adequacy.
During FY 2002, we created a CAP Workgroup that is responsible for developingpolicies and procedures for overseeing Medicare contractors’ reporting and implementa-tion of CAPs. The workgroup issued final manual instructions that required the submis-sion of a “Universal CAP Report” by Medicare contractors that receive various financialmanagement audits that are performed by the OIG, GAO, hired external CPA firms, as well
26
CMS MANAGEMENT’S DISCUSSION AND ANALYSIS FY 2002

as CMS RO and CO staff. The Universal CAP Report standardizes the format of theMedicare contractors’ CAPs submissions, and facilitates CMS’s monitoring responsibilitiesof these reports. Training on these new instructions was provided during our annual CFOtraining conferences. Furthermore, we hired consultants to develop a CAP tracking systemthat will enable us to monitor the progress at which the Medicare contractors areimplementing their CAPs.
We also utilized consultants to follow up on contractors’ CAPs during the Statementon Auditing Standards (SAS) 70 audits and accounts receivable consulting reviews thatwere performed in FY 2002. Also, RO systems security staff visited Medicare contractorsto ensure that EDP problems were corrected.
CMS-1522 Reconciliations
On a monthly basis, Medicare contractors perform a reconciliation of their CMS-1522Funds Expended Report to their paid claims tapes. Although contractors are required tosubmit this reconciliation to CMS each month, the financial statement auditors continueto identify this area as a material weakness during the annual CFO audit.
To address this weakness, we created the CMS-1522 Cash Reconciliation Workgroupthat has been tasked to develop policies and detailed procedures that will requireMedicare contractors to reconcile, on a monthly basis, total funds expended by CMS tothe corresponding Medicare claims that have been submitted and paid. Through apartnership with OIG, CMS provided Medicare contractors a better understanding ofthese reconciliations by providing training in this area during our annual CFO trainingconferences. The workgroup is drafting detailed contractor instructions on thereconciliation process and expects to issue them during FY 2003. Additionally, the 1522Reconciliation Workgroup finalized a review protocol that we will use to ensure thisreconciliation is performed. During FY 2002, the workgroup provided training to CMSRO and CO staff on the final protocol, and selected and performed reviews at sixMedicare contractor locations.
Trend Analysis
During FY 2002, we continued to enhance our analytical toolsto perform more expansive trend analysis procedures of criticalfinancial related data, specifically accounts receivable andquarterly financial statements. We created the Trend AnalysisWorkgroup that was tasked with developing policies andprocedures for performing trend analysis of key financial data,such as accounts receivable, reported by CMS and our Medicare contractors. These toolsprovide us the steps necessary to identify unusual variances, potential errors, systemweaknesses, or inappropriate patterns of financial data accumulation. Additionally, thetools allow us to perform more extensive data analyses and determine the need foradditional actions to ensure that problems are adequately resolved.
To ensure that accounts receivable balances reported are reasonable, the workgroupissued final manual instructions requiring Medicare contractors to perform and submit, on
27
CMS MANAGEMENT’S DISCUSSION AND ANALYSIS FY 2002

a quarterly basis, documentation supporting the trend analysis that is performed. Trainingon these new instructions was also provided to contractors during the annual CFO trainingconferences. Additionally, the workgroup developed and trained CO and RO staff on areview protocol that we will use to review the adequacy of Medicare contractors’ quarterlytrending analysis submissions.
Internal Controls
To continue our emphasis on the importance of internal controls in FY 2002, we createdthe Certification Package on Internal Controls (CPIC) Workgroup that is responsible fordeveloping, creating, and communicating a heightened awareness of internal controlswithin the Medicare contractor community. The workgroup developed a protocol that we
will use to evaluate and assess the Medicare contractors’processes for complying with requirements of the FederalManagers Financial Integrity Act of 1982.
Furthermore, the workgroup finalized manual instructionsthat provides guidelines and policies to the Medicarecontractors to enable them to strengthen their internal control
procedures. The workgroup also updated the Medicare contractors internal controlobjectives. The past several years have confirmed a need for a structured internal controlstrategy and process for CMS. In the past, we have been criticized for not providing a levelof confidence to assure that Medicare contractors had adequate systems of internal controlsthat were in place and operating efficiently. We believe the procedures and methods setforth in this manual will alleviate the problems and weaknesses for which the program hasbeen cited.
We require all Medicare contractors to submit an annual CPIC on their Medicareoperations. In the CPIC, contractors are required to report their material weaknesses andreportable conditions. We require CAPs for all material weaknesses reported in the CPICs.During FY 2002, we also contracted with CPA firms to conduct SAS 70 internal controlreviews of 17 Medicare contractors. The reviews indicated that all 17 Medicare contractorsreviewed had one or more exceptions. To ensure that the exceptions are properly addressedin a timely manner, we requested the contractors develop and submit CAPs. For FY 2003,we will continue to perform these SAS 70 reviews and monitor contractors’ progress forimplementing CAPs resulting from these two initiatives.
Financial Management and Reporting
To achieve accurate financial reporting and reliable internal controls, we have identifiedthe following areas as requiring attention.
Budget Execution
We continue to improve our budget execution for the Program ManagementAppropriation. The Financial Management Investment Board (FMIB), comprised of
28
CMS MANAGEMENT’S DISCUSSION AND ANALYSIS FY 2002

senior staff representing each CMS component, recommends allocations of resources insupport of our priorities. The CMS Deputy Administrator/Chief Operating Officer makesthe final operating plan allocations. In addition, we establish lapse targets for eachProgram Management allotment, and manage funds aggressively to meet those targets.This ensures available funds are identified timely and allocated to fund our priorities.
Guidance to Medicare Contractors
Medicare contractors provide much of the financial data CMS uses to manage theMedicare program. The importance of ensuring that they are effectively managingresources and reporting accurate financial data cannot be emphasized enough.Therefore, we have continued our efforts to hold Medicare contractors accountable forimproved financial management. We do so by requiring them to fix all deficienciesidentified by the annual CFO audits and reviews and to report to us on a quarterly basison their progress.
We also revised and clarified financial reporting and debt collection policies andprocedures based on findings from CFO audits, oversight reviews, and SAS 70 internalcontrol reviews. The evaluation of findings resulting from these reviews allows us toperform risk analysis and profiling of Medicare contractors to determine where ourresources should be focused and where additional guidance is needed. Additionally, wefinalized and issued new guidance requiring Medicare contractors to perform trendanalysis procedures of its Medicare accounts receivable balances on a quarterly basis.Our goal is to continue to improve the consistency of information provided by theMedicare contractors.
We conducted two national training conferences for all of the Medicare contractorsand ROs. We presented our revised policies and procedures for financial reporting andtrend analysis, and also emphasized the importance of debt referral and internalcontrols documentation. With assurances that data is valid and complete, we havegreater confidence in the accuracy and reliability of the financial information reported.We also developed a Medicare contractor financial management manual that willprovide guidance on budget preparation and execution, overpayments, debt collection,accounts receivable, contractor financial reports, and enhance contractors’ ability tomap their internal control environment, and will assist us in the development of trainingon internal control requirements. The manual is Internet-accessible.
Contractor Performance Evaluations (CPE) Program
As part of our CPE program, reviews of overpayments, audit and reimbursement, andMSP were conducted at selected Medicare contractors. These reviews were eitherconducted by a team comprised of multi-office staff or a national team of both CO andRO staff. Regardless of the type of team conducting the review, a standard reviewprotocol was used to ensure the reviews are consistent. In addition, the contractorssubmitted Performance Improvement Plans to address the findings identified.
29
CMS MANAGEMENT’S DISCUSSION AND ANALYSIS FY 2002

Financial Reporting
In FY 2002, we continued to improve our financial statementreporting process within CO. All financial data, including dataprovided by the Department of the Treasury and other Federalagencies, was included in our general ledger. This facilitatedthe preparation of the financial statements by eliminatingmanual entries into spreadsheets to determine necessary adjustments. It also providedthe auditors with a clearer audit trail.
We completed the initiative of preparing automated formatted financial statementsand met our objective to produce and rely upon formatted financial statements directlyfrom the Financial Accounting and Control System (FACS). This will enable the systemto produce an audit trail documenting manual adjustments made to accounts that affectthe financial statements. We also produced interim financial statements for the quartersending March 31, 2002 and June 30, 2002, and, for the fifth consecutive year, submittedour financial statements through the automated financial statement system implementedby HHS.
We have also complied with the Department of the Treasury’s November 2002reporting requirement for the Federal Agencies Centralized Trial Balance System(FACTS) II and the February 2002 reporting requirements for FACTS I. We continued toimprove the operation of FACS by programming and implementing 155 accountingenhancements. These changes ensured that we met new program and Treasuryrequirements, as well as improved our administrative and accounting operations.
Medicare Secondary Payer
Our efforts in the MSP area saved the Medicare trust funds approximately $4.3 billiondollars in FY 2002. During FY 2002, we agreed upon a settlement amount ofapproximately $30 million specific to the recovery of funds from a voluntary medicaldevice recall related to the Sulzer Hip Replacement. We also reached a settlement withDow Corning in response to breast implant litigation, which will result in the recoveryof approximately $10 million.
We are also taking steps to acquire MSP data, in bulk, from our beneficiaries’employers and insurers by entering into voluntary data sharing agreements. In FY 2002, weimplemented such agreements with the Blue Cross Blue Shield Association (on behalf of itsmember plans in the U.S.), Ford, General Motors, and Uniprise (formerly United HealthCare). We are also in negotiations with several other employers and insurers.
Other Initiatives
For the past several years, the number of unsettled managed care cost reports has beendecreasing. The total backlog of unsettled managed care cost reports at the close ofFY 2002 was 139, a decrease of 9 percent from the close of FY 2001. Disallowancesresulting from FY 2002 settlement activity amounted to about $34 million. We havehistorically experienced a rate of return of about 22 to 1. We anticipate those numberswill increase due to significant audit findings. Our most recent information shows for
30
CMS MANAGEMENT’S DISCUSSION AND ANALYSIS FY 2002

the first six-month period of FY 2002 a rate of return of 32 to 1. The remaining backlogof unsettled managed care cost reports still represents a challenge to CMS, becausethese cost reports have critical audit issues that must be resolved with Managed CareOrganizations (MCOs). Therefore, it is projected that settlement activity will remainstable in the future fiscal years.
We also made important accomplishments in our administrative payment areas. Wecontinued to pay all of our administrative payments on time in accordance with thePrompt Payment Act. Over 97 percent of our vendor reimbursements and over 99percent of our travel reimbursements are made electronically.
Healthcare Integrated General Ledger Accounting System
Although our CFO auditors have found that Medicarecontractors’ claims processing systems are operatingeffectively in paying claims, they were not designed to meetthe requirements of a dual entry, general ledger accountingsystem. As a result, they do not meet the provisions of theFederal Financial Management Improvement Act (FFMIA) of
1996. Therefore, a key element of our strategic vision is to acquire an FFMIA-compliantfinancial management system that will include all Medicare contractors. This project iscalled the Healthcare Integrated General Ledger Accounting System (HIGLAS). As part ofthis effort, CMS will replace the FACS, which accumulates all of the CMS financialactivities, both programmatic and administrative, in its general ledger.
Following the guidance of OMB Circular A-130, Management of FederalInformation Resources, we acquired a commercial-off-the-shelf (COTS) product forHIGLAS. IBM (formerly PwC Consulting) is acting as the systems integrator. Its teamingpartners, Oracle Corporation and Electronic Data Systems, are providing the financialaccounting software and application service provider services, respectively. Implementingan integrated general ledger program will give CMS enhanced oversight of contractoraccounting systems and provide high quality, timely data for decision-making andperformance measurement.
The HIGLAS project began with a pilot program with one Medicare contractor(Palmetto Government Benefit Administrators) that processes primarily hospital andother institutional claims, and another Medicare contractor (Empire Blue Cross BlueShield) that processes primarily physician and supplier claims. The pilot phase willreengineer the accounting business process of the Medicare contractors to support theaccounting software.
Once completed, the system will be thoroughly tested to ensure it works correctlyand can handle the large volume of financial transactions generated by the Medicareprogram before a final decision is made to install the accounting system for Medicareand all its contractors. Full implementation is projected for the end of FY 2007.
31
CMS MANAGEMENT’S DISCUSSION AND ANALYSIS FY 2002
The new system will also strengthen management of Medicare accounts receivableand allow more timely and effective collection activities on outstanding debts. Theseimprovements in financial reporting by CMS and its contractors are essential to retainingan unqualified opinion on our financial statements, meeting the requirements of keyfederal legislation, and safeguarding government assets.
Financial Statement Highlights
Consolidated Balance Sheet
The Consolidated Balance Sheet presents amounts of future economic benefits owned ormanaged by CMS (assets), amounts owed (liabilities), and amounts that comprise thedifference (net position). The CMS Consolidated Balance Sheet shows $306.2 billion inassets. The bulk of these assets are in the Trust Fund Investments totaling $271.9billion, which are invested in U.S. Treasury Special Issues, special public obligations forexclusive purchase by the Medicare trust funds. Trust fund holdings not necessary tomeet current expenditures are invested in interest-bearing obligations of the UnitedStates or in obligations guaranteed as to both principal and interest by the United States.The next largest asset is the Fund Balance with Treasury of $19.2 billion, most of whichis for Medicaid and SCHIP. Liabilities of $45.4 billion consist primarily of theEntitlement Benefits Due and Payable of $44.6 billion. The CMS net position totals$260.8 billion and reflects the cumulative results of the Medicare trust fund investmentsand the unexpended balance for SCHIP.
Consolidated Statement of Net Cost
In FY 2002, the Consolidated Statement of Net Cost shows only a single amount: theactual net cost of CMS operations for the period by program. The three major programsthat CMS administers are Medicare, Medicaid, and SCHIP. The majority of CMSexpenses are allocated to these programs.
Total Benefit Payments were $407.4 billion for FY 2002. This amount includesestimated improper Medicare payments of $8.2 to $18.4 billion based on an OIG audit.Administrative Expenses were $2.6 billion, less than 1 percent of total netProgram/Activity Costs of $384.9 billion.
The net cost of the Medicare program including benefit payments, QualityImprovement Organizations, Medicare Integrity Program spending, and administrativecosts, was $231.1 billion. The HI total costs of $148.1 billion were offset by $1.5 billionin premiums. The SMI total costs of $109.0 billion were offset by premiums of $24.4billion. Medicaid total costs of $150.1 billion represent expenses incurred by the Statesand Territories that were reimbursed by CMS during the fiscal year, plus accruedpayables. The SCHIP total costs were $3.7 billion.
32
CMS MANAGEMENT’S DISCUSSION AND ANALYSIS FY 2002

Consolidated Statement of Changes in Net Position
The Consolidated Statement of Changes in Net Position shows the net cost of operationsless financing sources other than exchange revenues, and the net position at the end ofperiod. The line, Appropriations Used, represents the Medicaid appropriations used of$149.9 billion, $85.8 billion in transfers from Payments to Health Care Trust Funds to HIand SMI, SCHIP appropriations of $3.7 billion, and Ticket to Work appropriations of$8 million. Medicaid and SCHIP are financed by a general fund appropriation providedby Congress. Employment tax revenue is Medicare's portion of payroll and self-employ-ment taxes collected under the Federal Insurance Contribution Act (FICA) and Self-Employment Contribution Act (SECA) for the HI trust fund totaling $152.0 billion. TheFederal matching contribution is income to the SMI program from a general fundappropriation (Payments to Health Care Trust Funds) of $76.7 billion, that matchesmonthly premiums paid by beneficiaries.
Combined Statement of Budgetary Resources
The Combined Statement of Budgetary Resources providesinformation about the availability of budgetary resources, aswell as their status at the end of the year. The CMS totalbudgetary resources were $510.1 billion. Obligations of $506.7billion leave available unobligated balances of $3.4 billion.Total outlays were $497.7 billion. Net outlays to the publicwere $381.7 billion. The difference between the outlays to the public and the net outlaysof $471.7 billion is comprised of $90.0 billion in the Payments to Health Care TrustFunds, which is appropriated from the general fund into the SMI trust fund, thenexpended as benefit payments; and $26.0 billion relating to collection of premiums.
Consolidated Statement of Financing
The Consolidated Statement of Financing is a reconciliation of the preceding statements.Accrual-based measures used in the Consolidated Statement of Net Cost differ from theobligation-based measures used in the Combined Statement of Budgetary Resources,especially in the treatment of liabilities. A liability not covered by budgetary resourcesmay not be recorded as a funded liability in the budgetary accounts of CMS’s generalledger, which supports the Report on Budget Execution (SF 133) and the CombinedStatement of Budgetary Resources. Therefore, these liabilities are recorded as contingentliabilities on the general ledger. Based on appropriation language, they are considered“funded” liabilities for purposes of the Consolidated Balance Sheet, ConsolidatedStatement of Net Cost, and Consolidated Statement of Changes in Net Position. Areconciling item has been entered on the Consolidated Statement of Financing.
Required Supplementary Stewardship Information (RSSI)
As required by the Statement of Federal Financial Accounting Standards (SFFAS)Number 10, CMS has included information about the Medicare trust funds—HI and SMI.The RSSI assists users in evaluating operations and aids in assessing the sufficiency of
33
CMS MANAGEMENT’S DISCUSSION AND ANALYSIS FY 2002

future budgetary resources to sustain program services and meet program obligations asthey come due. The information is drawn from the 2002 Annual Report of the Boardsof Trustees of the Federal Hospital Insurance and Federal Supplementary MedicalInsurance Trust Funds, which represents the official government evaluation of thefinancial and actuarial status of the Medicare trust funds.
Limitations of the Financial Statements
The financial statements have been prepared to report the financial position and resultsof operations of CMS, pursuant to the requirements of 31 U.S.C. 3515(b) and the ChiefFinancial Officers Act of 1990 (P.L. 101-576).
While these financial statements have been prepared from CMS’s general ledgerand subsidiary reports and supplemented with financial data provided by the U.S.Treasury in accordance with the formats prescribed by OMB, the statements are inaddition to the financial reports used to monitor and control budgetary resources thatare prepared from the same books and records. These statements use accrualaccounting, and some amounts shown will differ from those in other financialdocuments, such as the Budget of the U.S. Government and the annual report of theBoards of Trustees for HI and SMI, which are presented on a cash basis. Thestatements should be read with the realization that they are for a component of theUnited States government, a sovereign entity. One implication of this is that liabilitiescannot be liquidated without legislation that provides resources to do so. The accuracyand propriety of the information contained in the principal financial statements and thequality of internal control rests with management.
34
CMS MANAGEMENT’S DISCUSSION AND ANALYSIS FY 2002

CONSOLIDATED BALANCE SHEETAs of September 30, 2002
(in millions)
FY 2002 FY 2001Consolidated Consolidated
Totals Totals
ASSETSIntragovernmental Assets:
Fund Balance with Treasury (Note 2) $19,182 $17,427Trust Fund Investments (Note 3) 271,933 243,092 Accounts Receivable, Net (Note 4) 634 554 Other Assets:
Anticipated Congressional Appropriation (Note 5) 10,399 11,166
Total Intragovernmental Assets 302,148 272,239
Cash and Other Monetary Assets 375 137Accounts Receivable, Net (Note 6) 3,612 4,086 General Property, Plant and Equipment, Net 9 12Other 54
TOTAL ASSETS $306,198 $276,474
LIABILITIES (Note 9)Intragovernmental Liabilities:
Accounts Payable $224Accrued Payroll and Benefits 5 $4Other Intragovernmental Liabilities (Note 7) 312 698
Total Intragovernmental Liabilities 541 702
Federal Employee and Veterans’ Benefits 10 10 Entitlement Benefits Due and Payable (Note 8) 44,576 40,441Accrued Payroll and Benefits 56 55 Other Liabilities (Note 7) 212 210
TOTAL LIABILITIES 45,395 41,418
NET POSITIONUnexpended Appropriations 14,096 11,564 Cumulative Results of Operations 246,707 223,492
TOTAL NET POSITION $260,803 $235,056
TOTAL LIABILITIES AND NET POSITION $306,198 $276,474
The accompanying notes are an integral part of these statements.
35
PrincipalStatements and Notes
PrincipalStatements and Notes

CONSOLIDATED STATEMENT OF NET COSTFor the Year Ended September 30, 2002
(in millions)
FY 2002 FY 2001Consolidated Consolidated
Totals TotalsNET PROGRAM/ACTIVITY COSTS
GPRA ProgramsMedicare (Includes estimated improper $231,132 $219,357payments of $8.2-$18.4 billion) (Note 10)Medicaid 150,101 130,450 SCHIP 3,662 2,487
Net Cost - GPRA Programs 384,895 352,294
Other ActivitiesCLIA 19 83Ticket to Work Incentive 9 2Other 1 2
Net Cost - Other Activities 29 87
NET COST OF OPERATIONS (Note 11) $384,924 $352,381
The accompanying notes are an integral part of these statements.
CONSOLIDATED STATEMENT OF CHANGES IN NET POSITIONFor the Year Ended September 30, 2002
(in millions)
CumulativeResults Unexpended
of Operations AppropriationsBeginning Balances $223,492 $11,564Prior Period Adjustment (Note 12) (110) 110
BEGINNING BALANCES, AS ADJUSTED 223,382 11,674
Budgetary Financing Sources:Appropriations Received 247,188Appropriations Transferred-in/out (1,050) Other Adjustments (Note 13) (4,348)Appropriations Used 239,368 (239,368)Nonexchange Revenue (Note 14) 169,828 Transfers-in/out Without Reimbursement (Note 15) (976)Other Budgetary Financing Sources
Other Financing Sources:Imputed Financing from Costs Absorbed by Others 29
TOTAL FINANCING SOURCES 408,249 2,422
NET COST OF OPERATIONS 384,924
ENDING BALANCES $246,707 $14,096The accompanying notes are an integral part of these statements.
36
CMS PRINCIPAL STATEMENTS AND NOTES FY 2002

COMBINED STATEMENT OF BUDGETARY RESOURCESFor the Year Ended September 30, 2002
(in millions)Combined
TotalsBudgetary Resources:
Budget authority:Appropriations received $532,604 Net transfers (1,050)
Unobligated balance:Beginning of period 400
Spending authority from offsetting collections:Earned:
Collected 93Receivable from Federal sources (26)
Change in unfilled customer orders:Advance received 5
Transfers from trust funds 2,388
SUBTOTAL 534,414
Recoveries of prior year obligations 7,256 Temporarily not available pursuant to Public Law (28,031)Permanently not available (3,582)
TOTAL BUDGETARY RESOURCES $510,057
Status of Budgetary Resources:Obligations incurred: (Note 17)
Direct $506,602Reimbursable 97
SUBTOTAL 506,699
Unobligated balance: Apportioned 3,151Unobligated balance not available 207
TOTAL STATUS OF BUDGETARY RESOURCES $510,057
Relationship of Obligations to Outlays:Obligated balance, net, beginning of period $18,587Obligated balance, net, end of period:
Accounts receivable (1,144)Undelivered orders 12,552Accounts payable 6,493
Outlays:Disbursements 499,832Collections (2,163)
SUBTOTAL 497,669
LESS: OFFSETTING RECEIPTS 25,951
NET OUTLAYS $471,718The accompanying notes are an integral part of these statements.
37
CMS PRINCIPAL STATEMENTS AND NOTES FY 2002

CONSOLIDATED STATEMENT OF FINANCINGFor the Year Ended September 30, 2002
(in millions)Consolidated
TotalsRESOURCES USED TO FINANCE ACTIVITIES:
Budgetary Resources Obligated:Obligations incurred $506,699Less: Spending authority from offsetting collections and recoveries 9,716Obligations net of offsetting collections and recoveries 496,983Less: Offsetting receipts 25,951
NET OBLIGATIONS 471,032
Other Resources:Imputed financing from costs absorbed by others 29
NET OTHER RESOURCES USED TO FINANCE ACTIVITIES 29
TOTAL RESOURCES USED TO FINANCE ACTIVITIES $471,061
RESOURCES USED TO FINANCE ITEMS NOT PART OF THE NET COST OF OPERATIONS:Change in budgetary resources obligated for goods,
services and benefits ordered but not yet provided $(451) Resources that fund expenses recognized in prior periods 44,664Other resources or adjustments to net obligated resources
that do not affect net cost of operations 87,220
TOTAL RESOURCES USED TO FINANCE ITEMS NOT PART OF THE NET COST OF OPERATIONS 131,433
TOTAL RESOURCES USED TO FINANCE THE NET COST OF OPERATIONS $339,628
COMPONENTS OF THE NET COST OF OPERATIONS THAT WILL NOT REQUIRE OR GENERATE RESOURCES IN THE CURRENT PERIOD:
Components Requiring or Generating Resources in Future Periods:Accrued Entitlement Benefit costs $44,576Increase in annual leave liability 1 Decrease in exchange revenue receivable from the public 749Other 418
TOTAL COMPONENTS OF NET COST OF OPERATIONS THAT WILL REQUIRE OR GENERATE RESOURCES IN FUTURE PERIODS 45,744
Components Not Requiring or Generating Resources: Depreciation and amortization 4Other (452)
TOTAL COMPONENTS OF NET COST OF OPERATIONS THAT DO NOT REQUIRE OR GENERATE RESOURCES DURING THE REPORTING PERIOD (448)
TOTAL COMPONENTS OF NET COST OF OPERATIONS THAT WILL NOT REQUIRE OR GENERATE RESOURCES IN THE CURRENT PERIOD 45,296
NET COST OF OPERATIONS $384,924
38
CMS PRINCIPAL STATEMENTS AND NOTES FY 2002

The CMS is a separate financial reporting entityof HHS. The financial statements have beenprepared to report the financial position andresults of operations of CMS, as required by theChief Financial Officers Act of 1990. Thestatements were prepared from CMS's accountingrecords in accordance with accounting principlesgenerally accepted in the United States (GAAP)and the form and content specified by the Officeof Management and Budget (OMB) in OMBBulletin 01-09.
The financial statements cover all theprograms administered by CMS. The programsadministered by CMS are shown in twocategories, Medicare and Health. The Medicareprograms include:
Medicare Hospital Insurance (HI)Trust FundMedicare contractors are paid by CMS to processMedicare claims for hospital inpatient services,hospice, and certain skilled nursing and homehealth services. Benefit payments made by theMedicare contractors for these services, as wellas administrative costs, are charged to the HItrust fund. The CMS payments to managed careplans are also charged to this fund. The financialstatements include HI trust fund activitiesadministered by the Department of the Treasury(Treasury). This trust fund has permanentindefinite authority.
Medicare Supplementary MedicalInsurance (SMI) Trust FundMedicare contractors are paid by CMS to processMedicare claims for physicians, medicalsuppliers, hospital outpatient services andrehabilitation, end stage renal disease (ESRD),rural health clinics, and certain skilled nursingand home health services. Benefit paymentsmade by the Medicare contractors for theseservices, as well as administrative costs, are
charged to the SMI trust fund. The CMSpayments to managed care plans are alsocharged to this fund. The financial statementsinclude SMI trust fund activities administered byTreasury. This trust fund has permanentindefinite authority.
Medicare Integrity Program (MIP)The Health Insurance Portability andAccountability Act, Public Law 104-191,established the MIP and codified the programintegrity activities previously known as“payment safeguards.” This account is alsocalled the Health Care Fraud and Abuse Control(HCFAC) Program, or simply “Fraud and Abuse.”The CMS contracts with eligible entities toperform such activities as medical andutilization reviews, fraud reviews, cost reportaudits, and the education of providers andbeneficiaries with respect to payment integrityand benefit quality assurance issues. The MIP isfunded by the HI trust fund.
Payments to the Health Care TrustFunds AppropriationThe Social Security Act provides for payments tothe HI and SMI trust funds for SMI (appropriatedfunds to provide for Federal matching of SMIpremium collections) and HI (for the Uninsuredand Federal Uninsured Payments). In addition,funds are provided by this appropriation to coverthe Medicaid program's share of CMS’sadministrative costs. To prevent duplicativereporting, the Fund Balance, UnexpendedAppropriation, Financing Sources andExpenditure Transfers of this appropriation arereported only in the Medicare HI and SMIcolumns of the financial statements.
Permanent AppropriationsA transfer of general funds to the HI trust fund inamounts equal to SECA tax credits and the
39
CMS PRINCIPAL STATEMENTS AND NOTES FY 2002
NOTE 1:SUMMARY OF SIGNIFICANT ACCOUNTING POLICIES
Reporting Entity

increase to the tax payment from Old AgeSurvivors and Disability Insurance (OASDI)beneficiaries is made through 75X0513 and75X0585, respectively. The Social SecurityAmendments of 1983 provided credits against theHI taxes imposed by the SECA on the self-employed for calendar years 1984 through 1989.The amounts reported in FY 2002 are adjustmentsfor late or amended tax returns. The SocialSecurity Amendments of 1994, provided for addi-tional tax payments from Social Security and Tier1 Railroad Retirement beneficiaries.
The Health programs include:
MedicaidMedicaid, the health care program for low-incomeAmericans, is administered by CMS in partnershipwith the States. Grant awards limit the funds thatcan be drawn by the States to cover currentexpenses. The grant awards, prepared at thebeginning of each quarter and amended asnecessary, are an estimate of the CMS share ofStates' Medicaid costs. At the end of each quarter,States report their expenses (net of recoveries) forthe quarter, and subsequent grant awards areissued by CMS for the difference betweenapproved expenses reported for the period andthe grant awards previously issued.
The State Children’s Health InsuranceProgram (SCHIP)SCHIP, included in the Balanced Budget Act of1997 (BBA), was designed to provide healthinsurance for children, many of whom comefrom working families with incomes too high toqualify for Medicaid, but too low to affordprivate health insurance. The BBA set asidefunds for ten years to provide this new insurancecoverage. The grant awards, prepared at thebeginning of each quarter and amended asnecessary, are based on a State approved plan toimplement SCHIP. At the end of each quarter,States report their expenses (net of recoveries)for the quarter, and subsequent grant awards areissued by CMS for the difference betweenapproved expenses reported for the period andthe grant awards previously issued.
The Ticket to Work and WorkIncentives Improvement ProgramThe Ticket to Work and Work IncentivesImprovement Act of 1999, Public Law 106-170,established two grant programs. The Act programprovides funding for Medicaid infrastructuregrants to support the design, establishment andoperation of State infrastructures to help workingpeople with disabilities purchase health coveragethrough Medicaid. The Act also provides fundingfor States to establish Demonstrations to MaintainIndependence and Employment, which willprovide Medicaid benefits and services to workingindividuals who have a condition that, withoutmedical assistance, will result in disability.
Health Maintenance Organization(HMO) Loan and Loan Guarantee FundThe HMO Loan and Loan Guarantee Fund wasoriginally established to provide working capitalto HMOs during their initial period of operationsand to guarantee loans made by private lendersto HMOs. The last loan commitments were madein FY 1983. Direct loans to HMOs were sold,with a guarantee, to the Federal Financing Bank(FFB). The FFB purchase proceeds were thenused as capital for additional direct loans.Therefore, the fund operates as a revolving fund.Currently, CMS collects principal and interestpayments from HMO borrowers, and, in turn,pays the FFB.
Program Management User Fees:Medicare+Choice,Clinical Laboratory ImprovementProgram, and Other User FeesThis account operates as a revolving fundwithout fiscal year restriction. The BBAestablished the Medicare+Choice program thatrequires managed care plans to make paymentsfor their share of the estimated costs related toenrollment, dissemination of information, andcertain counseling and assistance programs.These user fees are devoted to educationalefforts for beneficiaries and outreach partners.The Clinical Laboratory ImprovementAmendments of 1988 (CLIA) marked the first
40
CMS PRINCIPAL STATEMENTS AND NOTES FY 2002

comprehensive effort by the Federal governmentto regulate medical laboratory testing. The CMSand the Public Health Service shareresponsibility for the CLIA program, with CMShaving the lead responsibility for financialmanagement. Fees for registration, certificates,and compliance determination of all U.S. clinicallaboratories are collected to finance the program.Other user fees are charged for certification ofsome nursing facilities and for sale of the dataon nursing facilities surveys. Proceeds from thesale of data from the public use files andpublications under the Freedom of InformationAct (FOIA) are also credited to this fund.
Program Management AppropriationThe Program Management Appropriationprovides CMS with the major source ofadministrative funds to manage the Medicareand Medicaid programs. The funds for thisactivity are provided from the HI and SMI trustfunds, the general fund, and reimbursableactivities. The Payments to the Health Care TrustFunds Appropriation reimburses the Medicare HItrust fund to cover the Medicaid program's shareof CMS administrative costs (see Note 15). Userfees collected from managed care plans seekingFederal qualification and funds received fromother federal agencies to reimburse CMS forservices performed for them are credited to theProgram Management Appropriation.
The cost related to the ProgramManagement Appropriation is allocated amongall programs based on the CMS cost allocationsystem. It is reported in the Medicare and Healthcolumns of the Consolidating Statement of NetCost in the Supplementary Financial StatementSection.
Basis of PresentationThe financial statements have been prepared toreport the financial position and results ofoperations of CMS, pursuant to the requirementsof 31 U.S.C. 3515(b), the Chief Financial OfficersAct of 1990 (P.L. 101-576), as amended by theGovernment Management Reform Act of 1994.
These financial statements have beenprepared from the CMS general ledger inaccordance with GAAP and the formatsprescribed by the OMB Bulletin 01-09. Someamounts shown will differ from those in other
financial documents, such as the Budget of theU.S. Government and the annual report of theBoards of Trustees for HI and SMI, which arepresented on a cash basis.
Basis of AccountingThe CMS uses the Government's StandardGeneral Ledger account structure and followsaccounting policies and guidelines issued by HHS.The financial statements are prepared on anaccrual basis. Individual accounting transactionsare recorded using both the accrual basis andcash basis of accounting. Under the accrualmethod, expenses are recognized when resourcesare consumed, without regard to the payment ofcash. Under the cash method, expenses arerecognized when cash is outlayed. The CMSfollows standard budgetary accounting principlesthat facilitate compliance with legal constraintsand controls over the use of Federal funds.
The CMS uses the cash basis of accountingin the Medicare program to record benefitpayments disbursed during the fiscal year,supplemented by the accrual method to estimatethe value of benefit payments incurred but notyet paid as of the fiscal year end. Revenues arealso recognized both when earned (withoutregard to receipt of cash) and, in the case of HIand SMI premiums, when collected.Employment taxes earmarked for the Medicareprogram are recorded on a cash basis.
The CMS uses the cash basis of accounting inthe Medicaid and SCHIP programs to record fundspaid to the States during the fiscal year,supplemented by the accrual method to estimatethe value of expenses (net of recoveries) not yetreported to CMS as of the end of the fiscal year.
Balance SheetThe Balance Sheet presents amounts of futureeconomic benefits owned or managed by CMS(assets), amounts owed (liabilities), andamounts which comprise the difference (netposition). The major components are describedbelow.
Assets
Fund Balances are funds with Treasury that areprimarily available to pay current liabilities.Cash receipts and disbursements are processed
41
CMS PRINCIPAL STATEMENTS AND NOTES FY 2002

by Treasury. The CMS also maintains lockboxesat commercial banks for the deposit of SMIpremiums from States and third parties and forcollections from HMO plans.
Trust Fund Investments are investments (plusthe accrued interest on investments) held byTreasury. Sections 1817 for HI and 1841 for SMIof the Social Security Act require that trust fundinvestments not necessary to meet currentexpenditures be invested in interest-bearingobligations of the United States or in obligationsguaranteed as to both principal and interest bythe United States. These investments are carriedat face value as determined by Treasury. Interestincome is compounded semiannually (June andDecember) and was adjusted to include anaccrual for interest earned from July 1 toSeptember 30.
Accounts Receivable, Net consists of amountsowed to CMS by other Federal agencies and thepublic. Amounts due are presented net of anallowance for uncollectible accounts.
Medicare Secondary Payer (MSP) Accounts Receivable (A/R) consists of amounts owed to Medicare by insurance companies, employers, beneficiaries, and/or providers for payments made by Medicare that should have been paid by the primary payer. Receipts are transferred to the HI or SMI trust fund upon collection. Amounts due are presented net of an allowance for uncollectible accounts. The allowance for uncollectible accounts is based on past collection experience and an analysis of the outstanding balances.
Medicare Non-MSP A/R consists of amounts owed to Medicare by medical providers and others because Medicare made payments that were not due, for example, excess payments that were determined to have been made once provider cost reports were audited. Non-MSP A/R represent entity receivables and, once collected, are transferred to the HI or SMI trust fund. Amounts due are presented net of an allowance for uncollectible accounts. The allowance for uncollectible accounts is based on past collection experience and an analysis of the outstanding balances.
Cash and Other Monetary Assets are the totalamount of time account balances at theMedicare contractor commercial banks. TheChecks Paid Letter-of-Credit method is used forreimbursing Medicare contractors for thepayment of covered Medicare services. Medicarecontractors issue checks against a MedicareBenefits account maintained at commercialbanks. In order to compensate commercial banksfor handling the Medicare Benefits accounts,Medicare funds are deposited into non-interest-bearing time accounts. The earnings allowanceson the time accounts are used to reimburse thecommercial banks.
Property, Plant and Equipment (PP&E) arerecorded at full cost of purchase, including allcosts incurred to bring the PP&E to a form andlocation suitable for its intended use, net ofaccumulated depreciation. All PP&E with aninitial acquisition cost of $25,000 or more and anestimated useful life of 2 years or greater iscapitalized. The PP&E is depreciated on astraight-line basis over the estimated useful life ofthe asset. Normal maintenance and repair costsare expensed as incurred.
Liabilities
Liabilities represent amounts owed by CMS asthe result of transactions that have occurred. Inaccordance with Public Law and existing Federalaccounting standards, no liability is recorded forany future payment to be made on behalf ofcurrent workers contributing to the Medicare HItrust fund.
Liabilities covered by available budgetaryresources include (1) new budget authority,(2) spending authority from offsettingcollections, (3) recoveries of unexpired budgetauthority, (4) unobligated balances of budgetaryresources at the beginning of the year, and(5) permanent indefinite appropriation orborrowing authority.
Liabilities not covered by budgetary resourcesare incurred when funding has not yet been madeavailable through Congressional appropriations orcurrent earnings. The CMS recognizes suchliabilities for employee annual leave earned butnot taken, and amounts billed by the Departmentof Labor for Federal Employee’s CompensationAct (FECA) payments. For CMS revolving funds,all liabilities are funded as they occur.
42
CMS PRINCIPAL STATEMENTS AND NOTES FY 2002

Accounts Payable consists of amounts due forgoods and services received, progress in contractperformance, interest due on accounts payable,and other miscellaneous payables.
Federal Employee and Veterans’ Benefitsconsist of the actuarial portions of futurebenefits earned by Federal employees andVeterans, but not yet due and payable. Thesecosts include pensions, other retirement benefits,and other post-employment benefits. Thesebenefits programs are normally administered bythe Office of Personnel Management (OPM) andnot by CMS.
Entitlement Benefits Due and Payablerepresent Medicare or Medicaid medical servicesincurred but not paid as of September 30. TheMedicare estimate is developed by the Office ofthe Actuary (OACT) and is based on historicaltrends of completeness that take intoconsideration estimated deductible andcoinsurance amounts. The estimate represents(1) claims incurred that may or may not havebeen submitted to the Medicare contractors andwere not yet approved for payment, (2) claimsthat have been approved for payment by theMedicare contractors for which checks have notyet been issued, (3) checks that have beenissued by the Medicare contractors in paymentof a claim and that have not yet been cashed bypayees, (4) periodic interim payments, and(5) retroactive settlements of cost reports.
The Medicaid amount reported is the net ofunreported expenses incurred by the States lessamounts owed to the States for overpayment ofMedicaid funds to providers, anticipated rebatesfrom drug manufacturers, and settlements ofprobate and fraud and abuse cases. Thisinformation was provided by the States.
Accrued Payroll and Benefits consist of WorkersCompensation (FECA) payments due to theDepartment of Labor and the estimated liabilityfor salaries, wages, funded annual leave and sickleave that has been earned but is unpaid.
Other Liabilities are the retirement plansutilized by CMS employees; the Civil ServiceRetirement System (CSRS) or the FederalEmployees Retirement System (FERS). UnderCSRS, CMS makes matching contributions equalto 7 percent of pay. The CMS does not reportCSRS assets, accumulated plan benefits, or
unfunded liabilities, if any, applicable to itsemployees. Reporting such amounts is theresponsibility of OPM.
Most employees hired after December 31,1983 are automatically covered by FERS. Aprimary feature of FERS is that it offers a savingsplan to which CMS is required to contribute1 percent of pay and to match employeecontributions up to an additional 4 percent ofpay. For employees covered by FERS, CMS alsocontributes the employer’s matching share ofSocial Security taxes.
Net Position
Net Position contains the following components:
Unexpended Appropriations include the portion of CMS’s appropriations represented by undelivered orders and unobligated balances.
Cumulative Results of Operationsrepresent the net results of operations since the inception of the program plus the cumulative amount of prior period adjustments.
Statement of Net CostThe Statement of Net Cost shows only a singledollar amount: the actual net cost of CMS'soperations for the period by program. UnderGPRA, CMS is required to identify the mission ofthe agency and develop a strategic plan andperformance measures to show that desiredoutcomes are being met. The three majorprograms that CMS administers are: Medicare,Medicaid, and SCHIP. The bulk of CMS’sexpenses are allocated to these programs. TheMIP is included in Medicare. The costs related tothe Program Management Appropriation arecost-allocated to all three major components.The net cost of operations of the CLIA programand other programs are shown separately under“Other Activities.”
Although the following terms do not appearin the Statement of Net Cost, they are an integralpart in the calculation of a program’s net cost ofoperations:
Program/Activity Costs represent the grosscosts or expenses incurred by CMS for allactivities.
43
CMS PRINCIPAL STATEMENTS AND NOTES FY 2002

Benefit Payments are payments by Medicare contractors, CMS, and Medicaid State agencies to health care providers for their services.
Administrative Expenses represent the costs of doing business by CMS and its partners.
Exchange Revenues (or earned revenues) arisewhen a Government entity provides goods andservices to the public or to another Governmententity for a fee.
Premiums Collected are used to finance SMI benefits and administrative expenses. Monthly premiums paid by Medicare beneficiaries are matched by the Federal government through the general fund appropriation, Payments to the Health Care Trust Funds. Section 1844 of the Social Security Act authorizes appropriated funds to match SMI premiums collected, and outlines the ratio for the match as well as the method to make the trust funds whole ifinsufficient funds are available in the appropriation to match all premiums received in the fiscal year.
Net Cost of Operations is the differencebetween the program’s gross costs and its relatedexchange revenues.
Statement of Changes in Net PositionIn FY 2002 CMS revised the format of theStatement of Changes in Net Position (SCNP) toconform to the format prescribed by OMBBulletin 01-09. The SCNP reports the change innet position during the fiscal year that occurredin the two components of net position:Cumulative Results of Operations andUnexpended Appropriations. The SCNPcomprises the following major line items:
Prior Period Adjustments are either correctionsof errors or changes in accounting principleswith retroactive effect that increase or decreasenet position.
Budgetary Financing Sources display financingsources and nonexchange revenue that are alsobudgetary resources, as reported on theStatement of Budgetary Resources.
Appropriations Received show the amounts ofappropriations received in the current fiscal year.
Budgetary Financing Sources (Other thanExchange Revenues) arise primarily fromexercise of the Government's power to demandpayments from the public (e.g., taxes, duties,fines, and penalties). These includeappropriations used, transfers of assets fromother Government entities, donations, andimputed financing.
Appropriations Used and Federal MatchingContributions are described in the MedicarePremiums section above. For financial statementpurposes, appropriations used are recognized asa financing source as expenses are incurred. Atransfer of general funds to the HI trust fund inan amount equal to SECA tax credits is madethrough the Payments to the Health Care TrustFunds Appropriation. The Social SecurityAmendments of 1983 provided credits againstthe HI taxes imposed by the SECA on the self-employed for calendar years 1984 through 1989.
Employment Tax Revenue is the primarysource of financing for Medicare’s HI program.Medicare’s portion of payroll and self-employ-ment taxes is collected under FICA and SECA.Employees and employers were both required tocontribute 1.45 percent of earnings, with nolimitation, to the HI trust fund. Self-employedindividuals contributed the full 2.9 percent oftheir net income.
Transfers-in/Transfers-out report the transfersof funds between CMS programs or betweenCMS and other Federal agencies. Examplesinclude transfers made from CMS’s Payment tothe Health Care Trust Fund appropriation to theHI and SMI trust funds and the transfersbetween the HI and SMI trust funds and CMS’sProgram Management appropriation.
Statement of Budgetary ResourcesThe Statement of Budgetary Resources providesinformation about the availability of budgetaryresources as well as their status at the end of theyear. Budgetary Statements were developed foreach of the budgetary accounts. In this state-ment, the Program Management and the ProgramManagement User Fee accounts are combinedand are not allocated back to the other programs.
44
CMS PRINCIPAL STATEMENTS AND NOTES FY 2002

Also, there are no intra-CMS eliminations in thisstatement. The CMS was required to return theunobligated balance of the indefinite authorityappropriated to Medicaid in the last quarter ofFY 2001 to the general fund of Treasury.
Unobligated Balances—beginning of periodrepresent funds available. These funds areprimarily HI and SMI trust fund balancesinvested by the Treasury.
Budget Authority represents the funds availablethrough appropriations, direct spendingauthority, obligations limitations, unobligatedbalances at the beginning of the period ortransferred in during the period, spendingauthority from offsetting collections, and anyadjustments to budgetary authority.
Obligations Incurred consists of expendedauthority, recoveries of prior year obligationsand the change in undelivered orders.
Adjustments are increases or (decreases) tobudgetary resources. Increases include recoveriesof prior year obligations; decreases includebudgetary resources temporarily not available,recissions, and cancellations of expired and no-year accounts.
Statement of FinancingThe Statement of Financing is a reconciliation ofthe preceding statements. Accrual-based measuresused in the Statement of Net Cost differ from theobligation-based measures used in the Statementof Budgetary Resources, especially in thetreatment of liabilities. A liability not covered bybudgetary resources may not be recorded as afunded liability in the budgetary accounts ofCMS’s general ledger, which supports the Reporton Budget Execution (SF 133) and the Statementof Budgetary Resources. Therefore, these liabilitiesare recorded as contingent liabilities on thegeneral ledger. Based on appropriation language,they are considered “funded” liabilities forpurposes of the Balance Sheet, Statement of NetCost and Statement of Changes in Net Position. Areconciling item has been entered on theStatement of Financing, which has been preparedon a consolidated basis, except for the budgetaryinformation used to calculate net obligations(budgetary resources), which must be presentedon a combined basis.
Use of Estimates in PreparingFinancial StatementsPreparation of financial statements in accordancewith Federal accounting standards requires CMSto make estimates and assumptions that affectthe reported amounts of assets and liabilities anddisclosure of contingent assets and liabilities atthe date of the financial statements and thereported amounts of revenues and expensesduring the reporting period. Actual results maydiffer from those estimates
Intra-Governmental Relationships andTransactionsIn the course of its operations, CMS hasrelationships and financial transactions withnumerous Federal agencies. For example, CMSinteracts with the Social Security Administration(SSA) and Treasury. The SSA determineseligibility for Medicare programs, and alsoallocates a portion of Social Security benefitpayments to the Medicare Part B trust fund forSocial Security beneficiaries who elect to enrollin the Medicare Part B program. The Treasuryreceives the cumulative excess of Medicarereceipts and other financing sources, and issuesinterest-bearing securities in exchange for theuse of those monies. At the Government-widelevel, the assets related to the trust funds onCMS’s financial statements and the correspon-ding liabilities on the Treasury’s financialstatements are eliminated.
Comparative DataIn accordance with OMB Bulletin 01-09, CMShas presented a comparative Balance Sheet andStatement of Net Cost.
Estimation of Obligations Related toCanceled AppropriationsAs of September 30, 2002, CMS has canceledover $136 million in cumulative obligations toFY 1996 and prior years in accordance with theNational Defense Authorization Act of FiscalYear 1991 (P.L. 101-150). Based on the paymentsmade in FYs 1998 through 2002 related tocanceled appropriations, CMS anticipates anadditional $1.5 million will be paid from currentyear funds for canceled obligations.
45
CMS PRINCIPAL STATEMENTS AND NOTES FY 2002

NOTE 2:FUND BALANCE WITH TREASURY (Dollars in Millions)
FY 2002 Entity Assets ConsolidatedUnrestricted Restricted Total
FUND BALANCES:Trust Funds
HI Trust Fund Balance (1) $159 $3 $162SMI Trust Fund Balance (1) (251) 3,014 2,763
Revolving FundsHMO Loan (2) 11 11CLIA (2) 129 129
Appropriated FundsMedicaid 5,040 5,040SCHIP 10,933 10,933TWI (2) 117 117
Other Fund TypesCMS Suspense Account (2) 11 11Program Management Reimbursables (2) 16 16
TOTAL FUND BALANCES $16,165 $3,017 $19,182
STATUS OF FUND BALANCES WITH TREASURY:Unobligated Balance
Available $135 $3,017 $3,152Unavailable (1,872) (1,872)
Obligated Balance not yet Disbursed 17,902 17,902
TOTAL STATUS OF FUND BALANCES WITH TREASURY $16,165 $3,017 $19,182
(1) The restricted portions of the HI and SMI fund balances represent the remaining fund balance in the Payments to the Health Care Trust Funds appropriation, which is allocated to HI and SMI.
(2) These fund balances are reported in the Supplementary Financial Statement section under the “AllOthers” column of the Consolidating Balance Sheet.
FY 2001 Entity Assets ConsolidatedUnrestricted Restricted Total
Trust FundsHI Trust Fund Balance (1) $290 $3 $293SMI Trust Fund Balance (1) (69) (69)
Revolving FundsHMO Loan (2) 10 10CLIA (2) 141 141
Appropriated FundsMedicaid 5,462 5,462SCHIP 11,501 11,501TWI (2) 60 60
Other Fund TypesCMS Suspense Account (2) 16 16 Program Management Reimbursables (2) 13 13
TOTAL FUND BALANCES $17,424 $3 $17,427
(1) The restricted portion of the HI fund balance represents the remaining fund balance in the Payments to the Health Care Trust Funds appropriation, which is allocated to HI. There was no remaining fund balance in the SMI allocation of the Payments to the Health Care Trust Funds appropriation.
(2) These fund balances are reported in the Supplementary Financial Statement section under the “AllOthers” column of the Consolidating Balance Sheet.
46
CMS PRINCIPAL STATEMENTS AND NOTES FY 2002

NOTE 3:TRUST FUND INVESTMENTS, NET (Dollars in Millions)
Medicare Investments
FY 2002 Maturity InterestRange Range Value
HICertificate June 2003 4 3/8% $3,385Bonds June 2003 to June 2017 5 1/4 - 9 1/4% 225,521Accrued Interest 3,597
TOTAL HI INVESTMENTS $232,503
SMICertificate June 2003 4 3/8% $1,179Bonds June 2004 to June 2016 5 1/4 - 8 3/4% 37,626Accrued Interest 625
TOTAL SMI INVESTMENTS $39,430
TOTAL MEDICARE INVESTMENTS $271,933
FY 2001 Maturity InterestRange Range Value
HICertificates June 2002 5 1/8 - 5 5/8% $2,381Bonds June 2002 to June 2016 5 5/8 - 9 1/4% 194,756Accrued Interest 3,272
TOTAL HI INVESTMENTS $200,409
SMIBonds June 2002 to June 2016 5 5/8 - 8 3/4% $41,978Accrued Interest 705
TOTAL SMI INVESTMENTS $42,683
TOTAL MEDICARE INVESTMENTS $243,092
U.S. Treasury Special Issues are special public obligations for exclusive purchase by the Medicaretrust funds. Special issues are always purchased and redeemed at face value. The face value lessamounts retired to fund Medicare program expenses by the programs is the net amountoutstanding reported in the Consolidating Balance Sheet. This schedule summarizes the natureand amount of investments in the Medicare trust funds.
47
CMS PRINCIPAL STATEMENTS AND NOTES FY 2002

NOTE 4:INTRAGOVERNMENTAL ACCOUNTS RECEIVABLE, NET (Dollars in Millions)
FY 2002Medicare All Combined Intra-CMS ConsolidatedHI SMI Medicaid SCHIP Others Total Eliminations Total
Expenditure Transfer-in $323 $690 $87 $3 $41 $1,144 $(1,144)Nonexpenditure Transfer-in 462 260 722 (722)Railroad Retirement Principal 412 412 $412Military Service Contribution 123 123 123Interest on OASDI FY 2001
Warrant 99 99 99
TOTAL INTRAGOVERNMENTAL ACCOUNTS RECEIVABLE, NET $1,419 $950 $87 $3 $41 $2,500 $(1,866) $634
FY 2001Medicare Combined Intra-CMS Consolidated
HI SMI Medicaid Total Eliminations TotalIncome Tax on Benefits (OASDI) $2,630 $2,630 $(2,630)Federal Matching Contributions $1,592 1,592 (1,592)Medicaid Expansion SCHIP $26 26 (26)
ReimbursementRailroad Retirement Principal 431 431 $431Military Service Contribution 123 123 123
TOTAL INTRAGOVERNMENTAL ACCOUNTS RECEIVABLE, NET $3,184 $1,592 $26 $4,802 $(4,248) $554
NOTE 5:ANTICIPATED CONGRESSIONAL APPROPRIATION
48
CMS PRINCIPAL STATEMENTS AND NOTES FY 2002
The CMS has recorded an $10,399 millionanticipated Congressional appropriation to coverliabilities incurred as of September 30 by theMedicaid program, as discussed below:
MedicaidBeginning in FY 1996, CMS has accrued anexpense and liability for Medicaid claimsincurred but not reported (IBNR) as ofSeptember 30. In FY 2002, the IBNR expenseexceeded the available unexpended Medicaid
appropriations in the amount of $10,399 million.A review of appropriation language by CMS’sOffice of General Counsel (OGC) has resulted ina determination that the Medicaid appropria-tion’s indefinite authority provision allows forthe entire IBNR amount to be reported as afunded liability. Consequently, CMS has recordeda $10,399 million anticipated appropriation in FY2002 for IBNR claims that exceed the availableappropriation.

NOTE 6:ACCOUNTS RECEIVABLE, NET (Dollars in Millions)
FY 2002 Medicare All Consolidated HI SMI Medicaid Others Total
Provider & Beneficiary OverpaymentAccounts Receivable Principal $3,472 $1,642 $621 $5,735Less: Allowance for Uncollectible Accounts (1,920) (1,085) (571) (3,576) Accounts Receivable, Net 1,552 557 50 2,159
Medicare Secondary Payer (MSP)Accounts Receivable Principal 34 13 2 49 Less: Allowance for Uncollectible Accounts (6) (1) (7) Accounts Receivable, Net 28 12 2 42
CMPs & Other RestitutionsAccounts Receivable Principal 111 324 2 437 Less: Allowance for Uncollectible Accounts (102) (236) (2) (340) Accounts Receivable, Net 9 88 97
Fraud and AbuseAccounts Receivable Principal 114 128 242 Less: Allowance for Uncollectible Accounts (112) (125) (237)Accounts Receivable, Net 2 3 5
Managed CareAccounts Receivable Principal 1 8 3 12 Less: Allowance for Uncollectible Accounts (3) (3) (6)Accounts Receivable, Net 1 5 6
Medicare PremiumsAccounts Receivable Principal 151 337 488Less: Allowance for Uncollectible Accounts (40) (37) (77)Accounts Receivable, Net 111 300 411
Audit DisallowancesAccounts Receivable Principal 1 $1,430 1,431 Less: Allowance for Uncollectible Accounts (539) (539)Accounts Receivable, Net 1 891 892
Other Accounts ReceivableAccounts Receivable Principal 32 10 42 Less: Allowance for Uncollectible Accounts (32) (10) (42)Accounts Receivable, Net
TOTAL ACCOUNTS RECEIVABLE PRINCIPAL $3,883 $2,453 $1,462 $638 $8,436
Less: Allowance for Uncollectible Accounts (2,180) (1,487) (571) (586) (4,824)
TOTAL ACCOUNTS RECEIVABLE, NET $1,703 $966 $891 $52 $3,612
49
CMS PRINCIPAL STATEMENTS AND NOTES FY 2002

FY 2001 Medicare All Consolidated HI SMI Medicaid Others Total
Provider & Beneficiary OverpaymentAccounts Receivable Principal $4,724 $1,539 $556 $6,819 Less: Allowance for Uncollectible Accounts (2,818) (1,054) (529) (4,401) Accounts Receivable, Net 1,906 485 27 2,418
Medicare Secondary Payer (MSP)Accounts Receivable Principal 117 87 8 212 Less: Allowance for Uncollectible Accounts (49) (43) (3) (95) Accounts Receivable, Net 68 44 5 117
CMPs & Other RestitutionsAccounts Receivable Principal 138 273 1 412 Less: Allowance for Uncollectible Accounts (89) (101) (190) Accounts Receivable, Net 49 172 1 222
Fraud and AbuseAccounts Receivable Principal 104 118 222 Less: Allowance for Uncollectible Accounts (100) (116) (216)Accounts Receivable, Net 4 2 6
Managed CareAccounts Receivable Principal 3 9 9 21Less: Allowance for Uncollectible Accounts (3) (3)Accounts Receivable, Net 3 6 9 18
Medicare PremiumsAccounts Receivable Principal 125 276 401 Less: Allowance for Uncollectible Accounts (29) (24) (53)Accounts Receivable, Net 96 252 348
Audit DisallowancesAccounts Receivable Principal 3 6 $1,146 1,155 Less: Allowance for Uncollectible Accounts (1) (1) (197) (199)Accounts Receivable, Net 2 5 949 956
Other Accounts ReceivableAccounts Receivable Principal 23 1 24 Less: Allowance for Uncollectible Accounts (23) (23)Accounts Receivable, Net 1 1
TOTAL ACCOUNTS RECEIVABLE PRINCIPAL $5,214 $2,308 $1,169 $575 $9,266
Less: Allowance for Uncollectible Accounts (3,086) (1,342) (220) (532) (5,180)
TOTAL ACCOUNTS RECEIVABLE, NET $2,128 $966 $949 $43 $4,086
50
CMS PRINCIPAL STATEMENTS AND NOTES FY 2002

Medicare accounts receivable are primarilycomposed of provider and beneficiary overpay-ments, and MSP overpayments. The MSPreceivables are composed of paid claims inwhich Medicare should have been the secondaryrather than the primary payer. Claims that havebeen identified to a primary payer are includedin the MSP receivable amount. Accountsreceivable data were primarily obtained fromdata provided by the Medicare contractors.
Currently Not Reportable/CurrentlyNot Collectible DebtIn FY 1999, CMS implemented a number ofpolicy changes in the reporting of delinquentaccounts receivable. Provisions within the Officeof Management and Budget (OMB) CircularA-129, Managing Federal Credit Programs,allow an agency to move certain uncollectibledelinquent debts into memorandum entries,which removes the receivable from the financialstatements. The policy provides for certain debtsto be written off closed without any furthercollection activity or reclassified as CurrentlyNot Reportable. (This is also referred to asCurrently Not Reportable/Collectible). Thiscategory of debt will continue to be referred forcollection and litigation, but will not be reportedon the financial statements because of theunlikelihood of collecting it. While these debtsare not reported on the financial statements, theCurrently Not Reportable/Collectible processpermits and requires the use of collection toolsof the Debt Collection Improvement Act of 1996.This allows delinquent debt to be worked untilthe end of its statutory collection life cycle.
In FY 2002, CMS continued the implementa-tion of this policy and again performed analysesof its accounts receivable. CMS also continued tomanage this debt by referring a significantportion of debt to Treasury for offset and cross-servicing in accordance with the Debt CollectionImprovement Act of 1996.
Recognition of MSP AccountsReceivableMSP accounts receivable are recorded on thefinancial statements as of the date the MSPrecovery demand letter is issued. However, theMSP accounts receivable ending balance reflectsan adjustment for expected reductions to group
health plan accounts receivable for situationswhere CMS receives valid documented defensesto its recovery demands.
Write Offs and AdjustmentsThe implementation of the revised policies andother initiatives undertaken in recent fiscal yearsresulted in significant adjustments and write offsmade to CMS’s accounts receivable balance.CMS’s financial reporting reflected additionaladjustments, resulting from the validation andreconciliation efforts performed, revised policiesand supplemental guidance provided by CMS tothe Medicare contractors. The accountsreceivable ending balance continues to reflectadjustments for accounts receivable which havebeen reclassified as Currently Not Reportabledebt and unfiled cost reports.
The allowance for uncollectible accountsreceivable derived this year has been calculatedfrom data based on the agency’s collection activityand the age of the debt for the most current fiscalyear, while taking into consideration the averageuncollectible percentage for the past five years. TheMedicaid accounts receivable has been recorded ata net realizable value based on an historic analysisof actual recoveries and the rate of disallowancesfound in favor of the States. Such disallowancesare not considered bad debts; the States elect toretain the funds until final resolution.
Non-entity AssetsAssets are either “entity” (the reporting entityholds and has authority to use the assets in itsoperations) or “non-entity” (the reporting agencyholds but does not have authority to use in itsoperations). Before FY 2000 CMS reported itsentity and non-entity assets in separate sectionsof the balance sheet. Since FY 2000 CMS hasreported its entity and non-entity assets in asingle combined section.
The only non-entity assets on CMS’sConsolidating Balance Sheet are receivables forinterest and penalties, net for the amount of $51million ($42 million in FY 2001). The accruedinterest associated with Provider and Beneficiary,MSP and Managed Care overpayments appearunder All Others.
51
CMS PRINCIPAL STATEMENTS AND NOTES FY 2002

NOTE 7:OTHER LIABILITIES (Dollars in Millions)
FY 2002 Medicare All ConsolidatedHI SMI Medicaid SCHIP Others Total
Intragovernmental:Uncollected Revenue due Treasury $68 $150 $51 $269 Other 9 15 $2 17 43
TOTAL OTHER INTRAGOVERNMENTAL LIABILITIES $77 $165 $2 $68 $312
Deferred Revenue $43 $150 $193 Suspense Account Deposit Funds $11 11 Other 5 3 8
TOTAL OTHER LIABILITIES $48 $153 $11 $212
FY 2001 Medicare All Combined Intra-CMS ConsolidatedHI SMI Medicaid SCHIP Others Total Eliminations Total
Intragovernmental:Uncollected Revenue due Treasury $54 $117 $42 $213 $213 Unmatched SMI Premiums 1,592 1,592 $(1,592)Income Tax on Benefits 2,630 2,630 (2,630)FICA Tax Adjustment 200 200 200SECA Tax Adjustment 253 253 253Other 5 8 $1 18 32 32
TOTAL OTHER INTRAGOVERNMENTALLIABILITIES $3,142 $1,717 $1 $60 $4,920 $(4,222) $698
Deferred Revenue $48 $138 $186 $186Suspense Account Deposit Funds $14 14 14 Other 7 3 10 10
TOTAL OTHER LIABILITIES $55 $141 $14 $210 $210
52
CMS PRINCIPAL STATEMENTS AND NOTES FY 2002
Potential LiabilityThe CMS routinely processes and settles costreports and payment issues for institutionalproviders and healthcare insurers. As part of thisprocess, some providers/insurers have filed suitschallenging the amount of reimbursement towhich they claim entitlement. The CMS cannotreasonably estimate the probability of theproviders successfully winning their suits or the
exact amount of the potential loss to theMedicare trust funds.
In the opinion of management, the resolutionof these matters will not have a material impacton the results of operations and financialcondition of CMS.

NOTE 8:ENTITLEMENT BENEFITS DUE AND PAYABLE (Dollars in Millions)
FY 2002 Medicare ConsolidatedHI SMI Total Medicaid Total
Medicare Benefits Payable (1) $14,074 $14,106 $28,180 $28,180Demonstration Projects and HMO Benefits 32 24 56 56 Medicaid Benefits Payable (2) $16,048 16,048Medicaid Audit/Program Disallowances (3) 292 292
TOTAL ENTITLEMENT BENEFITS DUE AND PAYABLE $14,106 $14,130 $28,236 $16,340 $44,576
FY 2001 Medicare ConsolidatedHI SMI Total Medicaid Total
Medicare Benefits Payable $13,617 $13,464 $27,081 $27,081 Medicaid Benefits Payable $13,247 13,247Medicaid Audit/Program Disallowances 113 113
TOTAL ENTITLEMENT BENEFITS DUE AND PAYABLE $13,617 $13,464 $27,081 $13,360 $40,441
(1) Medicare benefits payable consists of a $28.2 billion estimate by CMS’s Office of the Actuary ofMedicare services incurred but not paid, as of September 30, 2002.
(2) Medicaid benefits payable of $16.0 billion is an estimate of the net Federal share of expenses thathave been incurred by the States but not yet reported to CMS as of September 30, 2002.
(3) Medicaid audit and program disallowances of $292 million are contingent liabilities that have beenestablished as a result of Medicaid audit and program disallowances that are currently being appealed bythe States. In all cases, the funds have been returned to CMS. The CMS will be required to pay theseamounts if the appeals are decided in the favor of the States. In addition, certain amounts for payment havebeen deferred under the Medicaid program when there is a reasonable doubt as to the legitimacy ofexpenditures claimed by a State. The CMS defers the payment of these claims until the State providesadditional supporting data. Based on historical data, CMS expects to eventually pay approximately 21.7percent of total contingent liabilities. Therefore, of the total contingent liabilities of $1,342 million, CMSexpects to pay approximately $292 million.
53
CMS PRINCIPAL STATEMENTS AND NOTES FY 2002
Appeals at the ProviderReimbursement Review BoardOther liabilities do not include all provider costreports under appeal at the ProviderReimbursement Review Board (PRRB). Themonetary effect of those appeals is generally notknown until a decision is rendered. As ofSeptember 30, 2001, there were 10,142 PRRBcases under appeal. A total of 2,138 new caseswere filed in FY 2002. The PRRB rendereddecisions on 50 cases in FY 2002 and 3,292
additional cases were dismissed, withdrawn orsettled prior to an appeal hearing. The PRRB getsno information on the value of these cases thatare settled prior to a hearing. Since data isavailable for only the 50 cases that were decidedin FY 2002, a reasonable liability estimate cannotbe projected for the value of the 8,938 casesremaining on appeal as of September 30, 2002.As cases are decided, the settlement value paid isconsidered in the development of the actuarialliability estimate.

NOTE 9:LIABILITIES NOT COVERED BY BUDGETARY RESOURCES (Dollars in Millions)
FY 2002 Medicare All Combined Intra-CMS ConsolidatedHI SMI Medicaid SCHIP Others Total Eliminations Total
Intragovernmental:Accrued Payroll and Benefits $1 $3 $1 $5 $5
TOTAL INTRAGOVERNMENTAL $1 $3 $1 $5 $5
Entitlement Benefits Due and Payable $10,999 $10,999 $10,999
Federal Employee and Veterans’ Benefits $3 $7 10 10
Accrued Payroll and Benefits 9 18 2 29 29
TOTAL LIABILITIES NOT COVERED BY BUDGETARY RESOURCES $13 $28 $11,001 $1 $11,043 $11,043
TOTAL LIABILITIES COVERED BYBUDGETARY RESOURCES $15,278 $15,517 $5,344 $79 $36,218 $(1,866) $34,352
TOTAL LIABILITIES $15,291 $15,545 $16,345 $80 $47,261 $(1,866) $45,395
FY 2001 Medicare All Combined Intra-CMS ConsolidatedHI SMI Medicaid SCHIP Others Total Eliminations Total
Intragovernmental:Accrued Payroll and Benefits $1 $1 $2 $2
TOTAL INTRAGOVERNMENTAL $1 $1 $2 $2
Entitlement Benefits Due and Payable $7,779 $7,779 $7,779
Federal Employee and Veterans’ Benefits $3 $6 1 10 10
Accrued Payroll and Benefits 8 18 2 28 28
TOTAL LIABILITIES NOT COVERED BY BUDGETARY RESOURCES $12 $25 $7,782 $7,819 $7,819
TOTAL LIABILITIES COVERED BYBUDGETARY RESOURCES $16,825 $15,339 $5,583 $26 $74 $37,847 $(4,248) $33,599
TOTAL LIABILITIES $16,837 $15,364 $13,365 $26 $74 $45,666 $(4,248) $41,418
54
CMS PRINCIPAL STATEMENTS AND NOTES FY 2002

NOTE 10:MEDICARE BENEFIT PAYMENTS
2002 Cost Report Summary(Dollars in millions)
Desk Reviews and Other Audits Total
Cost Reports 27,098 3,332 30,430Costs Claimed $35,469 $53,076 $88,545Disallowed $119 $(141) $(22)
2001 Cost Report Summary(Dollars in millions)
Desk Reviews and Other Audits Total
Cost Reports 30,393 3,725 34,118Costs Claimed $36,810 $55,891 $92,701Disallowed $407 $350 $757
55
CMS PRINCIPAL STATEMENTS AND NOTES FY 2002
Medicare Claims EstimatedImproper PaymentsFederal government audits require the review ofprograms for compliance with Federal laws andregulations. Accordingly, the OIG reviewed astatistically valid sample of Medicare claims todetermine that claims were paid properly byMedicare contractors, and that services wereactually performed and were medically necessary.Medicare, like other insurers, makes paymentsbased on a standard claims form. The internalclaims process involves reviewing claims as billedand paying the correct amount for the servicesrendered. The claims submitted for payment toMedicare contractors contained no visible errors.However, when the medical review asked fordocumentation from providers to support theirclaims, there was a 6.3 percent error rate with adollar value in the range of $8.2-$18.4 billion($13.3 billion midpoint). The majority of theerrors fell into four broad categories: lack ofmedical necessity, insufficient or nodocumentation, incorrect coding, andnoncovered/unallowable services.
Cost Report Settlement Process The cost report settlement process represents thevalue of final outlays to providers based on fiscalintermediary (FI) audits, reviews and finalsettlements of Medicare cost reports. Allinstitutional providers are required to fileMedicare cost reports. For providers paid underthe prospective payment system (PPS), the costreport includes costs that are not covered underPPS, such as disproportionate share hospitalpayments, indirect medical education payments,and other indirect costs. For providers paid on acost basis, the cost report represents the totalcosts incurred by the provider for medical servicesto patients and reflects the final distribution ofthese costs to the Medicare program.
In FY 2002, 30,430 cost reports totaling$88.5 billion were reviewed. Approximately$72.4 billion represented inpatient claims to PPSproviders. The cost report settlements, therefore,focused on the remaining non-PPS balance ofabout $16.1 billion. The significant decreasebetween FY 2001 and FY 2002 is due primarily tothe implementation of PPS and the reversal ofapproximately $300 million of disallowances thatwere under appeal.

NOTE 11:TOTAL PROGRAM/ACTIVITY COSTS (Dollars in Millions) (By Object Class)
FY 2002 Medicare Total All ConsolidatedHI SMI Medicare Medicaid SCHIP Others Totals
PROGRAM COSTSMedicare
Insurance Claims and
Indemnities
Fee for Service $129,246 $91,367 $220,613 $220,613
Managed Care 17,847 15,942 33,789 33,789
Medicaid/SCHIP/TWI
Grants and Subsidies $149,371 $3,656 $8 153,035
TOTAL PROGRAM COSTS $147,093 $107,309 $254,402 $149,371 $3,656 $8 $407,437
OPERATING COSTS
Administrative
Personal Services and Benefits $141 $216 $357 $27 $1 $385
Contractual Services 761 1,177 1,938 140 5 $1 2,084
Grants and Subsidies 8 18 26 2 28
Travel and Transportation 3 6 9 1 10
Rental and Utilities 15 33 48 4 52
Printing and Reproduction 6 12 18 1 19
Supplies and Materials 1 2 3 3
Equipment 3 5 8 1 9
TOTAL ADMINISTRATIVE COSTS $938 $1,469 $2,407 $176 $6 $1 $2,590
Depreciation and Amortization $1 $2 $3 $3
Bad Debts and Writeoffs (895) 134 (761) $548 (213)
Medicare Integrity Program 968 968 968
Imputed Cost Subsidies 9 18 27 2 29
CLIA Program Costs $78 78
Reimbursable Costs 2 2
Other Costs 14 30 44 4 48
TOTAL COSTS $148,128 $108,962 $257,090 $150,101 $3,662 $89 $410,942
LESS: EARNED REVENUES
Premiums Collected $(1,524) $(24,427) $(25,951) $(25,951)
Other Earned Revenues (7) (7) $(60) (67)
NET COST OF OPERATIONS $146,597 $84,535 $231,132 $150,101 $3,662 $29 $384,924
56
CMS PRINCIPAL STATEMENTS AND NOTES FY 2002

FY 2001 Medicare All Combined Intra-CMS ConsolidatedHI SMI Medicare Medicaid SCHIP Others Totals Eliminations Total
PROGRAM COSTSMedicare
Insurance Claims and
Indemnities
Fee for Service $117,503 $80,285 $197,788 $197,788 $197,788
Managed Care 22,836 19,176 42,012 42,012 42,012
Medicaid/SCHIP/TWI
Grants and Subsidies $130,232 $3,725 $2 133,959 $(1,239) 132,720
TOTAL PROGRAM COSTS $140,339 $99,461 $239,800 $130,232 $3,725 $2 $373,759 $(1,239) $372,520
OPERATING COSTS
Administrative
Personal Services and Benefits $141 $194 $335 $33 $368 $368
Contractual Services 756 980 1,736 156 $1 1,893 1,893
Grants and Subsidies 9 16 25 3 28 28
Travel and Transportation 3 6 9 1 10 10
Rental and Utilities 15 29 44 5 49 49
Printing and Reproduction 1 3 4 4 4
Supplies and Materials 1 2 3 3 3
Equipment 5 8 13 2 15 15
TOTAL ADMINISTRATIVE COSTS $931 $1,238 $2,169 $200 $1 $2,370 $2,370
Depreciation and Amortization $2 $3 $5 $1 $6 $6
Bad Debts and Writeoffs 76 88 164 10 174 174
Medicare Integrity Program 905 905 905 905
Imputed Cost Subsidies 8 16 24 3 27 27
CLIA Program Costs $143 143 143
Reimbursable Costs 4 4 4
Other Costs 14 26 40 4 44 44
TOTAL COSTS $142,275 $100,832 $243,107 $130,450 $3,726 $149 $377,432 $(1,239) $376,193
LESS: EARNED REVENUES
Premiums Collected $(1,439) $(22,307) $(23,746) $(23,746) $(23,746)
Other Earned Revenues (4) (4) $(1,239) $(62) (1,305) $1,239 (66)
NET COST OF OPERATIONS $140,832 $78,525 $219,357 $129,211 $3,726 $87 $352,381 $352,381
57
CMS PRINCIPAL STATEMENTS AND NOTES FY 2002

Administrative Expenses(Dollars in millions)
FY 2002 Medicare All ConsolidatedHI SMI Total Medicaid SCHIP Others Total
Administrative Expenses by Agency
Treasury $40 $40 $40
CMS 654 $1,398 2,052 $176 $6 $1 2,235
Peer Review 244 71 315 315Organizations
TOTAL ADMINISTRATIVEEXPENSES $938 $1,469 $2,407 $176 $6 $1 $2,590
Administrative Expenses(Dollars in millions)
FY 2001 Medicare ConsolidatedHI SMI Total Medicaid SCHIP Total
Administrative Expenses by Agency
Treasury $40 $40 $40
CMS 617 $1,183 1,800 $200 $1 2,001
Peer Review 274 55 329 329Organizations
TOTAL ADMINISTRATIVEEXPENSES $931 $1,238 $2,169 $200 $1 $2,370
58
CMS PRINCIPAL STATEMENTS AND NOTES FY 2002
For purposes of financial statement presentation,non-CMS administrative costs are consideredexpenses to the Medicare trust funds when out-layed by Treasury even though some funds mayhave been used to pay for assets such asproperty and equipment. In this regard, the SSAreported $70.7 million of Property andEquipment, Net attributable to the Medicareprogram as of September 30, 2002. This amountis not included in CMS's Consolidating BalanceSheet as assets related to the Medicare program.However, funds withdrawn from the trust fundsby SSA during FY 2002 to pay for this activityare reported as Transfers-out in the Statement ofChanges in Net Position. The SSA administrativecosts are reported to CMS by Treasury. These
expenses are also reported by SSA on theirFY 2002 Annual Financial Statement. The CMSadministrative costs have been allocated to theMedicare, Medicaid, SCHIP and TWI programsbased on the CMS cost allocation system.Administrative costs allocated to the Medicareprogram include $1.1 billion paid to Medicarecontractors to carry out their responsibilities asCMS's agents in the administration of theMedicare program.
The chart below details the AdministrativeExpenses by agency. The CMS is only one ofseveral agencies that charge some administrativeexpenses to Medicare.

NOTE 12:PRIOR PERIOD ADJUSTMENTS (Dollars in Millions)
FY 2002 Medicare All ConsolidatedHI SMI Medicaid SCHIP Others Total
Cumulative Results of OperationsChange in Accounting Principle $(212) $9 $53 $2 $38 $(110)
TOTAL PRIOR PERIOD ADJUSTMENTS $(212) $9 $53 $2 $38 $(110)
Medicare All ConsolidatedHI SMI Medicaid SCHIP Others Total
Unexpended AppropriationsChange in Accounting Principle $110 $110
TOTAL PRIOR PERIOD ADJUSTMENTS $110 $110
NOTE 13:BUDGETARY FINANCING SOURCES: OTHER ADJUSTMENTS (Dollars in Millions)
FY 2002 Medicare ConsolidatedHI SMI Medicaid SCHIP Total
Unexpended Appropriations
Reversal of Accrual of FY 2001 $(2,630) $(2,630)Income Tax on OASDI
Reversal of Accrual of FY 2001 $(1,592) (1,592)Federal Matching Contributions
Net Increase in Anticipated $3,455 3,455Congressional Appropriation
Withdrawal of Appropriation (2) (760) (762)
Redistribution of SCHIP FY 1999 $(2,819) (2,819)Appropriation
TOTAL OTHER ADJUSTMENTS $(2,632) $(1,592) $2,695 $(2,819) $(4,348)
59
CMS PRINCIPAL STATEMENTS AND NOTES FY 2002
In FY 2002 CMS adopted accrual-based account-ing for the transfer of trust funds between CMSand the Bureau of Public Debt. (Previously, CMShad employed cash-based accounting,recognizing and recording trust fund transfersonly when cash was either disbursed orreceived). Under accrual accounting, CMS hasrecognized as a prior period adjustment a
transfer of $110 million from the SMI trust fundto Medicaid that occurred in FY 2002 (in theUnexpended Appropriation section above). Theamounts reported in the Cumulative Results ofOperations section reflect the allocation amongCMS programs of a prior period adjustmentrecorded in the Program Managementappropriation.

NOTE 14:TAXES AND OTHER NON-EXCHANGE REVENUE (Dollars in Millions)
FY 2002 Medicare All ConsolidatedHI SMI Medicaid SCHIP Others Total
FICA Tax Receipts $141,990 $141,990
SECA Tax Receipts 10,038 10,038
Trust Fund Investment Interest 14,194 $2,837 17,031
Criminal Fines 430 430
Civil Monetary Penalties and Damages 326 326
Administrative Fees 10 10
Other Income 1 2 3
TAXES AND OTHER NON-EXCHANGE REVENUE $166,989 $2,839 $169,828
60
CMS PRINCIPAL STATEMENTS AND NOTES FY 2002
For periods after December 31, 1993, employeesand employers are each required to contribute1.45 percent of employees' wages, and self-employed persons are required to contribute 2.90percent of net income, with no limitation, to theHI trust fund. The Social Security Act requires thetransfer of these contributions from the GeneralFund of Treasury to the HI trust fund based onthe amount of wages certified by theCommissioner of Social Security from SSA records
of wages established and maintained by SSA inaccordance with wage information reports. TheSSA uses the wage totals reported annually byemployers via the quarterly Internal RevenueService Form 941 as the basis for conductingquarterly certification of regular wages.

NOTE 15:OTHER TRANSFERS-IN/OUT (Dollars in Millions)
FY 2002
Transfers-in Without Reimbursement Medicare All Combined Intra-CMS ConsolidatedHI SMI Medicaid SCHIP Others Total Eliminations Total
Medicare Benefit Transfers $145,722 $107,322 $253,044 $(253,044)
Transfers to HCFAC 1,235 1,235 (1,235)
Federal Matching Contributions 76,726 76,726 (76,726)
Allocation to CMS Programs 692 1,481 $188 $6 $19 2,386 (2,386)
Fraud and Abuse Appropriation 101 101 (101)
Transfer-Uninsured Coverage 442 442 (442)
Prog. Mngmt. Admin. Expense (1) 202 202 (202)
Military Service Contribution 41 40 81 $81
Income Tax OASDI Benefits (2) 8,316 8,316 (8,316)
Railroad Retirement Principal 373 373 373
Medicaid Part B Premiums 2 2 (2)
Gifts and Miscellaneous 1 1 2 2
TOTAL TRANSFERS-IN $157,125 $185,570 $190 $6 $19 $342,910 $(342,454) $456
FY 2002
Transfers-out Without Reimbursement Medicare All Combined Intra-CMS ConsolidatedHI SMI Medicaid SCHIP Others Total Eliminations Total
SSA Administrative Expenses $(706) $(700) $(1,406) $(1,406)
Medicare Benefit Transfers (145,722) (107,322) (253,044) $253,044
Transfers to HCFAC (1,235) (1,235) 1,235
Federal Matching Contributions (76,726) (76,726) 76,726
Transfers to Program Management (890) (1,496) (2,386) 2,386
Fraud and Abuse Appropriation (101) (101) 101
Transfer-Uninsured Coverage (442) (442) 442
Prog. Mngmt. Admin. Expense (1) (202) (202) 202
Income Tax OASDI Benefits (2) (8,316) (8,316) 8,316
Medicaid Part B Premiums (2) (2) 2
Office of the Secretary (8) (5) (13) (13)
Payment Assessment Commission (5) (3) (8) (8)
Railroad Retirement Board (5) (5) (5)
TOTAL TRANSFERS-OUT $(157,627) $(186,259) $(343,886) $342,454 $(1,432)
TOTAL TRANSFERS-IN/OUTWITHOUT REIMBURSEMENT $(502) $(689) $190 $6 $19 $(976) $(976)
(1) During FY 2002, the Payments to the Health Care Trust Funds appropriation paid the HI trust fund$202 million to cover the Medicaid, SCHIP and TWI programs’ share of CMS’s administrative costs.
(2) The Omnibus Budget Reconciliation Act of 1993 increased the maximum percentage of Old AgeSurvivors and Disability Insurance (OASDI) benefits that are subject to Federal income taxation undercertain circumstances from 50 percent to 85 percent. The revenues, resulting from this increase, aretransferred to the HI trust fund.
61
CMS PRINCIPAL STATEMENTS AND NOTES FY 2002

NOTE 16:GROSS COST AND EXCHANGE REVENUE BYBUDGET FUNCTIONAL CLASSIFICATION (Dollars in Millions)
FY 2002 Combined Intra-CMS ConsolidatedMedicare Health Total Eliminations Total
Intragovernmental Costs $254 $25 $279 $279 With the Public 256,836 153,827 410,663 410,663 Gross Cost 257,090 153,852 410,942 410,942 Less: Exchange Revenue (25,958) (60) (26,018) (26,018)
NET COST $231,132 $153,792 $384,924 $384,924
FY 2001 Combined Intra-CMS ConsolidatedMedicare Health Total Eliminations Total
Intragovernmental Costs $306 $1,280 $1,586 $(1,239) $347 With the Public 242,801 133,045 375,846 375,846 Gross Cost 243,107 134,325 377,432 376,193 Less: Exchange Revenue (23,750) (1,301) (25,051) 1,239 (23,812)
NET COST $219,357 $133,024 $352,381 $352,381
62
CMS PRINCIPAL STATEMENTS AND NOTES FY 2002
Funds are obtained from the HI and SMI trustfunds as cash is needed to pay for ProgramManagement appropriation expenses. During FY2002, a total of $1,953 million was obtained fromthe trust funds to cover cash outlays. Of thisamount, $1,674 million was needed to pay forexpenses incurred against current year obligationsand $279 million (of which $16 million wastransferred to the CLIA program) was needed forexpenses incurred against prior year obligations.
Federal Matching Contributions SMI benefits and administrative expenses arefinanced by monthly premiums paid by Medicarebeneficiaries and are matched by the Federal
government through the general fundappropriation, Payments to the Health Care TrustFunds. Section 1844 of the Social Security Actauthorizes appropriated funds to match SMIpremiums collected, and outlines the ratio for thematch as well as the method to make the trustfunds whole if insufficient funds are available inthe appropriation to match all premiums receivedin the fiscal year. The monthly SMI premium perbeneficiary was $50.00 from October 2001through December 2001 and $54.00 from January2002 through September 2002. Premiumscollected from beneficiaries totaled $24.4 billionand were matched by a $76.7 billion contributionfrom the Federal government.

NOTE 17:STATEMENT OF BUDGETARYRESOURCES DISCLOSURES (Dollars in Millions)
FY 2002 CombinedTotals
Category ADirect $19,474Reimbursable 95
TOTAL CATEGORY A $19,569
FY 2002 CombinedTotals
Category BDirect $483,266Reimbursable 2
TOTAL CATEGORY B $483,268
FY 2002 CombinedTotals
Exempt $3,862
TOTAL OBLIGATIONS INCURRED $506,699
(in Millions)
TRUST FUND BALANCE, BEGINNING $237,589Receipts 285,416Less Obligations 256,392Less Transfers 993Excess of Receipts Over Obligations 28,031
TRUST FUND BALANCE, END $265,620
63
CMS PRINCIPAL STATEMENTS AND NOTES FY 2002
The amounts of direct and reimbursableobligations incurred against amounts apportioned
under Category A, Category B and Exempt fromApportionment are shown below:
FY 2002 Legal ArrangementsAffecting Use of Unobligated BalancesAll trust fund receipts collected in the fiscal yearare reported as new budget authority in theStatement of Budgetary Resources. The portion oftrust fund receipts collected in the fiscal year thatexceeds the amount needed to pay benefits andother valid obligations in that fiscal year isprecluded by law from being available forobligation. This excess of receipts over obliga-tions is reported as Temporarily Not Available
Pursuant to Public Law in the Statement ofBudgetary Resources and, therefore, is notclassified as budgetary resources in the fiscal yearcollected. However, all such excess receipts areassets of the trust funds and currently becomeavailable for obligation as needed. The entiretrust fund balances in the amount of $265,620million as of September 30, 2002 are included inInvestments on the Balance Sheet. The followingtable presents trust fund activities and balancesfor FY 2002:

64
CMS PRINCIPAL STATEMENTS AND NOTES FY 2002
An amendment to the State Children’s HealthInsurance Program (SCHIP) was passed onDecember 21, 2000 that allows for Medicaidexpansion of the SCHIP services paid by titleXIX (Medicaid) to be reimbursed from amountsappropriated under title XXI (SCHIP) forexpenditures incurred for FYs 1998 through
2000. This reimbursement was accomplished inFY 2001. The total Medicaid Expansion SCHIPexpenditures incurred in FYs 1998 through 2000was approximately $1.238 billion; of thisamount, $1.212 billion was reimbursed and theremaining $26 million was recorded as areceivable in FY 2001 and collected in FY 2002.
NOTE 18:REIMBURSEMENT OF TITLE XXI EXPENSES
In accordance with section 801 of the Medicare,Medicaid and SCHIP Benefits Improvement andProtection Act (BIPA) enacted on December 21,2000, redistributed SCHIP allotments for FYs1998 and 1999 were to remain available to the
States through September 30, 2002 and anyunused amounts are to be returned to Treasury.These amounts will be returned to Treasury inaccordance to the requirements of cancelingappropriations.
NOTE 19:CANCELED APPROPRIATIONS

65
Medicare, the largest health insurance program in the country, has helped fund medicalcare for the nation’s aged and disabled for almost four decades. A brief description ofthe provisions of Medicare’s Hospital Insurance (HI) and Supplementary MedicalInsurance (SMI) trust funds is included on pages 3–4 of this financial report.
The required supplementary stewardship information (RSSI) contained in this sectionis presented in accordance with the requirements of the Federal Accounting StandardsAdvisory Board (FASAB). Included are a description of the long-term sustainability andfinancial condition of the program and a discussion of trends revealed in the data.
RSSI material is generally drawn from the 2002 Annual Report of the Boards ofTrustees of the Federal Hospital Insurance and Federal Supplementary MedicalInsurance Trust Funds
1, which represents the official government evaluation of the
financial and actuarial status of the Medicare trust funds. Unless otherwise noted, alldata are for calendar years, and all projections are based on the Trustees’ intermediateset of assumptions.
Printed copies of the Trustees Report may be obtained from CMS’s Office of the Actuary(410-786-6386). The report is also available online at www.hcfa.gov/pubforms/tr/.
Please note that the 2002 Trustees Report for Medicare (issued March 26, 2002) wasused as the source document for this FY 2002 CFO Financial Report. We anticipate thatthe Government-wide financial statement report for FY 2002 (expected to be issuedMarch 31, 2003) will contain updated information from the 2003 Trustees Report (whichis expected to be issued on or near March 15, 2003). Thus, some data related to theMedicare trust funds contained in this FY 2002 CFO Financial Report may differ fromthat contained in the FY 2002 Financial Report of the United States Government.
_______________________________________1
In past years, separate annual reports were issued for the HI and SMI trust funds. Beginning in 2002, the reportshave been combined to more effectively convey the financial outlook for the Medicare program as a whole.
RequiredSupplementaryStewardshipInformation
RequiredSupplementary StewardshipInformation

ACTUARIAL PROJECTIONS
Cashflow in Nominal Dollars
Using nominal dollars2for short-term projections paints a reasonably clear picture of expected
performance with particular attention on cashflow and trust fund balances. Over longerperiods, however, the changing value of the dollar can complicate efforts to compare dollaramounts in different periods and can create severe barriers to interpretation, since projectionsmust be linked to something that the mind can comprehend in today’s experience.
For this reason, long-range (75-year) Medicare projections in nominal dollars are seldomused and are not presented here. Instead, nominal-dollar estimates for the HI trust fund aredisplayed only through the projected date of depletion, currently the year 2030. Estimates forSMI are presented only for the next 10 years, primarily due to the fact that under presentlaw, the SMI trust fund is automatically in financial balance every year.
HIChart 1 shows the actuarial estimates of HI income, expenditures, and assets for each of thenext 30 years, in nominal dollars. Income includes payroll taxes, income from the taxation ofSocial Security benefits, interest earned on the U.S. Treasury securities held by the trust fund,and other miscellaneous revenue. Expenditures include benefit payments and administrativeexpenses. The estimates are for the “open group” population—all persons who will participateduring the period as either taxpayers or beneficiaries, or both—and consist of payments from,and on behalf of, employees now in the workforce, as well as those who will enter theworkforce over the next 30 years. The estimates also include expenditures attributable to thesecurrent and future workers, in addition to current beneficiaries.
_______________________________________2
Dollar amounts that are not adjusted for inflation or other factors are referred to as “nominal.”
66
REQUIRED SUPPLEMENTARY STEWARDSHIP INFORMATION

As chart 1 shows, under the intermediate assumptions HI expenditures would begin toexceed income including interest in 2022 and income excluding interest in 2016. Thissituation is due in part to the attainment of Medicare eligibility, starting in 2011, of thoseborn during the 1946-1964 baby boom. It also arises as a result of health cost increases thatare expected to continue to grow faster than workers’ earnings. Beginning in 2022, the trustfund would start redeeming trust fund assets; in 2030, the assets would be depleted.
The projected year of depletion of the trust fund is very sensitive to assumed futureeconomic and other trends. Under less favorable conditions the cash flow could turnnegative much earlier and thereby accelerate asset exhaustion.
By law, Medicare trust fund assets are invested in special U.S. Treasury Securities,which earn interest while Treasury uses those cash resources for other Federalpurposes. During times of Federal “on-budget” surpluses, this process reduces theFederal debt held by the public. In times of Federal budget deficits, Medicare surplusesreduce the amount that must be borrowed from the public to finance those deficits. Thetrust fund assets are claims on the Treasury that, when redeemed, will have to befinanced by raising taxes, borrowing from the public, or reducing other Federalexpenditures. (When the assets are financed by borrowing, the effect is to defer today’scosts to later generations who will ultimately repay the funds being borrowed fortoday’s Medicare beneficiaries.) The existence of large trust fund balances, therefore,represents an important obligation of the Government to pay future Medicare benefitsbut does not necessarily make it easier for the Government to pay those benefits.
SMIChart 2 shows the actuarial estimates of SMI income, expenditures, and assets for each ofthe next 10 years, in nominal dollars. Whereas HI estimates are displayed through the year2030, SMI estimates cover only the next 10 years, as SMI differs fundamentally from HI inregard to the way it is financed. In particular, SMI financing is not at all based on payrolltaxes but instead on monthly premiums and income from the general fund of the U.S.Treasury—both of which are established annually to cover the following year’s expenditures.Estimates of SMI income and expenditures, therefore, are virtually the same, as illustrated inchart 2, and so are not shown in nominal dollars separately beyond 10 years.
Income includes monthly premiums paid by, or on behalf of, beneficiaries, transfersfrom the general fund of the U.S. Treasury, and interest earned on the U.S. Treasurysecurities held by the trust fund.
3Chart 2 displays only total income; it does not
represent income excluding interest. The difference between the two is not visiblegraphically since interest is not a significant source of income.4 Expenditures includebenefit payments as well as administrative expenses.
_______________________________________3
In the financial statements for CMS, Medicare income and expenditures are shown from a “trust fund perspective.” All sources of income to the trust funds are reflected, and the actuarial projections can be used to assess the financial status of each trust fund. Corresponding estimates for Medicare and other Federal social insurance programs are also shown in the annual Financial Report of the United States Government, also known as the consolidated financial statements. On a consolidated basis, the estimates are shown from a “Federal budget” perspective. In particular, certain categories of trust fund income—primarily interest payments and SMI general revenues—are excluded because they represent intragovernmental transfers, rather than revenues received from the public. Thus, the consolidated financial statements focus not on the financial status of individual trust funds, but on the overall balance between revenues and outlays for the Federal budget. Each perspective is appropriate and useful for its intended purpose.
4Interest income is generally about 4 percent of total SMI income.
67
REQUIRED SUPPLEMENTARY STEWARDSHIP INFORMATION

As chart 2 indicates, SMI income is very close to expenditures. As noted earlier, thisis due to SMI’s financing mechanism. Under present law, SMI is automatically infinancial balance every year, regardless of future economic and other conditions.
HI Cashflow as a Percent of Taxable Payroll
Each year, estimates of the financial and actuarial status of the HI trust fund areprepared for the next 75 years. Because of the difficulty in comparing dollar values fordifferent periods without some type of relative scale, income and expenditure amountsare shown relative to the earnings in covered employment that are taxable under HI(referred to as “taxable payroll”).
Chart 3 illustrates income excluding interest and expenditures as a percentage oftaxable payroll over the next 75 years. As it was in the 2001 report, the per beneficiarylong-range growth in the 2002 report is assumed to be the level of per capita grossdomestic product (GDP) growth plus 1 percentage point—reflecting an expectation thatthe impact of advances in medical technology on health care costs will continue, both inMedicare and in the health sector as a whole.
Since HI payroll tax rates are not scheduled to change in the future under presentlaw, payroll tax income as a percentage of taxable payroll will remain constant at 2.90percent. Income from taxation of benefits will increase only gradually as a greaterproportion of Social Security beneficiaries become subject to such taxation over time.Thus, as chart 3 shows, the income rate is not expected to increase significantly overcurrent levels. On the other hand, expenditures as a percentage of taxable payrollsharply escalate—in part due to health care cost increases that exceed wage growth, butalso due to the attainment of Medicare eligibility of those born during the 1946-1964baby boom.
68
REQUIRED SUPPLEMENTARY STEWARDSHIP INFORMATION

HI and SMI Cashflow as a Percent of GDP
Expressing Medicare incurred expenditures as a percentage of the GDP gives a relativemeasure of the size of the Medicare program compared to the general economy. TheGDP represents the total value of goods and services produced in the United States.This measure provides an idea of the relative financial resources that will be necessaryto pay for Medicare services.
HIChart 4 shows HI income excluding interest and expenditures over the next 75 yearsexpressed as a percentage of GDP. In 2001, the expenditures were $143.4 billion, whichwas 1.4 percent of GDP. Following slight reductions in 2003 and 2004, this percentage isprojected to increase steadily throughout the remainder of the 75-year period.
SMIAs noted earlier, because of the SMI financing mechanism in which income mirrorsexpenditures, it is not necessary to test for imbalances between income andexpenditures. Rather, it is more important to examine the projected rise in expendituresand the implications for beneficiary premiums and Federal general revenue payments.
Chart 5 shows SMI expenditures over the next 75 years expressed as a percentage ofGDP. In 2001, SMI expenditures were $101.4 billion, which was 1.0 percent of GDP.After 2005, this percentage is projected to increase steadily, reflecting growth in thevolume and intensity of services provided per beneficiary throughout the projectionperiod, together with the effects of the baby boom eligibility for retirement.
69
REQUIRED SUPPLEMENTARY STEWARDSHIP INFORMATION

In the SMI expenditure projections, as in those for HI, the per beneficiary long-rangegrowth rate is assumed to equal per capita GDP growth plus 1 percentage point. Thegrowth rates are estimated year by year for the next 12 years, reflecting the impact ofspecific statutory provisions. Expenditure growth for years 13 to 25 is assumed to gradesmoothly into the long-range assumptions.
70
REQUIRED SUPPLEMENTARY STEWARDSHIP INFORMATION

Also shown in chart 5 are SMI general revenue transfers and premium income expressedas a percentage of GDP.
5Under present law, premiums will cover roughly 25 percent of total
expenditures. As indicated, both sources of revenue would increase more rapidly than theGDP over time, to match the faster growth rates for SMI expenditures.
Worker-to-Beneficiary Ratio
HIAnother way to evaluate the long-range outlook of the HI trust fund is to examine theprojected number of workers per HI beneficiary. Chart 6 illustrates this ratio over thenext 75 years. For the most part, current benefits are paid for by current workers. Theretirement of the baby boom generation will therefore be financed by the relativelysmaller number of persons born after the baby boom. In 2001, every beneficiary hadalmost 4.0 workers to pay for his or her benefit. In 2030, however, after the last babyboomer turns 65, there will be only about 2.4 workers per beneficiary. The projectedratio continues to decline until there are just 2.0 workers per beneficiary in 2076.
ACTUARIAL PRESENT VALUESProjected future expenditures can be summarized by computing an “actuarial presentvalue.” This value represents the lump-sum amount that, if invested today in trust fund
_______________________________________5
See footnote 3 regarding the treatment of SMI general revenue income in the consolidated financial statement of the U.S. government.
71
REQUIRED SUPPLEMENTARY STEWARDSHIP INFORMATION
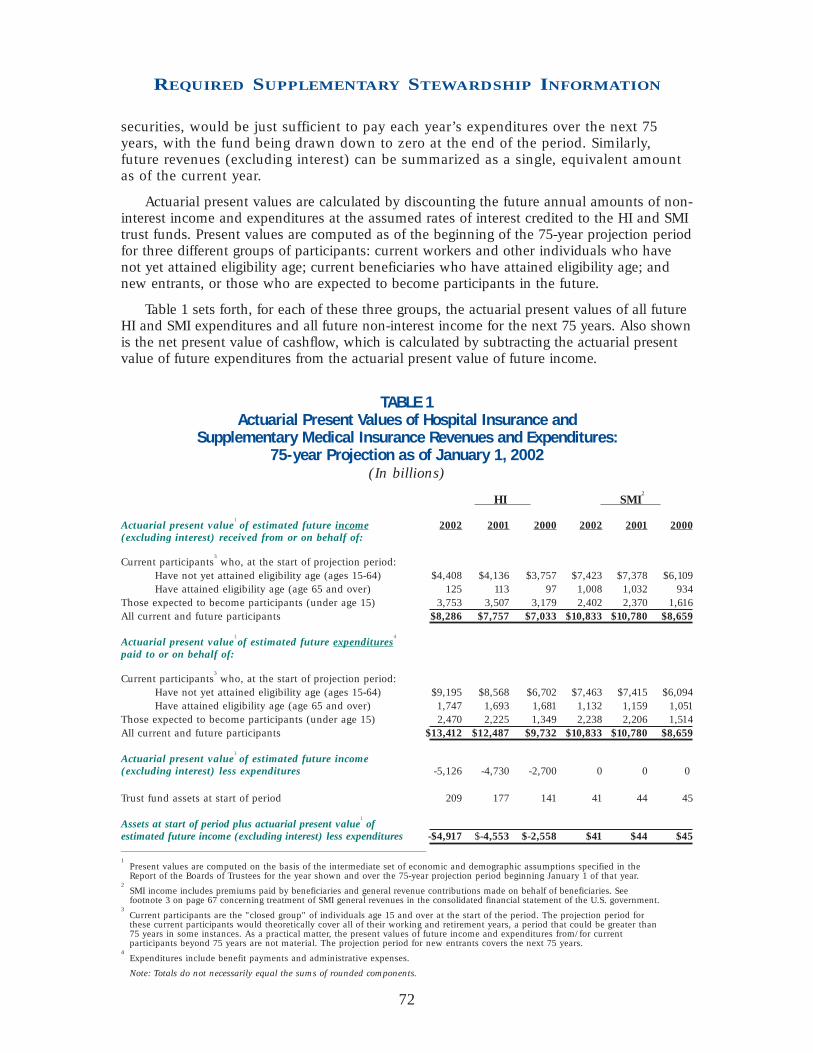
securities, would be just sufficient to pay each year’s expenditures over the next 75years, with the fund being drawn down to zero at the end of the period. Similarly,future revenues (excluding interest) can be summarized as a single, equivalent amountas of the current year.
Actuarial present values are calculated by discounting the future annual amounts of non-interest income and expenditures at the assumed rates of interest credited to the HI and SMItrust funds. Present values are computed as of the beginning of the 75-year projection periodfor three different groups of participants: current workers and other individuals who havenot yet attained eligibility age; current beneficiaries who have attained eligibility age; andnew entrants, or those who are expected to become participants in the future.
Table 1 sets forth, for each of these three groups, the actuarial present values of all futureHI and SMI expenditures and all future non-interest income for the next 75 years. Also shownis the net present value of cashflow, which is calculated by subtracting the actuarial presentvalue of future expenditures from the actuarial present value of future income.
TABLE 1 Actuarial Present Values of Hospital Insurance and
Supplementary Medical Insurance Revenues and Expenditures:75-year Projection as of January 1, 2002
(In billions)
HI SMI2
Actuarial present value1of estimated future income 2002 2001 2000 2002 2001 2000
(excluding interest) received from or on behalf of:
Current participants3who, at the start of projection period:
Have not yet attained eligibility age (ages 15-64) $4,408 $4,136 $3,757 $7,423 $7,378 $6,109Have attained eligibility age (age 65 and over) 125 113 97 1,008 1,032 934
Those expected to become participants (under age 15) 3,753 3,507 3,179 2,402 2,370 1,616All current and future participants $8,286 $7,757 $7,033 $10,833 $10,780 $8,659
Actuarial present value1of estimated future expenditures
4
paid to or on behalf of:
Current participants3who, at the start of projection period:
Have not yet attained eligibility age (ages 15-64) $9,195 $8,568 $6,702 $7,463 $7,415 $6,094Have attained eligibility age (age 65 and over) 1,747 1,693 1,681 1,132 1,159 1,051
Those expected to become participants (under age 15) 2,470 2,225 1,349 2,238 2,206 1,514All current and future participants $13,412 $12,487 $9,732 $10,833 $10,780 $8,659
Actuarial present value1of estimated future income
(excluding interest) less expenditures -5,126 -4,730 -2,700 0 0 0
Trust fund assets at start of period 209 177 141 41 44 45
Assets at start of period plus actuarial present value1of
estimated future income (excluding interest) less expenditures -$4,917 $-4,553 $-2,558 $41 $44 $45___________________________________________________1
Present values are computed on the basis of the intermediate set of economic and demographic assumptions specified in the Report of the Boards of Trustees for the year shown and over the 75-year projection period beginning January 1 of that year.
2SMI income includes premiums paid by beneficiaries and general revenue contributions made on behalf of beneficiaries. See footnote 3 on page 67 concerning treatment of SMI general revenues in the consolidated financial statement of the U.S. government.
3Current participants are the "closed group" of individuals age 15 and over at the start of the period. The projection period for these current participants would theoretically cover all of their working and retirement years, a period that could be greater than 75 years in some instances. As a practical matter, the present values of future income and expenditures from/for current participants beyond 75 years are not material. The projection period for new entrants covers the next 75 years.
4Expenditures include benefit payments and administrative expenses.
Note: Totals do not necessarily equal the sums of rounded components.
72
REQUIRED SUPPLEMENTARY STEWARDSHIP INFORMATION

As shown in table 1, the HI trust fund has an actuarial deficit of more than $4.9trillion over the 75-year projection period, as compared to more than $4.5 trillion in the2001 financial report. SMI, on the other hand, does not have similar problems because itis automatically in financial balance every year due to its financing mechanism.6
The existence of a large actuarial deficit for the HI trust fund indicates that, underreasonable assumptions as to economic, demographic, and health cost trends for thefuture, HI income is expected to fall substantially short of expenditures in the longrange. Although the deficits are not anticipated in the immediate future, as indicated bythe preceding cashflow projections, they nonetheless pose a serious financial problemfor the HI trust fund.
It is important to note that no liability has been recognized on the balance sheet forfuture payments to be made to current and future program participants beyond theexisting “incurred but not reported” Medicare claim amounts as of September 30, 2002.This is because Medicare is accounted for as a social insurance program rather than apension program. Accounting for a social insurance program recognizes the expense ofbenefits when they are actually paid, or are due to be paid, because benefit paymentsare primarily nonexchange transactions and, unlike employer-sponsored pensionbenefits for employees, are not considered deferred compensation. Accrual accountingfor a pension program, by contrast, recognizes retirement benefit expenses as they areearned so that the full actuarial present value of the worker’s expected retirementbenefits has been recognized by the time the worker retires.
ACTUARIAL ASSUMPTIONS ANDSENSITIVITY ANALYSISIn order to make projections regarding the future financial status of the HI and SMI trustfunds, various assumptions have to be made. First and foremost, the estimatespresented here are based on the assumption that the trust funds will continue underpresent law. In addition, the estimates depend on many economic and demographicassumptions, including changes in wages and the consumer price index (CPI), fertilityrates, immigration rates, and interest rates. In most cases, these assumptions vary fromyear to year during the first 5 to 30 years before reaching their ultimate values for theremainder of the 75-year projection period.
_______________________________________6
As noted in footnote 3 on page 67, the actuarial deficit is calculated from a trust fund perspective, reflecting all sources of income and expenditures to or from the HI and SMI trust funds. If, instead, a budget perspective is considered, as used in the consolidated financial statement, one would compare Medicare outlays to the public with revenues received directly from the public. On this basis, transfers to the SMI trust fund from the general fund of the Treasury would be excluded, with the result that the present value of projected SMI expenditures through 2076 would exceed the present value of projected SMI premium revenue alone by $8.1 trillion. When added to the corresponding differential for HI, the present value of expenditures for theMedicare program overall is projected to exceed receipts from the public by $13.3 trillion. This budget impact reflects both (i) the cost to the Federal budget of SMI general revenues provided under current law and (ii) the amount that HI revenues would have to be increased to enable HI benefits to be paid at their currently scheduled level—for which there is no provision in current law.
73
REQUIRED SUPPLEMENTARY STEWARDSHIP INFORMATION

Table 2 shows some of the underlying assumptions used in the projections ofMedicare spending displayed in this section. Further details on these assumptions areavailable in the OASDI and Medicare Trustees Reports for 2002. In practice, a number ofspecific assumptions are made for each of the different types of service provided by theMedicare program (for example, hospital care and physician services). These assump-tions include changes in the utilization, volume, and intensity of each type of service.The per beneficiary cost increases displayed in table 2 reflect the overall impact of thesemore detailed assumptions.
TABLE 2Medicare Assumptions
Annual percentage change in:
Per beneficiary cost3
Fertility Net Real wage Real Real Interestrate
1immigration differential
2Wages CPI GDP HI SMI rate
4
2002 2.13 900,000 1.8 3.1 1.3 0.7 3.5 4.2 3.6
2005 2.10 900,000 1.2 4.1 2.9 3.2 4.5 5.2 3.5
2010 2.07 900,000 1.0 4.1 3.0 2.2 4.4 5.5 3.0
2020 1.99 900,000 1.1 4.1 3.0 1.8 4.4 5.2 3.0
2030 1.95 900,000 1.1 4.1 3.0 1.8 5.9 5.6 3.0
2040 1.95 900,000 1.1 4.1 3.0 1.8 6.1 5.3 3.0
2050 1.95 900,000 1.1 4.1 3.0 1.7 5.2 4.9 3.0
2060 1.95 900,000 1.1 4.1 3.0 1.7 5.3 5.4 3.0
2070 1.95 900,000 1.1 4.1 3.0 1.7 5.5 5.2 3.0
2076 1.95 900,000 1.1 4.1 3.0 1.6 5.4 5.1 3.0
________________________________________________________________________
1Average number of children per woman.
2Difference between percentage increases in wages and the CPI.
3See text for nature of this assumption.
4Average rate of interest earned on new trust fund securities, above and beyond rate of inflation.
Estimates made in prior years have sometimes changed substantially because ofrevisions to the assumptions, which are due either to changed conditions or to more recentexperience. Furthermore, it is important to recognize that actual conditions are very likely todiffer from the projections presented here, since the future cannot be anticipated withcertainty. In order to illustrate the magnitude of the sensitivity of the long-range projections,six of the key assumptions were varied individually to determine the impact on the HIactuarial present values and net cashflows.
7The assumptions varied are the fertility rate, net
immigration, real-wage differential, CPI, real-interest rate, and health care cost factors.8
_______________________________________7
Sensitivity analysis is not done for the SMI program due to its financing mechanism. Any change in assump-tions would have no impact on the net cashflow, since the change would affect income and expenditures equally.
8The sensitivity of the projected HI net cash flow to variations in future mortality rates is also of interest. At this time, however, relatively little is known about the relationship between improvements in life expectancy and the associated changes in health status and per beneficiary health expenditures. As a result, it is not possible at present to prepare meaningful estimates of the HI mortality sensitivity. CMS is sponsoring a current research effort by the Rand Corporation that is expected to provide the information necessary to produce such estimates.
74
REQUIRED SUPPLEMENTARY STEWARDSHIP INFORMATION

For this analysis, the intermediate economic and demographic assumptions in the2002 Annual Report of the Boards of Trustees of the Federal Hospital Insurance andFederal Supplementary Medical Insurance Trust Funds are used as the reference point.Each selected assumption is varied individually to produce three scenarios. All presentvalues are calculated as of January 1, 2002 and are based on estimates of income andexpenditures during the 75-year projection period.
Charts 7 through 12 show the net annual HI cashflow in nominal dollars and thepresent value of this net cashflow for each assumption varied. In most instances, thecharts depicting the estimated net cashflow indicate that, after increasing in the earlyyears, net cashflow decreases steadily through 2030 under all three scenarios displayed.On the present value charts, the same pattern is evident, though the magnitudes arelower because of the discounting process used for computing present values.
Fertility Rate
Table 3 shows the net present value of cashflow during the 75-year projection period underthree alternative ultimate fertility rate assumptions: 1.7, 1.95, and 2.2 children per woman.
TABLE 3Present Value of Estimated HI Income Less Expenditures
under Various Fertility Rate Assumptions
Ultimate fertility rate1
1.7 1.95 2.2
Income minus expenditures -$5,266 -$5,126 -$4,989(in billions)___________________________________1The total fertility rate for any year is the average number of children who would be born to a woman in her lifetime if she were to experience the birth rates by age observed in, orassumed for, the selected year, and if she were to survive the entire childbearing period.
Table 3 demonstrates that if the assumed ultimate fertility rate is decreased from1.95 to 1.7, the projected deficit of income over expenditures increases from $5,126billion to $5,266 billion. On the other hand, if the ultimate fertility rate is increased from1.95 to 2.2 children per woman, the deficit decreases to $4,989 billion.
Charts 7 and 7A show projections of the net cashflow under the three alternativefertility rate assumptions presented in table 3.
75
REQUIRED SUPPLEMENTARY STEWARDSHIP INFORMATION

As charts 7 and 7A indicate, the fertility rate assumption has only a negligibleimpact on projected HI cashflows over the next 30 years. This is because higher fertilityin the first year does not affect the labor force until roughly 20 years have passed(increasing HI payroll taxes slightly) and has virtually no impact on the number ofbeneficiaries within this period. Over the full 75-year period, the changes are somewhatgreater, as illustrated by the present values in table 3.
76
REQUIRED SUPPLEMENTARY STEWARDSHIP INFORMATION

Net Immigration
Table 4 shows the net present value of cashflow during the 75-year projection periodunder three alternative net immigration assumptions: 655,000 persons, 900,000 persons,and 1,210,000 persons per year.
TABLE 4Present Value of Estimated HI Income Less Expenditures
under Various Net Immigration Assumptions
Ultimate net immigration 655,000 900,000 1,210,000Income minus expenditures -$5,094 -$5,126 -$5,156(in billions)
Table 4 demonstrates that if the ultimate net immigration assumption is decreasedfrom 900,000 to 655,000 persons, the deficit of income over expenditures decreases from$5,126 billion to $5,094 billion. On the other hand, if the ultimate net immigrationassumption is increased from 900,000 to 1,210,000 persons, the deficit increases to$5,156 billion.
Charts 8 and 8A show projections of the net cashflow under the three alternative netimmigration assumptions presented in table 4.
As charts 8 and 8A indicate, this assumption has an impact on projected HIcashflow starting almost immediately. Because immigration tends to occur amongyounger individuals, the number of covered workers is affected immediately, while the
77
REQUIRED SUPPLEMENTARY STEWARDSHIP INFORMATION

number of beneficiaries is affected much less quickly. Nonetheless, variations in netimmigration result in fairly small differences in cashflow.
Real-Wage Differential
Table 5 shows the net present value of cashflow during the 75-year projection periodunder three alternative ultimate real-wage differential assumptions: 0.6, 1.1, and 1.6percentage points. In each case, the CPI is assumed to be 3.0 percent, yielding ultimatepercentage increases in average annual wages in covered employment of 3.6, 4.1, and4.6 percent, respectively.
TABLE 5Present Value of Estimated HI Income Less Expenditures
under Various Real-Wage Assumptions
Ultimate percentage increase in wages - CPI 3.6 - 3.0 4.1 - 3.0 4.6 - 3.0
Ultimate percentage increase in 0.6 1.1 1.6real-wage differential
Income minus expenditures (in billions) -$5,361 -$5,126 -$4,812
Table 5 demonstrates that if the ultimate real-wage differential assumption isdecreased from 1.1 percentage points to 0.6 percentage point, the deficit of income overexpenditures increases from $5,126 billion to $5,361 billion. On the other hand, if theultimate real-wage differential assumption is increased from 1.1 percentage points to 1.6percentage points, the deficit decreases to $4,812 billion.
Charts 9 and 9A show projections of the net cashflow under the three alternativereal-wage differential assumptions presented in table 5.
78
REQUIRED SUPPLEMENTARY STEWARDSHIP INFORMATION

As charts 9 and 9A indicate, this assumption has a fairly large impact on projectedHI cashflow very early in the projection period. Higher real-wage differentialassumptions immediately increase both HI expenditures for health care and wages forall workers. Though there is a full effect on wages and payroll taxes, the effect onbenefits is only partial, since not all health care costs are wage-related.
79
REQUIRED SUPPLEMENTARY STEWARDSHIP INFORMATION

Consumer Price Index
Table 6 shows the net present value of cashflow during the 75-year projection periodunder three alternative ultimate CPI rate-of-increase assumptions: 2.0, 3.0, and 4.0percent. In each case, the ultimate real-wage differential is assumed to be 1.1 percent,yielding ultimate percentage increases in average annual wages in covered employmentof 3.1, 4.1, and 5.1 percent, respectively.
TABLE 6Present Value of Estimated HI Income Less Expenditures
under Various CPI-Increase Assumptions
Ultimate percentage increase in wages - CPI 3.1 - 2.0 4.1 - 3.0 5.1 - 4.0
Income minus expenditures (in billions) -$5,149 -$5,126 -$5,148
Table 6 demonstrates that if the ultimate CPI increase assumption is decreased from3.0 percent to 2.0 percent, the deficit of income over expenditures increases from $5,126billion to $5,149 billion. Furthermore, if the ultimate CPI increase assumption isincreased from 3.0 percent to 4.0 percent, the deficit increases to $5,148 billion.
Charts 10 and 10A show projections of the net cashflow under the three alternativeCPI rate-of-increase assumptions presented in table 6.
As charts 10 and 10A indicate, this assumption has a large impact on projected HIcashflow in nominal dollars but only a negligible impact when the cashflow is expressedas present values. The relative insensitivity of the projected present values of HI cash-
80
REQUIRED SUPPLEMENTARY STEWARDSHIP INFORMATION

flow to different levels of general inflation occurs because inflation tends to affect bothincome and costs equally. In nominal dollars, however, a given deficit “looks bigger”under high-inflation conditions but is not significantly different when it is expressed asa present value or relative to taxable payroll. This sensitivity test serves as a usefulexample of the limitations of nominal-dollar projections over long periods.
Real-Interest Rate
Table 7 shows the net present value of cashflow during the 75-year projection periodunder three alternative ultimate real-interest assumptions: 2.2, 3.0, and 3.7 percent. Ineach case, the ultimate annual increase in the CPI is assumed to be 3.0 percent,resulting in ultimate annual yields of 5.2, 6.0, and 6.7 percent, respectively.
TABLE 7Present Value of Estimated HI Income Less Expenditures
under Various Real-Interest Assumptions
Ultimate real-interest rate 2.2 % 3.0 % 3.7 %Income minus expenditures -$7,892 -$5,126 -$3,812(in billions)
Table 7 demonstrates that if the ultimate real-interest rate percentage is decreased from3.0 percent to 2.2 percent, the deficit of income over expenditures increases from $5,126billion to $7,892 billion. On the other hand, if the ultimate real-interest rate assumption isincreased from 3.0 percent to 3.7 percent, the deficit decreases to $3,812 billion.
Charts 11 and 11A show projections of the net cashflow under the three alternativereal-interest assumptions presented in table 7.
81
REQUIRED SUPPLEMENTARY STEWARDSHIP INFORMATION

As shown in charts 11 and 11A, the present values of the net cashflow are moresensitive to the interest assumption than is the nominal net cashflow. This is not anindication of the actual role that interest plays in HI financing. In actuality, interestfinances very little of the cost of the HI trust fund because, under the intermediateassumptions, the fund is projected to be relatively low and exhausted by 2030. Theseresults illustrate the substantial sensitivity of present value measures to different interestrate assumptions. With higher assumed interest, the very large deficits in the moredistant future are discounted more heavily (that is, are given less weight), and the overallnet present value is smaller.
82
REQUIRED SUPPLEMENTARY STEWARDSHIP INFORMATION
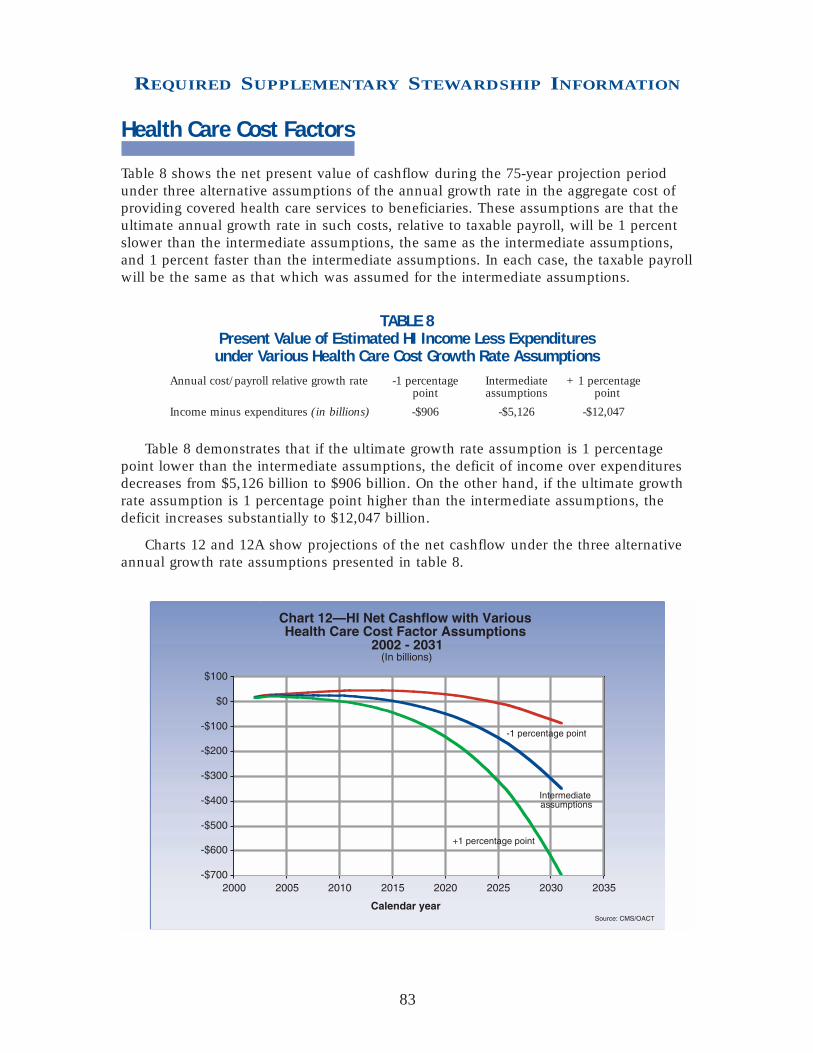
830
Health Care Cost Factors
Table 8 shows the net present value of cashflow during the 75-year projection periodunder three alternative assumptions of the annual growth rate in the aggregate cost ofproviding covered health care services to beneficiaries. These assumptions are that theultimate annual growth rate in such costs, relative to taxable payroll, will be 1 percentslower than the intermediate assumptions, the same as the intermediate assumptions,and 1 percent faster than the intermediate assumptions. In each case, the taxable payrollwill be the same as that which was assumed for the intermediate assumptions.
TABLE 8Present Value of Estimated HI Income Less Expenditures
under Various Health Care Cost Growth Rate AssumptionsAnnual cost/payroll relative growth rate -1 percentage Intermediate +1 percentage
point assumptions point
Income minus expenditures (in billions) -$906 -$5,126 -$12,047
Table 8 demonstrates that if the ultimate growth rate assumption is 1 percentagepoint lower than the intermediate assumptions, the deficit of income over expendituresdecreases from $5,126 billion to $906 billion. On the other hand, if the ultimate growthrate assumption is 1 percentage point higher than the intermediate assumptions, thedeficit increases substantially to $12,047 billion.
Charts 12 and 12A show projections of the net cashflow under the three alternativeannual growth rate assumptions presented in table 8.
REQUIRED SUPPLEMENTARY STEWARDSHIP INFORMATION

This assumption has a dramatic impact on projected HI cashflow. The assumptionsanalyzed thus far have affected HI income and costs simultaneously. However, severalfactors, such as the utilization of services by beneficiaries or the relative complexity ofservices provided, can affect costs without affecting tax income. As charts 12 and 12Aindicate, the financial status of the HI trust fund is extremely sensitive to the relativegrowth rates for health care service costs versus taxable payroll.
TRUST FUND FINANCES ANDSUSTAINABILITY
HI
The HI trust fund is substantially out of financial balance in the long range. Under theMedicare Trustees’ intermediate assumptions, income is projected to continue tomoderately exceed expenditures for the next 20 years but to fall short by steadilyincreasing amounts in 2022 and later. These shortfalls can be met by redeeming trustfund assets, but only until 2030.
To bring the HI trust fund into actuarial balance over the next 75 years under theintermediate assumptions, either outlays would have to be reduced by 38 percent orincome increased by 60 percent (or some combination of the two) throughout the75-year period. These substantial changes in income and/or outlays are needed in partas a result of the impending retirement of the baby boom generation.
84
REQUIRED SUPPLEMENTARY STEWARDSHIP INFORMATION

The projections presented here indicate that without additional legislation, the fundwould be exhausted in the future—initially producing payment delays, but very quicklyleading to a curtailment of health care services to beneficiaries.
SMI
The financing established for the SMI trust fund for calendar year 2002 is estimated tobe sufficient to cover expenditures for that year and to preserve an adequate contin-gency reserve in the fund. Moreover, for all future years, trust fund income is projectedto equal expenditures—but only because beneficiary premiums and government generalrevenue contributions are set to meet expected costs each year.
The SMI trust fund’s automatic financing provisions prevent crises such as thosefaced in recent years by the HI trust fund, the assets of which were projected to beexhausted in the near future. As a result, there has been substantially less attentiondirected toward the financial status of the SMI trust fund than to the HI trust fund—even though SMI expenditures have increased faster than HI expenditures in most yearsand are expected to continue to do so for a number of years in the future.
SMI costs have generally grown faster than the GDP, and this trend is expected tocontinue under present law. The projected increases are initially attributable in part toassumed continuing growth in the volume and intensity of services provided per benefi-ciary. Starting in 2011, the attainment of Medicare eligibility of the post-World War IIbaby boom generation will also have a major influence on the growth in SMI costs.This growth in SMI expenditures relative to GDP is a matter of great concern.
Medicare Overall
The projections shown in this section continue to demonstrate the need for theAdministration and the Congress to address the financial challenges facing Medicare—both the remaining financial imbalance facing the HI trust fund and the continuingproblem of rapid growth in SMI expenditures. In their 2002 annual report to Congress,the Medicare Boards of Trustees emphasize the seriousness of these concerns and urgethe nation’s policy makers to take “effective and decisive action…to build upon thestrong steps taken in recent reforms.” They also state: “Consideration of further reformsshould occur in the relatively near future.”
85
REQUIRED SUPPLEMENTARY STEWARDSHIP INFORMATION

CONSOLIDATING BALANCE SHEETAs of September 30, 2002
(in millions)
MEDICARE HEALTH Combined Intra-CMS ConsolidatedHI SMI Total Medicaid SCHIP All Others Totals Eliminations Totals
ASSETSIntragovernmental Assets:
Fund Balance with Treasury $162 $2,763 $2,925 $5,040 $10,933 $284 $19,182 $19,182 Trust Fund Investments 232,503 39,430 271,933 271,933 271,933 Accounts Receivable, Net 1,419 950 2,369 87 3 41 2,500 $(1,866) 634
Other Assets:Anticipated Congressional Appropriation 10,399 10,399 10,399
Total Intragovernmental Assets 234,084 43,143 277,227 15,526 10,936 325 304,014 (1,866) 302,148
Cash & Other Monetary Assets 77 298 375 375 375Accounts Receivable, Net 1,703 966 2,669 891 52 3,612 3,612General Property, Plant& Equipment, Net 2 7 9 9 9Other 13 30 43 4 7 54 54
TOTAL ASSETS $235,879 $44,444 $280,323 $16,421 $10,936 $384 $308,064 $(1,866) $306,198
LIABILITIESIntragovernmental Liabilities:
Accounts Payable $1,037 $1,053 $2,090 $2,090 $(1,866) $224Accrued Payroll and Benefits 1 3 4 $1 5 5Other Intragovernmental Liabilities 77 165 242 $2 68 312 312
Total Intragovernmental Liabilities 1,115 1,221 2,336 2 69 2,407 (1,866) 541
Federal Employee & Veterans’ Benefits 3 7 10 10 10 Entitlement Benefits Due & Payable 14,106 14,130 28,236 16,340 44,576 44,576 Accrued Payroll & Benefits 19 34 53 3 56 56 Other Liabilities 48 153 201 11 212 212
TOTAL LIABILITIES 15,291 15,545 30,836 16,345 80 47,261 (1,866) 45,395
NET POSITION Unexpended Appropriations 3 3,014 3,017 $10,934 145 14,096 14,096Cumulative Results of Operations 220,585 25,885 246,470 76 2 159 246,707 246,707
TOTAL NET POSITION $220,588 $28,899 $249,487 $76 $10,936 $304 $260,803 $260,803
TOTAL LIABILITIES & NET POSITION $235,879 $44,444 $280,323 $16,421 $10,936 $384 $308,064 $(1,866) $306,198
86
REQUIRED SUPPLEMENTARY STEWARDSHIP INFORMATIONRequiredSupplementaryInformation
RequiredSupplementary Information

CONSOLIDATING STATEMENT OF NET COSTFor the Year Ended September 30, 2002
(in millions)MEDICARE HEALTH Combined Intra-CMS Consolidated
HI SMI Total Medicaid SCHIP All Others Totals Eliminations TotalsNET PROGRAM/ACTIVITY COSTS
GPRA ProgramsMedicare (includes estimated improper $146,597 $84,535 $231,132 $231,132 $231,132payments of $8.2-$18.4 billion)Medicaid $150,101 150,101 150,101 SCHIP $3,662 3,662 3,662
NET COST—GPRA PROGRAMS 146,597 84,535 231,132 150,101 3,662 384,895 384,895
Other ActivitiesCLIA $19 19 19Ticket to Work Incentive 9 9 9Other 1 1 1
NET COST—OTHER ACTIVITIES 29 29 29
NET COST OF OPERATIONS $146,597 $84,535 $231,132 $150,101 $3,662 $29 $384,924 $384,924
CONSOLIDATING STATEMENT OF CHANGES IN NET POSITIONFor the Year Ended September 30, 2002
(in millions)
MEDICARE ______ HEALTH ______ ConsolidatedHI SMI Total Medicaid SCHIP All Others Totals
CUMULATIVE RESULTS OF OPERATIONSBeginning Balances $191,837 $31,516 $223,353 $16 $123 $223,492Prior Period Adjustment (212) 9 (203) 53 $2 38 (110)
Beginning Balances, as Adjusted 191,625 31,525 223,150 69 2 161 223,382
Budgetary Financing Sources:Appropriations ReceivedAppropriations Transferred-in/outOther AdjustmentsAppropriations Used 9,062 76,726 85,788 149,916 3,656 8 239,368Nonexchange Revenue 166,989 2,839 169,828 169,828 Transfers-in/out
Without Reimbursement (502) (689) (1,191) 190 6 19 (976)Other Budgetary Financing Sources
Other Financing Sources:Imputed Financing from Costs
Absorbed by Others 8 19 27 2 29
TOTAL FINANCING SOURCES 175,557 78,895 254,452 150,108 3,662 27 408,249
NET COST OF OPERATIONS 146,597 84,535 231,132 150,101 3,662 29 384,924
ENDING BALANCES $220,585 $25,885 $246,470 $76 $2 $159 $246,707
UNEXPENDED APPROPRIATIONSBeginning Balances $3 $3 $11,475 $86 $11,564Prior Period Adjustment $110 110
Beginning Balances, as Adjusted 3 3 110 11,475 86 11,674
Budgetary Financing Sources:Appropriations Received 11,694 81,332 93,026 148,101 5,994 67 247,188Appropriations Transferred-in/out (990) (60) (1,050)Other Adjustments (2,632) (1,592) (4,224) 2,695 (2,819) (4,348)Appropriations Used (9,062) (76,726) (85,788) (149,916) (3,656) (8) (239,368)
TOTAL FINANCING SOURCES 3,014 3,014 (110) (541) 59 2,422NET COST OF OPERATIONSENDING BALANCES $3 $3,014 $3,017 $10,934 $145 $14,096
87
REQUIRED SUPPLEMENTARY INFORMATION

COMBINING STATEMENT OF BUDGETARY RESOURCESFor the Year Ended September 30, 2002
(in millions)Payments to Program Ticket HMO Combined
HI SMI HCFAC Trust Funds Mgmt. Medicaid SCHIP to Work Loan Totals
Budgetary Resources:Budget Authority:
Appropriations received $179,737 $105,679 $93,026 $148,101 $5,994 $67 $532,604Net transfers (993) $993 (990) (60) (1,050)
Unobligated Balance:Beginning of period 42 3 $194 110 40 $11 400
Spending authority fromoffsetting collections:
Earned:Collected 7 60 26 93Receivable from Federal sources (26) (26)
Change in unfilledcustomer orders:
Advance received 5 5Transfers from trust funds 2,386 2 2,388
SUBTOTAL 178,744 105,679 1,042 93,029 2,645 147,223 5,934 107 11 534,414
Recoveries of prioryear obligations 16 182 4,198 2,858 2 7,256Temporarily notavailable pursuant toPublic Law (31,543) 3,512 (28,031)Permanently notavailable (3) (760) (2,819) (3,582)
TOTAL BUDGETARY RESOURCES $147,201 $109,191 $1,058 $93,026 $2,827 $150,661 $5,973 $109 $11 $510,057
Status of Budgetary Resources:
Obligations Incurred:Direct $147,201 $109,191 $1,011 $90,009 $2,529 $150,661 $5,973 $27 $506,602Reimbursable 3 94 97
SUBTOTAL 147,201 109,191 1,014 90,009 2,623 150,661 5,973 27 506,699
Unobligated Balance:Apportioned 7 3,017 46 81 3,151
Unobligated Balancenot available 37 158 1 11 207
TOTAL STATUS OFBUDGETARY RESOURCES $147,201 $109,191 $1,058 $93,026 $2,827 $150,661 $5,973 $109 $11 $510,057
Relationship of Obligations to Outlays:
Obligated Balance, net,beginning of period $818 $556 $185 $175 $5,332 $11,501 $20 $18,587
Obligated Balance, net,end of period:
Accounts receivable (1,144) (1,144)Undelivered orders 392 129 206 857 10,934 34 12,552Accounts payable 576 793 7 68 5,049 6,493
Outlays:Disbursements 147,051 108,825 969 $90,009 2,403 146,882 3,682 11 499,832Collections (6) (2,019) (138) (2,163)
SUBTOTAL 147,051 108,825 963 90,009 384 146,744 3,682 11 497,669
LESS: OFFSETTING RECEIPTS 1,524 24,427 25,951
NET OUTLAYS $145,527 $84,398 $963 $90,009 $384 $146,744 $3,682 $11 $471,718
88
REQUIRED SUPPLEMENTARY INFORMATION

GROSS COST AND EXCHANGE REVENUEFor the Year Ended September 30, 2002
(in millions)
PROGRAM/ACTIVITY INTRAGOVERNMENTAL WITH THE PUBLIC ConsolidatedGross Cost Less: Exchange Revenue Gross Less:Exchange Net Cost of
Combined Eliminations Consolidated Combined Eliminations Consolidated Cost Revenue OperationsNET PROGRAM/ACTIVITY COSTS
GPRA ProgramsMedicare
HI $153 $153 $147,975 $1,531 $146,597SMI 101 101 108,861 24,427 84,535
Medicaid 14 14 150,087 150,101SCHIP 1 1 3,661 3,662
SUBTOTAL 269 269 410,584 25,958 384,895Other Activities
CLIA 10 10 68 59 19Ticket to Work Incentive 9 9 Other $1 $1 2 1
SUBTOTAL 10 10 1 1 79 59 29
PROGRAM/ACTIVITY TOTALS $279 $279 $1 $1 $410,663 $26,017 $384,924
CONSOLIDATED INTRAGOVERNMENTAL BALANCESFor the Year Ended September 30, 2002
(in millions)
*TFM Fund Bal.Dept. with AccountsCode Treasury Investments Receivable Other
INTRAGOVERNMENTAL ASSETSAgency
Department of the Treasury 20 $19,182 $271,933 $10,399 Department of Defense 17, 21 $123
57, 97 All Other Federal Agencies 511
$19,182 $271,933 $634 $10,399
*TFM Environmental AccruedDept. Accounts & Disposal PayrollCode Payable Costs & Benefits Other
INTRAGOVERNMENTAL LIABILITIESAgency
Department of Justice 15 $1Department of Labor 16 $2 Department of the Treasury 20 269Office of Personnel Management 24 3Social Security Administration 28 $224 General Services Administration 47 11Department of Health and Human Services 75 3All Other Federal Agencies 28
$224 $5 $312
*TFM Non-exchange RevenueDept. Earned Gross Transfers-in Transfers-outCode Revenue Cost
INTRAGOVERNMENTAL REVENUES & EXPENSESAgency
Department of Commerce 13 $1 Department of Justice 15 101 Department of Labor 16 2 Department of the Treasury 20 1 Department of Defense 17, 21 (29) $81
57, 97 Office of Personnel Management 24 76 Social Security Administration 28 2 $(1,405)General Services Administration 47 45 Railroad Retirement Board 60 373 (5)Department of Transportation 69 Department of Health and Human Services 75 $1 46 (14)All Other Federal Agencies 36 (8)
$1 $279 $456 $(1,432)
* Treasury Financial Manual
89
REQUIRED SUPPLEMENTARY INFORMATION

90
Audit Opinion and Management Response
Audit Opinion and Management Response
Department of Health and Human Services
CENTERS FOR MEDICARE & MEDICAID
SERVICES

sw'rcrs
:'+$$ f DEPARTMENT OF HEALTH & HUMAN SERVICES Office of Inspector General I 0 G
Washington, D.C. 20201 '*+a,.
TO:
JAN 2 2 2003
Thomas Scully Administrator Centers for Medicare and Medicaid Services
FROM: Janet Rehnquist Inspector General
SUBJECT: Report on the Financial Statement Audit of the Centers for Medicare and Medicaid Services for Fiscal Year 2002 (A-1 7-02-02002)
The attached final report presents the results of the audit of the fiscal year (FY) 2002 financial statements of the Centers for Medicare and Medicaid Services (CMS). We contracted with Ernst & Young LLP (E&Y), an independent certified public accounting firm, to perform the CMS audit, which supports the departmentwide audit by the Office of Inspector General (OIG) in accordance with the Government Management Reform Act of 1994.
The audit objectives were to determine whether (1) the CMS consolidated balance sheets as of September 30,2002 and 2001, and the related consolidated statements of net costs for the FYs then ended, as well as the consolidated statement of changes in net position, consolidated statement of financing, and combined statement of budgetary resources for the FY ended September 30,2002, were fairly presented in all material respects; (2) CMS internal controls provided reasonable assurance that transactions were properly recorded and accounted for to permit the preparation of reliable financial statements; and (3) CMS complied with laws and regulations that could have a direct and material effect on the financial statements.
We evaluated the nature, timing, and extent of the work, monitored progress throughout the audit, reviewed E&Y's documentation, met with partners and staff members, evaluated the key judgments, met with officials of CMS, performed independent tests of the accounting records, and performed other procedures we deemed appropriate in the circumstances. We conducted our work in accordance with auditing standards generally accepted in the United States.
We concur with E&Y's report, which indicated that:
91

Page 2 - Thomas Scully
The financial statements referred to above present fairly, in all material respects, the financial position of CMS as of September 30,2002 and 2001, and its net costs for the years then ended, as well as the changes in net position, budgetary resources, and reconciliation of net costs to budgetary obligations for FY 2002 in conformity with accounting principles generally accepted in the United States;
Certain matters involving internal controls over financial reporting were considered to be reportable, two of which were deemed to be material weaknesses under standards issued by the American Institute of Certified Public Accountants.
The CMS financial management systems, in some instances, did not substantially comply with certain requirements referred to in the Federal Financial Management Improvement Act of 1996.
The CMS is commended for sustaining the unqualified audit opinion first issued on the FY 1999 financial statements. While substantial progress has been made in providing reliable financial information, CMS continues to be impaired by the absence of a fully integrated financial management system to accumulate, analyze, and report financial information in a timely manner. As discussed in the auditor’s report on internal controls, material weaknesses continue in financial systems, analyses, and oversight and in Medicare electronic data processing (EDP) controls.
Financial Systems, Analyses, and Oversight (Partial Repeat Condition). As reported in FY 2001 and continuing in FY 2002, the Medicare contractors’ claim processing systems did not have general ledger capabilities, and limited system interfaces were available to process and prepare data for CMS. The contractors’ lack of integrated, double- entry systems and use of ad hoc supporting schedules increased the risk that their reported information could be inconsistent, incomplete, or inaccurate. Also, independent verification controls needed further enhancements to provide assurance that amounts reported by contractors to CMS were valid, accurately summarized, and sufficiently documented. In addition, accounts receivable control deficiencies continued at the contractors.
During FY 2002, we noted much improvement in the central and regional offices’ financial analysis and oversight of the contractors’ financial management practices. However, certain processes still needed strengthening to provide reasonable assurance of detecting and correcting material errors in a timely manner. The CMS should continue to enhance its oversight of information included in the financial statements, and the regional offices should perform certain procedures to ensure that the contractors’ financial data are reliable, accurate, and complete.
92
Page 3 - Thomas Scully
Medicare Electronic Data Processing Controls (Repeat Condition). The CMS relies on extensive, interdependent EDP operations at both its central office and Medicare contractor sites to administer the Medicare program and to process and account for Medicare expenditures. Adequate internal controls over these operations are essential to the integrity, confidentiality, and reliability of critical data while reducing the risk of errors, fraud, and other illegal acts. In FY 2002, we continued to find numerous EDP general control weaknesses at the Medicare contractors, system maintainers, and the CMS central office. Such weaknesses increase the risk of (1) unauthorized access to and disclosure of sensitive information, (2) malicious changes that could interrupt data processing or destroy files, (3) improper Medicare payments, and (4) disruption of critical operations.
The CMS comments on the draft of this report have been incorporated where appropriate. Officials in your office have concurred with the recommendations and are in the process of taking corrective action.
Please send us your final management decision, including any action plan, as appropriate, within 60 days. If you have any questions or comments about this report, please do not hesitate to call me or David M. Long, Assistant Inspector General for Financial Management and Regional Operations, at (202) 619-1 157 or through e-mail at [email protected]. To facilitate identification, please refer to report number A- 17-02- 02002 in all correspondence.
Attachment
cc: KenyN. Weems Acting Assistant Secretary for
Budget, Technology, and Finance
George H. Strader Deputy Assistant Secretary, Finance
93

!@# Ernst & Young LLP Phone: (202) 327-6000 1225 Connecticut Avenue, N.W. Fax: (202) 327-6200 Washington, DC 20036 www.ey.com
Report of Independent Auditors
To the Inspector General of the Department of Health and Human Services, and the Administrator of the Centers for Medicare & Medicaid Services We have audited the consolidated balance sheets of the Centers for Medicare & Medicaid Services (CMS), an operating division of the Department of Health and Human Services as of September 30, 2002 and 2001, and the related consolidated statements of net costs for the fiscal years then ended and the consolidated statement of changes in net position and financing and combined statement of budgetary resources for the fiscal year ended September 30, 2002. These financial statements are the responsibility of the CMS’ management. Our responsibility is to express an opinion on these financial statements based on our audits. The Health Programs, a major subset of CMS administered programs, had total assets of $27.7 billion and $25.2 billion as of September 30, 2002 and 2001 and total net costs of $153.8 billion and $133.0 billion for the years then ended. The financial information for the Health Programs, which are included in CMS’ consolidated and combined financial statements, were audited by other auditors whose report has been furnished to us, and our opinion, insofar as it relates to the amounts included for the Health Programs, is based solely on the report of other auditors. We conducted our audits for the years ended September 30, 2002 and 2001 in accordance with auditing standards generally accepted in the United States; the standards applicable to financial audits contained in Government Auditing Standards, issued by the Comptroller General of the United States; and Office of Management and Budget (OMB) Bulletin 01-02, Audit Requirements for Federal Financial Statements. These standards and requirements require that we plan and perform the audits to obtain reasonable assurance about whether the financial statements are free of material misstatement. An audit includes examining, on a test basis, evidence supporting the amounts and disclosures in the financial statements. An audit also includes assessing the accounting principles used and significant estimates made by management, as well as evaluating the overall financial statement presentation. We believe that our audits and the report of other auditors provide a reasonable basis for our opinion. In our opinion, based on our audits and the report of other auditors, the financial statements referred to above present fairly, in all material respects, the financial position of the CMS as of September 30, 2002 and 2001, and its net costs for the years then ended, and the changes in net position, budgetary resources, and its reconciliation of net costs to budgetary obligations for the fiscal year then ended September 30, 2002, in conformity with accounting principles generally accepted in the United States.
A Member Practice of Ernst & Young Global
94

!@# Ernst & Young LLP Our audits were conducted for the purpose of expressing an opinion on the basic financial statements taken as a whole. The information presented in the Management’s Discussion and Analysis (MD&A) and the Supplemental Information is not a required part of the CMS’ financial statements, but is considered supplementary information required by OMB Bulletin 01-09, Form and Content of Agency Financial Statements. Such information has not been subjected to the auditing procedures applied by us and the other auditors in the audit of the financial statements, and accordingly, we express no opinion on it. In accordance with Government Auditing Standards, we have also issued our reports dated December 10, 2002, on our consideration of the CMS’ internal control over financial reporting and on our tests of its compliance with certain provisions of laws and regulations. Those reports are an integral part of an audit performed in accordance with Government Auditing Standards and should be read in conjunction with this report in considering the results of our audits.
December 10, 2002
95

!@# Ernst & Young LLP Phone: (202) 327-6000 1225 Connecticut Avenue, N.W. Fax: (202) 327-6200 Washington, DC 20036 www.ey.com
Report of Independent Auditors on Compliance with Laws and Regulations To the Inspector General of the Department of Health and Human Services, and the Administrator of the Centers for Medicare & Medicaid Services We have audited the financial statements of the Centers for Medicare & Medicaid Services (CMS), an operating division of the Department of Health and Human Services, as of September 30, 2002, and have issued our report thereon dated December 10, 2002. The Health Programs, a major subset of CMS administered programs, had total assets of $27.7 billion and $25.2 billion as of September 30, 2002 and 2001, and total net costs of $153.8 billion and $133.0 billion for the years then ended. The financial information for the Health Programs, which are included in CMS’ consolidated and combined financial statements, were audited by other auditors whose report has been furnished to us, and our opinion, insofar as it relates to the amounts included for the Health Programs, is based solely on the report of other auditors. We have conducted our audits in accordance with auditing standards generally accepted in the United States; the standards applicable to financial audits contained in Government Auditing Standards, issued by the Comptroller General of the United States; and Office of Management and Budget (OMB) Bulletin No. 01-02, Audit Requirements for Federal Financial Statements. The management of the CMS is responsible for complying with laws and regulations applicable to the CMS. As part of obtaining reasonable assurance about whether the CMS’ financial statements are free of material misstatement, we performed tests of its compliance with certain provisions of laws and regulations, noncompliance with which could have a direct and material effect on the determination of financial statement amounts and certain other laws and regulations specified in OMB Bulletin 01-02, including the requirements referred to in the Federal Financial Management Improvement Act of 1996 (FFMIA). We limited our tests of compliance to these provisions and we did not test compliance with all laws and regulations applicable to the CMS. The results of our tests and the tests of other auditors disclosed no instances of noncompliance with the laws and regulations discussed in the preceding paragraph exclusive of FFMIA that are required to be reported under Government Auditing Standards or OMB Bulletin 01-02. Under FFMIA, we are required to report whether the CMS’ financial management systems substantially comply with the Federal financial management systems requirements, applicable Federal accounting standards, and the United States Standard General Ledger at the transaction level. To meet this requirement, we performed tests of compliance with FFMIA section 803(a) requirements.
A Member Practice of Ernst & Young Global
96

!
December 10, 2002
@# Ernst & Young LLP
97
The results of our tests and the tests of other auditors disclosed instances in which the CMS’ financial management systems did not substantially comply with certain requirements discussed in the preceding paragraph. We have identified the following instances of noncompliance.
• CMS does not have an integrated accounting system to capture expenditures at the Medicare contractor level, and certain aspects of the existing financial reporting system does not conform to the requirements currently specified by the Joint Financial Management Improvement Program.
• Weaknesses identified in CMS’ Central Office and Medicare financial
management systems’ access and application controls are significant departures from requirements specified in OMB Circulars A-127, Financial Management Systems, and A-130, Management of Federal Information Resources.
As reported by CMS in Footnote 10 to the financial statements referenced above, certain claims submitted by providers do not comply with Medicare laws and regulations. The Report of Independent Auditors on Internal Control and our separate management letter includes information related to the financial management systems that were found not to comply with the requirements, relevant facts pertaining to the noncompliance, and our recommendations related to the specific issues presented. It is our understanding that management agrees with the facts as presented, and that relevant comments from the CMS’ management responsible for addressing the noncompliance are provided as an attachment to this report. Providing an opinion on compliance with certain provisions of laws and regulations was not an objective of our audit and, accordingly, we do not express such an opinion. This report is intended solely for the information and use of the management of CMS and the Department of Health and Human Services, OMB, and Congress, and is not intended to be and should not be used by anyone other than these specified parties.

!@# Ernst & Young LLP Phone: (202) 327-6000 1225 Connecticut Avenue, N.W. Fax: (202) 327-6200 Washington, DC 20036 www.ey.com
Report of Independent Auditors on Internal Control To the Inspector General of the Department of Health and Human Services, and the Administrator of the Centers for Medicare & Medicaid Services We have audited the financial statements of the Centers for Medicare & Medicaid Services (CMS), an operating division of the Department of Health and Human Services (HHS) as of September 30, 2002, and have issued our report thereon dated December 10, 2002. The Health Programs, a major subset of CMS administered programs, had total assets of $27.7 billion and $25.2 billion as of September 30, 2002 and 2001, and total net costs of $153.8 billion and $133.0 billion for the years then ended. The financial information for the Health Programs, which are included in CMS’ consolidated and combined financial statements, were audited by other auditors whose report has been furnished to us, and our opinion and the comments related herein, insofar as they relate to the Health Programs, are based solely on the report of other auditors. We conducted our audits in accordance with auditing standards generally accepted in the United States; the standards applicable to financial audits contained in Government Auditing Standards, issued by the Comptroller General of the United States; and Office of Management and Budget (OMB) Bulletin 01-02, Audit Requirements for Federal Financial Statements. In planning and performing our audits, we considered CMS’ internal control over financial reporting by obtaining an understanding of the agency’s internal control, determined whether internal control had been placed in operation, assessed control risk, and performed tests of controls in order to determine our auditing procedures for the purpose of expressing our opinion on the financial statements. We limited our internal control testing to those controls necessary to achieve the objectives described in OMB Bulletin 01-02. We did not test all internal control relevant to operating objectives as broadly defined by the Federal Managers Financial Integrity Act, such as those controls relevant to ensuring efficient operations. The objective of our audits was not to provide assurance on internal control. Consequently, we do not provide an opinion on internal control.
A Member Practice of Ernst & Young Global
98

!
OMB Circular A-127 requires that financial statements be the culmination of a systematic accounting process. The statements are to result from an accounting system that is an integral part of a total financial management system containing sufficient structure, effective internal control, and reliable data. The CMS relies on a decentralized organization, complex and antiquated systems and ad hoc reporting to accumulate data for financial reporting due to the lack of an integrated financial accounting system at the contractor level. During fiscal year (FY) 2002, CMS contracted with approximately 47 contractors to manage and administer the Medicare program. On a monthly basis, the contractors submit various “Contractor Financial Reports” to CMS for its management and monitoring of the Medicare activities.
@# Ernst & Young LLP
Our consideration of the internal control over financial reporting would not necessarily disclose all matters in the internal control over financial reporting that might be reportable conditions. Under standards issued by the American Institute of Certified Public Accountants, reportable conditions are matters coming to our attention relating to significant deficiencies in the design or operation of the internal control that, in our judgment, could adversely affect the CMS’ ability to record, process, summarize, and report financial data consistent with the assertions by management in the financial statements. Material weaknesses are reportable conditions in which the design or operation of one or more of the internal control components does not reduce to a relatively low level the risk that misstatements in amounts that would be material in relation to the financial statements being audited may occur and not be detected within a timely period by employees in the normal course of performing their assigned functions. Because of inherent limitations in internal control, misstatements, losses, or noncompliance may nevertheless occur and not be detected. However, we noted certain matters discussed in the following paragraphs involving the internal control and its operation that we consider to be reportable conditions. We consider both matters noted—Financial Systems, Analyses and Oversight and Medicare Electronic Data Processing (EDP) Controls—to be material weaknesses.
MATERIAL WEAKNESSES Financial Systems, Analyses and Oversight (Partial Repeat Condition) Overview
The CMS continues to work towards resolving this material weakness, noted in the FY 2001 and prior financial statement audit reports, related to the lack of an integrated financial management system and inadequate financial accounting and supervisory review processes over its more than $231 billion in Medicare expenditures for FY 2002. Management reported certain actions, including:
• Issuing the Chief Financial Officer (CFO) FY 2002 Comprehensive Plan for Financial Management and the associated project plans, which identified milestones and activities for achieving the comprehensive plan goals and initiatives.
99

! @# Ernst & Young LLP
• Completing the automated applications for preparing all five required principal financial statements and developing and implementing trending analyses procedures at the line item level for each financial statement.
• Performing Statement on Auditing Standards (SAS) 70 reviews documenting and assessing internal controls at 17 Medicare contractor sites. These reviews include assessing contractors’ progress in implementing corrective actions for prior audits. Fifteen of the contractors also received reviews of accounts receivable balances.
• Referring an additional $1.4 billion of delinquent debt to the Treasury during FY 2002 as a result of efforts of the debt referral process.
• Providing comprehensive instructions to the Medicare contractors and the CMS central office and regional offices through formal guidance and training conferences, which included promoting a uniform method of reporting and accounting for accounts receivable and related financial data. In addition, CMS central and regional office staff received training on a 1522 review protocols, which were used at six Medicare contractor locations.
• Establishing workgroups comprised of central office and regional office consortia staff to serve as subject matter experts responsible for addressing four key areas: follow up on corrective action plans (CAPs), reconciliations of funds expended to paid claims, trend analyses, and internal controls. The objectives of each workgroup are to clearly define central and regional office roles and responsibilities, as well as to develop the national strategic plans to strengthen Medicare contractor financial management oversight in these areas.
• Developing and maintaining contractor accounts receivable trend analysis procedures and using formal procedures for financial reporting analysis.
• Developing and maintaining procedures for regional office review of contractor trend analysis.
• Conducting policy review and implementing a protocol to review contractors’ annual Certification Packages for Internal Controls (CPIC) submissions.
• Finalizing Healthcare Integrated General Ledger Accounting System (HIGLAS) management plans and beginning “Conference Room Pilots” for pilot contractors.
• Beginning design and building of HIGLAS functional environment for the pilots. • Identifying additional Medicare contractor shared system changes. • Revising the Financial Management Manual for Medicare contractors and making it
available on the Internet. • Finalizing and issuing the remaining chapters of the accounting procedures manual,
which was completed in October 2002. • Creating hundreds of accounting transactions to facilitate the United States Standard
General Ledger requirements.
While progress was made in upgrading its systems, improving its policies and procedures, and implementing trending procedures of its regional office and contractor financial reports, financial management issues continue to impair CMS’ ability to accumulate, analyze, and distribute reliable financial information. Our review of the internal control at the CMS central office,
100

! @# Ernst & Young LLP
regional offices, and selected Medicare contractors disclosed weaknesses in CMS’ ability to report accurate financial information on a timely basis. These weaknesses are primarily due to the absence of certain components of a fully integrated financial management system; that such absences include full accrual accounting, a double-entry general ledger system and appropriate oversight. Currently, Medicare contractors do not utilize uniform accounting systems that record, classify, and summarize information for the preparation of financial statements. Integrated financial systems, a sufficient number of properly trained personnel, and a strong oversight function are needed to ensure periodic analyses and reconciliations are completed to detect and resolve errors and irregularities in a timely manner. Lack of Integrated Financial Management System The CMS’ financial management systems are not compliant with the Federal Financial Management Improvement Act of 1996 (FFMIA). FFMIA requires agencies to implement and maintain financial management systems that comply with Federal financial management systems requirements as defined by the Joint Financial Management Improvement Program (JFMIP). More specifically, FFMIA requires Federal agencies to have an integrated financial management system that provides effective and efficient interrelationships between software, hardware, personnel, procedures, controls, and data contained within the systems. The lack of an integrated financial management system continues to impair CMS’ and the Medicare contractors’ abilities to adequately support and analyze accounts receivable and other financial balances reported. As reported in FY 2001 and continuing in FY 2002, the Medicare contractors’ claims processing systems do not have general ledger capabilities, and there are limited system interfaces currently available and in use to process and prepare data for the CMS 750/751 reports. The CMS 750 /751 reports prepared by the contractors are the culmination of the transactions and activity that have transpired from the beginning of the fiscal year. Contractors monitor and track accounts receivable activity using claims processing systems, personal computer based software, and ad-hoc spreadsheet applications to tabulate, summarize and prepare the information presented on the CMS 750/751 reports. Because the claim processing systems utilized by the Medicare contractors lack general ledger capabilities, preparing the CMS 750/751 reports is a labor intensive exercise requiring significant manual input and reconciliations between various systems and ad-hoc spreadsheet applications. The lack of double-entry systems coupled with the increased use of ad-hoc supporting schedules are contributing factors that increase the risk that contractors may report inconsistent, incomplete, or inaccurate information. During FY 2002, CMS continued its efforts in its implementation of its HIGLAS for the contractor, regional office, and central office locations. HIGLAS is intended to be an integrated general ledger accounting system, which incorporates Medicare contractors’ financial data including claims activity into CMS’ internal accounting system. As part of this effort, CMS is also replacing its central office general ledger that accumulates all of CMS’ financial activities, both programmatic and administrative, in its general ledger. Once implemented, the new system is
101

! @# Ernst & Young LLP
expected to strengthen Medicare’s management of its accounts receivable, allow more timely and effective collection activities on outstanding debts and enhance oversight of contractor accounting systems. HIGLAS is expected to be fully operational in FY 2007. Financial Analyses and Reporting—Medicare Contractors Although our overall results identified improvements during FY 2002 in internal control processes, our review of internal control at selected Medicare contractors, coupled with the results of CMS’ accounts receivable review at 15 Medicare contractors as of March 31, 2002, disclosed a series of weaknesses that impact CMS’ ability to report accurate financial information. Because the contractors lack a formal integrated accounting system to accumulate and report financial information, the contractors are using ad-hoc reports, which are very labor intensive to develop and utilize and increase the risk of human error and material misstatement. We found that independent verification controls need further enhancements to provide assurance that amounts reported by contractors to CMS were valid, accurately summarized and sufficiently documented. Medicare Contractor Accounts Receivable At September 30, 2002, CMS reported a net Medicare accounts receivable balance of approximately $2.7 billion, comprised of gross outstanding accounts receivable of $7.0 billion and an aggregate allowance for uncollectible accounts of $4.3 billion. Of the $7.0 billion, CMS contractors are responsible for reporting and collecting the majority of these receivables ($5.1 billion or over 73% of the outstanding balance at year-end.) The majority of these receivables (referred to as Non-Medicare Secondary Payer (Non-MSP)) represent contractor overpayments to providers, beneficiaries, physicians, and suppliers. The balance of the contractor-related receivables represents payments for those claims for which there are initial indications that Medicare should be the secondary rather than the primary payer (referred to as MSP). The remaining Medicare accounts receivable activity is managed by CMS’ central and regional offices. The CMS continues to refine its processes and update its systems at the contractors; however, certain weaknesses in internal control persist. Our review of accounts receivable at eight contractors identified similar control deficiencies as compared to those reviews performed at September 30, 2001 and CMS’ review of Medicare contractor accounts receivables at March 31, 2002. For example, our review of accounts receivable activities at September 30, 2002, identified the following:
• At one contractor, a detailed subsidiary ledger could not be provided to support the aging
balances per the contractor report. • At another contractor, no aging of accounts receivable was performed.
102

! @# Ernst & Young LLP
• One contractor had $18.3 million of MSP receivables that were older than 180 days old; however, these transactions had not been identified as currently not collectible in accordance with CMS policy.
• We noted that one contractor could not provide documentation to support $1.4 million of the $3.3 million balance in MSP adjustments.
• At two contractors, we noted clerical errors were the cause of misstatements to accounts receivable. At one contractor, a clerical error caused a reclassification error between funds of $3.3 million while at the other an input error caused an overstatement of $1 million to cost settlement receivables.
• At one contractor, we noted that detailed documentation was not available to support $26 million in offsets of collections. As a result, we were unable to determine if amounts were properly offset against the respective accounts receivable.
• We noted at two contractors that cash receipts were not being recorded timely against existing receivables. At one contractor, 10 of 30 receipts selected for testing were not applied to the appropriate receivable in a timely manner—for four cases, the receipt took over four months to be applied properly.
Medicare Contractors Reconciliation of Funds Expended The reconciliation of “total funds expended” on the CMS-1522, Monthly Contractor Financial Report, is an important control that ensures amounts reported to CMS on this report by Medicare contractors are accurate, supported, complete, and properly classified. At the contractor level, “total funds expended” is the sum of all checks drawn and electronic fund transfer payments issued during the calendar month less voided checks and overpayment recoveries. This amount is then classified by component into the following categories: benefit payments, periodic interim payments, accelerated payments, net suspense payments, audit reimbursement adjustments, and interest income and expenses. The CMS uses certain information from this report to support the Medicare payment error rate and the Medicare entitlement benefits due and payable included in the financial statements. The CMS requires the monthly reconciliations to be performed using the actual paid claims tapes or related systems summary reports. If the contractors shared system can produce a claims paid tape, the Medicare contractors are required, by Program Memorandum CR 1330, to generate and retain claims paid tapes for reconciliation purposes. For FY 2002, five of the eight Medicare contractors in our sample should have generated and retained claims paid tapes. However, all five contractors experienced problems recreating the claims paid tape. Subsequently, the claims paid tape were generated for our reconciliation. The reconciliations are critical because the auditors must be able to obtain a file of paid claims that reconciles to the CMS-1522 as a requirement for selecting a statistically valid sample of claims. Moreover, the reconciliations constitute a key internal control whereby documentation should be maintained. Our review of the CMS-1522 reconciliations identified the following deficiencies at three of the eight selected Medicare contractors in FY 2002.
103

! @# Ernst & Young LLP
• At one of the contractors, the reconciliation process did not compare the funds expended amount reported on the CMS-1522. Because the reconciliation was not performed properly, the contractor did not have assurance that its total funds expended figure reported to CMS was accurate. As a result of a computer conversion problem, the contractor understated total expended funds for January 2002 by $4.3 million.
• At another contractor, we determined a difference between the paid claims tapes and the supporting financial data in the amount of $175,000, which resulted from a recent implementation of the contractor’s full claims adjustment process. The Office of Inspector General (OIG) plans a nationwide review that will follow-up on this finding, to determine if the deficiency represents a systemic problem in the contractors shared processing systems.
• At the third contractor, we found similar conditions that existed during our FY 2000 audit, particularly the errors to the amounts reported for the outstanding checks balances, other adjustments and monthly interest adjustment. Other reconciliation errors were identified as a result of financial adjustments processed when the contractor transitioned from one bank to another.
Financial Oversight and Reporting—Central and Regional Offices During FY 2002, although much improvement has been noted in the central and regional financial analysis and oversight functions of the contractors’ financial management practices, we continue to identify certain processes that should be strengthened to provide reasonable assurance that material errors would be detected and corrected in a timely manner. CMS Central Office During FY 2002, CMS continued to build upon prior efforts to improve its oversight of Medicare contractors and the regional offices. Central office’s continuing efforts for FY 2002, included:
• providing additional guidance to the contractor and regional office community, • implementing quarterly procedures related to performing or reviewing trend analysis to
validate the accuracy and completeness of financial data reported by Medicare contractors and regional offices, and
• finalizing the new financial accounting policies manual that was completed in October 2002.
The CMS’ Central Office should, however, continue to enhance its review of information included in its financial statements. We noted the following weaknesses during our review:
• Supervisory reviews were not consistently performed and documented. We noted several
computational errors that could have been identified with the appropriate level of detailed supervisory reviews.
104

! @# Ernst & Young LLP
o Within the footnotes, $238 million in managed care payments were misrepresented as fee for service payments due to miscommunication within CMS about the creation of new codes within the general ledger to track managed care demo payments separately.
o We noted differences of $28.5 billion in SMI and $3.3 billion in HI between CMS and the Treasury records whereby CMS did not close out general ledger accounts properly by recording open balances as budget authority on the statement of budgetary resources instead of appropriations temporarily not available.
o During our review of the central office spreadsheets calculating the contractor MSP accounts receivable, we noted that the non-current amounts of $2.4 million were manually input as negative amounts rather than positive amounts. As a result, accounts receivable balances were misstated by $4.8 million. Additionally, we noted the exclusion of $1.4 million of the allowance related to SMI.
• Differences were reported where (1) a $2.8 million difference was identified between claims on the payment floor amounts reported to CMS and detailed support maintained at one contractor; (2) $8.9 million of $9 million in unprocessed claims were unsupported; and (3) periodic interim payment where amounts reported by the contractor to CMS did not agree to supporting documentation maintained at the contractors.
• System Tracking of Audit and Reimbursement (STAR) data, which are CMS’ primary source for cost settlement information, are inconsistent with cost settlement information that is recorded on the CMS 1522 reports prepared by the contractors. Consequently, STAR data are adjusted to reconcile to balances included on the CMS 1522 that is considered by CMS to be more reliable. For example, for four of ten sample items selected at one contractor, the STAR data did not agree to data in the providers’ files.
• Although completed during October 2002, the formalized accounting policy and procedure manuals were not available during fiscal year 2002.
• The data match process is a process whereby CMS matches their data with data provided by the Social Security Administration and the Internal Revenue Service to identify potential accounts receivable transactions. For fiscal year 2002, CMS directed its contractors to reprioritize their activities toward debt collection rather than process MSP data match tapes. At September 30, 2001, accounts receivable related to data match was estimated at $110 million. It is reasonable to assume that additional receivables would have been generated and collected within FY 2002 from data match processes. While the impact is not material for financial statement purposes, the lack of data match activity initiated by CMS may adversely impact trust fund cash flows. The CMS has cited lack of resources as the basis for limiting the Medicare contractors’ data match activities.
CMS Regional Office Oversight duties for contractor processes and systems are shared by the central and regional offices, with the regional offices playing a critical oversight role in that they are the first point of contact for the contractors. Medicare regional offices are responsible for:
105

! @# Ernst & Young LLP
• Monitoring Medicare contractors to ensure that claims are processed in a timely manner. • Ensuring benefit payments are made as specified by law. • Assessing whether contractors have adequate controls in place to prepare financial reports
and to determine that the reports are valid, accurate, and complete. • Performing assessments to ensure corrective actions are taken to resolve prior findings. • Monitoring contractors’ compliance with systems security requirements through the
performance of on-site reviews. • Coordinating financial and system related engagements at Medicare contractors that include
negotiating and assisting in providing responses to findings. • Conducting Medicare Contractor Performance Evaluation (CPE) and quality reviews. • Reviewing budget requests, and negotiating and recommending approval of Medicare
contractor budgets with central office. • Conducting financial and internal control reviews of Medicare contractor activities. • Preparing financial reports and related analysis related to regional office activities. During FY 2002, we visited two regional offices to assess the oversight function and found certain procedures not being adequately performed to ensure financial data provided by Medicare contractors is reliable, accurate, and complete. We noted the following: • The CMS’ national strategy called for national review teams to perform audit quality review
program (AQRP) reviews of the audit activities at six of the 24 Part A contractors for a total of 35 providers compared to 25 reviews performed during FY 2001 and 125 reviews performed by outside contractors during FY 2000. The regional offices were not formally tasked with performing additional procedures to ensure appropriate coverage of the contractors.
• The CMS formed a workgroup to develop a national strategy for reviewing contractors’ 1521 and 1522 reports in an attempt to address weaknesses identified during FY 2001. The workgroup developed a 1522 reconciliation protocol designed to ensure total funds expended reported on the 1522 are supported, complete, properly classified, and reconciled to supporting documentation. The CMS performed on-site reviews at six contractors utilizing the protocol. Oversight efforts beyond the performance of the on-site reviews were inconsistent among regional offices and the central office. While one regional office performed many of the steps outlined in the review protocol on a monthly basis, the second regional office performed no procedures at all to monitor its contractors’ monthly submissions.
• Regional office priorities do not include periodic procedures to ensure the accuracy of reported accounts payable balances.
• The regional office is responsible for performing reviews of contactors’ performance in various audit and reimbursements functions reported in the STAR. Although certain tests are being performed, the regional office is currently not testing the completeness of STAR data. Central office indicated that although CMS would like to review STAR data to a greater extent, limited resources are currently focused on areas of higher risk.
106

! @# Ernst & Young LLP
• Contractors are required to input eligible MSP debts into the debt collection system for external debt collection efforts by the Program Support Center. However, the regional office has not been reviewing the system to ensure the contractors are in compliance with CMS central office directives related to the process. Currently, the process is only reviewed through the national CPE review.
• The CMS has directed contractors to submit via the CR 1280 report its recommendations of MSP debts eligible for write-off to the regional office. Upon receipt, the regional office should review the recommendation and provide its approval/decline to the contractor and the central office within a certain period of time. During FY 2002, we noted that the regional office: (1) did not have adequate internal control to ensure timely receipt or adequate documentation to support the contractor’s quarterly CR 1280 reports—eight of 60 were either not received or documentation could not be produced to support the submission from the contractors in a timely basis, (2) did not perform timely review and approval of the CR 1280—in one case noting a four month delay, and (3) had not consistently forwarded their response to the contractors’ CR1280 report to central office. The regional offices indicated that in response to our review, they were currently developing enhanced processes to ensure the timely receipt and review of the CR 1280 reports and the timely forwarding of the regional offices’ response to the contractor and central office.
• The regional office did not consistently obtain contractors’ quarterly recommendations for classifying debts as currently not collectible. During our visits to two regional offices, we noted that eight of 60 reports had not been received from the contractors in a timely basis or that documentation could not be produced to support the timely submission. The regional offices have indicated that tracking sheets for these reports have been developed and will be used to track the timely submission of contractor quarterly reports and related documentation.
The GAO’s Standards for Internal Control in the Federal Government indicates that internal control monitoring should assess the quality of performance over time and ensure that findings of audits and other reviews are promptly resolved. Without appropriate monitoring and oversight of contractor operations, deficiencies in internal control may allow material misstatements to occur without being identified in a timely manner. Recommendation We recommend that CMS continue to develop and refine its financial management systems and processes to improve its accounting, analysis, and oversight of Medicare activity. Specifically, we recommend CMS: • Establish an integrated financial management system for use by Medicare contractors and
CMS’ central and regional offices to promote consistency and reliability in recording and reporting financial information, including accounts receivable and claim activity. Additionally, CMS should continue its efforts to promote uniformity of Medicare contractors’ systems.
107

! @# Ernst & Young LLP
• Continue to refine its procedures to provide a mechanism for CMS central and regional offices to monitor contractors’ activities and enforce compliance with CMS financial management procedures. This may include obtaining detailed subsidiary ledgers and related support from contractors for the CMS regional and central offices and reviewing subsidiary ledgers for reasonableness and reviewing reconciliations prepared by the contractors consistently on a periodic basis.
• Enhance the process of supervisory review at the central office, regional offices and contractor sites to identify errors in a more timely fashion. This should include enhancements to high-level exception driven analysis and the development of an archiving mechanism so that historical information is available for future trending; enhancing oversight procedures to monitor the implementation of control procedures to provide independent checks of validity, accuracy, and completeness of amounts reported to CMS. HIGLAS is expected to provide a foundation for improving oversight activities over financial activities.
• Although CMS has addressed these issues in its corrective action plans, CMS needs to continue to work to resolve system deficiencies that impair the contractors’ ability to support and report accurate amounts in a timely fashion. The CAPs should be updated by the contractors in conjunction with the central and regional offices to ensure they identify specific requirements of claims processing systems to ensure they not only meet the reporting needs of the CMS central office, but also the contractor operating environments.
• We recognize that resource limitations may constrain CMS’ ability to execute its mission. We suggest that management formally document the cost benefit conditions and prioritization process used to assess, for example, whether resources will be currently devoted to legislatively mandated MSP data match activities versus other mission responsibilities.
Medicare Electronic Data Processing (EDP) Controls (Repeat Condition) Background and Scope of Review The CMS relies on extensive, interchanged electronic data processing (EDP) operations at both its central office and Medicare contractor sites to administer the Medicare program and to process and account for Medicare expenditures. Adequate internal controls over these operations are essential to the integrity, confidentiality, and reliability of critical data while reducing the risk of errors, fraud, and other illegal acts. The CMS central office systems are used to maintain administrative data, such as Medicare beneficiary enrollment, eligibility, and paid claims data, and process all payments for managed care. The Medicare contractors and data centers use several standard “shared” systems to process and pay fee-for-service claims. All of the shared systems are maintained by “system maintainers” and are interfaced with CMS’ Common Working File (CWF) to obtain
108

! @# Ernst & Young LLP
authorization to pay claims and to coordinate Medicare Part A and Part B benefits. This network accounted for and processed more than $231 billion in Medicare expenditures during FY 2002. Our review of EDP internal controls covered both general and application controls and did not include management or operational controls. General controls involve the entity-wide security program, access controls (physical and logical), application development and program change controls, segregation of duties, operating systems software, and service continuity. General controls impact the integrity of all applications operating within a single data processing facility and are critical to ensuring the reliability, confidentiality, and availability of Medicare data. Application controls include input, processing, and output controls related to specific CMS EDP applications. We completed general control reviews at 12 Medicare EDP facilities that support the eight Medicare contractors sampled. Application controls were assessed for five shared Medicare systems at four separate contractors (the Fiscal Intermediary Standard System (FISS), the Arkansas Part A Standard System (APASS), the VIPS Medicare System (VMS), the Multi-Carrier System (MCS) and the CWF). We also assessed application development and program change controls at 11 Medicare EDP facilities and one system maintainer. We updated the status of findings reported upon in FY 2001 concerning general and application controls for seven contractors, three system maintainers, and the central office. Overall, we increased the number of general and application reviews and related control assessments performed as compared with FY 2001. Our reviews reflect the decentralized, yet interconnected and interdependent nature of Medicare operations that rely upon multiple EDP facilities to perform claims processing. We reviewed the results of CMS-sponsored external vulnerability assessments performed during FY 2002 at three Medicare contractors. We updated the status of findings reported upon in FY 2001 as a result of CMS-sponsored assessments concerning vulnerabilities identified for three separate contractors and the central office. We also reviewed the results of CMS-sponsored SAS 70 independent service auditor reviews performed during FY 2002 for nine Medicare contractors whose operations were selected for the CFO audit claims sample. We noted that CMS continued their self-assessment process for Medicare contractor security and has enhanced their information on known system vulnerabilities. The results of these CMS-sponsored assessments continued to provide substantial and beneficial information about weaknesses that need to be addressed. Overview of Results of FY 2002 EDP Review In the course of the FY 2002 EDP review procedures, we continued to find numerous EDP general control weaknesses at the Medicare contractors, system maintainers, and the CMS central office. Though our review disclosed no exploitation of the identified vulnerabilities, such weaknesses could result in (1) unauthorized access to and disclosure of sensitive information, (2) malicious changes that could interrupt data processing or destroy data files, (3) improper Medicare payments, or (4) disruption of critical operations. Further, weaknesses in the contractors’ entity-wide security structure do not ensure that EDP security controls are adequate
109

! @# Ernst & Young LLP
and operating effectively. Because certain financial reconciliation and report processes within CMS continue to evolve and require further improvement, the general and application controls related to access controls, systems software and application software development and change controls are critically important to CMS to ensure the integrity, confidentiality, and availability of sensitive Medicare data. No individual weakness was determined to be material, but in the aggregate, the matters noted below are a material weakness. Medicare Contractors Weaknesses were identified at the Medicare contractors in five primary types of controls, as follows:
• Entity-wide security programs • Access controls (physical and logical) • Systems software • Application software development and change controls • Service continuity
The CMS external business partner systems security initiative is believed to have the potential as a foundation program to address the vulnerabilities if adequately resourced and properly implemented and monitored. Expeditious efforts to build on that foundation are proceeding, but need to enhanced, as evidenced by the following summary of results from our reviews at the Medicare contractors: Entity-wide security programs. These programs are intended to ensure that security threats are identified, risks are assessed, control objectives are appropriately designed and formulated, relevant control techniques are developed and implemented, and managerial oversight is consistently applied to ensure the overall effectiveness of security measures. Security programs typically include formal policies on how and which sensitive duties should be separated to avoid conflicts of interest. Similarly, policies on background checks during the hiring process are usually stipulated. Entity-wide security programs afford management the opportunity to provide appropriate direction and oversight of the design, development, and operation of critical systems controls. Inadequacies in these programs can result in inadequate access controls and software change controls affecting mission-critical, computer-based operations. Entity-wide security plan control weaknesses were identified at the FY 2002 review sites, and such weaknesses continue at certain sites reviewed in FY 2001. Certain contractors and the central office have not formalized all of their security plans and related programs that address federally mandated requirements. Funding provided to the contractors late in FY 2002 should facilitate the development of consistent security plans in FY 2003. Access controls (physical and logical). Access controls ensure that critical systems assets are physically safeguarded and that logical access to sensitive computer programs and data is granted only when authorized and appropriate. Access controls over computer operating systems
110

! @# Ernst & Young LLP
and data communications software are also closely related. These controls help ensure that only authorized users and computer processes access sensitive data in an appropriate manner. Weaknesses in such controls can compromise the integrity of sensitive program data and increase the risk that such data may be inappropriately used and/or disclosed. Access control weaknesses continue to be identified and represent a significant risk to the Medicare program. Such weaknesses involved the configuration of access control software, policies and procedures for ongoing monitoring and review of suspected access violations, consistent security controls between mainframe and Internet-connected Medicare systems, and physical access to Medicare data centers. During penetration vulnerability testing at three Medicare contractors, weaknesses were identified that relate to dial-in access, user account and password management, Internet security, and systems software configuration. Funding was provided by CMS to the Medicare contractors late in FY 2002 to address gaps in access controls. Systems software. Systems software is a set of computer programs designed to operate and control the processing activities for a variety of applications on computer hardware and related equipment. The systems software helps coordinate the input, processing, output, and data storage associated with all of the applications that are processed on a specific system. Some systems software is designed to change data and programs without leaving an audit trail. Overall, problems in managing routine changes to systems software to ensure an appropriate implementation and related configuration controls were identified. Specifically, we found that updates to systems software in non-mainframe environments that support Medicare claims processing were not applied timely. These non-mainframe environments also were found to have unnecessary system functions placed in operation, resulting in potentially unwarranted exposures subject to exploitation. Such problems could weaken critical controls over access to sensitive Medicare data files and operating system programs. Application software development and change controls. The CMS has addressed the prior control weakness related to the Medicare fiscal intermediary data centers with access code to program source code for FISS through the implementation of improved monitoring controls and change management processes at the central office. However, additional weaknesses were identified at the Medicare data centers primarily related to the testing of new versions of the Medicare standard systems that are regularly provided as updates to the contractors. Such updates are implemented as a result of CMS’ own Medicare program and operational planning activities and, additionally, changes mandated by legislation. We found that several contractors lacked formal change control processes and lacked sufficient documentation for changes made to systems. We also found that the Medicare data centers are generally unable to test all changes being implemented in the updated versions due to insufficient time between the release of the changed program codes to the data centers and the implementation dates. Without sufficient testing and adequate controls over changes made to the program codes as a result of either CMS program or legislative activities, there is insufficient assurance that all claims information is fully processed, which could result in inaccurate or improper Medicare payments.
111
! @# Ernst & Young LLP
Service continuity. Continuity plans provide a means for re-establishing both the automated and administrative processes related to the Medicare program in the event of a system failure. We found that several contractors did not have up-to-date, completed, and tested continuity plans to assure uninterrupted processing of Medicare data. CMS Central Office An update on the status of findings reported upon in FY 2001 at the CMS central office indicated that most important initiatives have been completed. Weaknesses continue to exist in the areas of entity-wide security plans, Medicare data file and physical data center access controls, and service continuity. Specifically, we found that not all central office system security plans have been completed, revised data access password standards have not been fully implemented for critical systems, and business continuity plans have not been completed for all critical Medicare systems. Application Controls. Weaknesses were identified in the routine interchange of data between several critical applications and data sources, including Medicare beneficiary eligibility data received from outside agencies, the CWF, and several critical CMS central office data bases. We found that certain standard system edits could be bypassed but not detected timely and that updates to CWF databases using information from the central office may not be timely or complete. Because of the complexity of the interfaces and the current design of the Medicare applications driven by a claims processing environment with multiple dependencies, the reliability and integrity of critical Medicare information will continue to be impacted by such weaknesses. Recommendation The CMS continues to rely upon automated systems processed by the Medicare contractors for the consistent administration of virtually all aspects of the program. Detailed findings and recommendations for each full-scope review and follow-up review have been communicated to CMS management. In FY 2002, CMS continued to make progress in identifying and addressing weaknesses in its automated processing systems. The CMS identified several additional weaknesses through the performance of vulnerability assessments, SAS 70 reviews, the compilation of Medicare contractor control self-assessments, OIG assessments and our procedures. These activities provide a base line for improvement. In discussing the results of these assessments with management, we understand that CMS will continue their assessment of the risks inherent in each vulnerability, assign priorities and seek additional resources as necessary to correct known deficiencies. We further understand that CMS is requiring all Medicare contractors to prepare system security plans in FY 2003. Unless these deficiencies are addressed, it is likely that symptoms of these weaknesses will continue to be identified.
112

! @# Ernst & Young LLP
The CMS management should, in conjunction with the central office and Medicare contractors and system maintainers that support the overall development, maintenance, and processing of the Medicare automated systems, continue to develop, implement, and monitor cost-effective controls to include: • Consistent adherence to the OMB Circular A-130 guidelines for entity-wide
security plans to ensure appropriate consideration is given to safeguarding Medicare data.
• Consistent and effective physical and logical access procedures, including administration and monitoring of access by Medicare contractor and central Office personnel in the course of their job responsibilities.
• Consistent and effective procedures over the implementation, maintenance, access, and documentation of operating systems software products used to process Medicare data. Appropriately controlled operating systems software products are fundamental to the integrity of the processing of Medicare data.
• Attention to appropriate segregation of duties to ensure accountability and responsibility for access to Medicare applications and data are appropriately assigned.
• Updated and appropriately documented service continuity procedures to recover Medicare processing in the event of a system outage.
• Adequate application controls are integrated into all Medicare systems to ensure that beneficiary and related financial databases are updated timely, accurately, and completely. Such controls should consider enhanced oversight by CMS to ensure consistency for all contractors.
STATUS OF PRIOR YEAR REPORTABLE CONDITIONS
The CMS demonstrated significant accomplishment by resolving its previously reported reportable condition related to Medicare Entitlement Due and Payable. Furthermore, CMS made significant progress by taking steps towards resolving the Medicaid Claims Estimated Improper Payments that is no longer classified as a reportable condition.
* * * * * * * * *
113

! @# Ernst & Young LLP
In addition, we considered CMS’ internal control over Required Supplementary Stewardship Information by obtaining an understanding of the agency’s internal control, determined whether internal control had been placed in operation, assessed control risk, and performed tests of controls as required by OMB Bulletin No. 01-02 and not to provide assurance on internal control. Our procedures with respect to trust fund projections consisted of comparing amounts reflected in the Required Supplementary Stewardship Information to Trustee reports and spreadsheets prepared by the Office of the Actuary and did not include re-performance of actuarial computations or tests of underlying computations or related controls, if any. Accordingly, we do not provide an opinion on such controls. In addition, with respect to internal control related to performance measures reported in the Management’s Discussion and Analysis, we obtained an understanding of the design of internal control relating to the existence and completeness assertions and determined whether they have been placed in operation, as required by OMB Bulletin 01-02. Our procedures were not designed to provide assurance on internal control over reported performance measures, and, accordingly, we do not provide an opinion on such controls. We noted other matters involving internal control over financial reporting, which we have reported to management in a separate letter dated December 10, 2002. This report is intended solely for the information and use of the management of CMS and the Department of Health and Human Services, OMB, and Congress, and is not intended to be and should not be used by anyone other than these specified parties.
December 10, 2002
114

115
CHAPTER TITLE

FEDERAL MANAGERS’FINANCIAL INTEGRITY ACTThe Federal Managers’ Financial Integrity Act (FMFIA) requires executive agencies to reportannually if: (1) they have reasonable assurance that their management controls protect theirprograms and resources from fraud, waste, and mismanagement, and if any material weak-nesses exist in their controls, and (2) their financial management systems conform withFederal financial management systems requirements and Federal accounting standards.
The CMS assesses its management controls and financial management systemsthrough: (1) management control reviews, (2) management self-certifications, (3) Officeof Inspector General (OIG) audits, (4) the CFO financial audit, and (5) other reviewmechanisms, such as Statement on Auditing Standards (SAS 70) internal controlreviews. As of September 30, 2002, the management controls and financial managementsystems of CMS provided reasonable assurance that the objectives of FMFIA wereachieved. However, two material weaknesses (repeated from prior years) existed and anoncompliance was identified during the CFO financial audit.
Material Weakness 1:Financial Systems, Analyses, and Oversight
The Medicare contractors continue to make improvements in maintaining supportingrecords for Medicare activities and year-end balances. However, because the contractorslack a formal, integrated accounting system to accumulate and report financialinformation, they use ad hoc, labor-intensive reports, which increases the risk ofmaterial misstatement or omission. In addition, Medicare contractor controls overaccounts receivable continue to need improvement.
116
CHAPTER TITLE
OtherCongressional
Reports
OtherCongressional
Reports

At the CMS central office (CO), procedures were implemented that resulted inadjustments to accounts receivable balances reported by the contractors. However, theseprocedures did not ensure that accounts receivable activity included on the contractorfinancial reports was properly supported by detailed transactions. We did use formalprocedures for financial reporting analysis.
We continue to provide instructions and guidance to the Medicare contractors andour CO and regional offices (ROs). We continue to contract with Independent PublicAccountants (IPAs) to test financial management internal controls and to analyzeaccounts receivable at Medicare contractors. We created workgroups comprised of COand RO consortia staff to serve as subject matter experts responsible for addressing fourkey areas: follow up on CAPs, reconciliations of funds expended to paid claims, trendanalysis, and internal controls. As CMS progresses toward its long-term goal ofdeveloping an integrated general ledger system, we continue to provide training to thecontractors to promote a uniform method of reporting and accounting for accountsreceivable and related financial data.
Material Weakness 2:Medicare Electronic Data Processing (EDP) Controls
We rely on extensive EDP operations at CO and the Medicare contractors to administerthe Medicare program and to process and account for Medicare expenditures. Internalcontrols over these operations are essential to ensure the integrity, confidentiality, andreliability of critical data while reducing the risk of errors, fraud, and other illegal acts.In FY 2001, weaknesses at the Medicare contractors, as well as certain applicationcontrol weaknesses at the contractors’ shared systems, continued. Such weaknesses donot effectively prevent (1) unauthorized access to and disclosure of sensitiveinformation, (2) malicious changes that could interrupt data processing or destroy files,(3) improper Medicare payments, or (4) disruption of critical operations. The OIGaggregated the findings at the Medicare contractors and CMS CO into one materialweakness. No findings at a single location were considered material.
We continue to make progress toward resolving this issue by revising ourinformation systems security requirements for Medicare contractors. The CMS CoreInformation Security Requirements adhere to guidelines in the Office of Managementand Budget (OMB) Circular A-130 and implement effective control procedures. In FY2002, we completed a prototype of a system security plan methodology for Medicarecontractors and developed and implemented new background investigation procedures.We also developed policy and procedures for software quality assurance, as well asdeveloped, tested, and implemented a systems software change audit review process.
NoncomplianceThe CMS financial management systems—because they are not integrated—do notconform to government-wide requirements. We are following a comprehensive plan tobring our systems into compliance with the requirements. We have procured a systems
117
OTHER CONGRESSIONAL REPORTS

integrator to implement the Healthcare Integrated General Ledger Accounting System(HIGLAS). We have initiated implementation of an approved Joint FinancialManagement Improvement Program commercial off-the-shelf product at two Medicarecontractor pilot sites.
MEDICARE’S VALIDATION PROGRAM FORJCAHO ACCREDITED HOSPITALS
Introduction
Section 1865 of the Social Security Act (the Act) provides that hospitals accredited bythe Joint Commission on Accreditation of Health Care Organizations (JCAHO) aredeemed to meet the Medicare Conditions of Participation (CoPs). While JCAHO-accredited hospitals are not subject to routine Medicare surveys by the State SurveyAgencies, subsection 1864(c) of the Act authorizes the Secretary to enter into anagreement with any such State Agency to survey JCAHO-accredited hospitals on aselective sample basis, or in response to allegations of significant deficiencies which, ifsubstantiated, would adversely affect the health and safety of patients. The Act furtherrequires, at section 1875, the Secretary to include an evaluation of the JCAHOaccreditation process for hospitals in an annual report to Congress. This evaluation isreferred to as the hospital validation program.
The purpose of the hospital validation program is to determine if the JCAHOaccreditation process provides reasonable assurance that accredited hospitals are incompliance with the statutory requirements set forth at 1861(e) of the Act forparticipation in the Medicare program.
The JCAHO accreditation survey assesses a hospital’s compliance with the JCAHOstandards. Following the completion of an on-site survey, the JCAHO makes anaccreditation decision. The accreditation decisions include: accreditation, accreditationwith Type I recommendations, conditional accreditation, and no accreditation.
1
Accreditation means that the hospital meets all JCAHO standards and requirements.Accreditation with Type I recommendations means that the hospital is grantedaccreditation with the assurance that the identified recommendations for improvementare corrected. The JCAHO requires hospitals with Type I recommendations to submit awritten progress report or undergo a follow-up survey. Conditional accreditation
_______________________________________1JCAHO accreditation decisions also include preliminary denial of accreditation and provisional accreditation.
[The CMS does not recognize provisional accreditation for deeming.] The JCAHO considers all hospitals to be‘accredited’ except those that are not accredited. The CMS currently accepts the JCAHO definition fordeeming purposes.
118
OTHER CONGRESSIONAL REPORTS

results when a hospital is not in substantial compliance with JCAHO standards, but isbelieved to be capable of achieving acceptable standards compliance within a stipulatedtime period. Findings of correction, which serve as the basis for further consideration ofawarding full accreditation, must be demonstrated through a short-term follow-upsurvey. Table 1 summarizes the JCAHO accreditation decisions for Medicare-approvedhospitals receiving a triennial survey in calendar years 2000 and 2001.
TABLE 1JCAHO Accreditation Decisions,
Medicare-Approved Hospitals Surveyed in 2000 and 2001
Accreditation Decisions No. Hospitals in 2000 No. Hospitals in 2001(Percent) (Percent)
Accreditation 146 167 (9.5) (10.8)
Accreditation with 1355 1349 Type I Recommendations (87.8) (87.3)
Conditional 41 28 Accreditation (2.7) (1.8)
Total Surveyed2
1543 1545 (100) (100)
Changes in the Hospital Validation Program
Traditionally, the hospital validation program consisted of the Centers for Medicare &Medicaid Services (CMS) conducting a number of ‘look behind’ surveys at hospitals thatrecently had a JCAHO accreditation survey completed. Each year, CMS randomly selectsapproximately five percent of all JCAHO-accredited hospitals for validation surveys. Thevalidation sample includes the following two categories:
1. Random sample (hospitals randomly selected to receive a Medicare survey within 60days following the hospital’s JCAHO survey).
2. Conditional sample (hospitals randomly selected that had a JCAHO accreditation decision of conditional).
In 1999 the HHS Office of Inspector General (OIG) issued a series of reports thatprompted CMS to re-examine the hospital validation program and to determine whatsteps could be taken in order to improve JCAHO accountability for its performance
_______________________________________2Categories do not sum to total because table does not include all accreditation categories.
119
OTHER CONGRESSIONAL REPORTS

when accrediting hospitals. The CMS reviewed the weaknesses of the current hospitalvalidation program and developed two new validation survey types—theConcurrent/Observational Survey and the Focused Survey. Both new survey types werepiloted on a limited basis during FY 2001 in addition to the traditional validationsurveys conducted.
The Concurrent/Observational Survey is an announced survey with a CMS RegionalOffice surveyor(s) observing the JCAHO triennial accreditation survey while the Statesurvey agency concurrently conducts a full comparative survey. Regional Officeobservers record their observations of JCAHO standard implementation, survey process,and surveyor performance. The pilot Concurrent/Observational Survey was initiated inJanuary 2001. The CMS and JCAHO worked in close collaboration to orchestrate andcomplete the five concurrent/observational surveys performed in FY 2001.
The Focused Survey is designed to determine a hospital’s ability to maintaincompliance with the Medicare CoPs between JCAHO accreditation surveys. The hospitalis notified no more than 24 hours prior to the start of this survey. The Focused Survey isconducted between 60 days and 6 months following the hospital’s JCAHO accreditationsurvey and examines specific standards of national or regional interest to CMS. TheFY 2001 Focused Surveys were conducted to assess the hospitals’ compliance with selectConditions of Participation. The CoPs selected, based on national interest, were: PatientRights, Nursing Services, Pharmaceutical Services, and Quality Assurance as it pertainsto pharmaceutical services and medication administration. A total of ten FocusedSurveys were conducted during FY 2001.
The CMS has collected data on these new survey types that were introduced inFY 2001, and has included the results in the calculation of the disparity rate.
In the evaluation of the new survey types, feedback was solicited from the JCAHO,CMS Regional Offices, State survey agencies, and hospitals that were surveyed under thenew methodology. Additionally, CMS has obtained the services of an independentcontractor to evaluate the effectiveness of the revised hospital validation program andthe outcomes of the survey pilots. That contractor is scheduled to complete itsevaluation in the first portion of 2003, at which time CMS will determine whatadditional steps are necessary.
Validation Survey Findings
In FY 2001, 239 JCAHO-accredited hospitals were selected to receive a validation survey,with a total of 204 validation surveys performed by the State survey agencies. Table 2presents the number of random validation surveys performed, along with the compliancedeterminations (i.e., if the results of a validation survey showed noncompliance with oneor more CoPs, the hospital was ‘out of compliance’). A hospital may have haddeficiencies of a lesser severity (e.g., standard level) and still be considered incompliance. This table also included a comparison of the compliance pattern betweenvalidation surveys of accredited hospitals and routine surveys of nonaccredited hospitals.
120
OTHER CONGRESSIONAL REPORTS
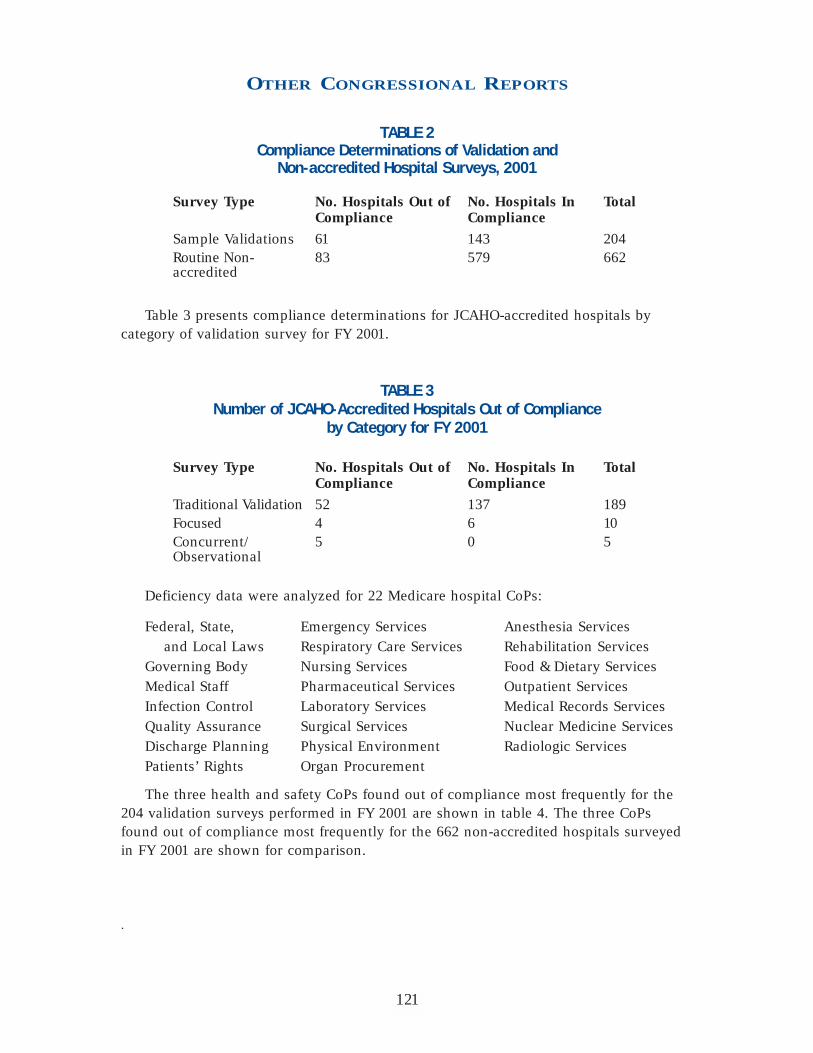
TABLE 2Compliance Determinations of Validation and
Non-accredited Hospital Surveys, 2001
Survey Type No. Hospitals Out of No. Hospitals In TotalCompliance Compliance
Sample Validations 61 143 204 Routine Non- 83 579 662accredited
Table 3 presents compliance determinations for JCAHO-accredited hospitals bycategory of validation survey for FY 2001.
TABLE 3Number of JCAHO-Accredited Hospitals Out of Compliance
by Category for FY 2001
Survey Type No. Hospitals Out of No. Hospitals In TotalCompliance Compliance
Traditional Validation 52 137 189 Focused 4 6 10 Concurrent/ 5 0 5Observational
Deficiency data were analyzed for 22 Medicare hospital CoPs:
Federal, State, Emergency Services Anesthesia Services and Local Laws Respiratory Care Services Rehabilitation Services
Governing Body Nursing Services Food & Dietary ServicesMedical Staff Pharmaceutical Services Outpatient Services Infection Control Laboratory Services Medical Records Services Quality Assurance Surgical Services Nuclear Medicine ServicesDischarge Planning Physical Environment Radiologic ServicesPatients’ Rights Organ Procurement
The three health and safety CoPs found out of compliance most frequently for the204 validation surveys performed in FY 2001 are shown in table 4. The three CoPsfound out of compliance most frequently for the 662 non-accredited hospitals surveyedin FY 2001 are shown for comparison.
.
121
OTHER CONGRESSIONAL REPORTS

TABLE 4Most Frequently Cited Conditions of Participation
During Surveys, FY 2001
Accredited Hospitals Frequency Non-Accredited Hospitals Frequency
1 Physical Environment 40 Physical Environment 24 (includes Life Safety Code)
2 Infection Control 9 Infection Control 20
3 Nursing Services 8 Quality Assurance 17
Allegation Surveys
In addition to random validation surveys, CMS conducts substantial allegation(complaint) surveys on JCAHO-accredited hospitals. The CMS evaluates each complaintreceived on an accredited hospital. If CMS believes that the hospital would have a CoPout of compliance, we will then authorize the State Agency to conduct a substantialallegation survey.
In FY 2001, 2,482 allegation surveys of JCAHO-accredited hospitals were conductedwith 101 found out of compliance with one or more CoPs. This means that 4 percent ofthe allegation surveys were substantiated by findings of non-compliance. Also, 350allegation surveys of non-accredited hospitals were conducted with 36 found out ofcompliance with one or more CoPs. This means 10 percent of the allegation surveys innon-accredited hospitals were substantiated by findings of non-compliance at the CoPlevel. Table 5 summarizes the most frequently cited CoPs found during allegationsurveys of accredited and non-accredited hospitals.
TABLE 5Most Frequently Cited Conditions of Participation
During Allegation Surveys, 2001
ACCREDITED HOSPITALS NONACCREDITED HOSPITALSCondition Not Met Frequency Condition Not Met Frequency
1 Nursing Services 43 Nursing Services 15
2 Governing Body 28 Quality Assurance 15
3 Patients’ Rights 24 Infection Control 9
122
OTHER CONGRESSIONAL REPORTS

Rate of Disparity
The rate of disparity is the percentage of all sample validation surveys for which a Statesurvey agency finds non-compliance with one or more Medicare conditions and nocomparable condition level deficiency was cited by the accreditation organization. As setforth in regulation at 42 CFR 488.8(d), accreditation programs with a disparity rate of 20percent or more are subject to a review to determine if that organization has adoptedand maintains requirements that are comparable to CMS’s. Of the 204 validation surveysperformed in JCAHO-accredited hospitals in FY 2001, the State survey agencies foundnon-compliance with one or more conditions of participation in 61 hospitals. Comparingthe validation survey reports of these hospitals with the JCAHO-accreditation surveyreports, 12 of the 61 accreditation reports had findings comparable to those Condition-level deficiencies identified by the State Agency surveyors. This equals an overalldisparity rate of 24 percent, a decrease from a disparity of 27 percent in FY 2000. Aswas the case in FY 2000, life safety code deficiencies account for more than 50 percentof the overall disparity rate.
In accordance with 42 CFR 488.8(d), CMS has initiated a review of the JCAHOrequirements for life safety code (including standards, environment of care, and surveyprocess) as they compare to CMS requirements. The CMS examined the methods used bythe JCAHO to evaluate a hospital’s compliance with the Life Safety Code through afacility self-assessment (Statement of Conditions or SOC) and the Plans for Improvement(PFI) documents. While CMS does not oppose the concept of the JCAHO’s evaluationmethod for compliance with Life Safety Code (i.e., the SOC and the PFI), we haveidentified inconsistencies in its implementation that we believe contributes to thedifferences in the validation findings.
The CMS shared with the JCAHO a number of recommendations that we believewould improve the JCAHO evaluation of LSC compliance for hospitals. A briefdescription of the recommendations follows:
Completion of the Statement of Conditions by Qualified Personnel. The JCAHO should require that hospitals use certain types of personnel to complete the SOC.These requirements should specify both credentialing (e.g., architect, fire marshal,etc.) and specific knowledge, skills, and abilities.
Minimum Standards for the Content of the Statement of Conditions/Plan forImprovement. The JCAHO should set forth minimum standards for the SOC and PFI.
Submission of the SOC and PFI Documents to JCAHO Prior to Survey. The JCAHOshould require that hospitals submit the SOC and PFI documents to JCAHO centraloffice within a specified time frame prior to their accreditation renewal date (datecertain). This would enable JCAHO central office personnel and surveyors to reviewthe documents prior to beginning the survey. Currently, the surveyors do not receivethe SOC and PFI documents until on-site at the hospital.
123
OTHER CONGRESSIONAL REPORTS
Increase Number of Life Safety Code Experts. The JCAHO should increase thecapacity of Life Safety Code experts in their central office to review the SOCs andPFIs that are submitted by the hospitals prior to the survey. These individuals couldevaluate whether or not these materials meet the standards set forth above, andidentify areas of concern to determine the best course of action for the surveyorsto take.
Develop Mechanisms for Facilities that Fail to Comply with the Time Frames forCorrection. The JCAHO should develop mechanisms in the accreditation process forfacilities that fail to follow their own time frames for completion of the tasks listedon their PFI.
The JCAHO has agreed to give serious consideration to the recommendations CMSset forth as they evaluate their own processes for assessing hospital compliance with theLife Safety Code. Additionally, CMS believes that the anticipated adoption of the 2000edition by both CMS and JCAHO should help address some of the differences invalidation findings. The CMS and JCAHO have both committed to working together toensure that JCAHO’s life safety code standards and survey requirements are at least asstrong as Medicare’s.
CLINICAL LABORATORY IMPROVEMENTVALIDATION PROGRAM
Introduction
This report on the Clinical Laboratory Improvement Validation Program covers theevaluations of FY 2001 performance by the six accreditation organizations approvedunder the Clinical Laboratory Improvement Amendments of 1988 (CLIA). The sixorganizations are as follows:
• American Association of Blood Banks (AABB)
• American Osteopathic Association (AOA)
• American Society of Histocompatibility and Immunogenetics (ASHI)
• COLA
• College of American Pathologists (the College)
• Joint Commission on Accreditation of Healthcare Organizations (Joint Commission)
We appreciate the cooperation of all of the organizations in providing theirinspection schedules and results. While an annual performance evaluation of eachapproved accreditation organization is required by law, we see this as an opportunity
124
OTHER CONGRESSIONAL REPORTS

to present information about, and dialogue with, each organization in our mutualinterest in improving the quality of testing performed by clinical laboratories acrossthe nation.
Legislative Authority and Mandate
Section 353 of the Public Health Service Act, as amended by CLIA, requires anylaboratory that performs testing on specimens derived from humans to meet therequirements established by the Department of Health and Human Services (HHS) andhave in effect an applicable certificate. Section 353 further provides that a laboratorymeeting the standards of an approved accreditation organization may obtain a CLIACertificate of Accreditation. Under the CLIA Certificate of Accreditation, the laboratory isnot routinely subject to direct federal oversight by CMS. Instead, the laboratory receivesan inspection by the accreditation organization in the course of maintaining itsaccreditation, and by virtue of this accreditation, is “deemed” to meet the CLIArequirements. The CLIA requirements pertain to quality assurance and quality controlprograms, records, equipment, personnel, proficiency testing and others to assureaccurate and reliable laboratory examinations and procedures.
In section 353(e)(2)(D), the Secretary is required to evaluate each approvedaccreditation organization by inspecting a sample of the laboratories they accredit and“such other means as the Secretary determines appropriate.” In addition, section353(e)(3) requires the Secretary to submit to Congress an annual report on the results ofthe evaluation. This report is submitted to satisfy that requirement.
Regulations implementing section 353 are contained in 42 CFR part 493 LaboratoryRequirements. Subpart E of part 493 contains the requirements for validationinspections, which are conducted by CMS or its agent to ascertain whether thelaboratory is in compliance with the applicable CLIA requirements. Validationinspections are conducted no more than 90 days after the accreditation organization’sinspection, on a representative sample basis or in response to a complaint. The resultsof these validation inspections or “surveys” provide:
• on a laboratory-specific basis, insight into the effectiveness of the accreditation organization’s standards and accreditation process; and
• in the aggregate, an indication of the organization’s capability to assure laboratory performance equal to or more stringent than that required by CLIA.
The CLIA regulations, in section 493.575 of subpart E, provide that if the validationinspection results over a one-year period indicate a rate of disparity of 20 percent or morebetween the findings in the accreditation organization's results and the findings of the CLIAvalidation surveys, CMS can re-evaluate whether the accreditation organization continuesto meet the criteria for an approved accreditation organization (also called “deemingauthority”). Section 493.575 further provides that CMS has the discretion to conduct areview of an accreditation organization program if validation review findings, irrespective of
125
OTHER CONGRESSIONAL REPORTS

the rate of disparity, indicate such widespread or systematic problems in the organization'saccreditation process that the requirements are no longer equivalent to CLIA requirements.
Validation Reviews
The validation review methodology focuses on the actual implementation of anorganization’s accreditation program described in its request for approval. Theaccreditation organization’s standards, as a whole, were approved by CMS as beingequivalent to, or more stringent than, the CLIA condition-level requirements*, as awhole. This equivalency is the basis for granting deeming authority.
In evaluating an organization’s performance, it is important to examine whether theorganization’s inspection findings are similar to the CLIA validation survey findings. It isalso important to examine whether the organization’s inspection process sufficientlyidentifies, brings about correction, and monitors for sustained correction, laboratorypractices and outcomes that do not meet their accreditation standards, so thatequivalency of the accreditation program is maintained.
The organization’s inspection findings are compared, case-by-case for eachlaboratory in the sample, to the CLIA validation survey findings at the condition level.If it is reasonable to conclude that one or more of those condition-level deficiencies waspresent in the laboratory’s operations at the time of the organization’s inspection, yetthe inspection results did not note them, the case is a disparity. When all of the cases ineach sample have been reviewed, the “rate of disparity” for each organization iscalculated by dividing the number of disparate cases by the total number of validationsurveys, in the manner prescribed by section 493.2 of the CLIA regulations.
Number of Validation Surveys Performed
As directed by the CLIA statute, the number of validation surveys should be sufficient to“allow a reasonable estimate of the performance” of each accreditation organization. Arepresentative sample of the more than 14,000 accredited laboratories received avalidation survey in 2001. Laboratories seek and relinquish accreditation on an ongoingbasis, so the number of laboratories accredited by an organization during any given yearfluctuates. Moreover, many laboratories are accredited by more than one organization.Each laboratory holding a Certificate of Accreditation, however, is subject to only onevalidation survey—for the organization it selected to maintain its CLIA certification,irrespective of the number of accreditations it attains.
Nationwide, fewer than 500 of the accredited laboratories used AABB, AOA, or ASHIaccreditation for CLIA purposes. Given these proportions, very few validation surveys
_______________________________________* A condition-level requirement pertains to the significant, comprehensive requirements of CLIA, asopposed to a standard-level requirement, which is more detailed, more specific. A condition-level deficiencyis an inadequacy in the laboratory’s quality of services that adversely affects, or has the potential toadversely affect, the accuracy and reliability of patient test results.
126
OTHER CONGRESSIONAL REPORTS

were performed in laboratories accredited by those organizations. The overwhelmingmajority of accredited laboratories in the CLIA program used their accreditation byCOLA, the College, or the Joint Commission, thus the sample sizes for theseorganizations were larger. The sample sizes are usually proportionate to eachorganization’s representation in the universe of accredited laboratories, however trueproportionality is not always possible due to the complexities of scheduling.
The number of validation surveys performed for each organization is specifiedbelow in the summary findings for the organization.
Results of the Validation Reviewsof Each Accreditation Organization
American Association of Blood Banks
Rate of disparity: No disparity
Approximately 120 laboratories used their AABB accreditation for CLIA purposes.Seven validation surveys were conducted. No condition-level deficiencies were cited onany of the surveys, thus disparity was precluded.
American Osteopathic Association
Rate of disparity: No disparity
For CLIA purposes, approximately 50 laboratories used their AOA accreditation. Sixvalidation surveys were conducted. This year, as in the previous years of CLIAvalidation review, disparity was precluded because no condition-level deficiencies werecited on any of the surveys.
American Society of Histocompatibility and Immunogenetics
Rate of disparity: No disparity
Approximately 130 laboratories used their ASHI accreditation for CLIA purposes. Sixvalidation surveys were conducted. Condition-level compliance was found in all thevalidation surveys, thus disparity was precluded this year, as in the previous years of CLIAvalidation review.
COLA
Rate of disparity: 3 percent
Validation surveys were conducted at 95 COLA-accredited laboratories. Ten of thelaboratories were cited with condition-level deficiencies. Comparable deficiencies werenot noted by COLA in three of those laboratories.
Following is a listing of the laboratory identification number, location and condition-level deficiencies of the laboratories where COLA findings were disparate.
127
OTHER CONGRESSIONAL REPORTS

CLIA number Location CLIA Conditions
10D0692467 Florida Quality Control—Bacteriology26D0444419 Kansas Laboratory Director36D0339480 Ohio Successful Participation—Proficiency Testing,
Chemistry Proficiency Testing, and Hematology Proficiency Testing
College of American Pathologists
Rate of disparity: 2 percent
A total of 55 validation surveys were actually conducted at laboratories accreditedby the College; however, 5 were removed from the pool because they were either not asurvey of the entire facility or they were not conducted within the 90-day time frame.Among the remaining 50 laboratories, 2 were cited with condition-level deficiencies.Comparable deficiencies were noted by the College in only one of those cases.
Following is the CLIA identification number, location, and condition-level deficiencyof the laboratory where the College’s findings were disparate.
CLIA number Location CLIA Conditions45D0670310 Texas Laboratory Director
Joint Commission on Accreditation of Healthcare Organizations
Rate of disparity: 8 percent
During this validation period, a total of 53 validation surveys were conducted atlaboratories accredited by the Joint Commission. Three surveys were removed from thepool because they were not performed within the 90-day time frame. Among theremaining 50 laboratories, 4 were cited with condition-level deficiencies. Comparabledeficiencies were not noted by the Joint Commission in all four of those laboratories.
Following is a listing of the CLIA identification number, location and condition-leveldeficiencies of the laboratories where the Joint Commission’s findings were disparate.
CLIA number Location CLIA Conditions15D0362073 Indiana Quality Assurance17D0046777 Kansas Laboratory Director34D0240163 N. Carolina Quality Assurance45D0692852 Texas Quality Assurance and
Quality Control—Bacteriology
128
OTHER CONGRESSIONAL REPORTS

Conclusion
The CMS has performed this validation review in order to evaluate and report toCongress on the performance of the six laboratory accreditation organizations approvedunder CLIA. The findings of the validation review for FY 2001 indicate that all of theaccreditation organizations performed at a level well below the 20 percent disparitythreshold that would trigger a deeming authority review. Moreover, the validationreview did not reveal widespread or systematic problems in accreditation processes thatcause the equivalency of any organization’s accreditation program to be questioned.
QUALITY IMPROVEMENTORGANIZATIONS (QIOs)Over the last several years, CMS has re-engineered the QIO program to better meet ourstrategic goal of improving the health status of Medicare beneficiaries. The QIOs stillperform quality assurance activities in accordance with their original mandate.However, the principal focus of the QIO program has evolved from a mix of utilizationreview, diagnosis related group (DRG) validation and quality of care review to anexpanded approach that features emphasis on quality improvement projects through theHealth Care Quality Improvement Program (HCQIP). For the sixth round of QIOcontracts, now in the final year of a 3-year cycle, a substantial level of effort is alsobeing directed at Medicare program integrity via the Payment Error Prevention Program(PEPP) in compliance with the Balanced Budget Act.
The HCQIP relies on provider-based quality improvement, a data driven externalmonitoring system based on quality indicators, and sharing of comparative data andbest practices with providers to stimulate improvement. The QIOs conduct a widevariety of improvement projects on important clinical and non-clinical topics that havethe potential to improve care provided to many Medicare beneficiaries. Such projectsvary in size depending on the study purpose and design. For example, there are nationalprojects featuring six clinical topic areas (acute myocardial infarction, heart failure,diabetes, breast cancer, pneumonia, and stroke) that CMS has determined to have ahigh impact on Medicare beneficiaries; where the process measures are linked tooutcomes; where room for improvement exists; and where QIOs have experience withthe topic. Similarly, individual QIOs also design and structure local projects wherebythey work collaboratively with specific providers and managed care plans in their areas,particularly with respect to disadvantaged and/or under-served beneficiary groups. TheQIOs also conduct pilot projects in alternative provider settings.
Consistent with our strategic goal to promote the fiscal integrity of CMS programs,the PEPP activities are part of the Comprehensive Plan for Program Integrity to ensureMedicare hospital inpatient claims are billed and paid appropriately. Using CMS-
129
OTHER CONGRESSIONAL REPORTS

developed baseline data, each QIO is now required to identify the extent of paymenterrors occurring in its area; implement appropriate educational interventions aimed atchanging provider behavior; and decrease the observed payment error rate. The overalltarget for the 3-year contract period is a 50 percent reduction nationally in paymenterrors for claims by acute care hospitals under Medicare’s Prospective Payment System.
Under Federal budget rules, the QIO program is defined as mandatory rather thandiscretionary because QIO costs are financed directly from the Medicare trust funds andare not subject to the annual appropriations process. The QIO outlays in FY 2002 totaled$354.0 million, which compares with $329.2 million spent in FY 2001.
In FY 2002, CMS administered 53 QIO performance-based contracts, one per State,the District of Columbia, the Virgin Islands, and Puerto Rico. Program compliance isensured via performance-based evaluation measures for both project results and programintegrity efforts, as well as use of inter-rater reliability measures and InternationalOrganization for Standardization (ISO) 9000-type documentation of QIO processes.
2002 TOP CMSMANAGEMENT ISSUES LISTThe Reports Consolidation Act of 2000 requires an annual update of a list of the mostserious management challenges, and management’s progress in dealing with thosechallenges. Those challenges relating to CMS have been identified by the OIG andassessed here, along with a brief commentary from CMS management.
Management Issue #1:Payment for Prescription Drugs
Management Challenge
Because prescription drugs are such a significant part of 21st century medical care tohelp ensure proper treatment and maximum wellness, it is important that Medicare andMedicaid beneficiaries’ access to pharmaceuticals is not hindered by overpricing.Overall, in calendar year 2001, Medicare Part B spent over $6.5 billion for prescriptiondrugs. Similarly, in 2001, the federal share of dollars spent for Medicaid prescriptiondrugs was nearly $14.3 billion.
The OIG has consistently found that Medicare pays too much for prescription drugs— morethan most other payers. For example, Medicare payments for 24 leading drugs in 2000 were$887 million higher than actual wholesale prices available to physicians and suppliers and$1.9 billion higher than prices available through the Federal Supply Schedule. This hasoccurred because the reimbursement methodology is fundamentally flawed.
130
OTHER CONGRESSIONAL REPORTS

131
OTHER CONGRESSIONAL REPORTS
By law, Medicare’s payment is equal to 95 percent of a drug’s average wholesaleprice (AWP). However, the AWPs are not really wholesale prices; for the most part, theyare reported by manufacturers to companies that publish drug pricing data. As OIGreports have indicated, the published AWPs that Medicare uses to establish drug pricesbear little or no resemblance to actual wholesale prices available to physicians, suppliers,and large government purchasers. Further, because physicians and suppliers keep thedifference between the actual price they pay for a drug and 95 percent of its AWP, theyhave a financial incentive to buy from a drug company with artificially inflated AWPs.Some may argue that the high drug payments are offset by insufficient Medicarepayments to administer the drugs.
Several OIG reports indicate that Medicaid is also paying too much for prescriptiondrugs because reimbursement methodologies are based on inflated AWPs. States shouldchange their reimbursement methodologies to reflect the drug pricing categories, i.e.,single-source innovator drugs, multiple-source innovator drugs not covered by theFederal Upper Limits, multiple-source noninnovator drugs not covered by the FederalUpper Limits, and drugs on the Federal Upper Limit schedules. Also, a connection isneeded between how Medicaid pays for drugs and how rebates are calculated.Currently, any increases in pricing would not represent a corresponding increase inrebates; in fact, Medicaid could be paying more for drugs while getting less in rebates.
In recent large settlements, two pharmaceutical manufacturers allegedly set andreported some AWPs at levels far higher than the actual acquisition cost paid by themajority of their customers and caused those customers to receive excess Medicareand/or Medicaid reimbursement. To resolve their liability for this and other conduct,TAP Pharmaceuticals and the Bayer Corporation agreed to pay $875 million and $14million, respectively, to federal health care programs.
Assessment of Progress in Addressing the Challenge
Despite attempts by CMS to work with the Congress to develop and implement morerealistic Medicare and Medicaid reimbursement methods for prescription drugs, OIGreports continue to show that these flawed payment methodologies remain essentiallyunchanged. As of this writing, legislative progress is being made but a consensus billhas yet to be passed. However, BIPA gave the Secretary some authority to makeadministrative adjustments to the payment methodology in Medicare.
Management’s Comments in Brief
The CMS continues to collect and analyze data on drug pricing and the costs of physiciansadministering drugs. For example, it is studying non-Medicare drug pricing of selecteddrugs covered under Part B to determine the feasibility of other approaches to moreaccurately determine AWP. In addition, the CMS has begun to utilize a single contractor todetermine payment rates to eliminate the current variation in contractor prices.

Management Issue #2:Protection of Critical Systems and Infrastructure
Management Challenge
To accomplish its major missions of providing health care to the elderly, the disabled,and the poor; facilitating research; preventing and controlling disease; and servingfamilies and children, CMS must rely on a distributed and open computing environmentfor information processing, knowledge sharing, and collaboration. Management,therefore, must establish security policies for information technology and monitorcompliance; this process is essential for an effective IT security program.
Through Presidential Decision Directive 63 and the Government Information SecurityReform Act (GISRA), the Federal Government has been mandated to assess the controlsin place to protect assets critical to the nation’s well-being and report on theirvulnerability. The events of September 11, 2001 greatly heightened the awareness of theneed to protect physical and cyber-based systems essential to the minimum operationsof the economy and the government.
Assessment of Progress in Addressing the Challenge
CMS has made much progress in securing the most critical of essential assets. Corerequirements for security controls were established and distributed, and systemsarchitecture documents have been developed. However, recent OIG assessments (CFOand GISRA) found numerous information systems general control weaknesses in entity-wide security, access controls, service continuity, and segregation of duties. A collectiveassessment of deficiencies in Medicare systems resulted in the reporting of a materialweakness in the FY 2001 CMS financial statement audit. While OIG has not found anyevidence that these weaknesses have been exploited, they leave CMS vulnerable to:(1) unauthorized access to and disclosure of sensitive information, (2) maliciouschanges that could interrupt data processing or destroy data files, (3) improperpayments, or (4) disruption of critical operations.
Management’s Comments in Brief
The CMS is working with the Department of Health and Human Service’s to complywith Presidential Decision Directive (PDD) 63. We are encouraged that the OIG hasfound no evidence that any security weaknesses have been exploited. In keeping withthe requirements of the Government Information Security Reform Act of 2000, securityremains a priority for CMS. To further strengthen our security posture, we havecontinued the emphasis placed on this functional area through implementation of acomprehensive systems security program that covers CMS internal operations as well asthe operations of our Medicare fee-for-service contractors. To the extent of availableresources, we have proceeded with security improvements and corrective actions. Theprogram features initiatives in four fundamental areas: security policy, training andawareness, engineering, and oversight. A key feature of the program for the Medicare
132
OTHER CONGRESSIONAL REPORTS

contractors was the development and dissemination of codified core securityrequirements (CSRs).
During FY 2002, CMS received each Medicare contractor's second annual assessmentof their compliance against the CSRs. Along with an independent contractor, CMS iscompleting its final evaluation of each Medicare contractor submission. The CMSrequested, received, and distributed $9.7 million in additional FY 2002 funding forproposed safeguards and corrective actions. These safeguards and actions will beimplemented throughout FY 2003. The CMS will continue to fund needed safeguards infuture years, to the extent of available resources.
During FY 2002, CMS also developed and implemented a mandatory computer basedtraining (CBT) security awareness course that all employees must complete by January2003. The CMS began its own independent vulnerability assessment testing five yearsago, and is aggressively cooperating with the OIG to improve the scope and coverage ofsuch testing, especially for the Medicare contractor community. The level of awarenessabout the importance of security has been further enhanced since 9/11/01, andmanagement of security issues is being appropriately addressed. The CMS endorses theimportance of a healthy security program and hopes that this area will be a priority forresources in the future. An investment in security is essentially an investment in riskmanagement. Such investment facilitates both remedial corrections and improvedpreventative measures across all of the Agency’s activities.
The OIG has indicated that they intend to continue oversight of CMS’s securityprogram with additional reviews. The CMS will work with the OIG to ensure that thesereviews are coordinated with similar OIG EDP reviews that are conducted underauthority of the annual Chief Financial Officer's audit, GISRA, and PDD-63 to minimizethe impact on ongoing operations.
Management Issue #3: Nursing Facilities
Management Challenge
Given the vulnerability of nursing home facility residents, it is imperative thatappropriate and quality care be a top priority for all involved care providers. At thesame time, payments need to be made accurately both to ensure financial stability fornursing homes and to protect the financial integrity of the Medicare program.
Financial controls and quality of care provided in nursing homes continue to be afocus of the OIG. In looking at nursing home resident assessments, OIG founddifferences between the minimum data set and the rest of the medical record, some ofwhich may affect care planning. The OIG now has a number of additional studiesunderway. These include evaluations of the role of the nursing home medical director,quality assurance committees, nurse aid training, trends in survey and certificationdeficiencies, consistency and reliability of the certification process, identifying repeat
133
OTHER CONGRESSIONAL REPORTS

offenders in the certification process, social work services, and complaints to long-term-care ombudsmen. The results of these studies will be published over the coming year.
With respect to payments, OIG found that some services were paid for twice—onceto the facility under the prospective payment system and again to the supplier. The OIGalso examined the medical necessity of Part B therapy provided in nursing homes, bothunderutilization and overutilization, and found that 24 percent of the total allowedamount of this therapy in 1999 was paid in error. In addition, over one-third ofMedicare Part B payments for psychiatric services in nursing homes were inappropriate.
Assessment of Progress in Addressing the Challenge
The CMS has made progress in Part A nursing home reforms, which are important tocontrolling fraud and abuse. The CMS issued a fraud alert addressing the prevalenttypes of errors found in OIG’s initial review. Additionally, OIG recommended recovery ofthe improper payments and that CMS establish payment edits in its Common WorkingFile and the Medicare contractors’ claims processing systems to ensure that outsideproviders and suppliers comply with the consolidated billing provision.
The CMS agreed with the recommendations and indicated that meaningful progresshad been made toward implementing edits to identify potentially inappropriatepayments and recover overpayments. In addition, CMS issued a task order to one of itspayment safeguard contractors to identify overpayments in three States. The OIG iscontinuing work in this area to determine if overpayments persist.
The CMS rolled out a nationwide nursing home quality initiative in November,which will make public facility-specific information regarding the quality of care innursing homes to benefit those who are looking for a facility that can best provide need-ed care for a family member. This is an expansion of an earlier six-state pilot undertak-en by CMS.
Management’s Comments in Brief
The CMS concurs with OIG’s assessment. The CMS has made significant gains inassuring that services being paid under the skilled nursing facility prospective paymentsystem (SNF PPS) by fiscal intermediaries are not also billed to and paid by carriers. InApril 2002, CMS implemented common working file (CWF) edits that will detect anddeny cases in which carriers are being billed for services that the CWF shows to be in aMedicare covered Part A stay during the period in which the supplier billed the carrierfor the service. In July 2002, CMS also implemented edits that will detect and markpayments that were made by carriers for persons in the course of a Medicare coveredSNF stay where the SNF claim did not post to the CWF record before the carrier claimwas paid, thus resulting in an incorrect payment. In January 2003, CMS plans toimplement CWF edits that will detect similar incorrect cases in the fiscal intermediaryclaims processing system.
134
OTHER CONGRESSIONAL REPORTS

In addition, CMS has developed a website application that can be used by aphysician, practitioner or supplier to determine if a service at the Common ProcedureCoding System (HCPCS) level should be billed to the SNF (because it is bundled underSNF PPS) or to the carrier (because it is separately payable).
We believe that enforcement of longstanding policy through the CWF edits,combined with ongoing provider education efforts, will greatly reduce the problemscreated by failure of suppliers to seek payment from SNFs for services for which theSNF is being paid as part of SNF PPS.
Finally, CMS has made significant strides in its oversight of the SNF PPS through aprogram safeguard contract that examines the minimum data set 2.0 residentassessment data, including some on-sight reviews at nursing homes.
Management Issue #4:Medicaid Payment Systems
Management Challenge
Accuracy in the federal share of Medicaid costs is important to help ensure fairnessacross all state Medicaid programs as well as assure these federal health care dollarsreach and achieve their maximum intended health care purposes. The OIG found thatsome states inappropriately inflated the federal share of Medicaid by billions of dollarsby requiring public providers to return Medicaid payments to the state governmentsthrough intergovernmental transfers. Once the payments were returned, the states usedthe funds for other purposes, some of which were unrelated to Medicaid. Although thisabusive practice could potentially occur with any type of Medicaid payment to publicfacilities, OIG identified this practice in two types of payments: (1) Medicaid enhancedpayments available under upper payment limits (UPL) and (2) Medicaid disproportionateshare hospital (DSH) payments.
Assessment of Progress in Addressing the Challenge
To curb abuses and ensure that state Medicaid payment systems promote economy andefficiency, CMS issued final rules, effective March 13, 2001 and May 14, 2002, whichmodified upper payment limit regulations in accordance with the Benefits Improvementand Protection Act of 2000. The regulatory action created three aggregate upper pay-ment limits—one each for private, state, and non-state government-operated facilities.The new regulations will be gradually phased in and become fully effective on October1, 2008. The CMS projected that these revisions would save $90 billion in federalMedicaid funds over the next 10 years.
The OIG commends CMS for changing the upper payment limit regulations. However,when fully implemented, these changes will only limit, not eliminate, the amount of statefinancial manipulation of the Medicaid program because the regulations do not requirethat the targeted facilities retain the enhanced funds to provide medical services to
135
OTHER CONGRESSIONAL REPORTS

Medicaid beneficiaries. The OIG also believes that the transition periods included in theregulations are longer than needed for states to adjust their financial operations.
The CMS intends to develop regulations that will outline accountability standardsthat states must address when making DSH expenditures. The OIG is continuing auditwork on Medicaid DSH payments and will recommend program improvements once thework is completed.
Management’s Comments in Brief
The CMS and the OIG have worked closely on analyzing the effects of the upperpayment limit issue and regulations and plan to continue this effort. We also note thatCMS has limited control over the length of the transition periods. The two and five-yeartransition periods were adopted pursuant to notice and comment rulemaking. TheBenefits Improvement and Protection Act of 2000 further extended the transition periodsby mandating the 8-year transition period.
Management Issue #5:Accuracy of Medicare Fee-for-Service Payments
Management Challenge
To help ensure the financial integrity of the Medicare program, continued access toMedicare benefits, as well as the long-term viability of the Medicare trust fund, itcontinues to be essential that documented and accurate bills are submitted for correctpayment for properly rendered health care services. Based on a statistical sample, OIGestimated that improper Medicare benefit payments made during FY 2001 totaled $12.1billion, or about 6.3 percent of the $191.8 billion in processed fee-for-service paymentsreported by CMS. These improper payments, as in past years, could range fromreimbursement for services provided but inadequately documented to inadvertentmistakes to outright fraud and abuse. When these claims were submitted for payment toMedicare contractors, they contained no visible errors. The overwhelming majority (97percent) of the improper payments were detected though medical record reviews. Whilethe OIG’s 6-year analysis indicates continuing progress in reducing improper payments,unsupported and medically unnecessary services remain pervasive problems.
In addition to determining the overall Medicare error rate, we have conductedtargeted audits and inspections to identify improper payments and problem areas inspecific parts of the program. These reviews have included analyzing duplicatepayments for the same service, payments made on behalf of deceased beneficiaries, andpayments made for incarcerated beneficiaries. We have also determined payment errorrates for specific supplies and services. For example, in a study of Medicare paymentsfor orthotics, we found that 30 percent of orthotic claims in 1998 were inappropriatelycoded and therefore should not have been paid. We also found that in 1997, orders for25 percent of sampled claims for blood glucose test strips failed to establish
136
OTHER CONGRESSIONAL REPORTS

beneficiaries’ eligibility for the supplies. Additionally, in a review of 1998 home healthservices, we found an improper payment rate of 19 percent. Another review found that24 percent of the total allowed amount of Part B therapy in 1999 was paid in error.Finally, we found that 27 percent of Part B mental health services provided in nursinghomes in 1999 were unnecessary and lacked any psychiatric documentation. We willcontinue these targeted reviews to ensure that Medicare payments are made inaccordance with program rules.
Assessment of Progress in Addressing the Challenge
The FY 2001 error rate is less than half of the 13.8 percent reported for FY 1996. Webelieve that since we developed the first error rate, CMS has demonstrated continuedvigilance in monitoring the error rate and developing appropriate corrective actionplans. In addition, due to CMS’ work with the provider community to clarifyreimbursement rules and to impress upon health care providers the importance of fullydocumented services, the overwhelming majority of health care providers followMedicare reimbursement rules and bill correctly. In FY 2003, CMS will fully implementits Comprehensive Error Rate Testing (CERT) program to produce a Medicare fee-for-service error rate. CMS intends to run the CERT program in parallel with OIG’s CFOaudit for at least one year. After that time, OIG will continue to oversee this effort. TheOIG will also continue targeted reviews of specific benefits where vulnerabilities havebeen identified to determine inappropriate payments in these areas.
Management’s Comments in Brief
The CMS concurs with the OIG’s assessment. In FY 1996, the OIG began estimating thenational Medicare fee-for-service paid claims error rate. By FY 2000, the error rate wascut in half due in part to CMS’s corrective actions which enhanced internal pre- andpost-payment controls; targeted vulnerable program areas; and educated providersregarding documentation guidelines and common billing errors.
Since the OIG’s error rate measure is valid only at the national level, CMS has beendeveloping a new, more precise measure for use in the future. In May 2000, CMSawarded a Program Safeguard Contractor contract to implement the CERT program. TheCERT program will produce national, contractor specific, and benefit category specificfee-for-service paid claims error rates. The CERT program began to be phased in startingin FY 2001. All contractors will be included in the CERT process by the end of FY 2002.The CMS is scheduled to replace the OIG fee-for-service error rate with CERT in FY 2003.
Management Issue #6: Medicare Contractors
Management Challenge
Because of the crucial role Medicare contractors play in helping facilitate efficient andeffective health care delivery to 39.5 million Medicare beneficiaries, it is important thatthey be held accountable for their role in the health care financing and delivery system.For several years, OIG has been concerned about Medicare contractors’ financial
137
OTHER CONGRESSIONAL REPORTS

management problems, such as accounts receivable documentation inadequacies andthe lack of integrated dual-entry accounting systems; information systems controlweaknesses; integrity issues; and weaknesses in the way they assign and maintainprovider numbers so as to better safeguard the program and its funds. These failurescould contribute to loss of program funds; improper payments; and manipulation, fraud,and abuse.
Contractor integrity continues to be an issue, and the potential for fraud exists.Since 1993, there have been 15 separate settlements or agreements (criminal and civil)involving Medicare contractors, resulting in over $400 million in HHS recoveries foralleged improper operations. In the last year alone, the OIG has identified contractorintegrity problems which include a contractor who agreed to pay $76 million to settleallegations of misconduct while acting as a Medicare Part B carrier between 1966 and1998. Among other things, the contractor had failed to process claims properly, thensubmitted false information to CMS regarding the accuracy and timeliness with which ithandled those claims. In addition, a former Medicare fiscal intermediary agreed to pay$9.3 million to resolve its potential liability under the False Claims Act and CivilMonetary Penalties Law for allegedly falsifying data regarding its performance onMedicare cost reports.
Assessment of Progress in Addressing the Challenge
The OIG expressed an unqualified opinion on the CMS FY 1999 through 2001 financialstatements largely because CMS continued to contract for validation and documentationof accounts receivable. However, once again OIG’s FY 2001 financial statement auditdisclosed that the lack of a fully integrated financial management system continued toimpair the reporting of accurate financial information. To address these problems, CMShas initiated steps to implement the Healthcare Integrated General Ledger AccountingSystem (HIGLAS), expected to be fully operational at the end of FY 2007.
The FY 2001 reviews of information systems controls also disclosed numerous andcontinuing weaknesses at Medicare contractors, as well as application controlweaknesses in contractors’ shared systems. These vulnerabilities do not effectivelyprevent unauthorized access, malicious changes, improper Medicare payments, orcritical operation disruptions. Corrective action is needed to address the fundamentalcauses of control weaknesses.
Management’s Comments in Brief
The CMS concurs with the OIG’s assessment and has been constantly striving to improveMedicare contractor financial management weaknesses. The CMS has made significantimprovements in this area over the last few years as evident by the unqualified opinionson the CMS fiscal years 1999, 2000, 2001, and 2002 financial statements. The CMS longterm solution for addressing many of these issues is the HIGLAS.
We have procured a systems integrator to implement HIGLAS and have initiatedimplementation of an approved Joint Financial Management Improvement Programcommercial off-the-shelf product at two Medicare contractor pilot sites.
138
OTHER CONGRESSIONAL REPORTS

We also continue to validate the Medicare contractors’ financial reporting bycontracting with Certified Public Accounting (CPA) firms to conduct Statement ofAuditing Standards (SAS) 70 internal control reviews and accounts receivable consultingreviews. The SAS 70 reviews concentrate on the functional areas of Electronic DataProcessing (EDP) claims processing, financial management, and debt collection. Theaccounts receivable reviews ascertain the accuracy and completeness of the accountsreceivable activity. Until HIGLAS is fully implemented, CMS will continue to rely onthese on-going activities aimed at compensating for the lack of a modernized system.The CMS has also continued to revise and clarify financial reporting and debt collectionpolicies and procedures based on various audit and review findings.
Our comprehensive systems security program includes the operations of ourMedicare fee-for-service contractors. A key feature of the program for the Medicarecontractors was the development and dissemination of codified core securityrequirements (CSRs). During FY 2002, CMS received each Medicare contractor's secondannual assessment of their compliance against the CSRs. Along with an independentcontractor, CMS is completing its final evaluation of each Medicare contractorsubmission. The CMS requested, received, and distributed $9.7 million in additionalFY 2002 funding for proposed safeguards and corrective actions. These safeguards andactions will be implemented throughout FY 2003. The CMS will continue to fundneeded safeguards in future years, to the extent of available resources.
139
OTHER CONGRESSIONAL REPORTS
A
Accrual Accounting: A basis of accounting that recognizes costs when incurred andrevenues when earned and includes the effect of accounts receivable and accountspayable when determining annual net income.
Actuarial Soundness: A measure of the adequacy of Hospital Insurance andSupplementary Medical Insurance financing as determined by the difference betweentrust fund assets and liabilities for specified periods.
Administrative Costs: General term that refers to Medicare and Medicaid administrativecosts, as well as CMS administrative costs. Medicare administrative costs are comprisedof the Medicare related outlays and non-CMS administrative outlays. Medicaidadministrative costs refer to the Federal share of the States’ expenditures foradministration of the Medicaid program. The CMS administrative costs are the costs ofoperating CMS (e.g., salaries and expenses, facilities, equipment, rent and utilities).These costs are accounted for in the Program Management account.
B
Balanced Budget Act of 1997 (BBA): Major provisions provided for the State Children’sHealth Insurance Program, Medicare+Choice, and expansion of preventive benefits.
Beneficiary: A person entitled under the law to receive Medicare or Medicaid benefits(also referred to as an enrollee).
140
GLOSSARY
GlossaryGlossary

Benefit Payments: Funds outlayed or expenses accrued for services delivered tobeneficiaries.
C
Carrier: A private business, typically an insurance company, that contracts with CMS toreceive, review, and pay physician and supplier claims.
Cash Basis Accounting: A basis of accounting that tracks outlays or expendituresduring the current period regardless of the fiscal year the service was provided or theexpenditure was incurred.
Clinical Laboratory Improvement Amendments of 1988 (CLIA): Requires anylaboratory that performs testing on specimens derived from humans to meet therequirements established by the Department of Health and Human Services and have ineffect an applicable certificate.
Cost-Based Health Maintenance Organization (HMO/Competitive Medical Plan, CMP):A type of managed care organization that will pay for all of the enrollees/members’medical care costs in return for a monthly premium, plus any applicable deductible orco-payment. The HMO will pay for all hospital costs (generally referred to as Part A) andphysician costs (generally referred to as Part B) that it has arranged for and ordered.Like a health care prepayment plan (HCPP), except for out-of-area emergency services, ifa Medicare member/enrollee chooses to obtain services that have not been arranged forby the HMO, he/she is liable for any applicable deductible and co-insurance amounts,with the balance to be paid by the regional Medicare intermediary and/or carrier.
D
Demonstrations: Projects and contracts that CMS has signed with various health careorganizations. These contracts allow CMS to test various or specific attributes such aspayment methodologies, preventive care, and social care, and to determine if suchprojects/pilots should be continued or expanded to meet the health care needs of theNation. Demonstrations are used to evaluate the effects and impact of various healthcare initiatives and the cost implications to the public.
Discretionary Spending: Outlays of funds subject to the Federal appropriations process.
Disproportionate Share Hospital (DSH): A hospital with a disproportionately largeshare of low-income patients. Under Medicaid, States augment payment to thesehospitals. Medicare inpatient hospital payments are also adjusted for this added burden.
141
GLOSSARY

Durable Medical Equipment (DME): Purchased or rented items such as hospital beds,wheelchairs, or oxygen equipment used in a patient’s home.
Durable Medical Equipment Regional Carrier (DMERC): A company that contracts toprocess Medicare claims for purchased or rented items such as hospital beds, wheel-chairs, or oxygen equipment used in a patient’s home.
E
Expenditure: Expenditure refers to budgeted funds actually spent. When used in thediscussion of the Medicaid program, expenditures refer to funds actually spent asreported by the States. This term is used interchangeably with Outlays.
Expense: An outlay or an accrued liability for services incurred in the current period.
F
Federal General Revenues: Federal tax revenues (principally individual and businessincome taxes) not identified for a particular use.
Federal Insurance Contribution Act (FICA) Payroll Tax: Medicare’s share of FICA isused to fund the HI Trust Fund. Employers and employees each contribute 1.45 percentof taxable wages, with no compensation limits, to the HI trust fund.
Federal Medical Assistance Percentage (FMAP): The portion of the Medicaid programthat is paid by the Federal government.
Federal Managers’ Financial Integrity Act (FMFIA): A program that identifiesmanagement inefficiencies and areas vulnerable to fraud and abuse so that suchweaknesses can be corrected with improved internal controls.
H
Health Care Prepayment Plan (HCPP): A type of managed care organization. In returnfor a monthly premium, plus any applicable deductible or co-payment, all or most of anindividual’s physician services will be provided by the HCPP. The HCPP will pay for allservices it has arranged for (and any emergency services) whether provided by its ownphysicians or its contracted network of physicians. If a member enrolled in an HCPPchooses to receive services that have not been arranged for by the HCPP, he/she is
142
GLOSSARY

liable for any applicable Medicare deductible and/or coinsurance amounts, and anybalance would be paid by the regional Medicare carrier.
Health Insurance Portability and Accountability Act of 1996 (HIPAA): Majorprovisions include portability provisions for group and individual health insurance,establishes the Medicare Integrity Program, and provides for standardization of healthdata and privacy of health records.
Hospital Insurance (HI): The part of Medicare that pays hospital and other institutionalprovider benefit claims, also referred to as Part A.
I
Information Technology (IT): The term commonly applied to maintenance of datathrough computer systems.
Intermediary: A private business, typically an insurance company, that contracts withCMS to process hospital and other institutional provider benefit claims.
Internal Controls: Management systems and policies for reasonably documenting,monitoring, and correcting operational processes to prevent and detect waste and toensure proper payment. Also known as management controls.
M
Mandatory Spending: Outlays for entitlement programs (Medicare and Medicaid) thatare not subject to the Federal appropriations process.
Material Weakness: A serious flaw in management or internal controls requiring high-priority corrective action.
Medicare Current Beneficiary Survey (MCBS): A comprehensive source of informationon the health, health care, and socioeconomic and demographic characteristics of aged,disabled, and institutional Medicare beneficiaries.
Medicare Contractor: A collective term for the carriers and intermediaries who processMedicare claims.
Medicare+Choice: A provision in the BBA that restructures CMS authority to contractwith a variety of managed care entities, including health maintenance organizations(HMO) and Competitive Medical Plans (CMP), both of which were previously allowed
143
GLOSSARY
to participate in Medicare, as well as preferred provider organizations (PPO) andpreferred supplier organizations (PSO), religious fraternal benefit society plans, privatefee-for-service-plans, and medical saving accounts (MSAs), for which the BBAauthorizes a special demonstration for up to 390,000 beneficiaries.
Medicare Integrity Program (MIP): A provision in HIPAA that sets up a revolving fundto support the CMS program integrity program.
Medicare Trust Funds: Treasury accounts established by the Social Security Act for thereceipt of revenues, maintenance of reserves, and disbursement of payments for the HIand SMI programs.
Medical Review/Utilization Review (MR/UR): Contractor reviews of Medicare claimsto ensure that the service was necessary and appropriate.
Medicare Secondary Payer (MSP): A statutory requirement that private insurers whoprovide general health insurance coverage to Medicare beneficiaries must paybeneficiary claims as primary payers.
O
Obligation: Budgeted funds committed to be spent.
Outlay: Budgeted funds actually spent. When used in the discussion of the Medicaidprogram, outlays refer to amounts advanced to the States for Medicaid benefits.
P
Part A: The part of Medicare that pays hospital and other institutional provider benefitclaims, also referred to as Medicare Hospital Insurance or “HI.”
Part B: The part of Medicare that pays physician and supplier claims, also referred to asMedicare Supplementary Medical Insurance or “SMI.”
Payment Safeguards: Activities to prevent and recover inappropriate Medicare benefitpayments, including MSP, MR/UR, provider audits, and fraud and abuse detection.
Program Management: The CMS operational account. Program Management suppliesCMS with the resources to administer Medicare, the Federal portion of Medicaid, andother CMS responsibilities. The components of Program Management are: Medicarecontractors, survey and certification, research, and administrative costs.
144
GLOSSARY

145
GLOSSARY
Provider: A health care professional or organization that provides medical services.
Q
Quality Improvement Organizations: Formerly known as Peer Review Organizations(PROs), QIOs monitor the quality of care provided to Medicare beneficiaries to ensurethat health care services are medically necessary, appropriate, provided in a propersetting, and is of acceptable quality.
R
Recipient: An individual covered by the Medicaid program (also referred to as abeneficiary).
Risk-Based Health Maintenance Organization (HMO)/Competitive Medical Plan (CMP):A type of managed care organization. After any applicable deductible or co-payment, allof an enrollee/member’s medical care costs are paid for in return for a monthlypremium. However, due to the ”lock-in” provision, all of the enrollee/member’s services (except for out-of-area emergency services) must be arranged for by the riskHMO. Should the Medicare enrollee/member choose to obtain service not arranged for by the plan, he/she will be liable for the costs. Neither the HMO nor the Medicareprogram will pay for services from providers that are not part of the HMO’s health caresystem/network.
Revenue: The recognition of income earned and the use of appropriated capital fromthe rendering of services in the current period.
S
Self Employment Contribution Act (SECA) Payroll Tax: Medicare’s share of SECA isused to fund the HI trust fund. Self-employed individuals contribute 2.9 percent oftaxable annual net income, with no limitation.
State Certification: Inspections of Medicare provider facilities to ensure compliancewith Federal health, safety, and program standards.
State Children’s Health Insurance Program (SCHIP) (also known as Title XXI):A provision of the BBA that provides federal funding through CMS to States so that theycan expand child health assistance to uninsured, low-income children.
Supplementary Medical Insurance (SMI): The part of Medicare that pays physicianand supplier claims, also referred to as Part B.
T
Ticket to Work and Work Incentives Improvement Act of 1999: This legislationamends the Social Security Act and increases beneficiary choice in obtainingrehabilitation and vocational services, removes barriers that require people withdisabilities to choose between health care coverage and work, and assures that disabledAmericans have the opportunity to participate in the workforce.
1460
GLOSSARY
Michelle SnyderChief Financial Officer and Director,Office of Financial Management
Lee MosedaleDeputy Director,Office of Financial Management
Marvin Washington, CPADirector, Division of FinancialReporting and Debt Referral
Maria Montilla, CPADirector, Division of Financial Oversight
Kurt PleinesDirector,Division of Accounting Systems
For additional information on the following, please call or email:
Financial ReportJulie Frank, CPA(410) [email protected]
Paul Konka(410) [email protected]
Financial Statement PreparationMargaret Bone(410) [email protected]
Robert Fox, CPA(410) [email protected]
Deborah Taylor, CPADeputy Chief Financial Officer and Director,Accounting Management Group
Richard FosterChief Actuary
Jeff Chaney, CPADeputy Director,Accounting Management Group
Dennis CzulewiczDirector,Division of Accounting Operations
Karen FediActing Director,Division of Premium Billingand Collections
Healthcare Integrated GeneralLedger Accounting System ProjectJohn Moeller(410) [email protected]
Performance MeasuresHarriet Rubinson(410) [email protected]
More information relating to CMS is available at www.cms.hhs.gov.
The CMS welcomes comments andsuggestions on both the content andpresentation of this report. Please sendthem to Paul Konka by email orCMS, Mail Stop C3-13-08, 7500 SecurityBlvd., Baltimore, MD 21244-1850.
147
CMS KEY FINANCIALMANAGEMENT OFFICIALS

U.S. Department of Health and Human ServicesTommy G. Thompson, Secretary
Centers for Medicare & Medicaid ServicesThomas A. Scully, Administrator
The Chief Financial Officers (CFO) Act of 1990 (P.L. 101-576) marks a major effortto improve U.S. Government financial management and accountability. In pursuitof this goal, the Act instituted a new Federal financial management structure and
process modeled on private sector practices. It also established in all major agencies theposition of Chief Financial Officer with responsibilities including annual publication offinancial statements and an accompanying report. The form and content of thisFinancial Report follows guidance provided by the Department of Health and HumanServices, the Office of Management and Budget, and the General Accounting Office. Itreflects the Centers for Medicare & Medicaid Services’s support of the spirit andrequirements of the CFO Act and our continuing commitment to improve agencyfinancial reporting.
U.S. Department of Health and Human ServicesCenters for Medicare & Medicaid Services7500 Security BoulevardBaltimore, Maryland 21244-1850

U.S. Department of Health & Human ServicesCenters for Medicare & Medicaid Services
7500 Security BoulevardBaltimore, MD 21244-1850
www.cms.hhs.govwww.medicare.gov


![CMS Opioid Strategy - ONCCMS Opioid Strategy Center for Medicare & Medicaid Innovation (CMMI) Centers for Medicare & Medicaid Services (CMS) 1 • “The purpose of the [Center] is](https://static.documents.pub/doc/80x56/5f0adfe47e708231d42dc487/cms-opioid-strategy-onc-cms-opioid-strategy-center-for-medicare-medicaid.jpg)


