Available on CMS information server CMS DP -2017/026 CMS Performance Note 16 July 2017 (v2, 17 July 2017) W and top tagging scale factors CMS Collaboration Abstract This note presents an improved determination of the efficiency and data/MC scale factors for the identification of hadronically decaying top quarks using the full 2016 CMS dataset. Also shown is an improved measurement of the W boson tagging performance using the full 2016 CMS dataset. Finally methods for the extraction of W tagging scale factors at high transverse momentum using fully merged top quarks are shown.
Transcript
Available on CMS information server CMS DP -2017/026
CMS Performance Note
16 July 2017 (v2, 17 July 2017)
W and top tagging scale factorsCMS Collaboration
Abstract
This note presents an improved determination of the efficiency and data/MC scale factors for theidentification of hadronically decaying top quarks using the full 2016 CMS dataset. Also shown is animproved measurement of the W boson tagging performance using the full 2016 CMS dataset. Finallymethods for the extraction of W tagging scale factors at high transverse momentum using fully mergedtop quarks are shown.
W and top tagging scale factors
CMS Collaboration
1
Overview
• Update of top tagging scale factors (data/MC)
• Update of W tagging scale factors (data/MC)
• W tagging scale factor from fully merged tops (MC only)
!2
!3
Update of top tagging scale factors
!4
abstract
This note presents a measurement of top tagging efficiencies and data-to-simulation scale factors with the full dataset recorded in the year 2016 with the CMS detector. The used top tagger is based on the soft drop mass and the N-subjettiness τN [1] of large anti-kT jets.
The measurement is carried out by using a tag and probe method in the muon+jets channel in a sample enriched with events from tt production. The muon and a b-tagged small-radius jet serve as probe, the tag is applied on anti-kT jets with a distance parameter of
0.8, soft drop grooming and the PUPPI pile-up correction. The tt simulation is divided into contributions from fully merged, semi-merged and non-merged hadronic top quark decays. A template fit is performed to evaluate the corresponding efficiencies.
References: [1] J. Thaler and K. Van Tilburg, “Identifying boosted objects with N-subjettiness”, JHEP 03 (2011) 015, doi:10.1007/JHEP03(2011)015, arXiv:1011.2268
!5
Probe jet pT and τ3/τ2
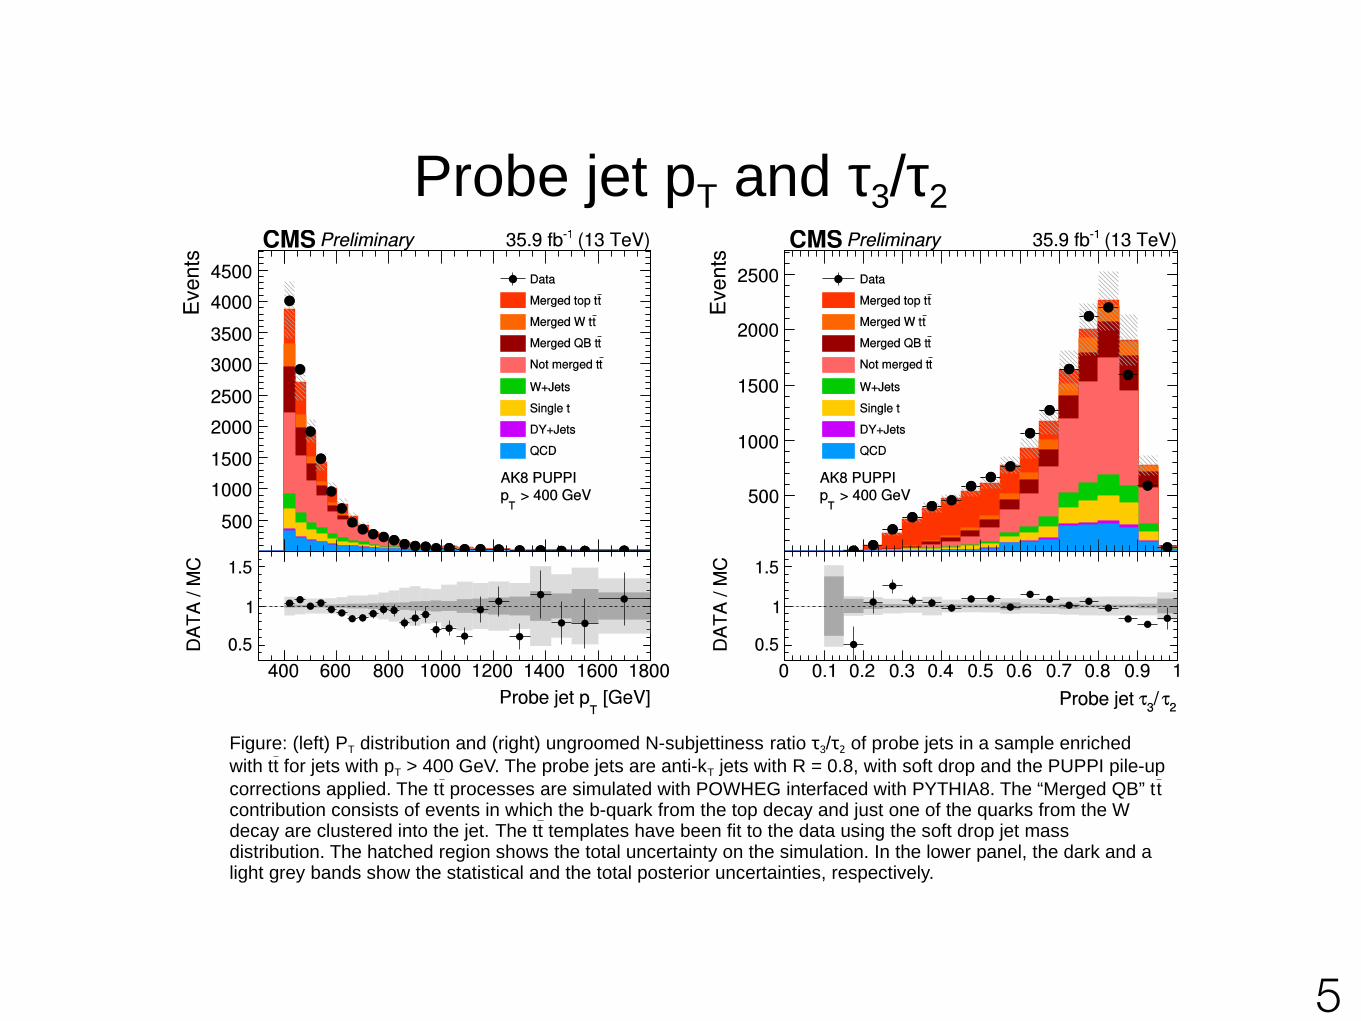
Figure: (left) PT distribution and (right) ungroomed N-subjettiness ratio τ3/τ2 of probe jets in a sample enriched
with tt for jets with pT > 400 GeV. The probe jets are anti-kT jets with R = 0.8, with soft drop and the PUPPI pile-up
corrections applied. The tt processes are simulated with POWHEG interfaced with PYTHIA8. The “Merged QB” tt contribution consists of events in which the b-quark from the top decay and just one of the quarks from the W decay are clustered into the jet. The tt templates have been fit to the data using the soft drop jet mass distribution. The hatched region shows the total uncertainty on the simulation. In the lower panel, the dark and a light grey bands show the statistical and the total posterior uncertainties, respectively.
!6
Soft drop mass distribution
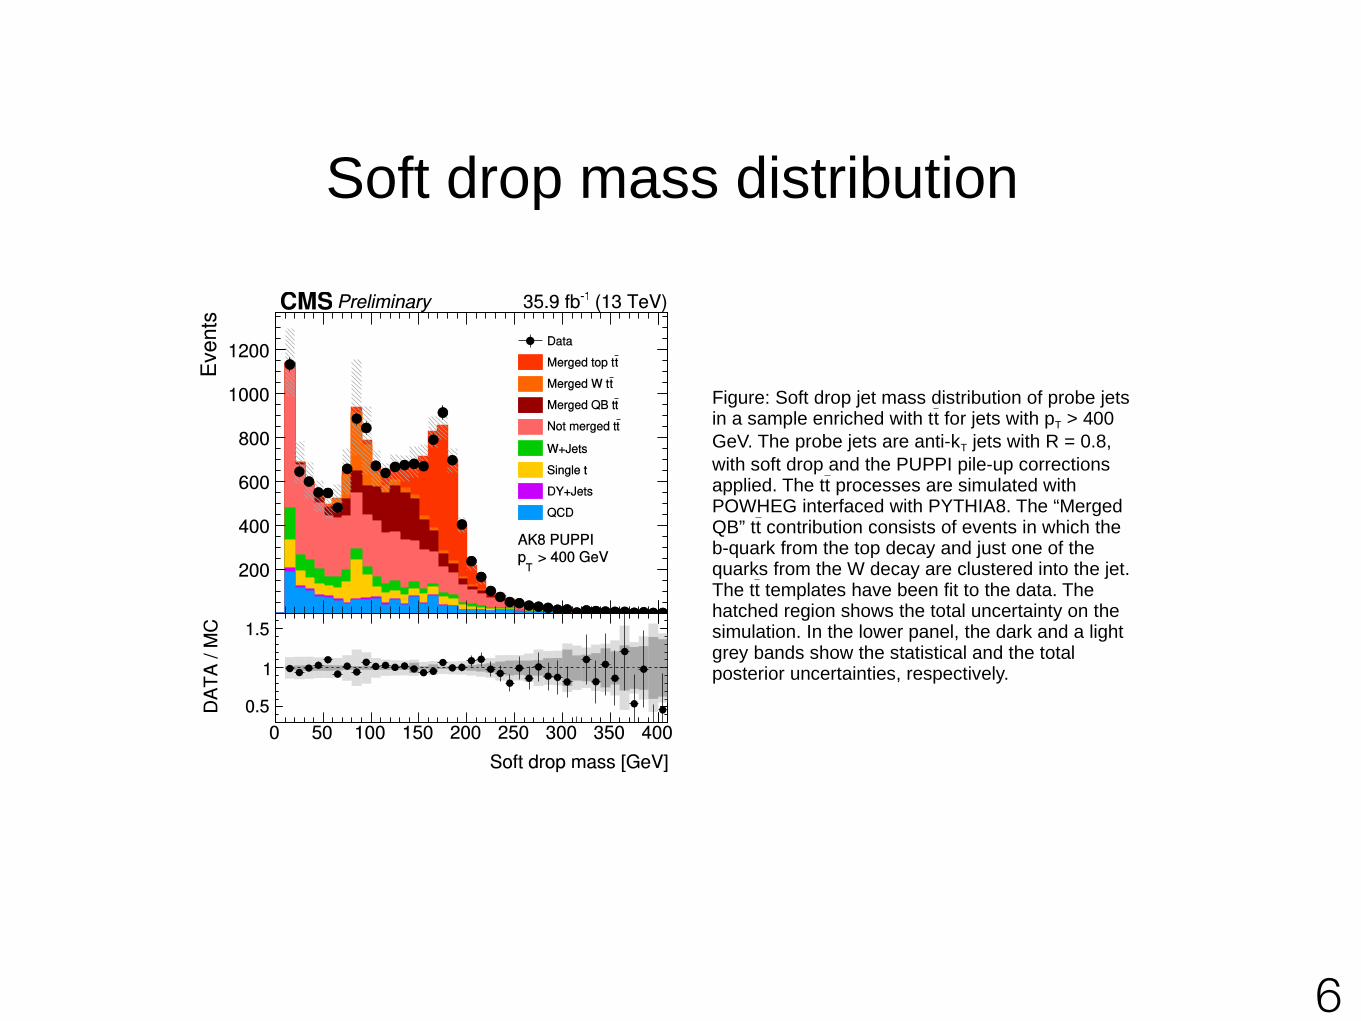
Figure: Soft drop jet mass distribution of probe jets in a sample enriched with tt for jets with pT > 400
GeV. The probe jets are anti-kT jets with R = 0.8,
with soft drop and the PUPPI pile-up corrections applied. The tt processes are simulated with POWHEG interfaced with PYTHIA8. The “Merged QB” tt contribution consists of events in which the b-quark from the top decay and just one of the quarks from the W decay are clustered into the jet. The tt templates have been fit to the data. The hatched region shows the total uncertainty on the simulation. In the lower panel, the dark and a light grey bands show the statistical and the total posterior uncertainties, respectively.
!7
Soft drop mass – pass and fail
Figure: Soft drop jet mass distribution of probe jets in a sample enriched with tt for jets with pT > 400 GeV, which
pass (left figure) and fail (right figure) the ungroomed N-subjettiness requirement of τ3/τ2 < 0.54. The probe jets
are anti-kT jets with R = 0.8, with soft drop and the PUPPI pile-up corrections applied. The tt processes are
simulated with POWHEG interfaced with PYTHIA8. The “Merged QB” tt contribution consists of events in which the b-quark from the top decay and just one of the quarks from the W decay are clustered into the jet. The tt templates have been fit to the data. The hatched region shows the total uncertainty on the simulation. In the lower panel, the dark and a light grey bands show the statistical and the total posterior uncertainties, respectively.
!8
Top tagging efficiency (no mass cut)
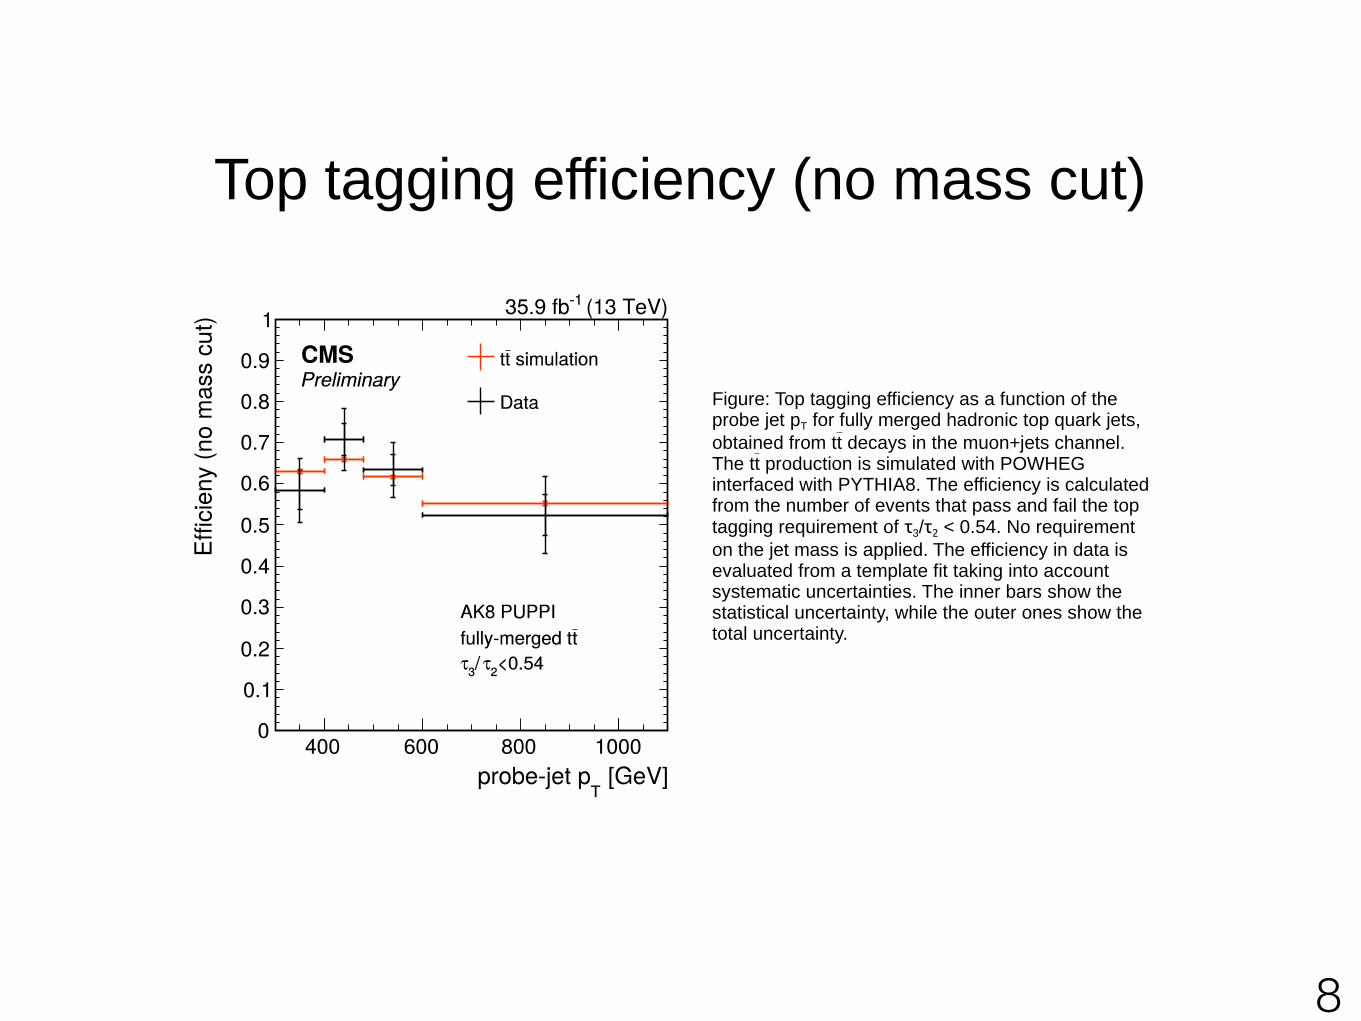
Figure: Top tagging efficiency as a function of the probe jet pT for fully merged hadronic top quark jets,
obtained from tt decays in the muon+jets channel. The tt production is simulated with POWHEG interfaced with PYTHIA8. The efficiency is calculated from the number of events that pass and fail the top tagging requirement of τ3/τ2 < 0.54. No requirement
on the jet mass is applied. The efficiency in data is evaluated from a template fit taking into account systematic uncertainties. The inner bars show the statistical uncertainty, while the outer ones show the total uncertainty.
!9
Mass cut efficiency
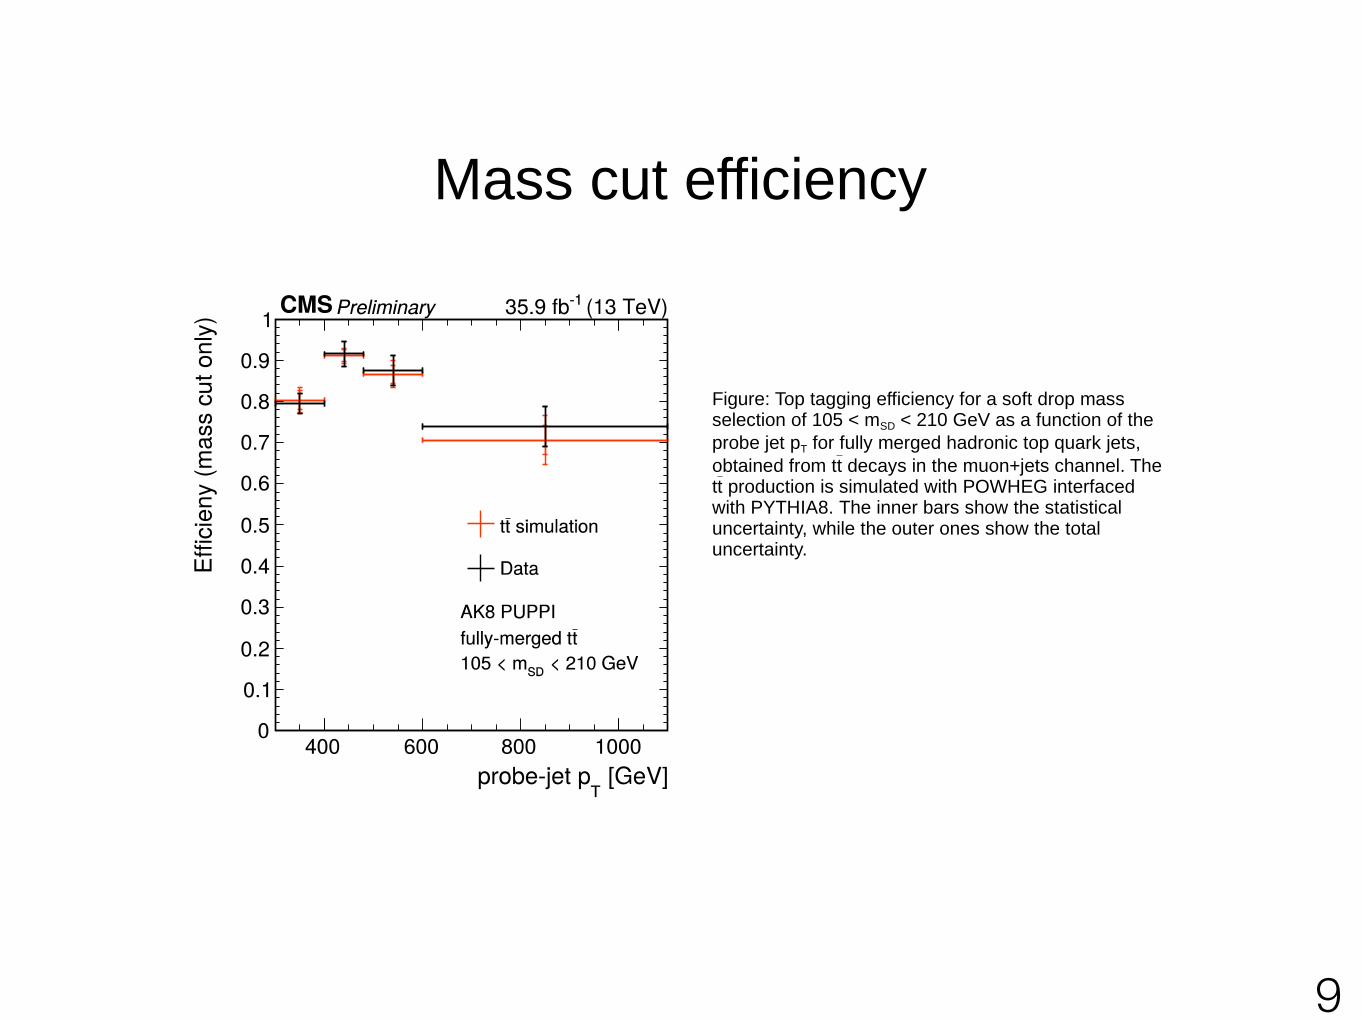
Figure: Top tagging efficiency for a soft drop mass selection of 105 < mSD < 210 GeV as a function of the
probe jet pT for fully merged hadronic top quark jets,
obtained from tt decays in the muon+jets channel. The tt production is simulated with POWHEG interfaced with PYTHIA8. The inner bars show the statistical uncertainty, while the outer ones show the total uncertainty.
!10
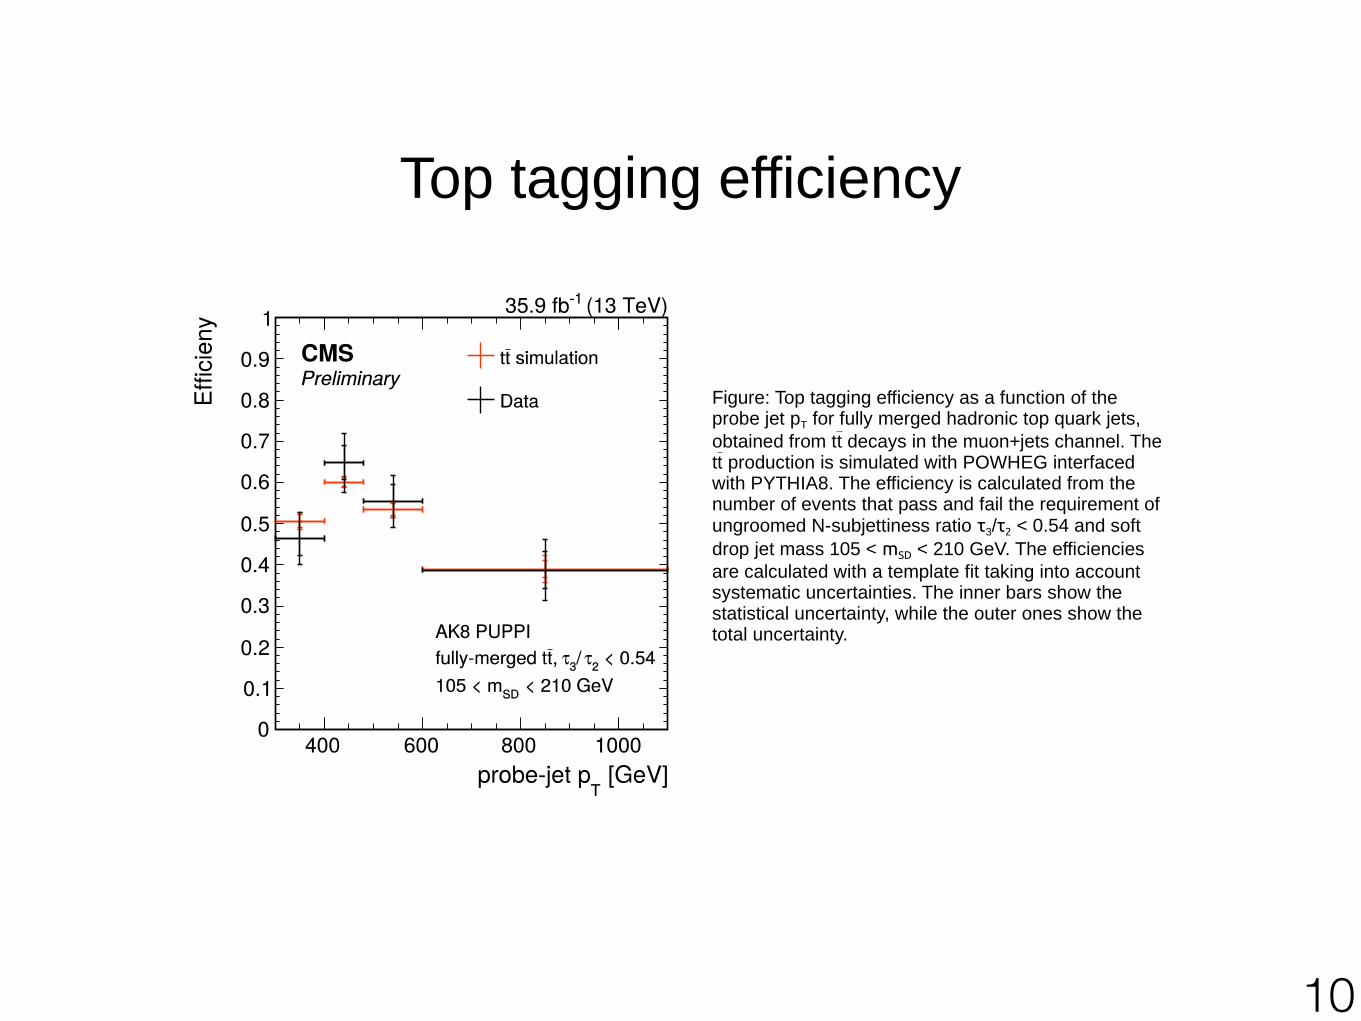
Top tagging efficiency
Figure: Top tagging efficiency as a function of the probe jet pT for fully merged hadronic top quark jets,
obtained from tt decays in the muon+jets channel. The tt production is simulated with POWHEG interfaced with PYTHIA8. The efficiency is calculated from the number of events that pass and fail the requirement of ungroomed N-subjettiness ratio τ3/τ2 < 0.54 and soft
drop jet mass 105 < mSD < 210 GeV. The efficiencies
are calculated with a template fit taking into account systematic uncertainties. The inner bars show the statistical uncertainty, while the outer ones show the total uncertainty.
!11
Top tagging scale factors
Figure: Data-to-simulation scale factors as a function of the probe jet pT for fully merged hadronic top quark
jets, obtained from tt decays in the muon+jets channel. The tt production is simulated with POWHEG interfaced with PYTHIA8. The scale factors are calculated for jets with a top-tag requirement of ungroomed N-subjettiness ratio τ3/τ2 < 0.54 and soft
drop jet mass 105 < mSD < 210 GeV. The probe jets are
anti-kT jets with R = 0.8, soft drop and the PUPPI pile-
up correction applied.
Update of W tagging scale factors
!12
Simone Gelli - 2017
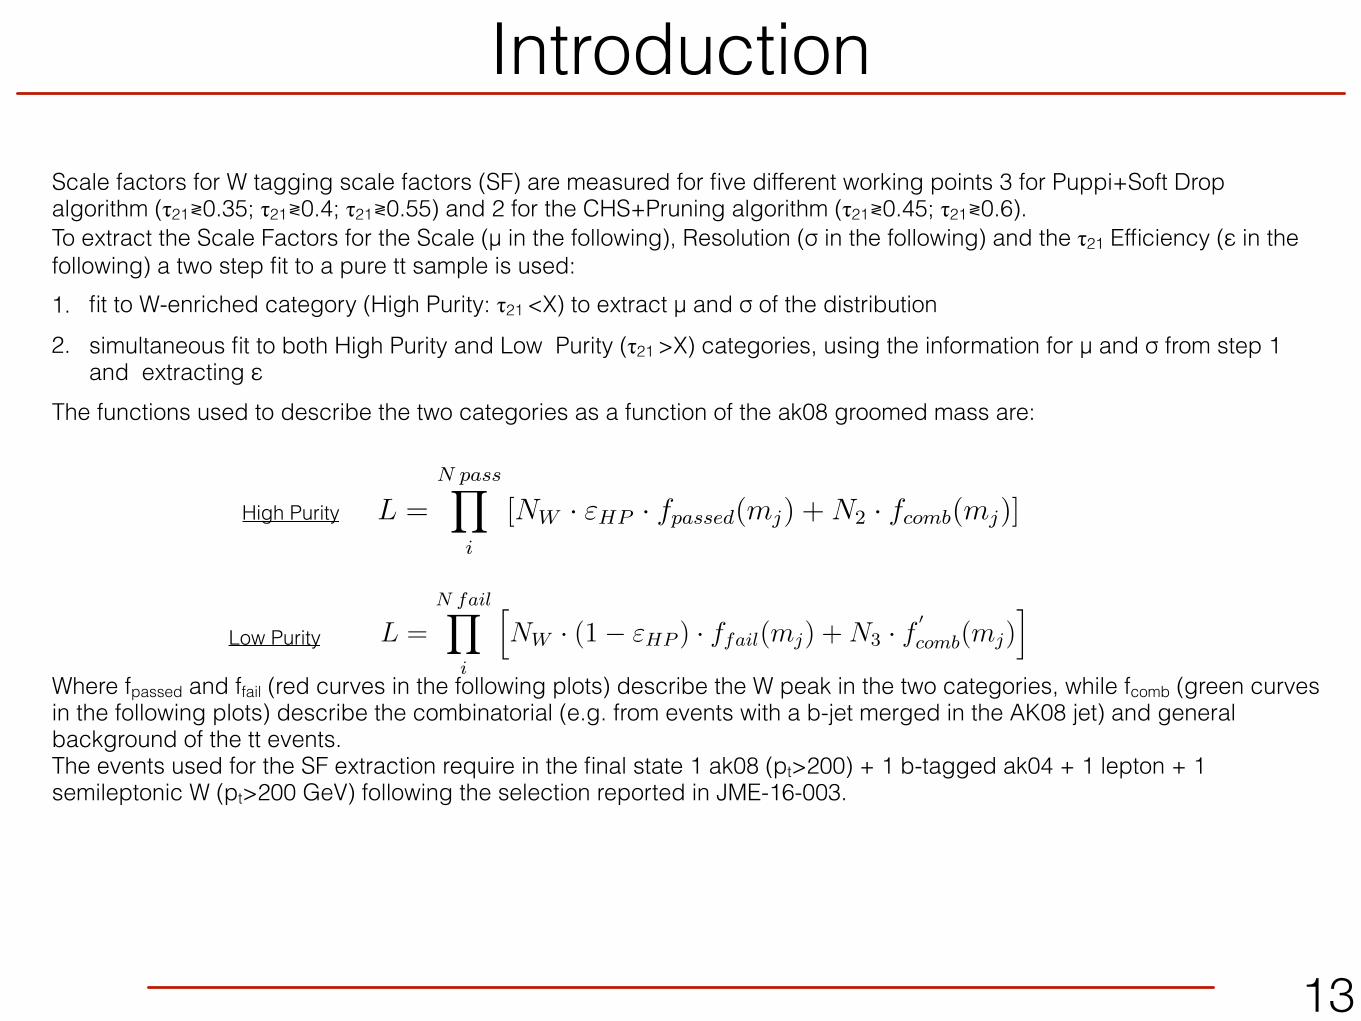
Scale factors for W tagging scale factors (SF) are measured for five different working points 3 for Puppi+Soft Drop algorithm (τ21≷0.35; τ21≷0.4; τ21≷0.55) and 2 for the CHS+Pruning algorithm (τ21≷0.45; τ21≷0.6). To extract the Scale Factors for the Scale (μ in the following), Resolution (σ in the following) and the τ21 Efficiency (ε in the following) a two step fit to a pure tt sample is used: 1. fit to W-enriched category (High Purity: τ21 <X) to extract μ and σ of the distribution 2. simultaneous fit to both High Purity and Low Purity (τ21 >X) categories, using the information for μ and σ from step 1
and extracting ε The functions used to describe the two categories as a function of the ak08 groomed mass are:
Where fpassed and ffail (red curves in the following plots) describe the W peak in the two categories, while fcomb (green curves in the following plots) describe the combinatorial (e.g. from events with a b-jet merged in the AK08 jet) and general background of the tt events. The events used for the SF extraction require in the final state 1 ak08 (pt>200) + 1 b-tagged ak04 + 1 lepton + 1 semileptonic W (pt>200 GeV) following the selection reported in JME-16-003.
with a = (x � x̄)/s. For the fit, its tails are kept contant and fixed to the MC truth value.For the High Purity categories, the function used to fit the background component is alwaysa Chebyshev of the second order. For high Working Points (meaning 0.6 for t21 and 0.55 forPuppi t21), the function used to describe the background in the Low Purity region is:
f LPbkg(x) = ec0x (10)
In the low WP, the shape of the background is very deformed (as shown in the Section 7.1) ,206
in this case, we cannot use a simple descending exponential function. For low Working Points207
(meaning 0.45 for t21 and 0.35/0.4 for Puppi t21), the function used to describe the background208
is:209
210
f LPbkg(x) = ec0x ·
1 + Er f ( (x�a)b
2(11)
where “Erf” is the known Error Function.211
212
8 Results213
For each working point a fit is performed and the scale factors are obtaind doing the ratio be-214
tween the data and the MC value.215
216
After performing the fit the results for all the Working Points are reported in Tab. 9.217
The central value is taken from the results of the fit, while the uncertainties quoted are referred218
to the statistical fit error, PYTHIA/HERWIG discrepancies, DCB/Gauss discrepancies.219
220
8.1 Uncertainties studies221
The final results of this study consists in a set of scale factors for efficiency, mass scale and222
mass resolution. Each number have to take into account the bias introduced by the MC used223
(in this case POWHEG+PYTHIA) and the choice of the signal function.Leading systematic ef-224
fects are due to the simulation of the tt̄ parton showering used to derive the data/MC scale225
τ21 < 0.45 τ21 > 0.45
0 0.1 0.2 0.3 0.4 0.5 0.6 0.7 0.8 0.9 1
Even
ts/5
0
0.2
0.4
0.6
0.8
1
datasignalf MCsignalf
databackgroundf MCbackgroundf
datasignalf MCsignalf
databackgroundf MCbackgroundf
datasignalf MCsignalf
databackgroundf MCbackgroundf
hh
DibosonWJetsSingleTttdata
DibosonWJetsSingleTttdata
DibosonWJetsSingleTttdata
(13 TeV)-135.8 fbPreliminary CMS
DibosonWJetsSingleTttdata
0 0.1 0.2 0.3 0.4 0.5 0.6 0.7 0.8 0.9 1
Even
ts/5
0
0.2
0.4
0.6
0.8
1
datasignalf MCsignalf
databackgroundf MCbackgroundf
datatotf MCtotf
datasignalf MCsignalf
databackgroundf MCbackgroundf
datatotf MCtotf
datasignalf MCsignalf
databackgroundf MCbackgroundf
datatotf MCtotf
hh
DibosonWJetsSingleTttdata
DibosonWJetsSingleTttdata
DibosonWJetsSingleTttdata
(13 TeV)-135.8 fbPreliminary CMS
DibosonWJetsSingleTttdata
0 0.1 0.2 0.3 0.4 0.5 0.6 0.7 0.8 0.9 1
Even
ts/5
0
0.2
0.4
0.6
0.8
1
datasignalf MCsignalf
databackgroundf MCbackgroundf
datasignalf MCsignalf
databackgroundf MCbackgroundf
datasignalf MCsignalf
databackgroundf MCbackgroundf
hh
DibosonWJetsSingleTttdata
DibosonWJetsSingleTttdata
DibosonWJetsSingleTttdata
(13 TeV)-135.8 fbPreliminary CMS
DibosonWJetsSingleTttdata
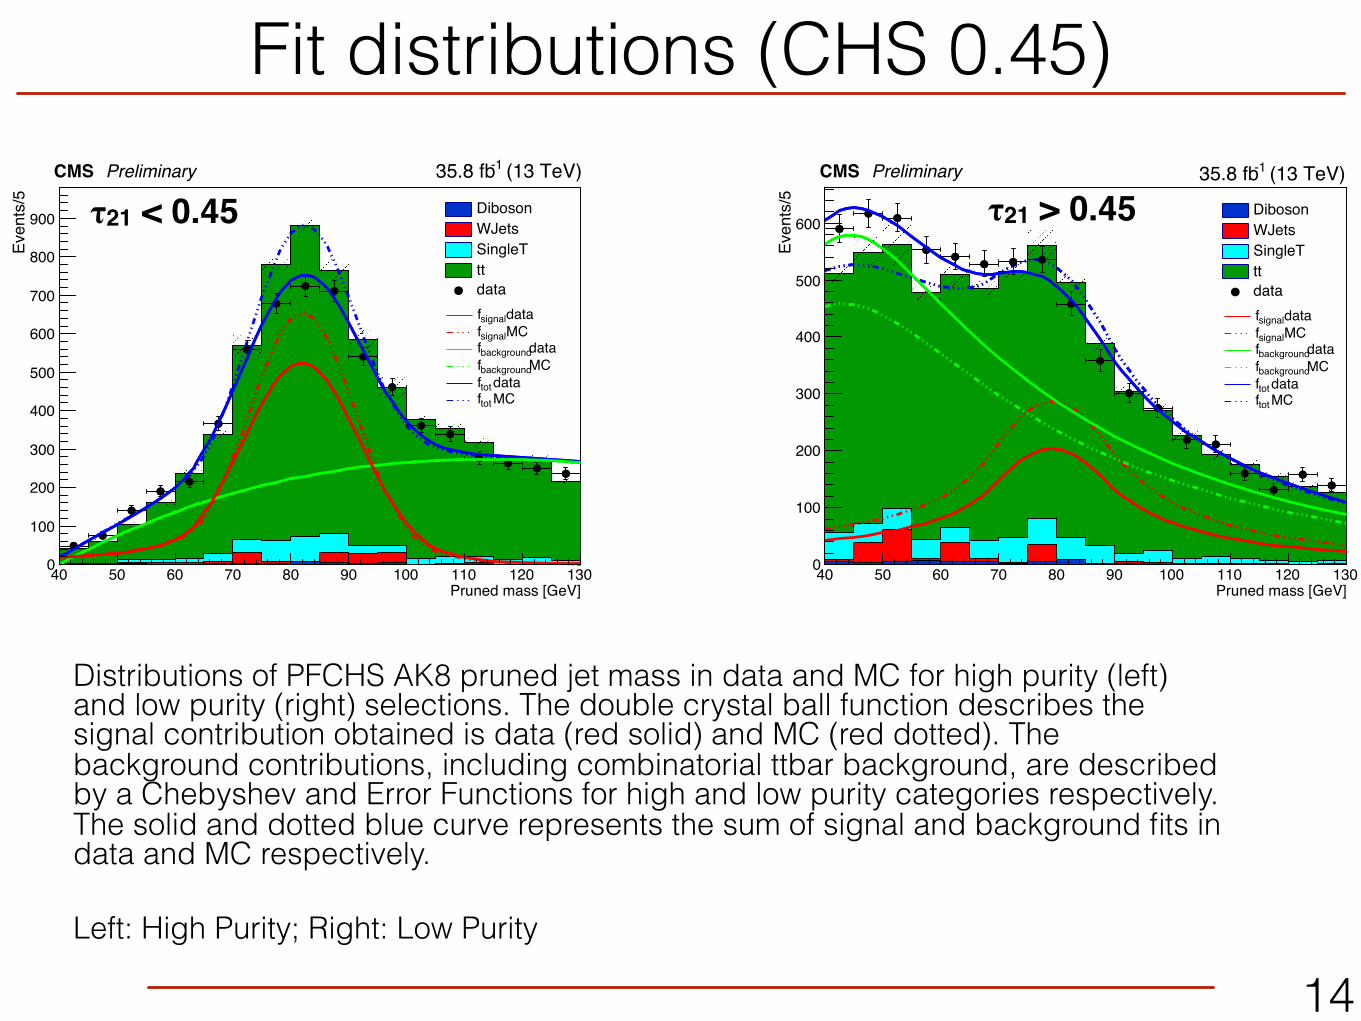
Distributions of PFCHS AK8 pruned jet mass in data and MC for high purity (left) and low purity (right) selections. The double crystal ball function describes the signal contribution obtained is data (red solid) and MC (red dotted). The background contributions, including combinatorial ttbar background, are described by a Chebyshev and Error Functions for high and low purity categories respectively. The solid and dotted blue curve represents the sum of signal and background fits in data and MC respectively.
Distributions of PFCHS AK8 pruned jet mass in data and MC for high purity (left) and low purity (right) selections. The double crystal ball function describes the signal contribution obtained is data (red solid) and MC (red dotted). The background contributions, including combinatorial ttbar background, are described by a Chebyshev and an exponential functions for high and low purity categories respectively. The solid and dotted blue curve represents the sum of signal and background fits in data and MC respectively.
Distributions of Puppi AK8 softdrop jet mass in data and MC for high purity (left) and low purity (right) selections. The double crystal ball function describes the signal contribution obtained is data (red solid) and MC (red dotted). The background contributions, including combinatorial ttbar background, are described by a Chebyshev and Error Functions for high and low purity categories respectively. The solid and dotted blue curve represents the sum of signal and background fits in data and MC respectively
Distributions of Puppi AK8 softdrop jet mass in data and MC for high purity (left) and low purity (right) selections. The double crystal ball function describes the signal contribution obtained is data (red solid) and MC (red dotted). The background contributions, including combinatorial ttbar background, are described by a Chebyshev and Error Functions for high and low purity categories respectively. The solid and dotted blue curve represents the sum of signal and background fits in data and MC respectively
Left: High Purity; Right: Low Purity
!17
Simone Gelli - 2017
Distributions of Puppi AK8 softdrop jet mass in data and MC for high purity (left) and low purity (right) selections. The double crystal ball function describes the signal contribution obtained is data (red solid) and MC (red dotted). The background contributions, including combinatorial ttbar background, are described by a Chebyshev and an exponential functions for high and low purity categories respectively. The solid and dotted blue curve represents the sum of signal and background fits in data and MC respectively
factors. To evaluate this component we compared the scale factors obtained from the PYTHIA226
dataset with the ones obtained using the HERWIG dataset for each Working Point. They quan-227
tify the discrepancy between the jet substructure modeling of PYTHIA and HERWIG. It is only228
relevant for analyses applying the data/MC scale factors derived with PYTHIA to simulation229
based on HERWIG showering.230
The second source of systematics is connected to the choice of the signal fit model. Although,231
after the generator level, the Double Crystal Ball distribution seems the best fit function to de-232
scribe the invariant mass signal peak, we compared the estimated efficiency, mean and sigma233
on simulated tt̄ samples with two different fit models. In the default model, the signal is purely234
fitted by a Double Crystal Ball. In the alternative model, the signal is described by a single235
Gaussian distribution with the background function absorbing the signal component of the236
tails. The estimated Scale factors obtained with those two methods, agree within 0.2-18%.237
Contributions from lepton identification, b-tagging and Emiss scale are negligible. Uncertain-238
ties due to the jet mass scale and resolution, jet energy scale and resolution, pileup effects of239
the order 1 � 2%, depend on the event topology and jet mass selection and are evaluated indi-240
vidually by each analysis.241
242
0 0.1 0.2 0.3 0.4 0.5 0.6 0.7 0.8 0.9 1
Even
ts/5
0
0.2
0.4
0.6
0.8
1
datasignalf MCsignalf
databackgroundf MCbackgroundf
datasignalf MCsignalf
databackgroundf MCbackgroundf
datasignalf MCsignalf
databackgroundf MCbackgroundf
hh
DibosonWJetsSingleTttdata
DibosonWJetsSingleTttdata
DibosonWJetsSingleTttdata
(13 TeV)-135.8 fbPreliminary CMS
DibosonWJetsSingleTttdata
0 0.1 0.2 0.3 0.4 0.5 0.6 0.7 0.8 0.9 1
Even
ts/5
0
0.2
0.4
0.6
0.8
1
datasignalf MCsignalf
databackgroundf MCbackgroundf
datatotf MCtotf
datasignalf MCsignalf
databackgroundf MCbackgroundf
datatotf MCtotf
datasignalf MCsignalf
databackgroundf MCbackgroundf
datatotf MCtotf
hh
DibosonWJetsSingleTttdata
DibosonWJetsSingleTttdata
DibosonWJetsSingleTttdata
(13 TeV)-135.8 fbPreliminary CMS
DibosonWJetsSingleTttdata
0 0.1 0.2 0.3 0.4 0.5 0.6 0.7 0.8 0.9 1
Even
ts/5
0
0.2
0.4
0.6
0.8
1
datasignalf MCsignalf
databackgroundf MCbackgroundf
datasignalf MCsignalf
databackgroundf MCbackgroundf
datasignalf MCsignalf
databackgroundf MCbackgroundf
hh
DibosonWJetsSingleTttdata
DibosonWJetsSingleTttdata
DibosonWJetsSingleTttdata
(13 TeV)-135.8 fbPreliminary CMS
DibosonWJetsSingleTttdata
0 0.1 0.2 0.3 0.4 0.5 0.6 0.7 0.8 0.9 1
Even
ts/5
0
0.2
0.4
0.6
0.8
1
datasignalf MCsignalf
databackgroundf MCbackgroundf
datatotf MCtotf
datasignalf MCsignalf
databackgroundf MCbackgroundf
datatotf MCtotf
datasignalf MCsignalf
databackgroundf MCbackgroundf
datatotf MCtotf
hh
DibosonWJetsSingleTttdata
DibosonWJetsSingleTttdata
DibosonWJetsSingleTttdata
(13 TeV)-135.8 fbPreliminary CMS
DibosonWJetsSingleTttdata
0 0.1 0.2 0.3 0.4 0.5 0.6 0.7 0.8 0.9 1
Even
ts/5
0
0.2
0.4
0.6
0.8
1
datasignalf MCsignalf
databackgroundf MCbackgroundf
datasignalf MCsignalf
databackgroundf MCbackgroundf
datasignalf MCsignalf
databackgroundf MCbackgroundf
hh
DibosonWJetsSingleTttdata
DibosonWJetsSingleTttdata
DibosonWJetsSingleTttdata
(13 TeV)-135.8 fbPreliminary CMS
DibosonWJetsSingleTttdata
Puppi τ21 < 0.55 Puppi τ21 > 0.55
!18
Simone Gelli - 2017
Scale factors for μ (mass scale), σ (mass resolution) and ε (τ21 cut efficiency for high purity category) reported as: measured data/MC scale factor (Pythia) ± statistical error ± systematic error (Herwig) ± systematic error (fitting model).
The first component of systematic error is estimated as the difference in scale factors by using the same functions to fit a Herwig MC sample. The second component is obtained by using a gaussian function instead of a double crystal call function to fit the signal.