61
CNIT 50: Network Security Monitoring 6 Command Line Packet Analysis Tools

CNIT 50:Network Security Monitoring
6 Command Line Packet Analysis Tools

Topics
• SO Tool Categories
• Running Tcpdump
• Using Dumpcap and Tshark
• Running Argus and the Ra Client

SO Tool Categories

Three Types of Tools
• Data presentation
• Data collection
• Data delivery
Data Presentation Tools• Packet Analysis Tools
• Read traffic from a live interface or from a saved PCAP file
• Command-line: tcpdump, Tshark (with Dumpcap), and Argus Ra Client
• Graphical interface: Wireshark, Xplico, and NetworkMiner (see Ch 7)

NSM Consoles
• Gateways to NSM data
• Squil, Squert, and ELSA (see Ch 8)
• Text discusses Snorby but it's abandoned and no longer included in Security Onion
• Links Ch 1e, 1f

Data Collection Tools
• These applications collect and generate the NSM data available to the presentation tools
• Argus server, Netsniff-ng, PRADS, Snort, Suricata, and Bro
Argus and PRADS
• Argus server and PRADS create and store their own form of session data
• Argus uses a proprietary binary format suited for rapid command-line mining
• PRADS data is best read through an NSM console
Netsniff-ng
• Simply writes full-content data to disk in pcap format

Snort and Suricata
• Network intrusion detection systems (NIDS)
• Inspect traffic and write alerts
• According to signatures deployed with each tool

Bro
• Observes and interprets traffic that has been generted and logged in a variety of NSM datatypes

Data Delivery Tools
• Middleware between the data presentation and data collection tools
• PulledPork manages IDS rules
• Barnyard2 manages alert processing
• Capme manages pcap access

Squil Agents• Shuttle data from the collection tools to the
presentation software
• pcap_agent and snort_agent
• Apache web server
• MySQL database
• Sphinx index application

Integrating Tools
• Integrate host-centric analysis analysis features
• OSSEC host IDS
• Syslog-ng for transport and aggregation of log messages


Running Tcpdump

Tcpdump• Protocol analyzer: understands layers of
networking
• Included in SO but not running by default
• Often used to analyze pcaps in /nsn/sensor_data/<sensorname>/dailylogs
• Can also collect live data

Basic Usage• Requires sudo• Specify interface with -i
Other Useful Switches• -n Don't resolve names
• -s # Adjust "snaplength" -- Number of bytes to collect (default is 68 bytes for IPv4)
• -c count Only collect count packets (0 for all data)
• -X Print out packet bytes
• -w filename.pcap Write PCAP file

-X

DNS Query & Reply

TCP Handshake• [S] SYN • [S.] SYN/ACK • [.] ACK

Capture Filters• In Berkeley Packet Format (BPF)
• Add filter to the end of the command line
• icmp Only ICMP protocol
• port 53 UDP or TCP port 53
• tcp and port 443 Requires both conditions
• man pcap-filter to see all options

Capture Filters
• host 192.168.1.1 traffic to or from this IP
• src host 192.168.1.1 traffic from this IP
• dst host 192.168.1.1 traffic to this IP
• src net 192.168.1.0 traffic from this network

Only ICMP Replies

Looping Through Files


Using Dumpcap and Tshark

Shipped with Wireshark• Dumpcap is a simple packet collection tool
• Tshark is the command-line version of Wireshark
• Analyzes traffic
• Friendlier than tcpdump
• Uses human-readable syntax

Tshark as Root
• Protocol dissectors may contain vulnerabilities • Recommended: collect with dumpcap, analyze
later with tshark and wireshark

• When running as root, Dumpcap can't write to the user's home directory, so the output's in /tmp
• Dumpcap captures whole packets by default, unlike tcpdump

Running Dumpcap without root Privileges
• sudo dpkg-reconfigure wireshark-common

Running Dumpcap without root Privileges
• sudo usermod -a -G wireshark so
• sudo reboot

Capturing Pings with Dumpcap

Absolute Timestamps in Tshark
• tshark -t ad -r icmp.pcap

Using Display Filters with Tshark
• Display filters use a different format than BPF
• Display filters don't affect packet capture
• tshark -r icmp.pcap -Y "icmp.type == 0"

Full Decode
• -V for verbose protocol decode
• -x for hex and ASCII


Tshark Display Filters in Action
• View HTTP Traffic

Tshark Display Filters in Action
• Use -Y instead of -R

Tshark Display Filters in Action
• Searching for a range of IP addresses

Running Argus and the Ra Client

Argus• A session data generation and analysis suite
• Argus server is running by default on Security Onion
• Client is in /nsm/sensor_data/<sensorname>/argus directory
• sudo nsm_sensor_ps-status --only-argus
• Shows Argus status

Was Off by Default• Do this to start argus
• sudo sed -i 's|ARGUS_ENABLED="no"|ARGUS_ENABLED="yes"|g' /etc/nsm/*/sensor.conf
• sudo service nsm restart

Stopping and Starting Argus
• sudo nsm_sensor_ps-stop --only-argus
• sudo nsm_sensor_ps-start --only-argus

Argus Data

Argus File Format• Argus stores flows, not complete pcaps
• Much smaller: ex: 48 days of data

Examining Argus Data
• -n Don't resolve port numbers to names
• tcp and dst port 21 BPF packet filter
• -s Specify which fields to display

Argus Data in SO

Ra Help
• - switch to filter

Ra Filtered for ICMP
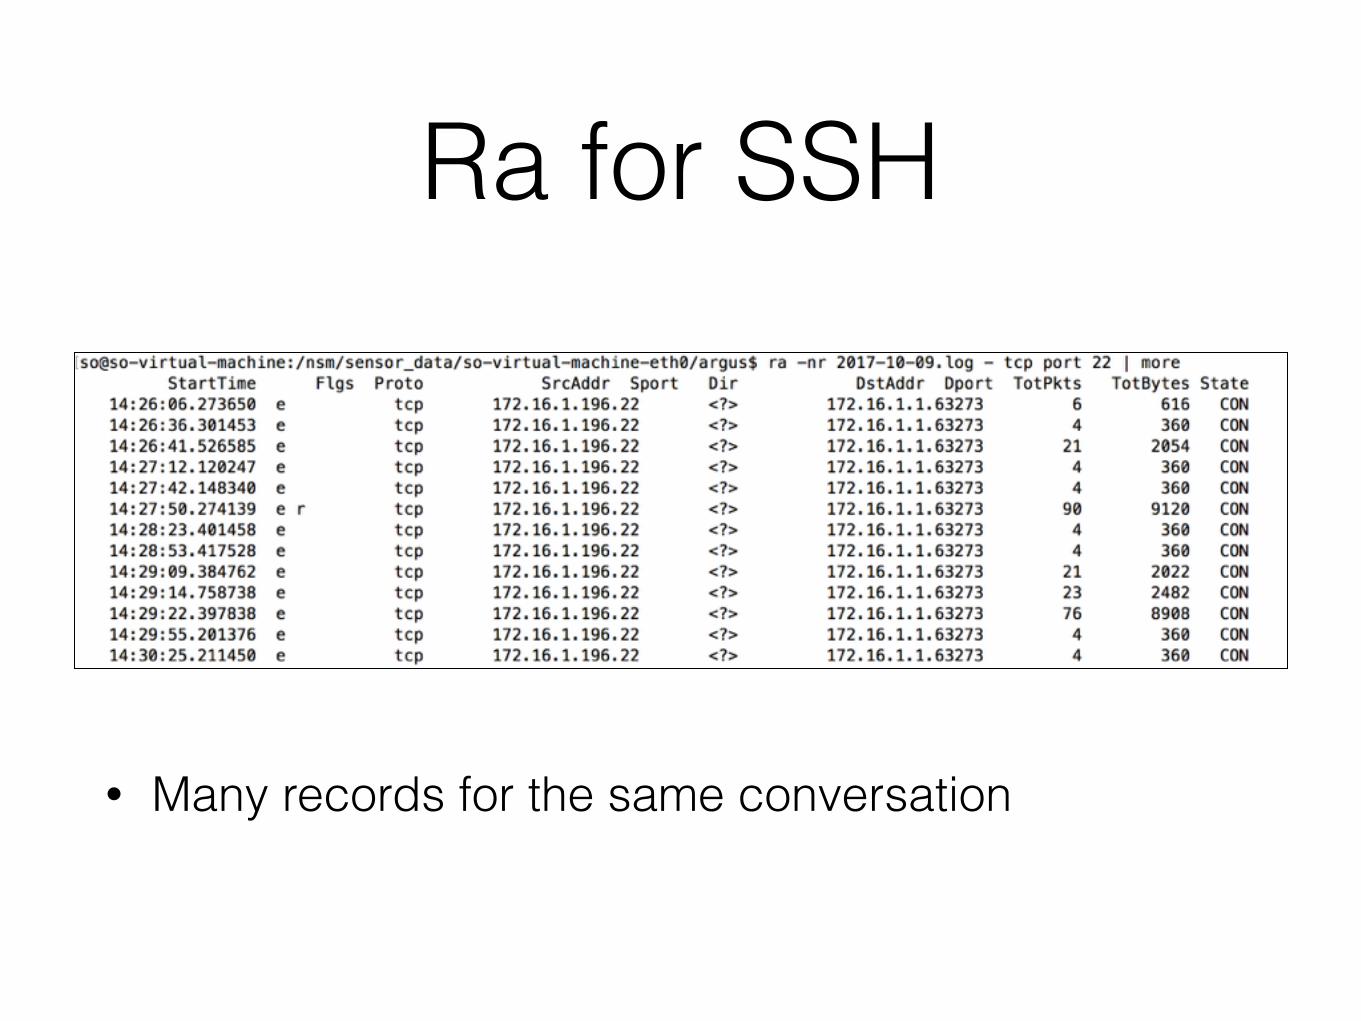
Ra for SSH
• Many records for the same conversation

Racluster• Ra can break a long conversation into separate
sections
• Racluster combines them into one record

Number of Lines

Advanced Usage Example• -m saddr daddr groups records by source and
destination IP address

Without -m

With -m• Combines many conversations into one record

Advanced Usage Example


