Page 1
Final Report • 16 February 2017
CO2 CAPTURE FROM IGCC GAS STREAMS USING
THE AC-ABC PROCESS
Final Report
Covering the period October 1, 2009 through September 30, 2016
SRI Project P19207 and P21321
Cooperative Agreement No.: DE-FE0000896
Principal Investigator: Anoop Nagar
Contributors: Elisabeth McLaughlin, Marc Hornbostel, Gopala Krishnan, Indira
Jayaweera, SRI International
Eli Gal, EIG, Inc.
Martin Taylor, BHTS, Inc.
Performing Organization: SRI International
333 Ravenswood Avenue
Menlo Park, CA 94025
Other Team Members: Bechtel Hydrocarbon Technology Solutions, Inc.
EIG, Inc.
National Carbon Capture Center
Prepared for: U.S. Department of Energy
National Energy Technology Center
3600 Collins Ferry Road
Morgantown, WV26505
DOE Project Manager: Steve Mascaro
Page 2
Final Report DE-FE0000896 16 February 2017
1
DISCLAIMER
This report was prepared as an account of work sponsored by an agency of the United
States Government. Neither the United States Government nor any agency thereof, nor any of
their employees, makes any warranty, express or implied, or assumes any legal liability or
responsibility for the accuracy, completeness, or usefulness of any information, apparatus,
product, or process disclosed, or represents that its use would not infringe privately owned rights.
Reference herein to any specific commercial product, process, or service by trade name,
trademark, manufacturer, or otherwise does not necessarily constitute or imply endorsement,
recommendation, or favoring by the United States Government or any agency thereof. The views
and opinions of authors expressed herein do not necessarily state or reflect those of the United
States Government or any agency thereof.
Page 3
Final Report DE-FE0000896 16 February 2017
2
CONTENTS
DISCLAIMER .................................................................................................................................1
CONTENTS .....................................................................................................................................2
LIST OF TABLES ...........................................................................................................................3
LIST OF ILLUSTRATIONS ...........................................................................................................4
ABSTRACT .....................................................................................................................................7
EXECUTIVE SUMMARY .............................................................................................................8
INTRODUCTION .........................................................................................................................10
WORK PERFORMED ..................................................................................................................11
Budget Period 1..................................................................................................................11
Bench-scale Test Unit Construction ......................................................................................11
Bench-scale Absorber Tests ...................................................................................................14
Bench-scale Regenerator Testing ..........................................................................................33
Bench-scale Test Data Analysis.............................................................................................42
Preliminary Process Modeling and Cost Economics .............................................................48
Budget Period 2 48
Small Pilot-Scale Design .......................................................................................................48
Integrated Plant Operation – First Test Campaign ................................................................50
Analytical Testing ..................................................................................................................55
System Modification and Maintenance .................................................................................60
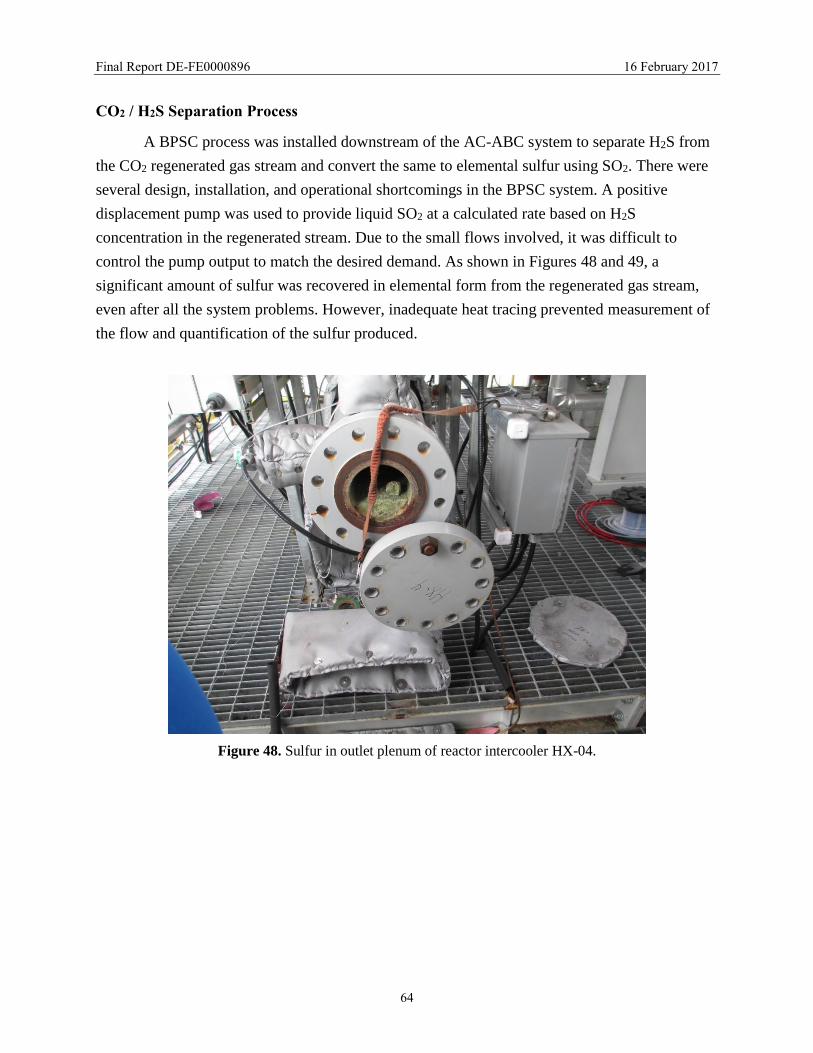
CO2 / H2S Separation Process ................................................................................................64
Second Test Campaign ..........................................................................................................66
Pilot-Plant Modification.........................................................................................................67
Pilot-Plant Operation .............................................................................................................69
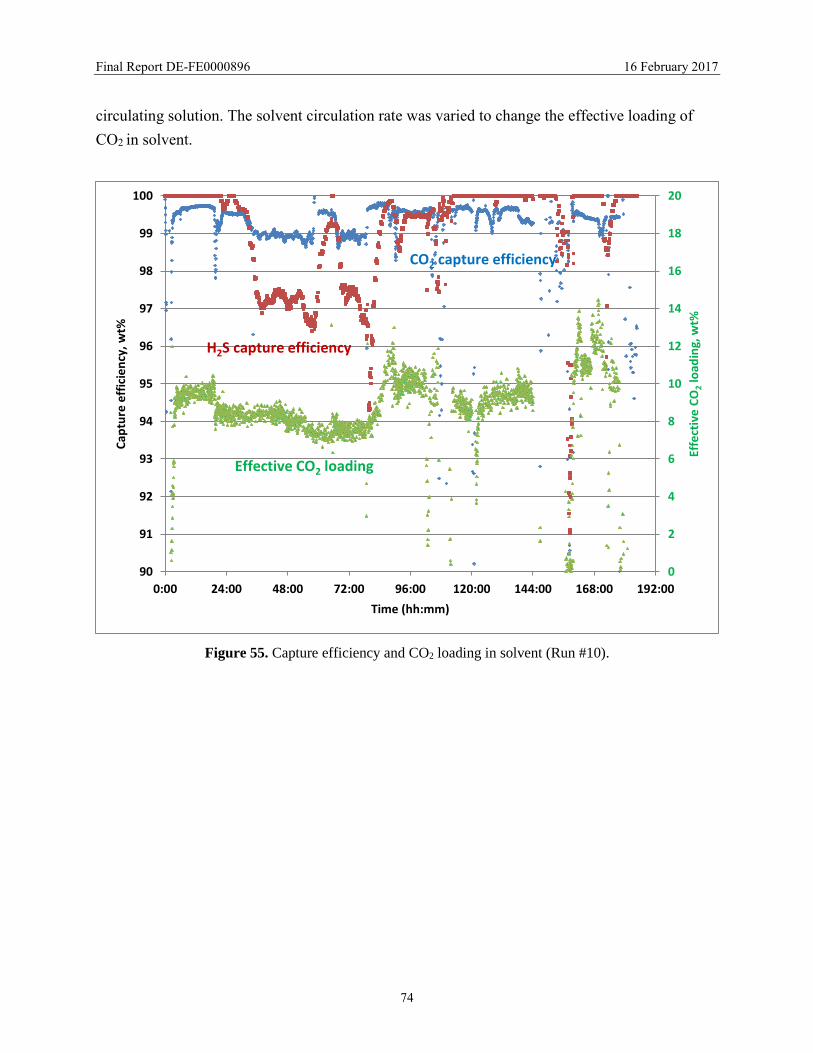
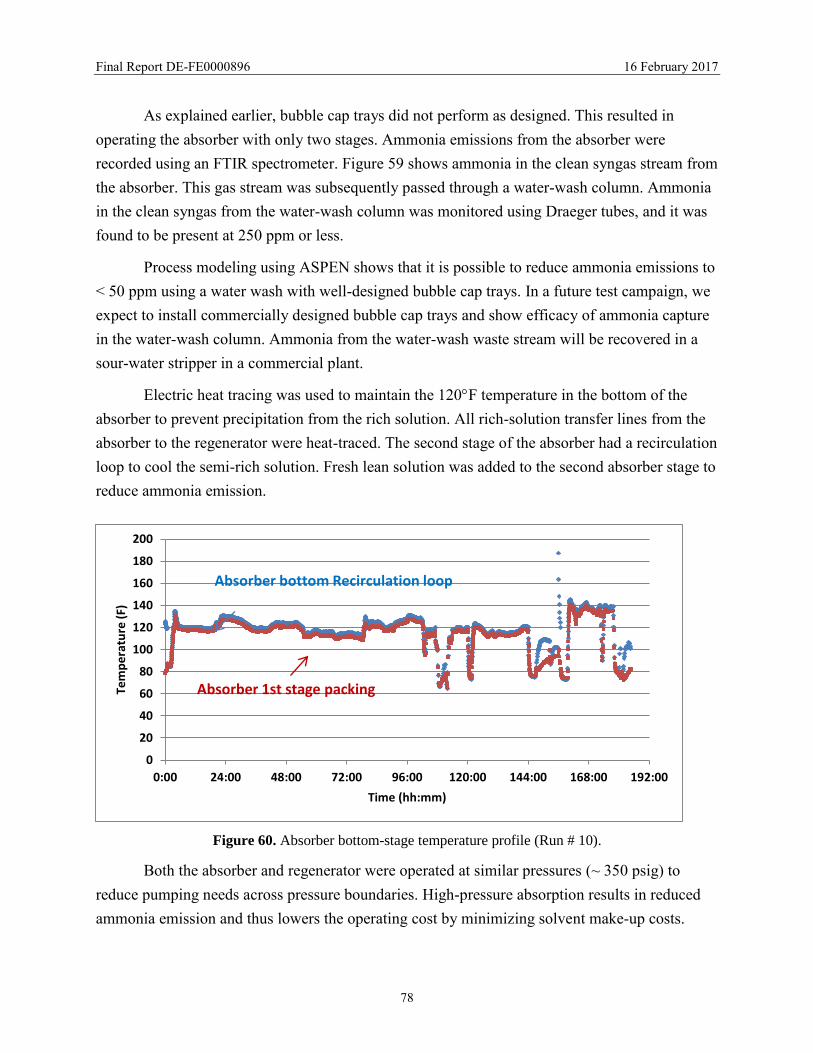
Discussion of Results .............................................................................................................71
Process Modelling ..................................................................................................................91
TECHNO-ECONOMIC ANALYSIS OF AC-ABC PROCESS: SUMMARY ..........................101
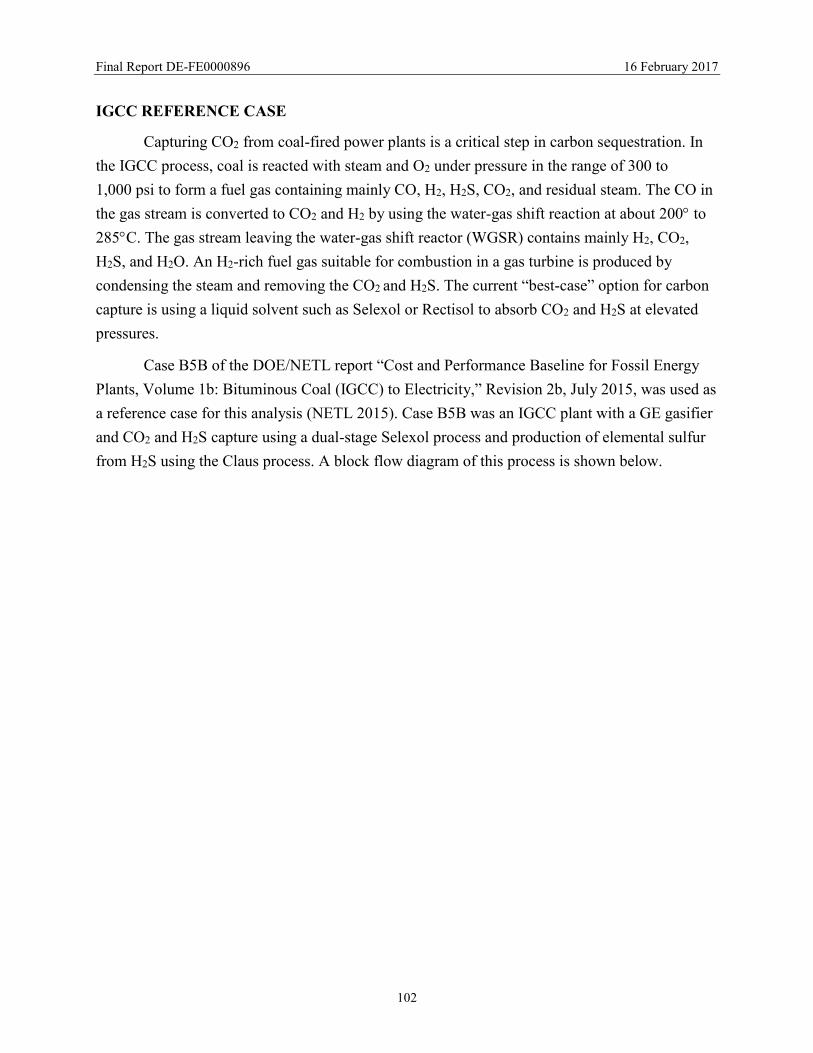
IGCC Reference Case ......................................................................................................102
IGCC Case with AC-ABC CO2 and H2S Capture ...........................................................104
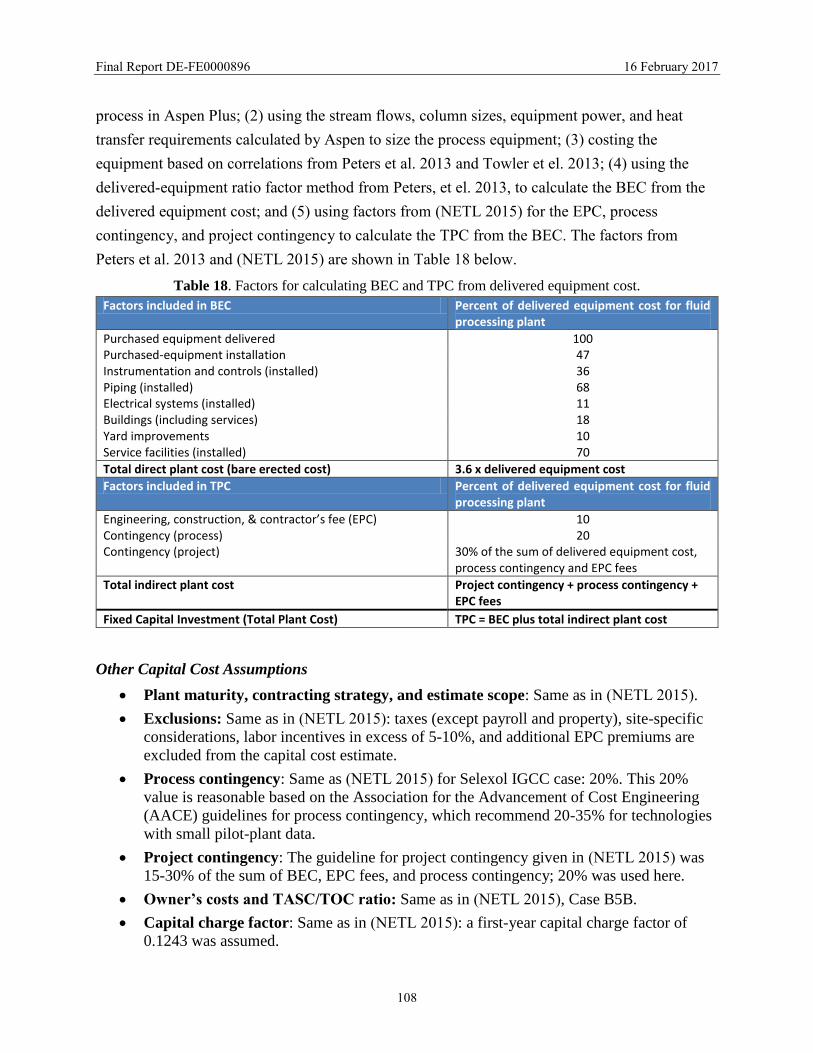
Cost Estimating Methodology and Assumptions .............................................................107
AC-ABC Process Details and Assumptions ....................................................................110
Plant Performance Summary with AC-ABC CO2 and H2S Capture ...............................116
Cost Advantages of AC-ABC Process .............................................................................117
Sensitivity Analyses .........................................................................................................119
APPENDIX A ..............................................................................................................................123
Equipment Cost List for AC-ABC Process .....................................................................123
Operating and Maintenance Cost Summary ....................................................................125
CONCLUSIONS..........................................................................................................................130
REFERENCES ............................................................................................................................132
Page 4
Final Report DE-FE0000896 16 February 2017
3
LIST OF TABLES
Table 1. Details of the initial absorber test conditions for a 50-SLPM test gas flow rate. .......... 14
Table 2. Details of the absorber test conditions at 30°C. ............................................................. 19
Table 4. Residual NH3 partial pressures at varying temperature and CO2 loadings. ................... 24
Table 5. Absorber test conditions to determine the H2S capture efficiency. ............................... 26
Table 6. Solubility of gases in aqueous solutions at 20°C. .......................................................... 28
Table 7. Absorber test conditions to determine the H2S capture efficiency in gas mixtures. ...... 29
Table 8. Bench-scale absorber data for H2S absorption under varying conditions. ..................... 30
Table 9. Test conditions and results from regenerator runs. ........................................................ 38
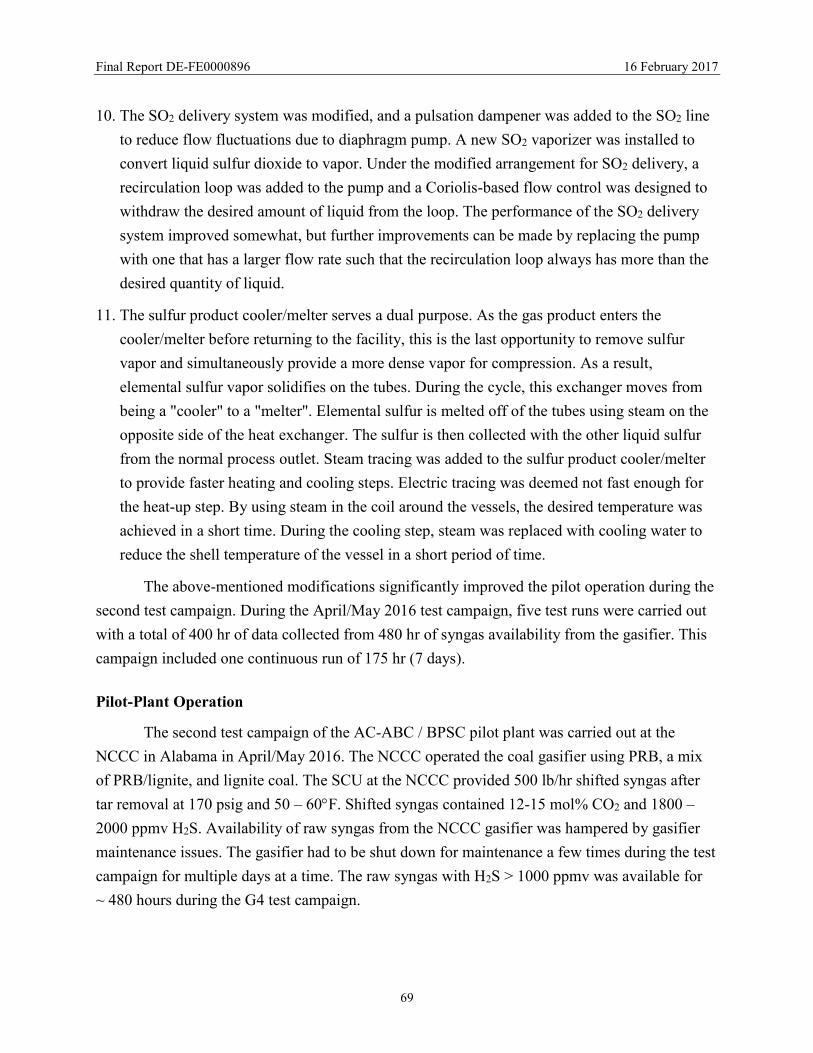
Table 10. Typical raw syngas stream composition from the lignite coal gasifier at NCCC. ....... 70
Table 11. Regenerations #1-#4..................................................................................................... 87
Table 12. Regenerations #5-#8..................................................................................................... 87
Table 13. Near complete removal of sulfur in BPSC. .................................................................. 90
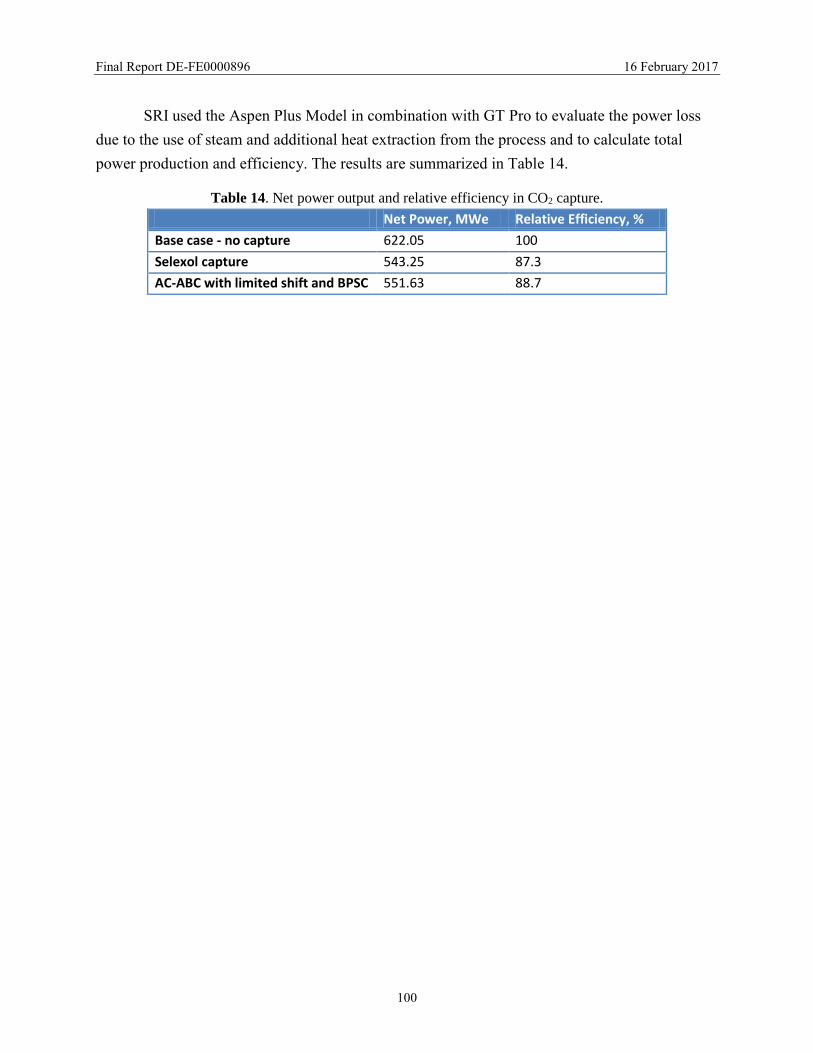
Table 14. Net power output and relative efficiency in CO2 capture. ......................................... 100
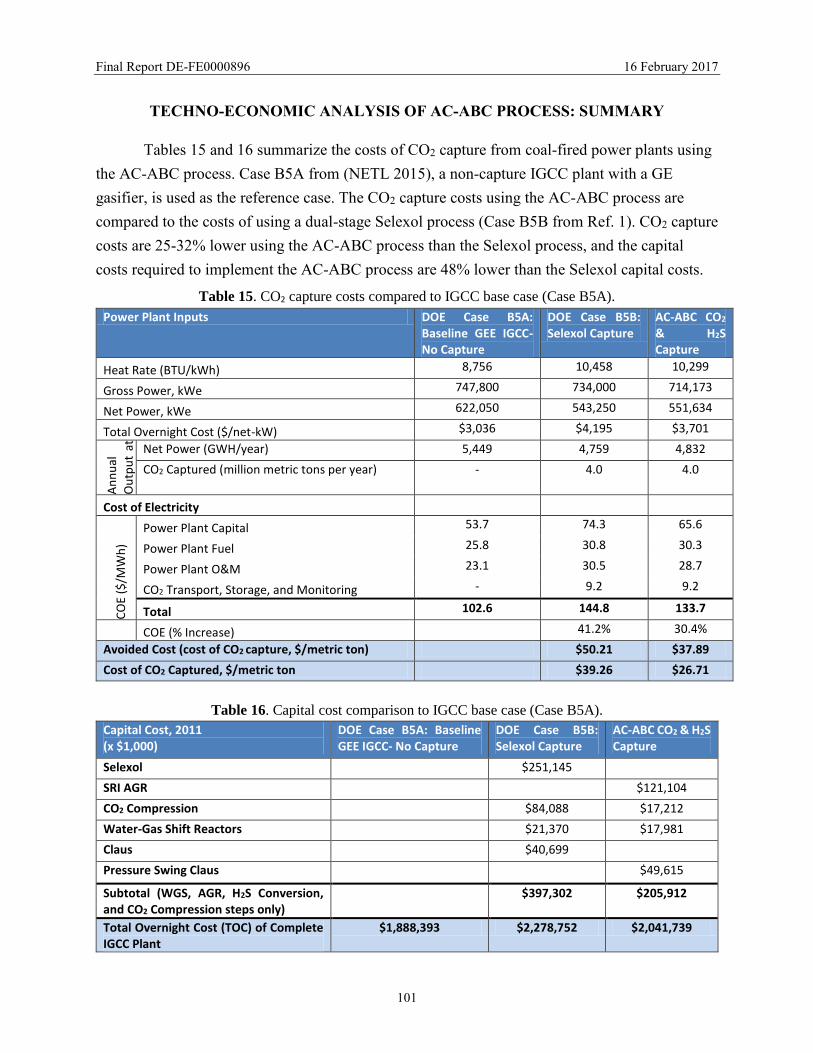
Table 15. CO2 capture costs compared to IGCC base case (Case B5A). ................................... 101
Table 16. Capital cost comparison to IGCC base case (Case B5A). ......................................... 101
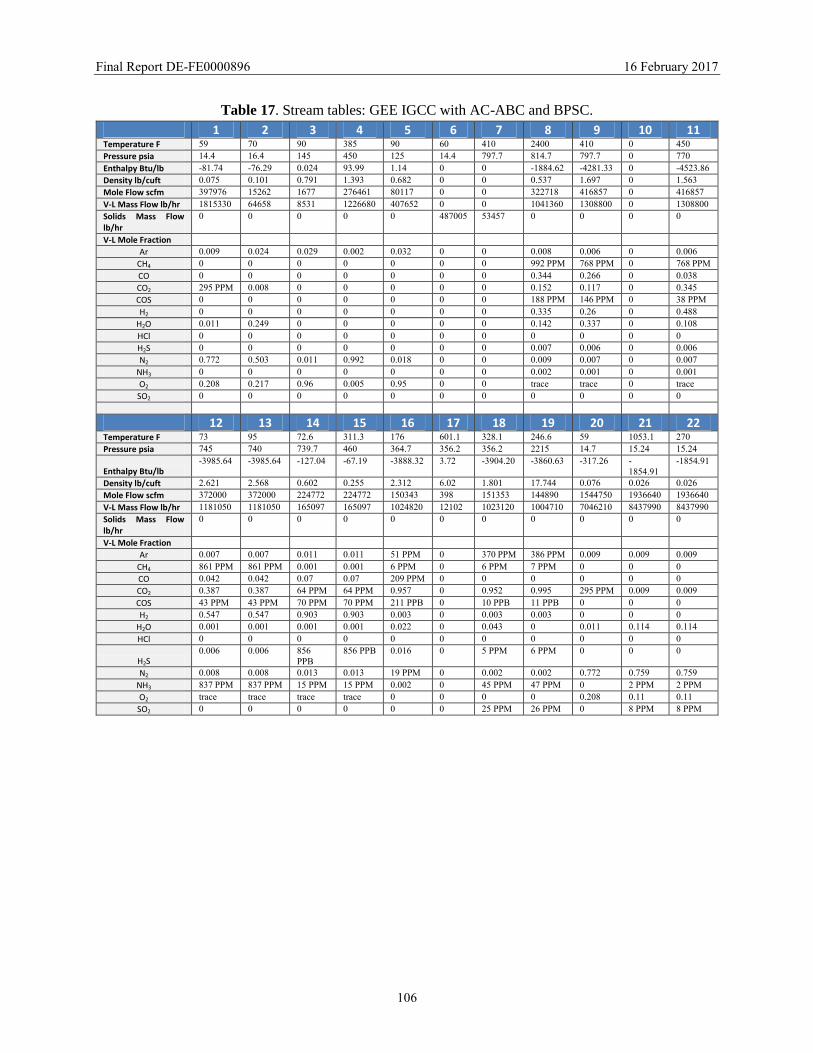
Table 17. Stream tables: GEE IGCC with AC-ABC and BPSC. ............................................... 106
Table 18. Factors for calculating BEC and TPC from delivered equipment cost. ..................... 108
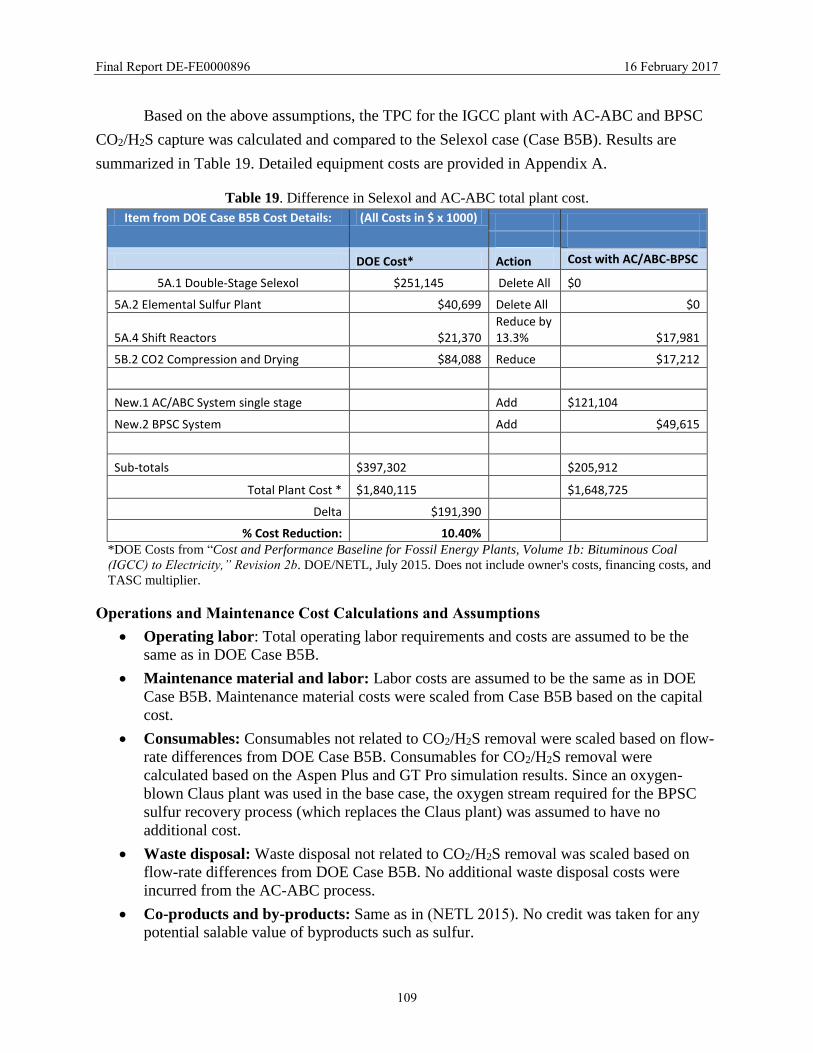
Table 19. Difference in Selexol and AC-ABC total plant cost. ................................................. 109
Table 20. AC-ABC process stream tables. ................................................................................. 113
Table 21. Plant performance summary. ..................................................................................... 117
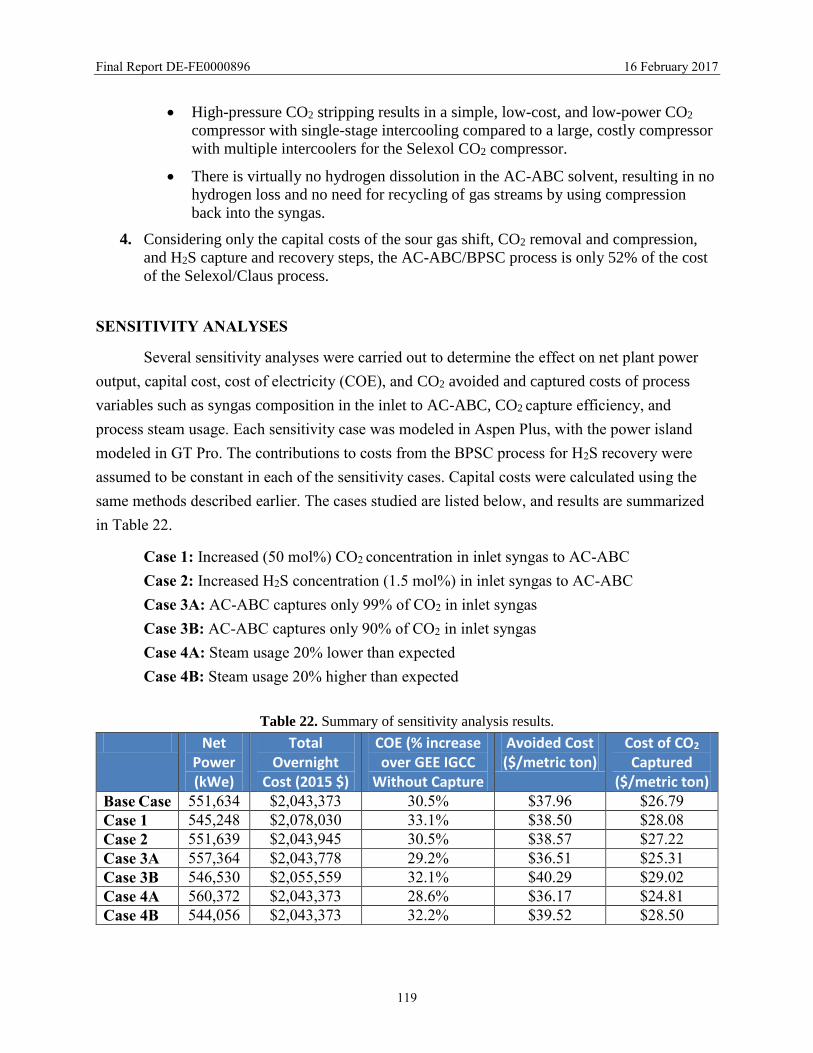
Table 22. Summary of sensitivity analysis results. .................................................................... 119
Table 23. Equipment costs for AC-ABC and BPSC process. .................................................... 123
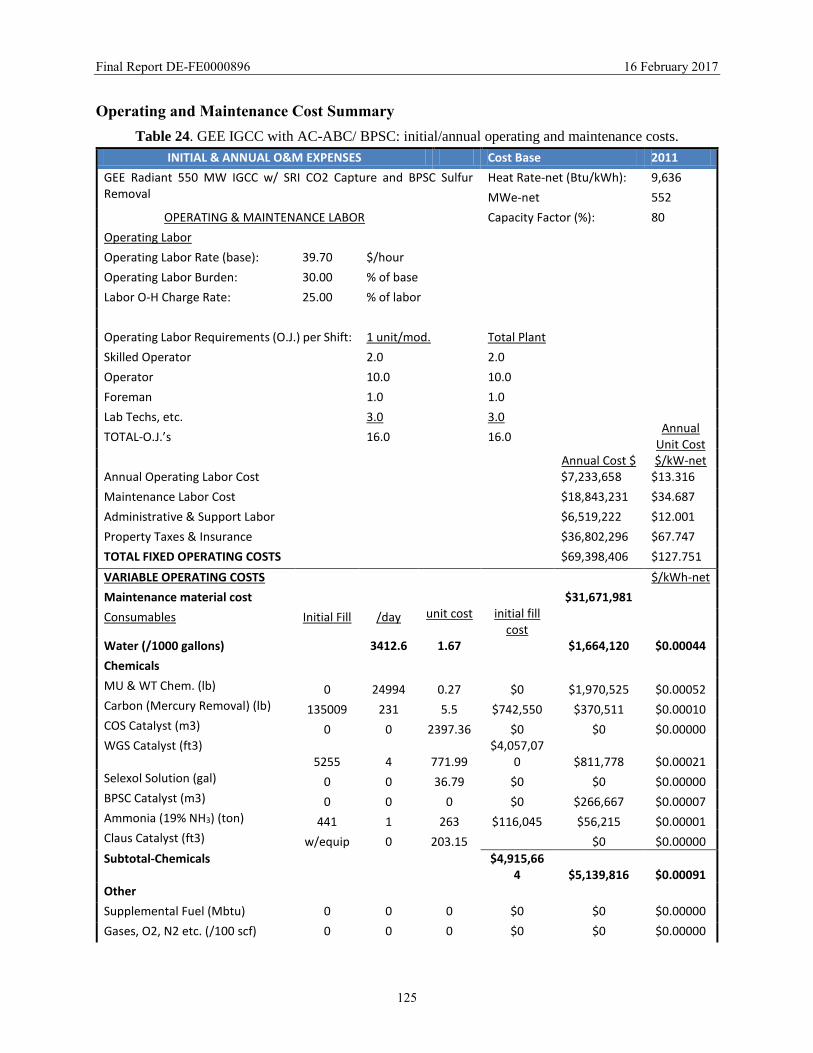
Table 24. GEE IGCC with AC-ABC/ BPSC: initial/annual operating and maintenance costs. 125
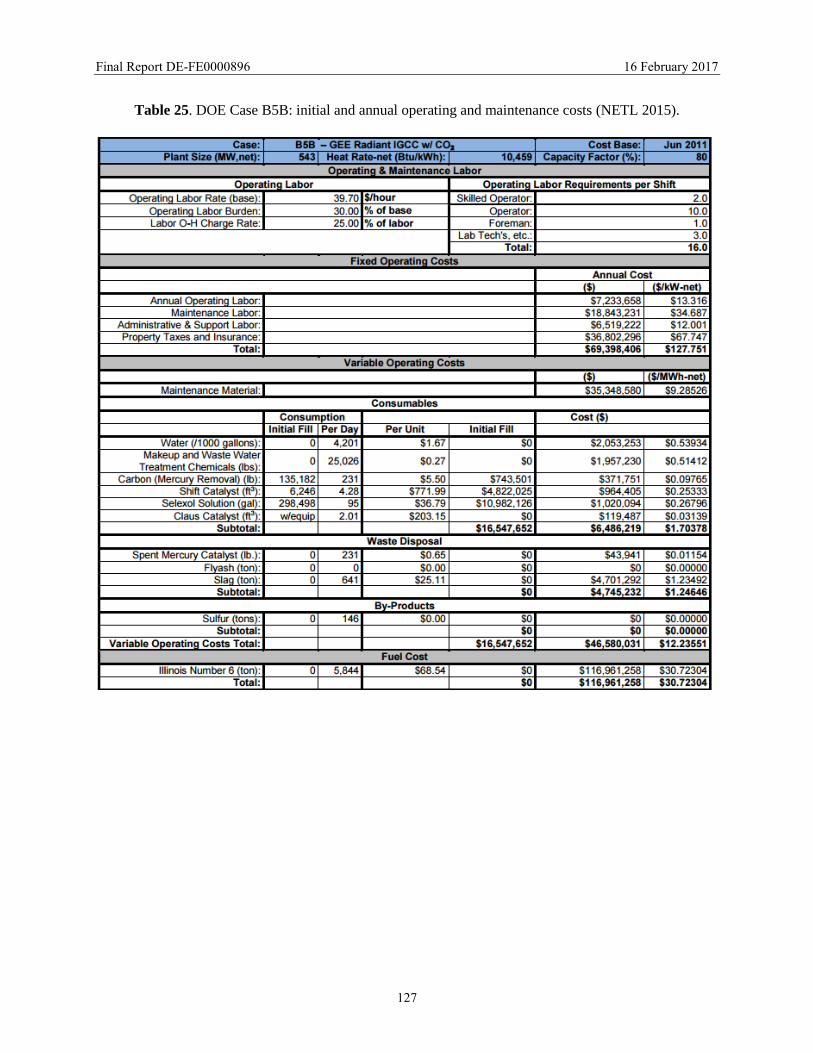
Table 25. DOE Case B5B: initial and annual operating and maintenance costs (NETL 2015). 127
Page 5
Final Report DE-FE0000896 16 February 2017
4
LIST OF ILLUSTRATIONS
Figure 1. Schematic diagram of the bench-scale test unit. ........................................................... 12
Figure 2. A photograph of the bench-scale test unit. ................................................................... 13
Figure 3. CO2 capture efficiency of a 4 M ammonia solution at 165 psig at 20° to 55°C. .......... 15
Figure 4. Variation of CO2 capture efficiency with temperature for 4 M ammonia solution at 165
psi at varying CO2 loadings. ......................................................................................................... 16
Figure 5. CO2 capture efficiency of a 4 M ammonia solution at 165 and 265 psig at 20°C. ....... 17
Figure 6. Calculated CO2 loading at varying CO2/NH3 ratios for 4, 6, and 10 M starting
ammonia concentrations. .............................................................................................................. 18
Figure 7. Observed CO2 capture as a function of the CO2/NH3 ratio and the CO2 partial pressure
at 30°C and 265 psia. .................................................................................................................... 20
Figure 8. Observed CO2 loading for a 6 M ammonia solution as a function of CO2 partial
pressure at 30 C and 265 psig. ...................................................................................................... 20
Figure 9. CO2 capture efficiency of 4 and 8 M ammonia solutions at 265 psia at 30° to 60°C. . 22
Figure 10. CO2 capture rates of 4 and 8 M ammonia solutions at 265 psia at 43° to 60°C. ........ 23
Figure 11. CO2 capture rate of 4 and 8 M ammonia solutions at 265 psia at 33° to 60°C. ......... 24
Figure 12. The relationship between calculated CO2 back pressure and the measured CO2
capture rate. ................................................................................................................................... 25
Figure 13. Measured H2S capture efficiency for 7.5 to 8 M ammonia solutions at 50°C. .......... 27
Figure 14. CO2 and H2S capture efficiencies of ammonia solutions at varying CO2 loadings. ... 29
Figure 15. Effect of gas flow rate and the scrubbing solution CO2/NH3 ratio on H2S absorption
at 25°C. ......................................................................................................................................... 31
Figure 16. Effect of gas flow rate and the liquid recirculation rate on H2S absorption ............... 32
Figure 17. Effect of liquid circulation to gas flow rate ratio on H2S absorption. ........................ 32
Figure 18. Schematic diagram of the bench-scale regenerator unit. ............................................ 34
Figure 19. Photograph of the regenerator. ................................................................................... 35
Figure 20. Evolution of CO2 from the ammonium bicarbonate solution as a function of
temperature. .................................................................................................................................. 36
Figure 21. Measured P-T curves for H2S-H2O-CO2-NH3 from static experiments. .................... 36
Figure 22. Equilibrium solubilities of H2S in H2S-H2O-CO2-NH3 system at a temperature of
50°C and pressures of 20 and 40 bar. ........................................................................................... 37
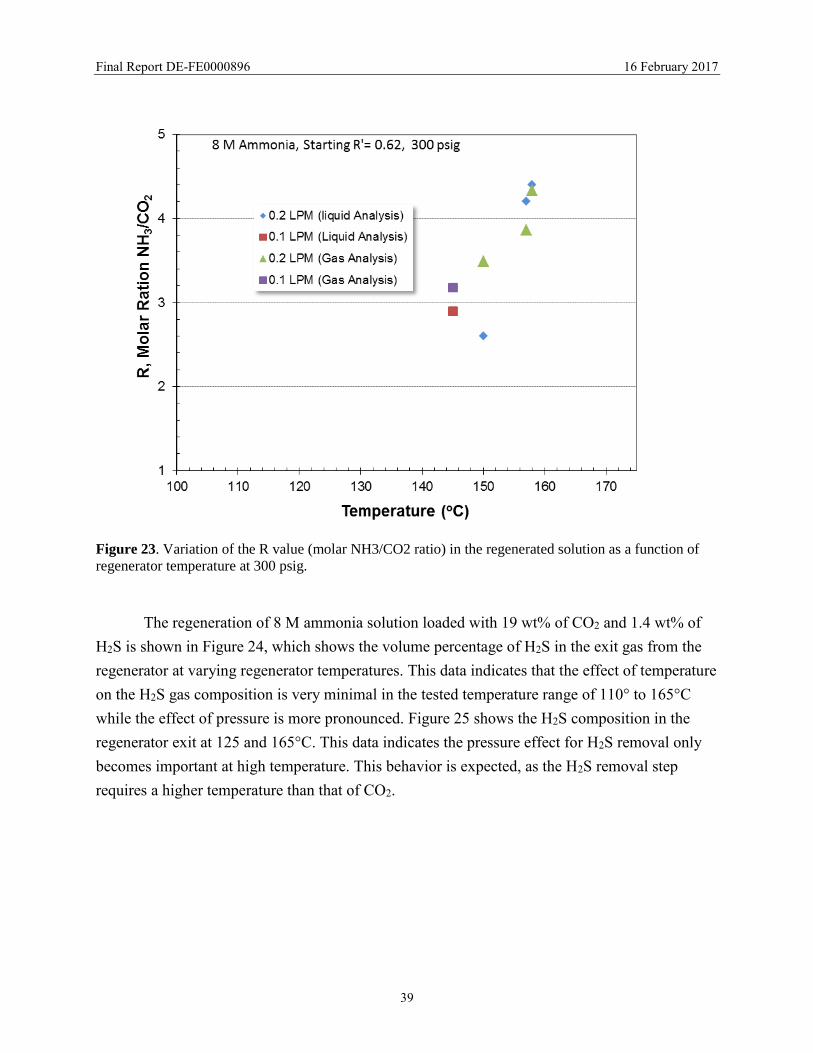
Figure 23. Variation of the R value (molar NH3/CO2 ratio) in the regenerated solution as a
function of regenerator temperature at 300 psig. .......................................................................... 39
Figure 24. Effect of temperature and pressure on H2S composition in the regenerator exit gas. 40
Figure 25. Effect of pressure on H2S composition in the regenerator exit gas at 120° and 165°C.
....................................................................................................................................................... 40
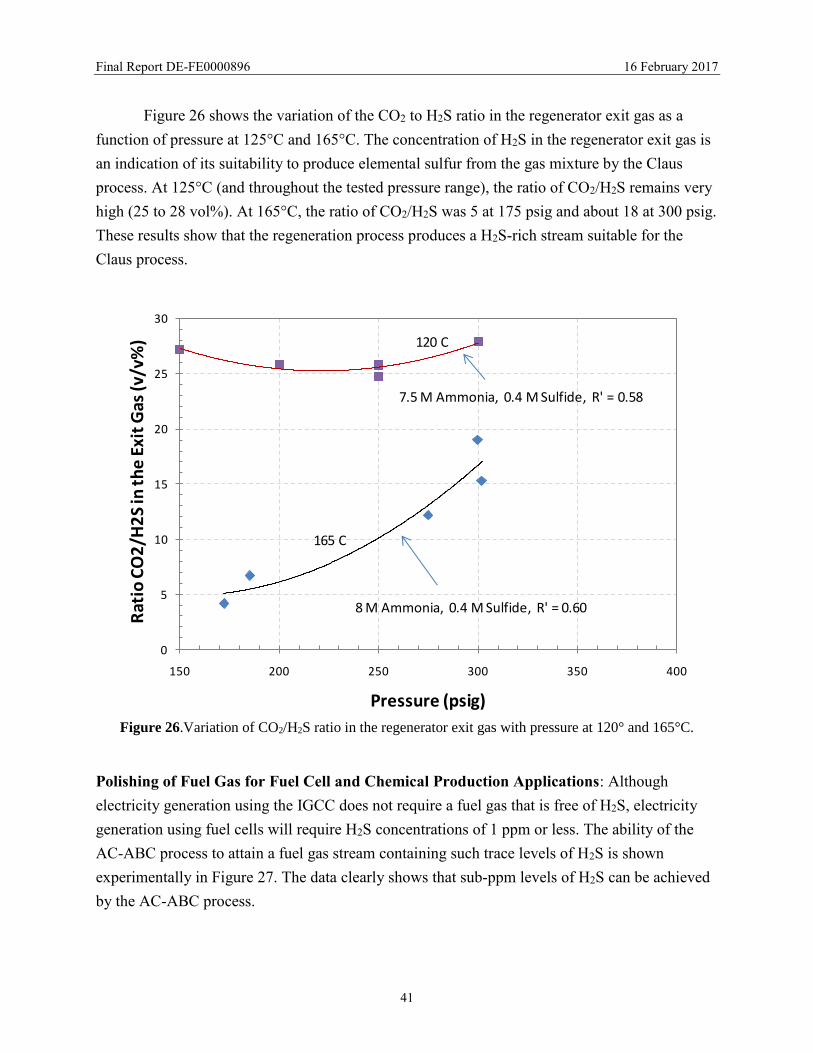
Figure 26.Variation of CO2/H2S ratio in the regenerator exit gas with pressure at 120° and
165°C. ........................................................................................................................................... 41
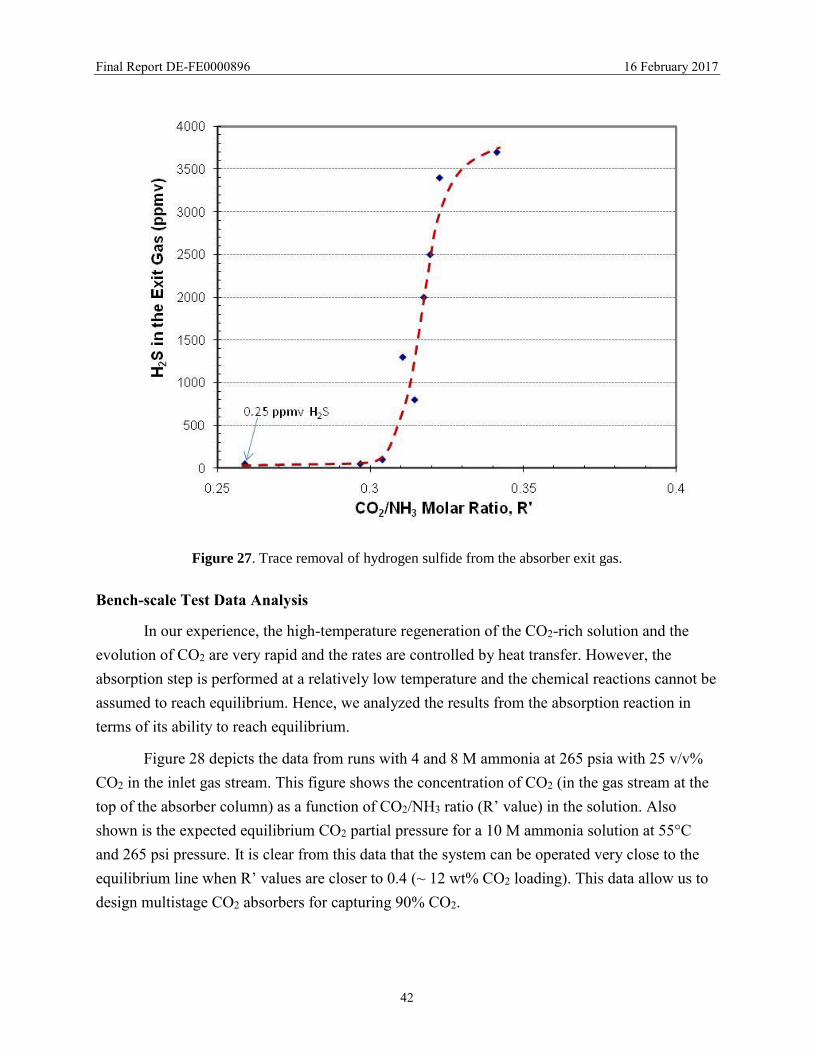
Figure 27. Trace removal of hydrogen sulfide from the absorber exit gas. ................................. 42
Page 6
Final Report DE-FE0000896 16 February 2017
5
Figure 28. Partial pressure of CO2 at the top of the absorber column as a function of the
scrubbing solution CO2/NH3 ratio. ................................................................................................ 43
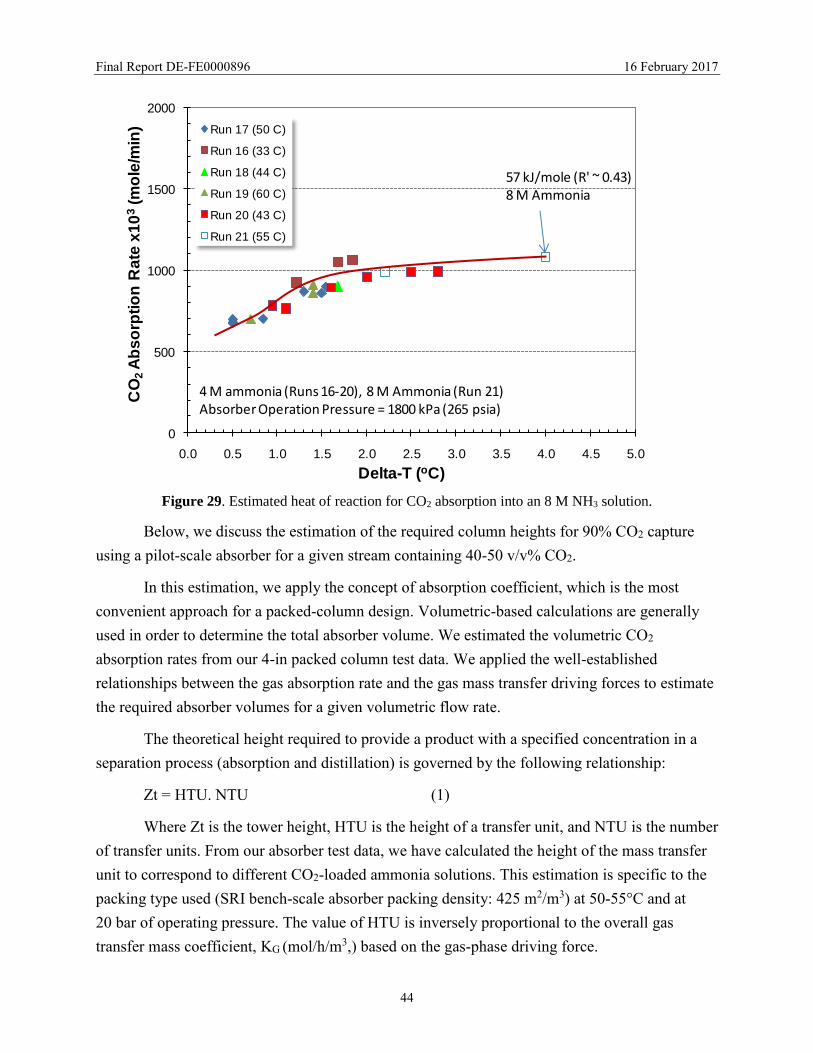
Figure 29. Estimated heat of reaction for CO2 absorption into an 8 M NH3 solution. ................ 44
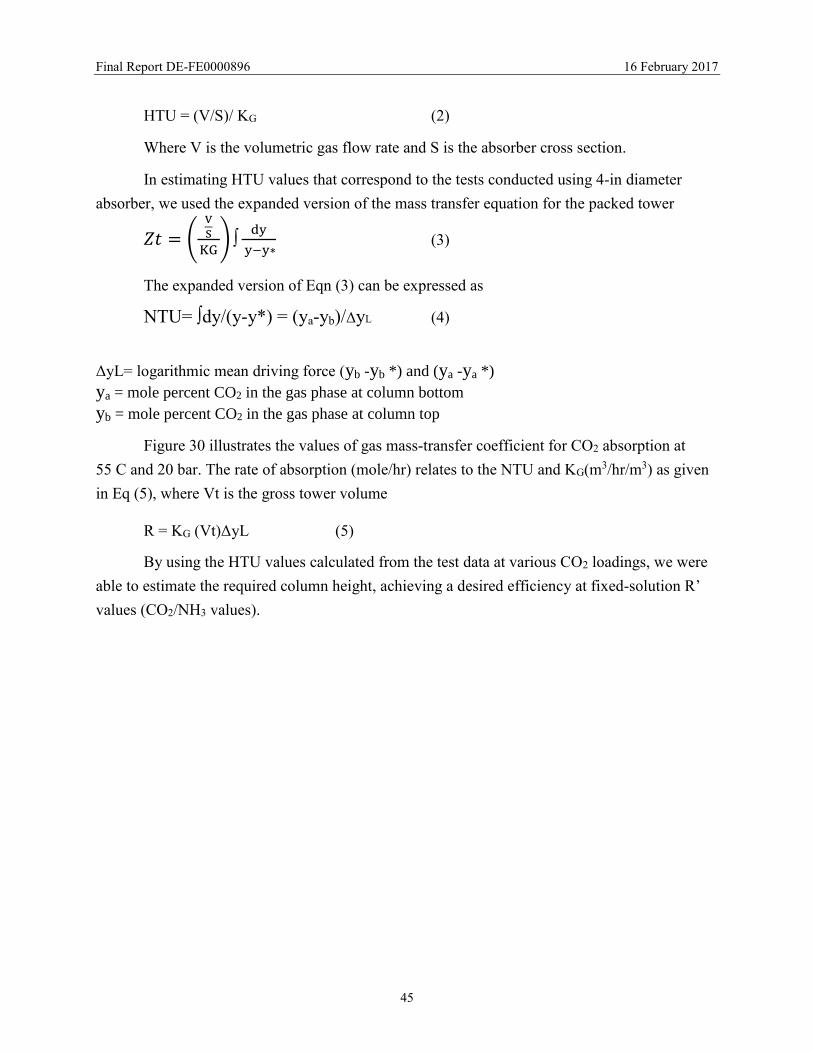
Figure 30. Gas mass-transfer coefficient for CO2 capture at 55°C and 20 bar. ........................... 46
Figure 31. Height of mass-transfer unit for CO2 absorption as a function of CO2 loading of the
ammonia capture at 55°C and 20 bar. ........................................................................................... 47
Figure 32. Process flow diagram of the AC-ABC system. .......................................................... 50
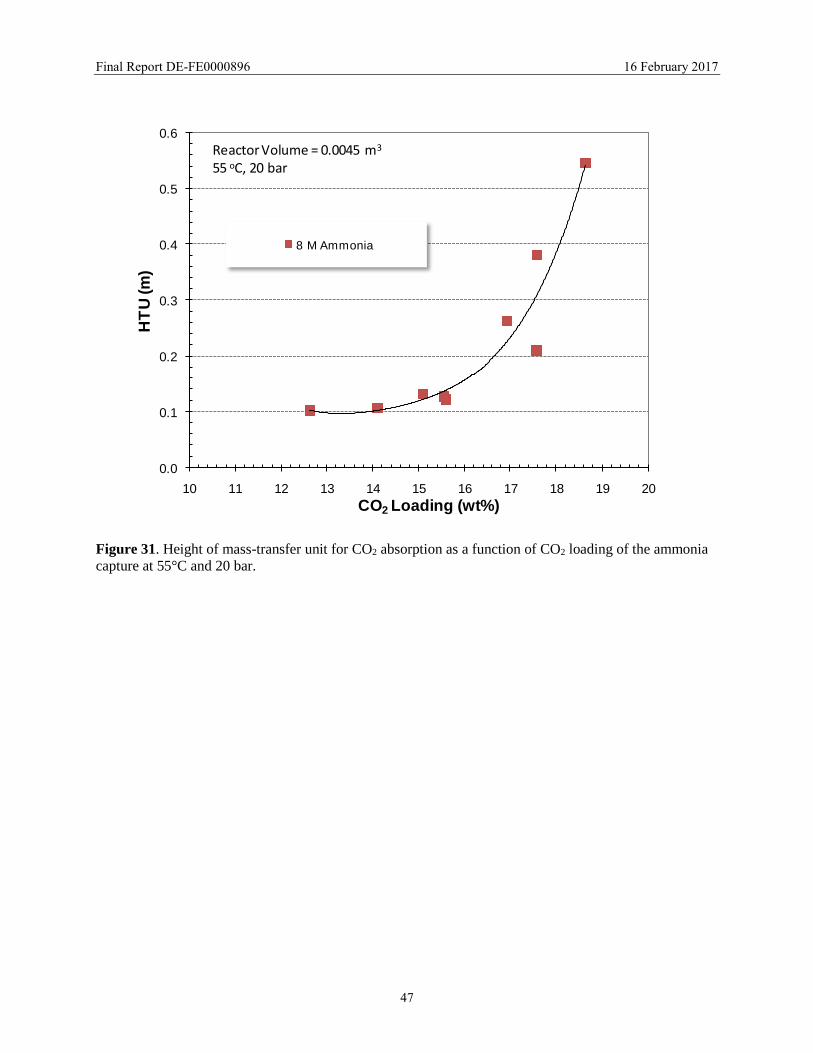
Figure 33. CO2 concentration in syngas (Run #3). ...................................................................... 51
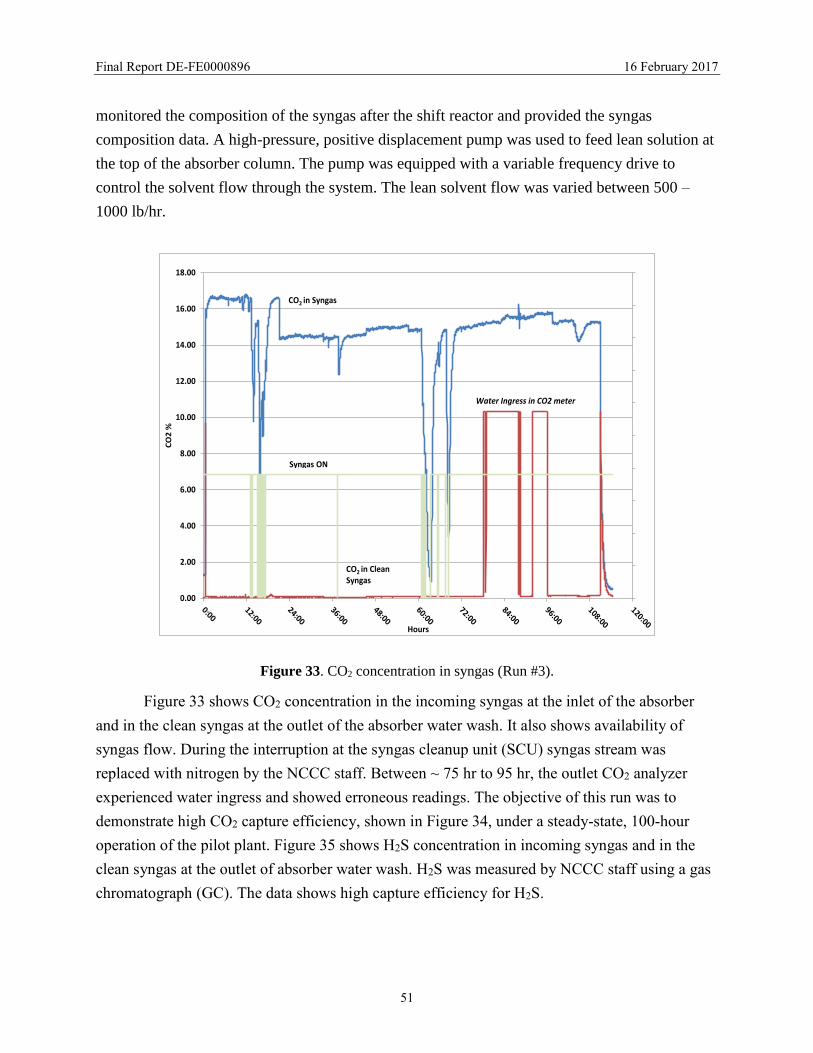
Figure 34. CO2 capture efficiency (Run #3). ............................................................................... 52
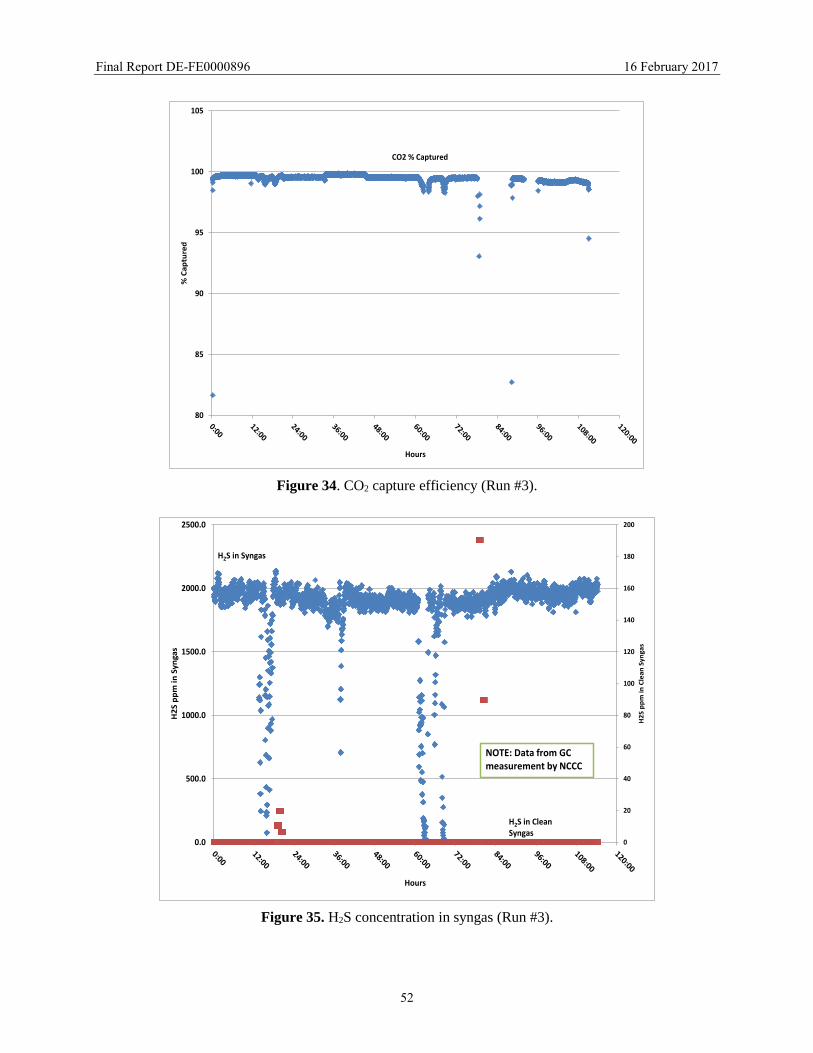
Figure 35. H2S concentration in syngas (Run #3). ....................................................................... 52
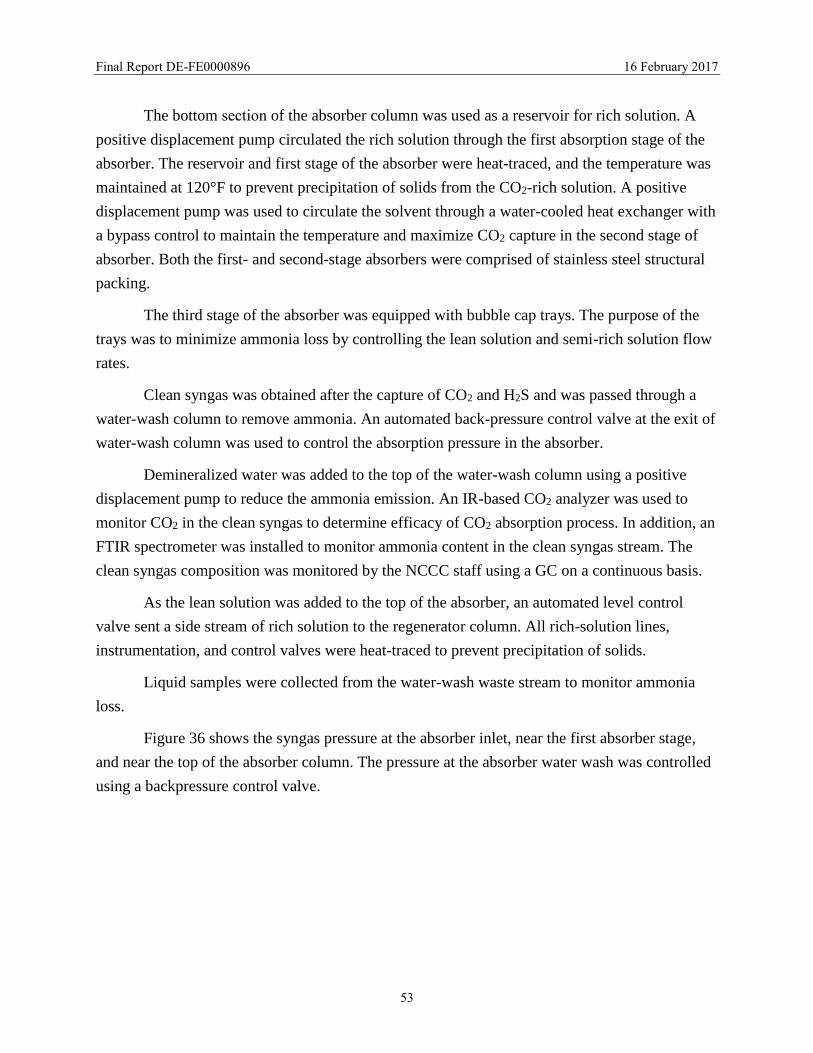
Figure 36. Absorber pressure (Run #3). ....................................................................................... 54
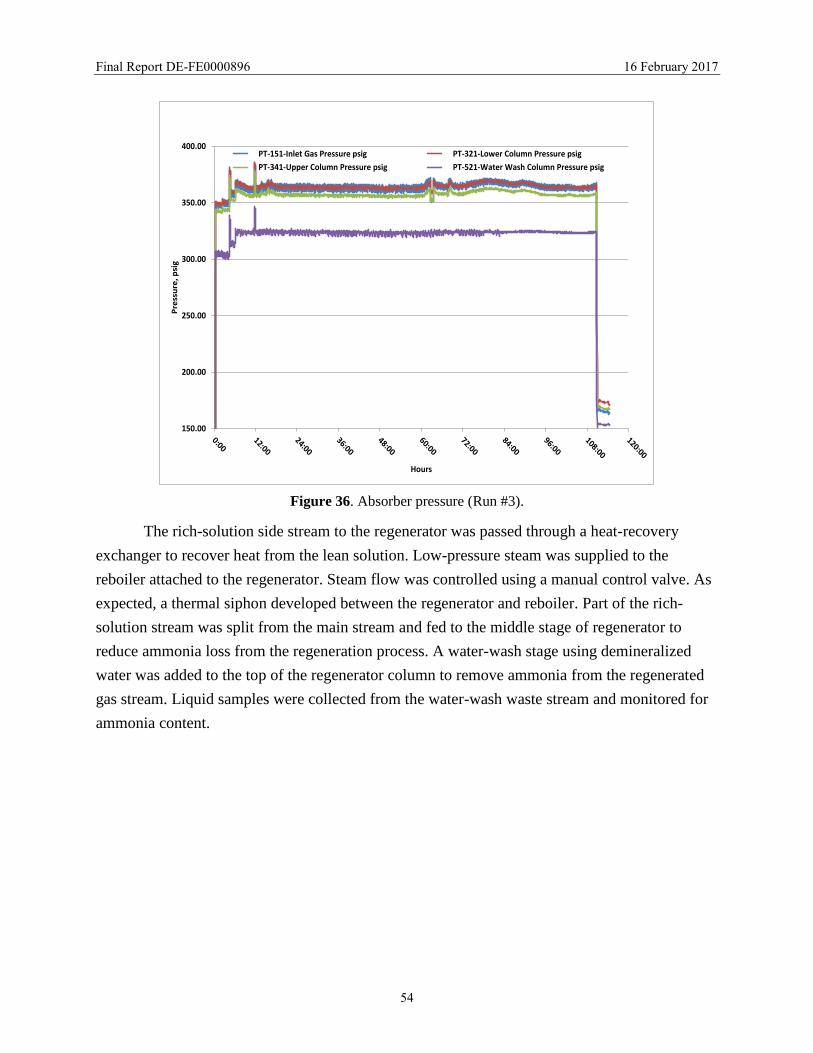
Figure 37. Regenerator pressure (Run #3). .................................................................................. 55
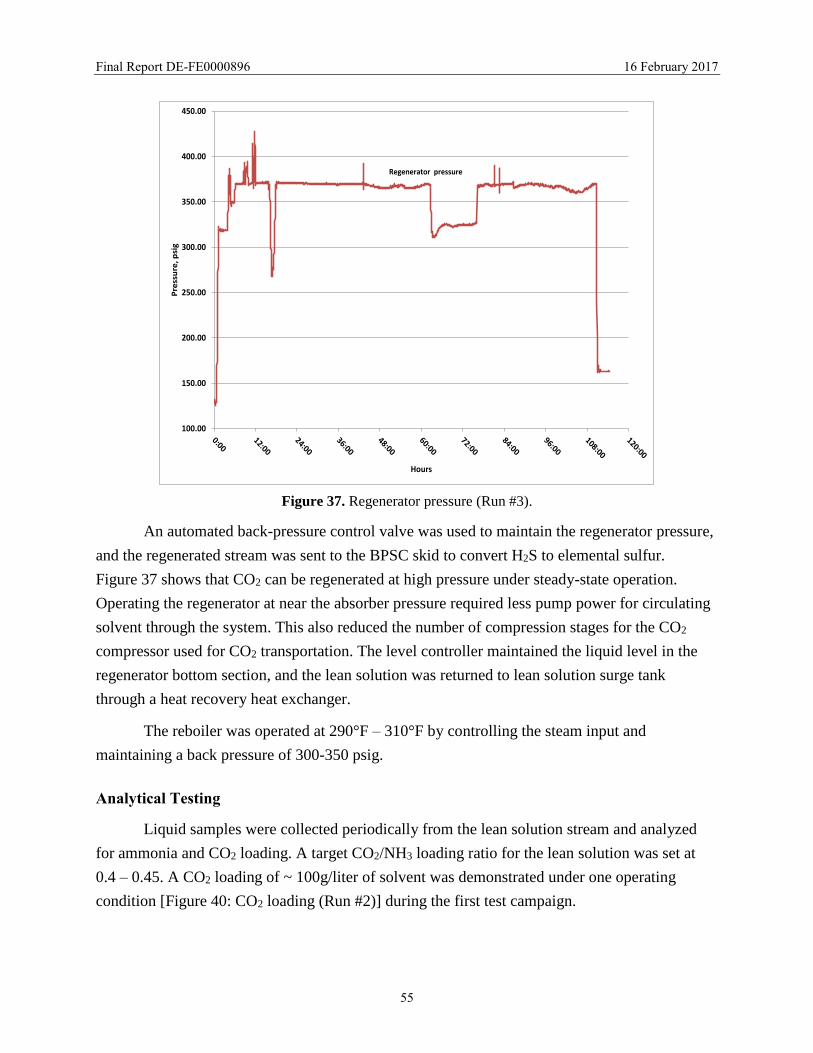
Figure 38. CO2 loading (Run #3). ................................................................................................ 56
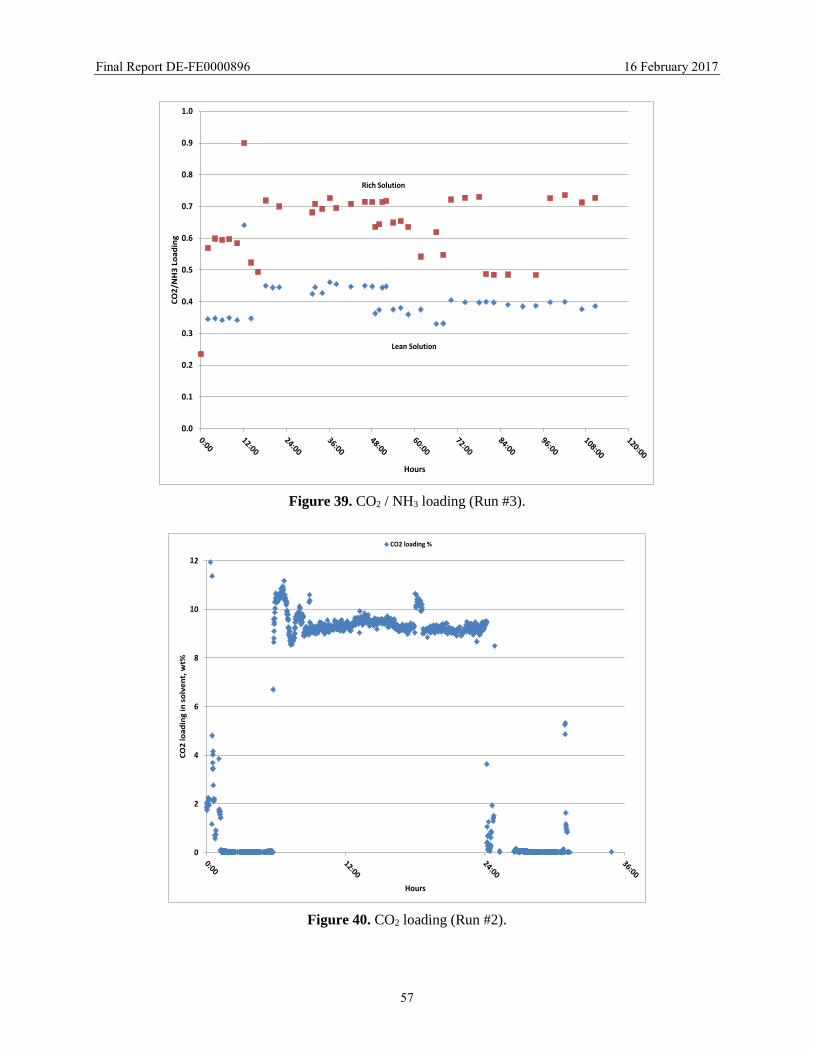
Figure 39. CO2 / NH3 loading (Run #3). ...................................................................................... 57
Figure 40. CO2 loading (Run #2). ................................................................................................ 57
Figure 41. NH3 & H2S concentrations in regenerator gas. ........................................................... 58
Figure 42. Gas composition (dry basis) of regenerated gas stream. ............................................ 59
Figure 43. Mass balance of hydrogen. ......................................................................................... 59
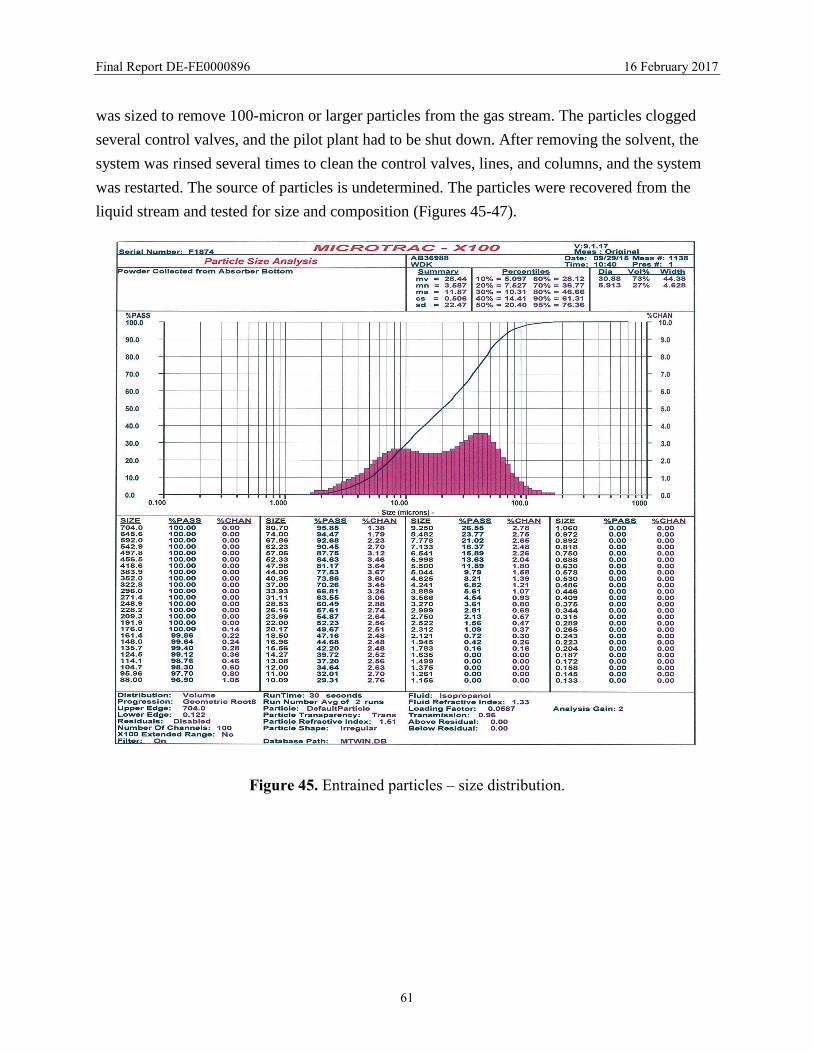
Figure 44. NH3 concentration in clean syngas. ............................................................................ 60
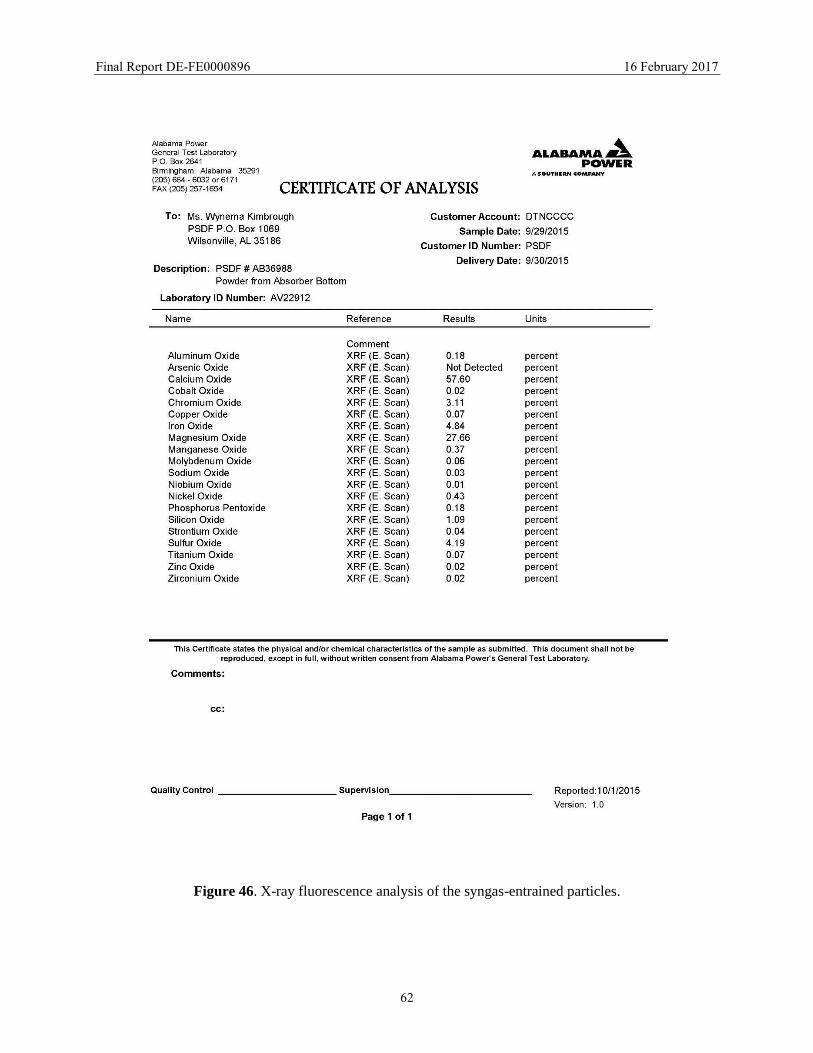
Figure 46. X-ray fluorescence analysis of the syngas-entrained particles. .................................. 62
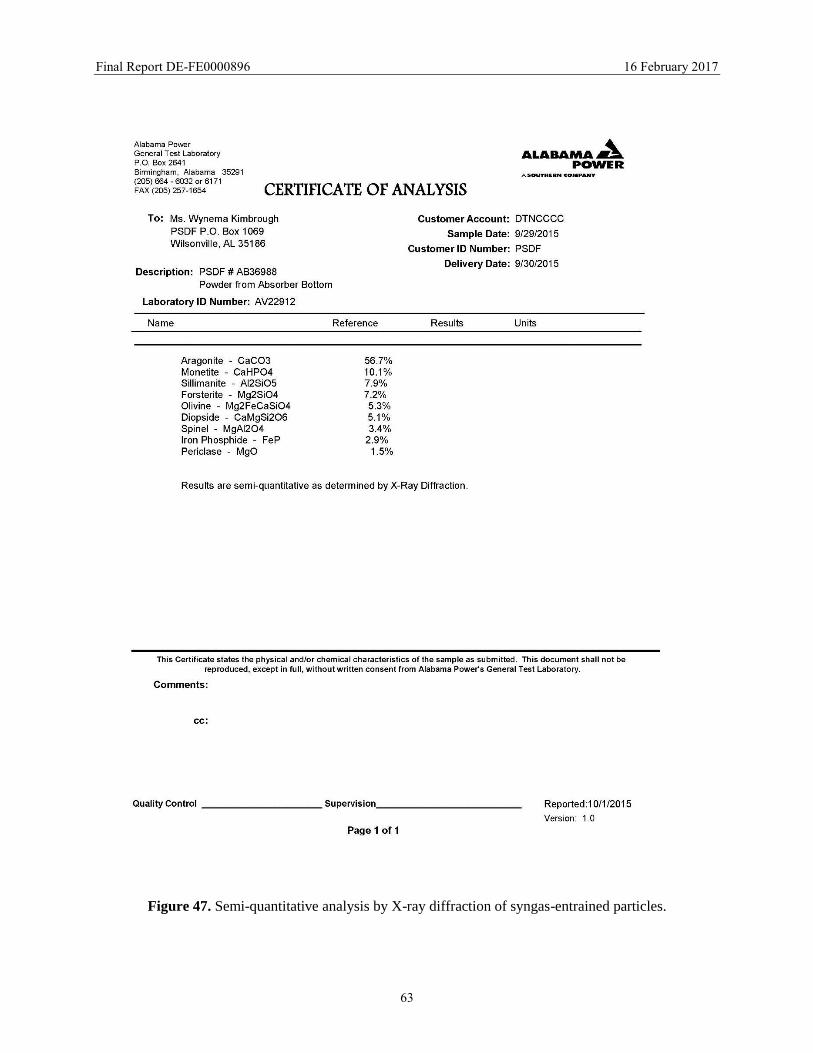
Figure 47. Semi-quantitative analysis by X-ray diffraction of syngas-entrained particles. ......... 63
Figure 48. Sulfur in outlet plenum of reactor intercooler HX-04. ............................................... 64
Figure 49. Close-up view of sulfur in outlet plenum of reactor intercooler HX-04. ................... 65
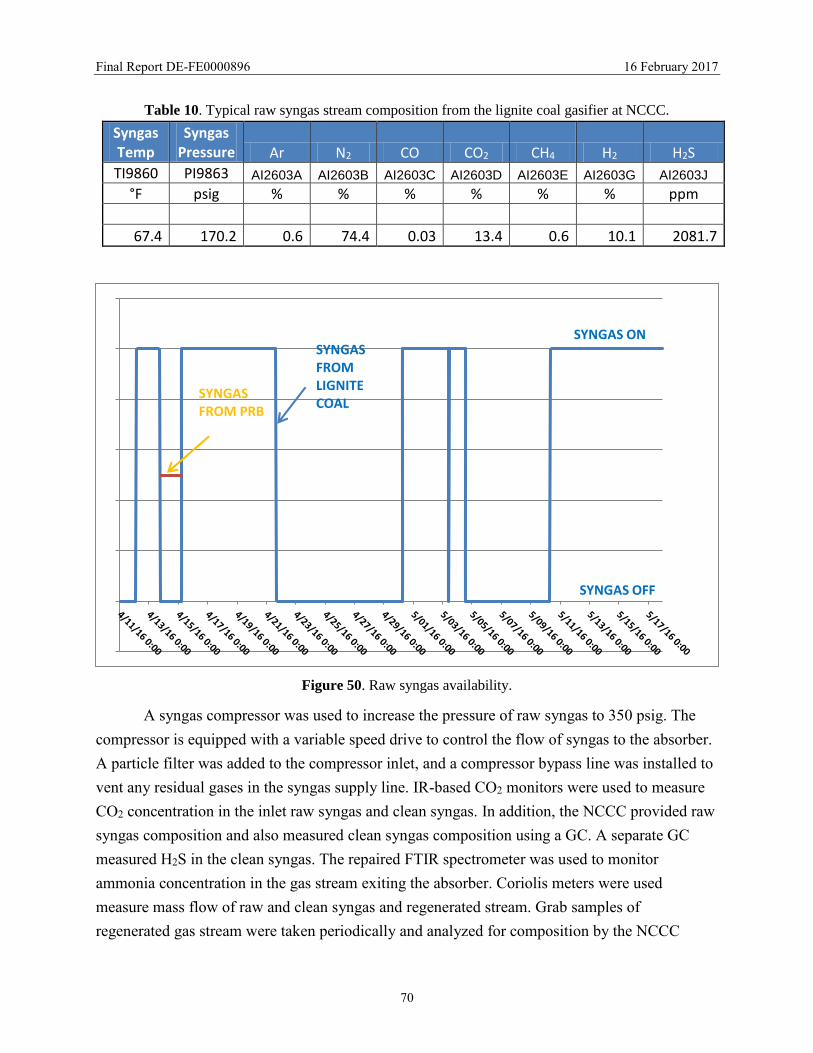
Figure 50. Raw syngas availability. ............................................................................................. 70
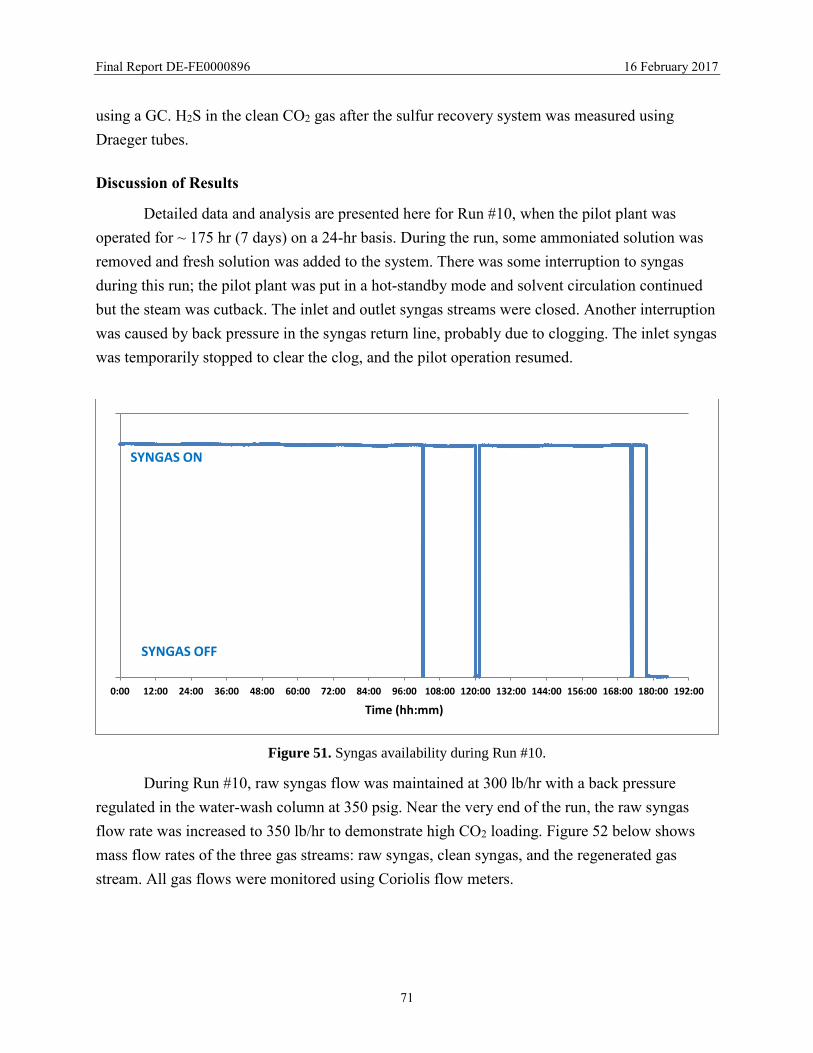
Figure 51. Syngas availability during Run #10............................................................................ 71
Figure 52. Raw syngas, clean syngas, and regenerated gas stream mass flow rate (Run #10). ... 72
Figure 53. Concentration of CO2 in raw and clean syngas (Run #10). ........................................ 72
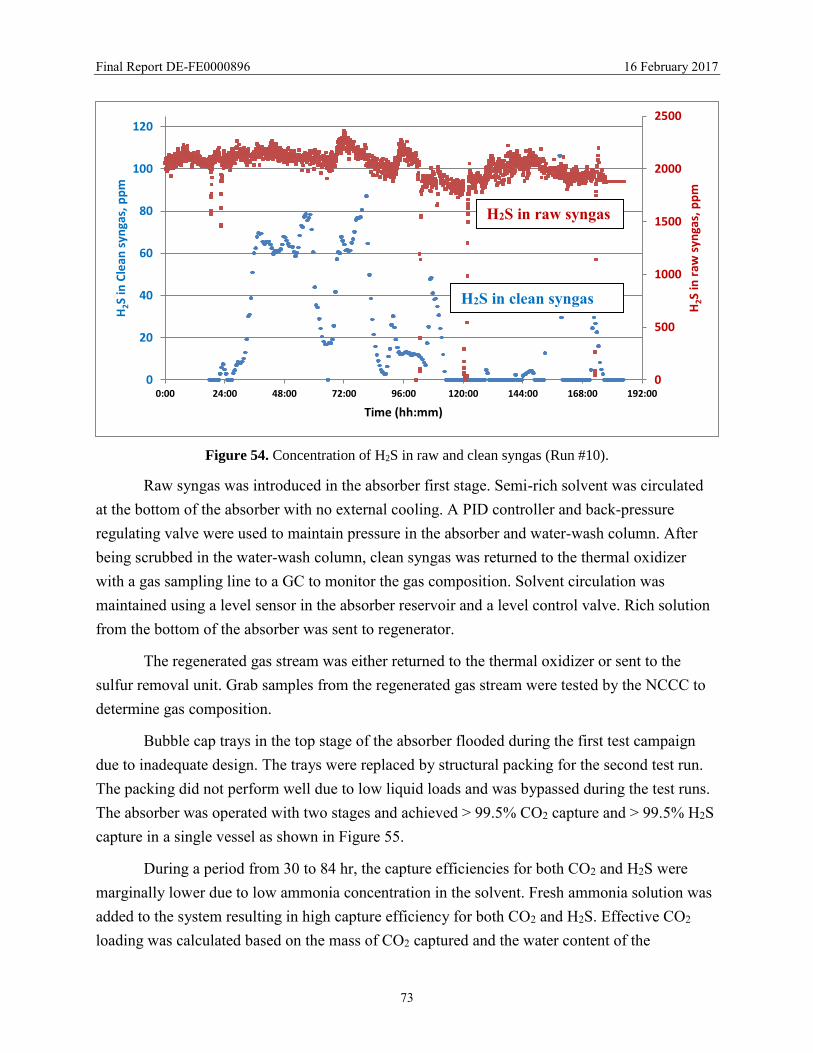
Figure 54. Concentration of H2S in raw and clean syngas (Run #10). ........................................ 73
Figure 55. Capture efficiency and CO2 loading in solvent (Run #10). ........................................ 74
Figure 56. CO2 loading varied by changing solvent recirculation rate (Run #10)....................... 75
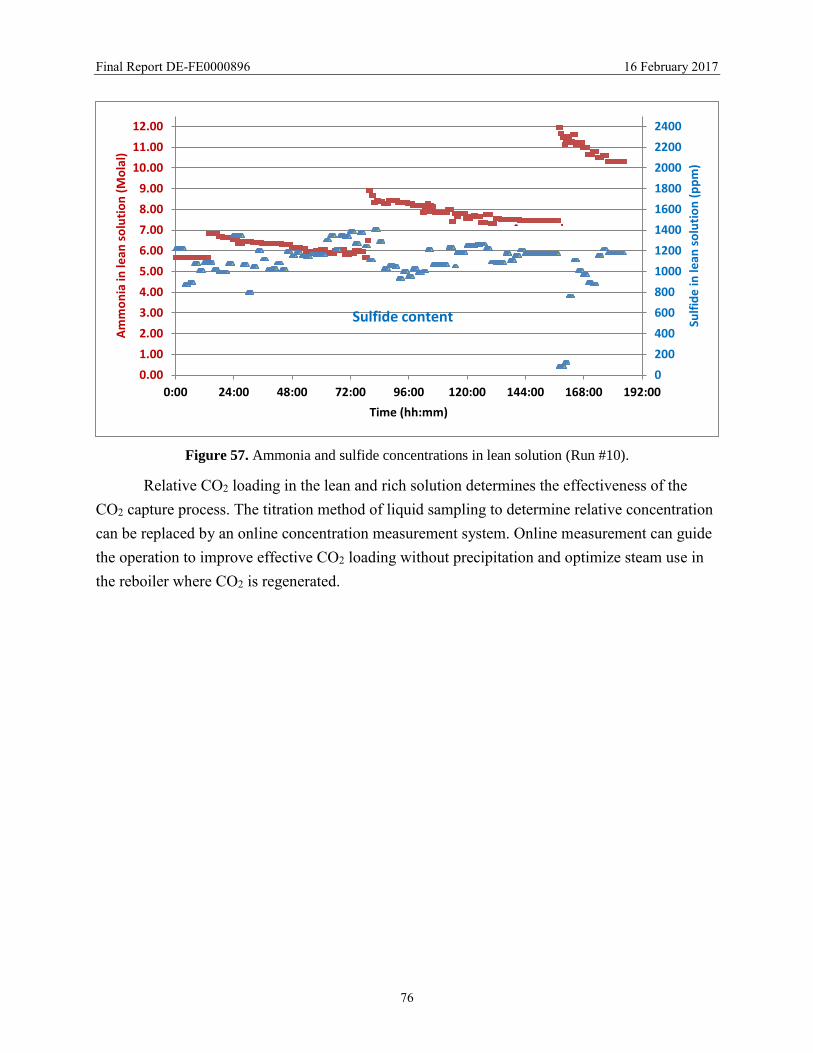
Figure 57. Ammonia and sulfide concentrations in lean solution (Run #10). ............................. 76
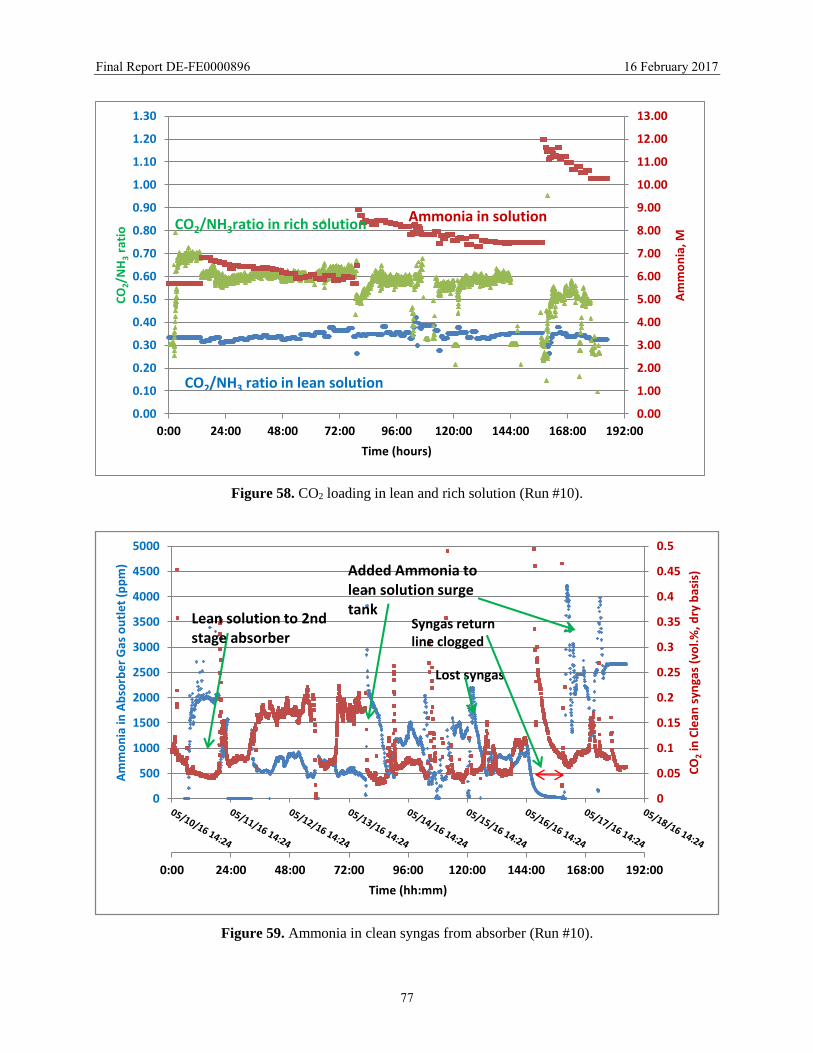
Figure 58. CO2 loading in lean and rich solution (Run #10). ...................................................... 77
Figure 59. Ammonia in clean syngas from absorber (Run #10). ................................................. 77
Figure 60. Absorber bottom-stage temperature profile (Run # 10). ............................................ 78
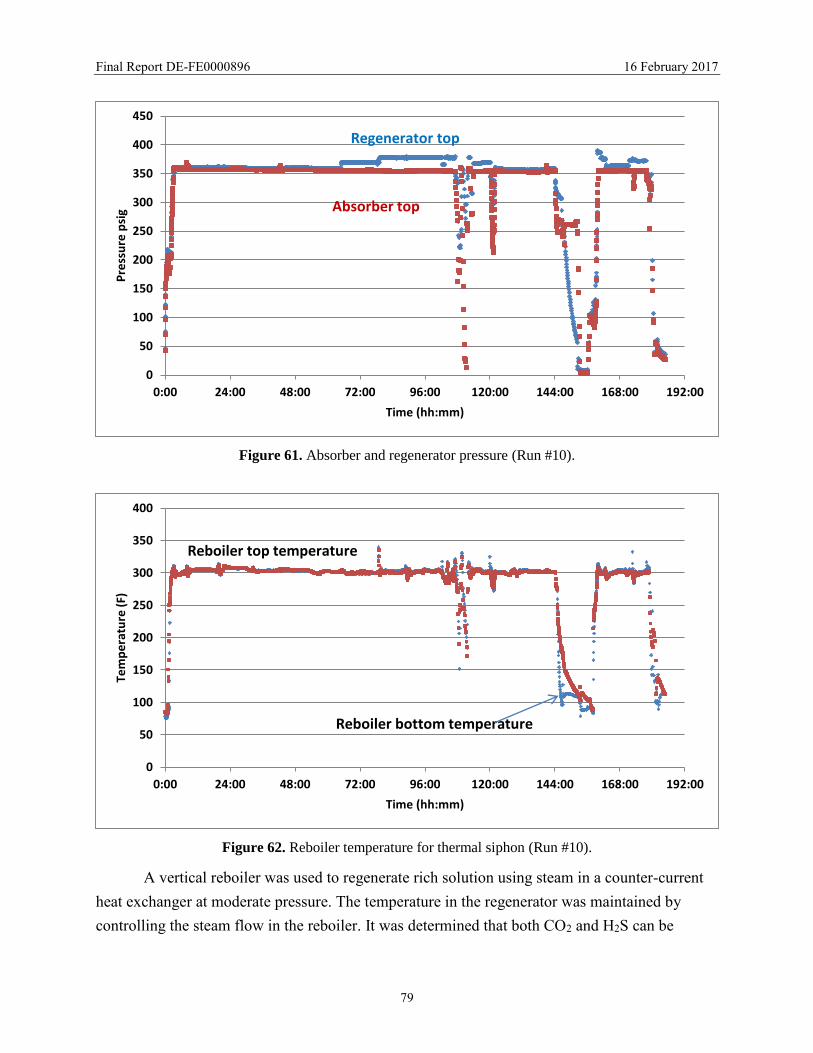
Figure 61. Absorber and regenerator pressure (Run #10). ........................................................... 79
Figure 62. Reboiler temperature for thermal siphon (Run #10). ................................................. 79
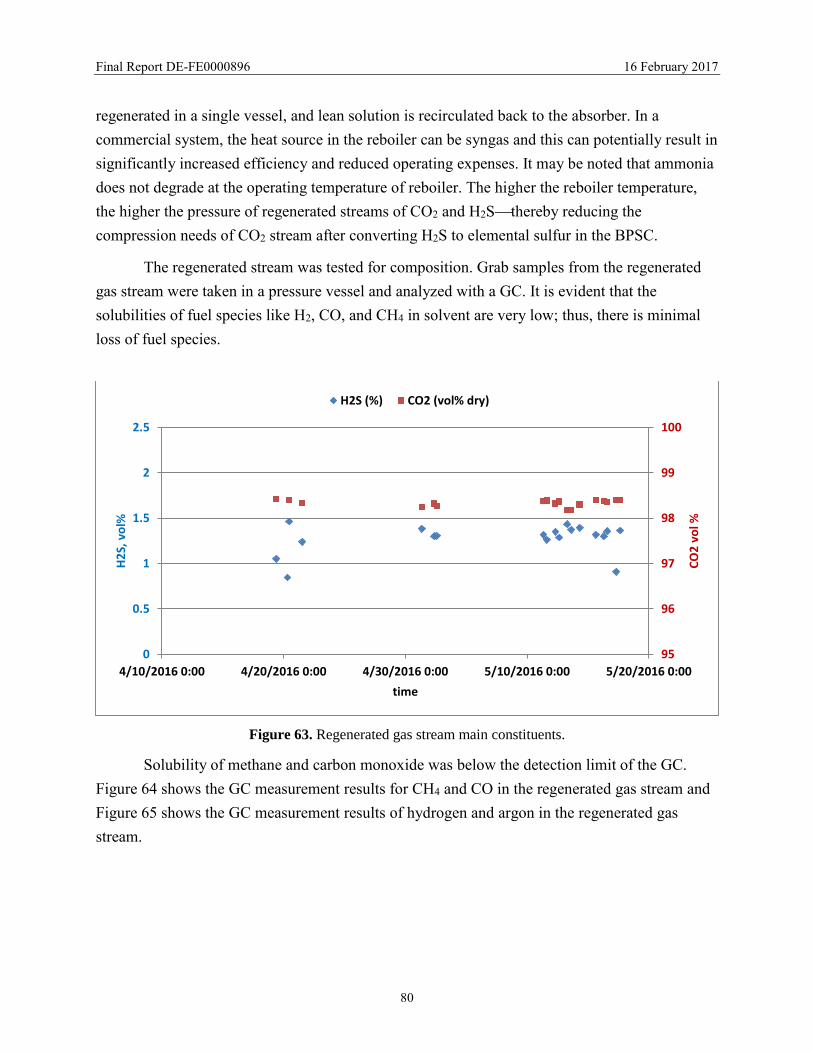
Figure 63. Regenerated gas stream main constituents. ................................................................ 80
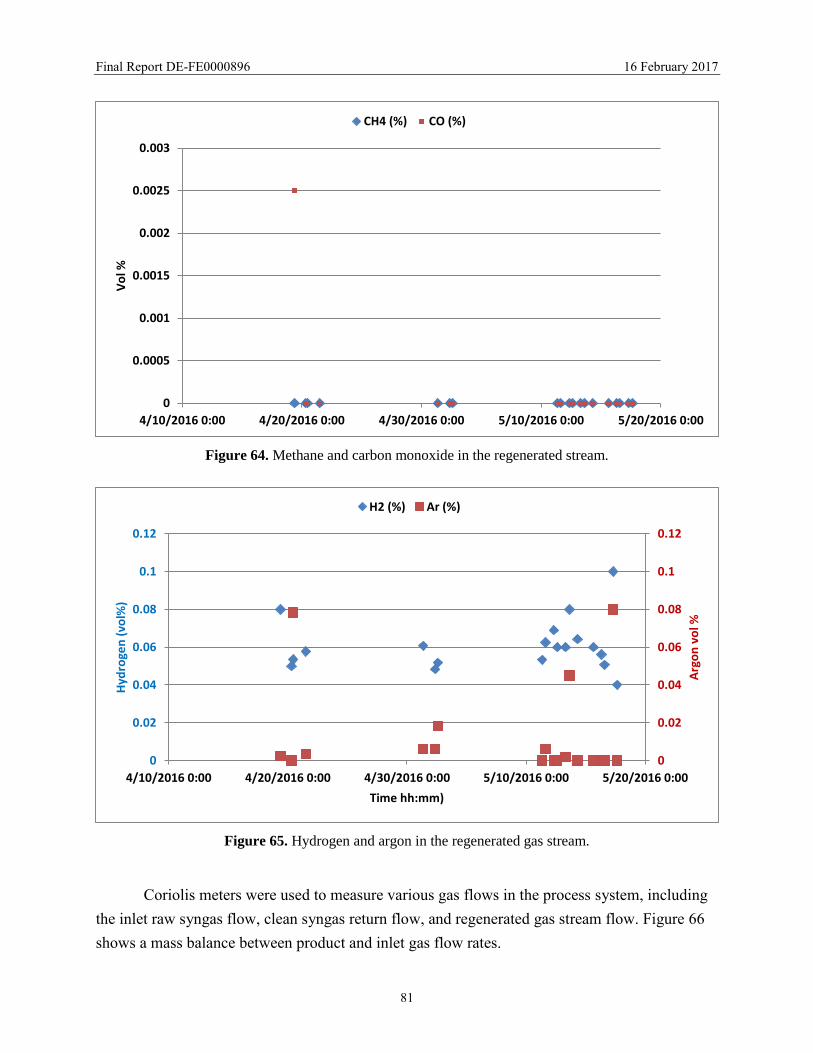
Figure 64. Methane and carbon monoxide in the regenerated stream. ........................................ 81
Page 7
Final Report DE-FE0000896 16 February 2017
6
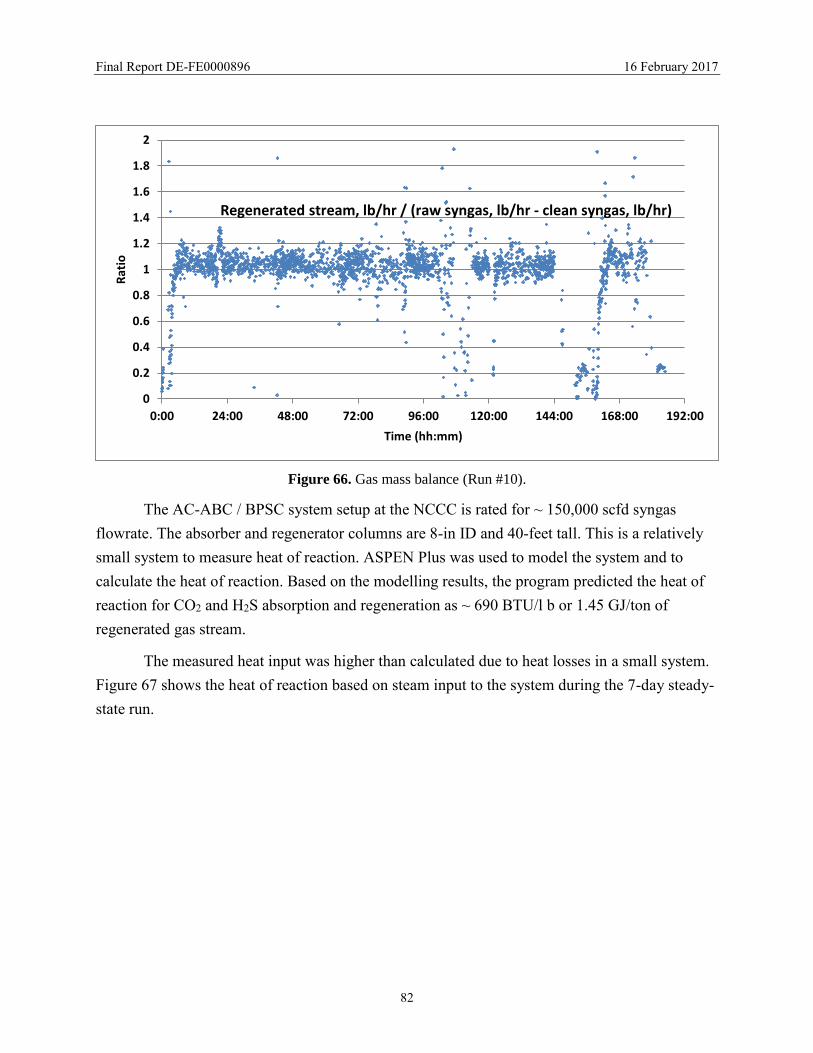
Figure 65. Hydrogen and argon in the regenerated gas stream. ................................................... 81
Figure 66. Gas mass balance (Run #10). ..................................................................................... 82
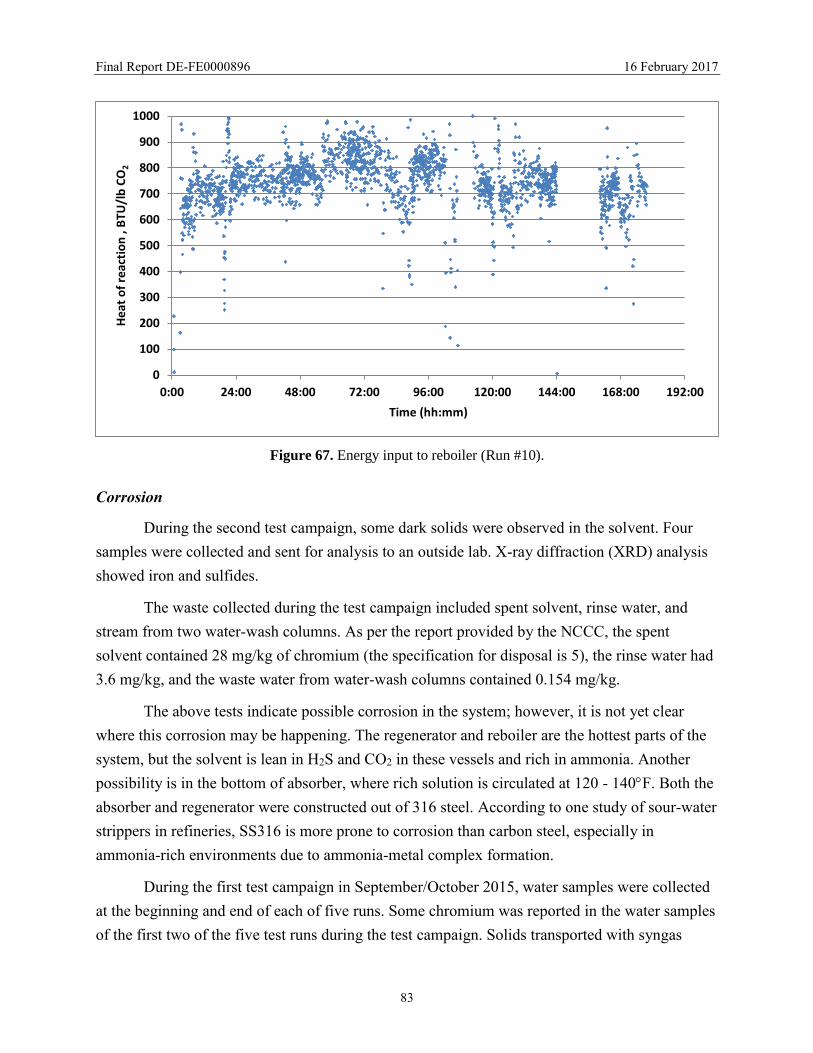
Figure 67. Energy input to reboiler (Run #10)............................................................................. 83
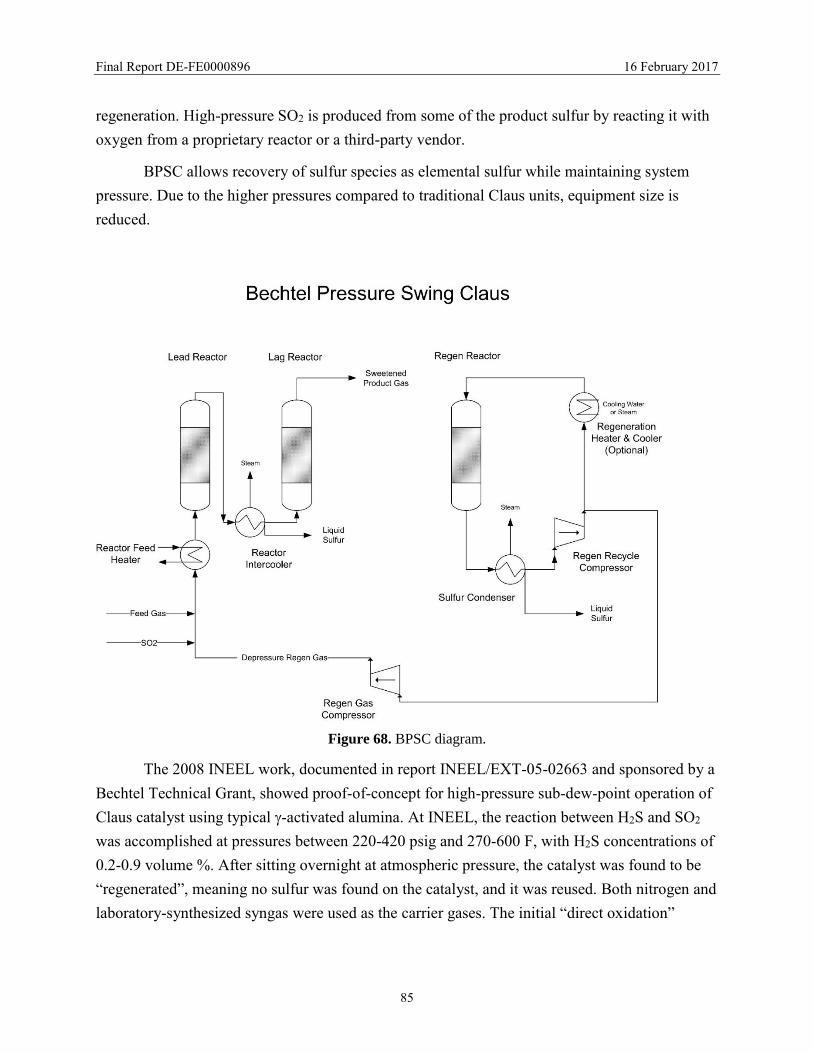
Figure 68. BPSC diagram. ........................................................................................................... 85
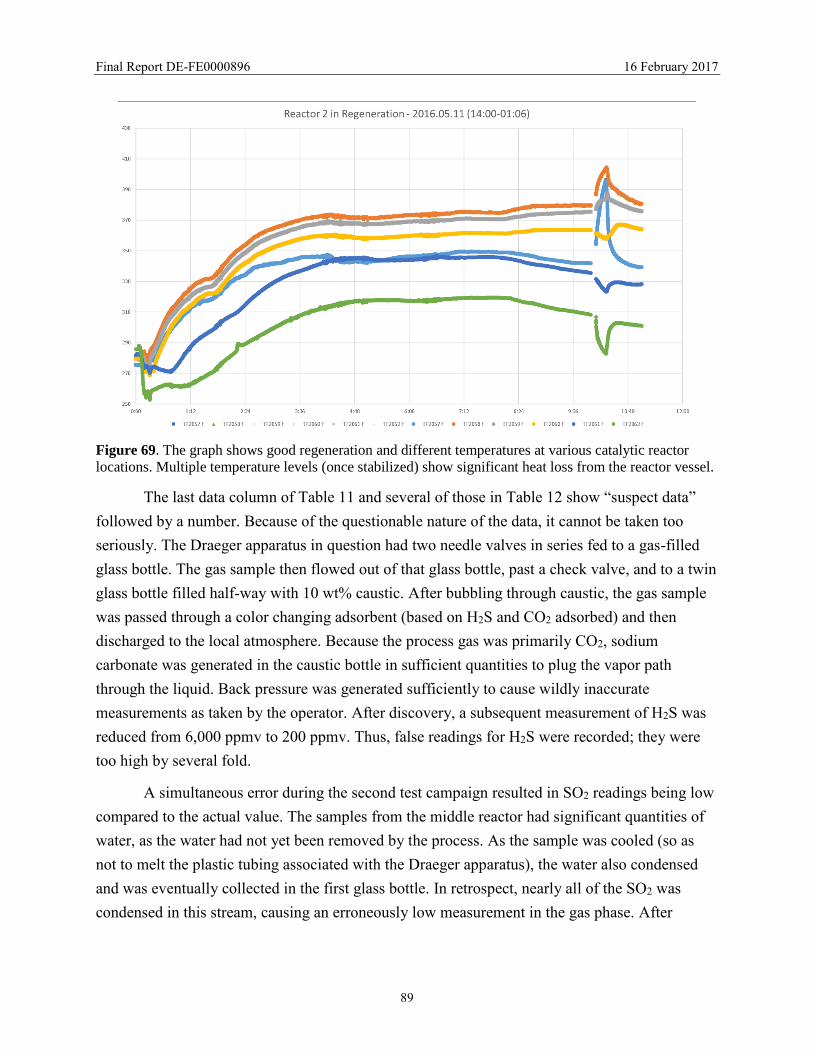
Figure 69. The graph shows good regeneration and different temperatures at various catalytic
reactor locations. Multiple temperature levels (once stabilized) show significant heat loss from
the reactor vessel. .......................................................................................................................... 89
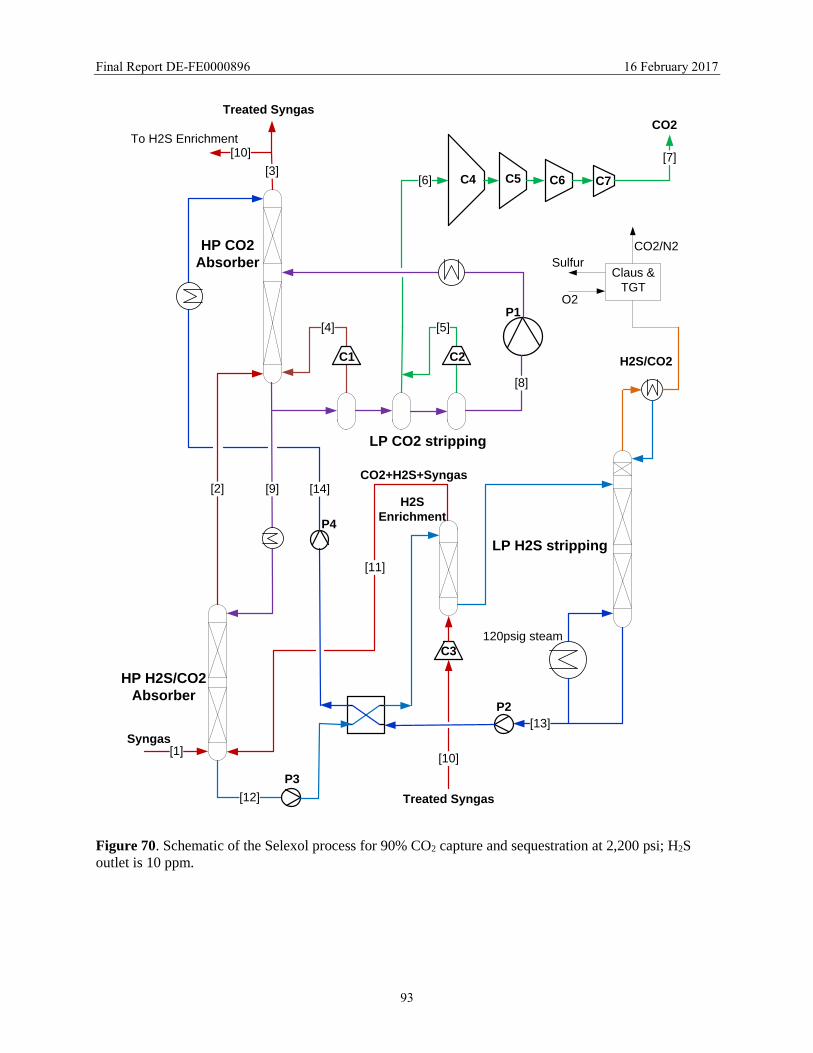
Figure 70. Schematic of the Selexol process for 90% CO2 capture and sequestration at 2,200 psi;
H2S outlet is 10 ppm. .................................................................................................................... 93
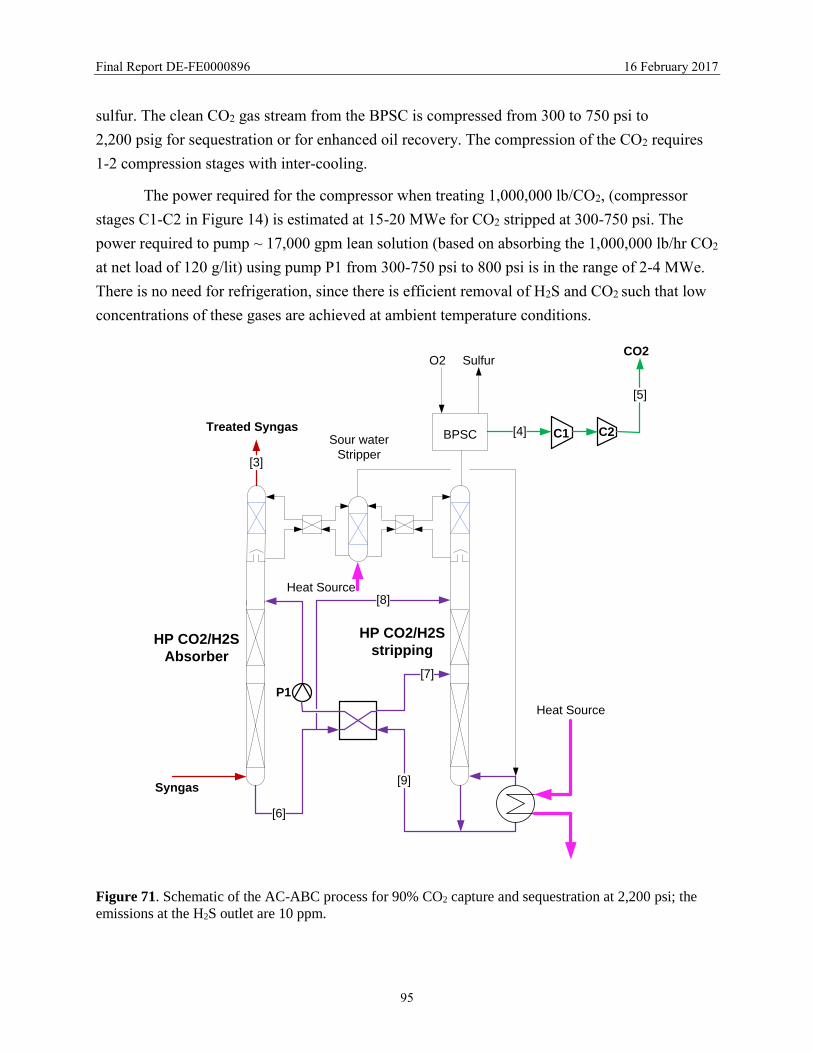
Figure 71. Schematic of the AC-ABC process for 90% CO2 capture and sequestration at
2,200 psi; the emissions at the H2S outlet are 10 ppm. ................................................................. 95
Figure 72. CO2 compressor power for compression of 500 st/h of CO2 to 2,215 psia. ............... 96
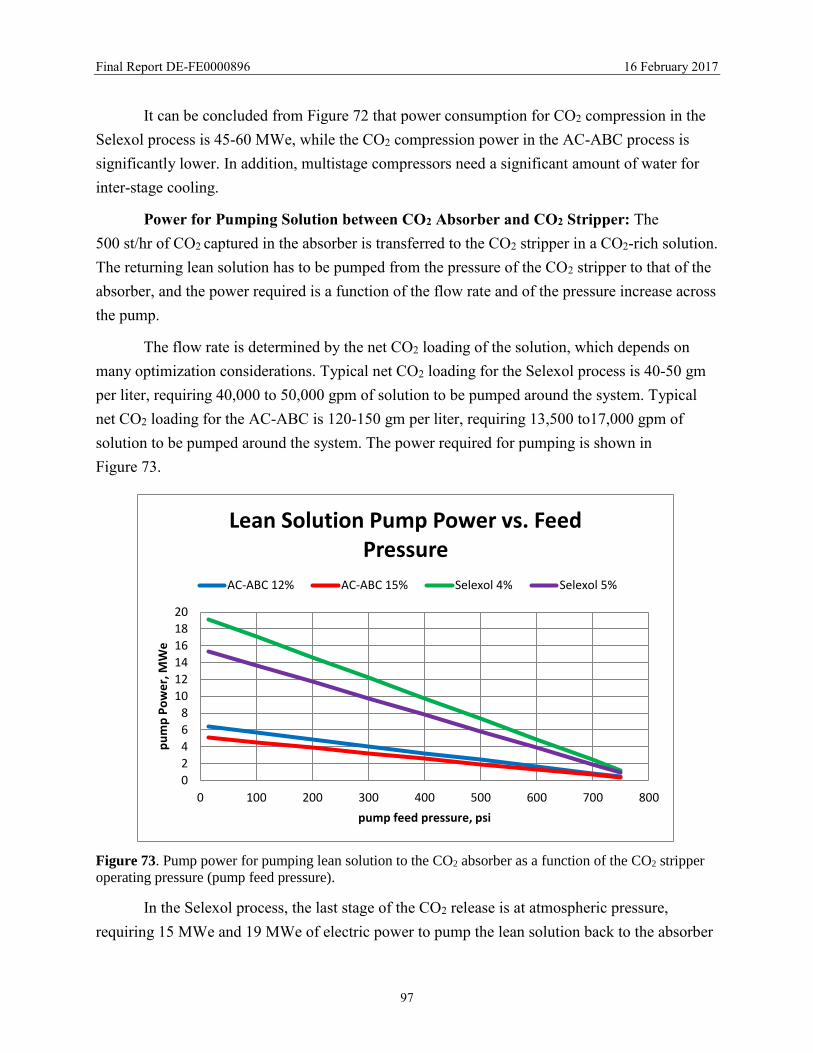
Figure 73. Pump power for pumping lean solution to the CO2 absorber as a function of the CO2
stripper operating pressure (pump feed pressure). ........................................................................ 97
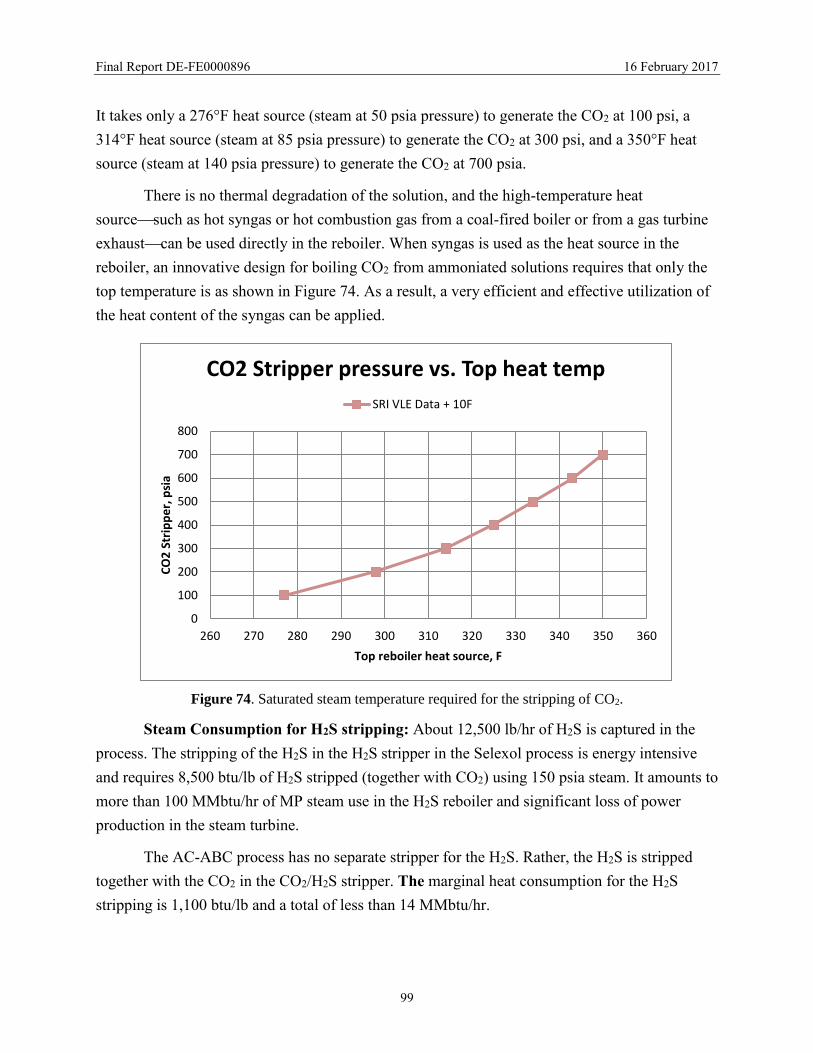
Figure 74. Saturated steam temperature required for the stripping of CO2. ................................ 99
Figure 75. Case B5B block flow diagram. ................................................................................. 103
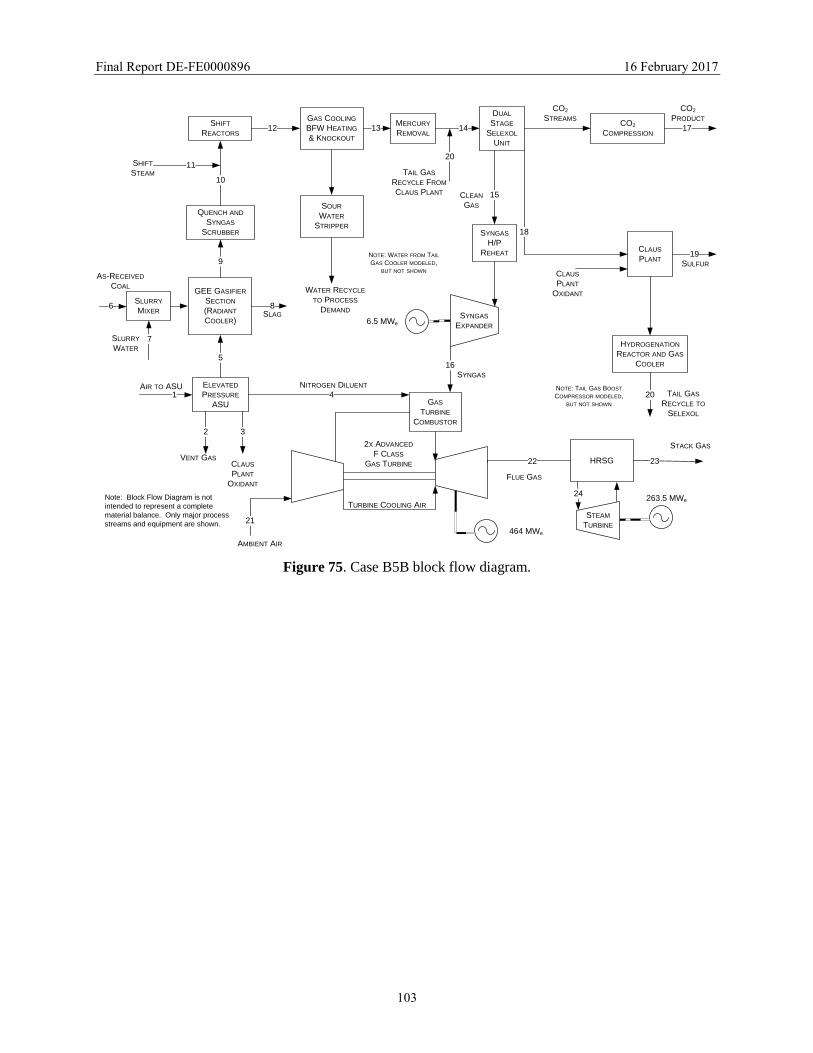
Figure 76. GEE IGCC block flow diagram with AC-ABC and BPSC. ..................................... 105
Figure 77. AC-ABC block flow diagram. .................................................................................. 112
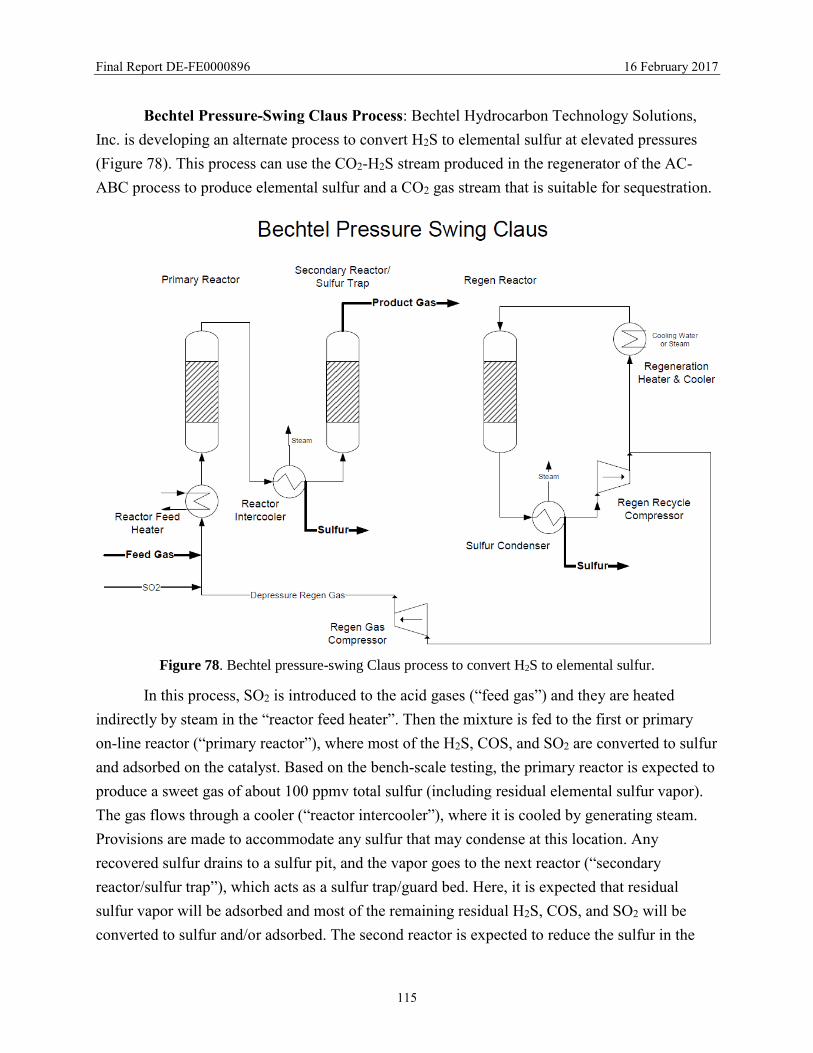
Figure 78. Bechtel pressure-swing Claus process to convert H2S to elemental sulfur. ............. 115
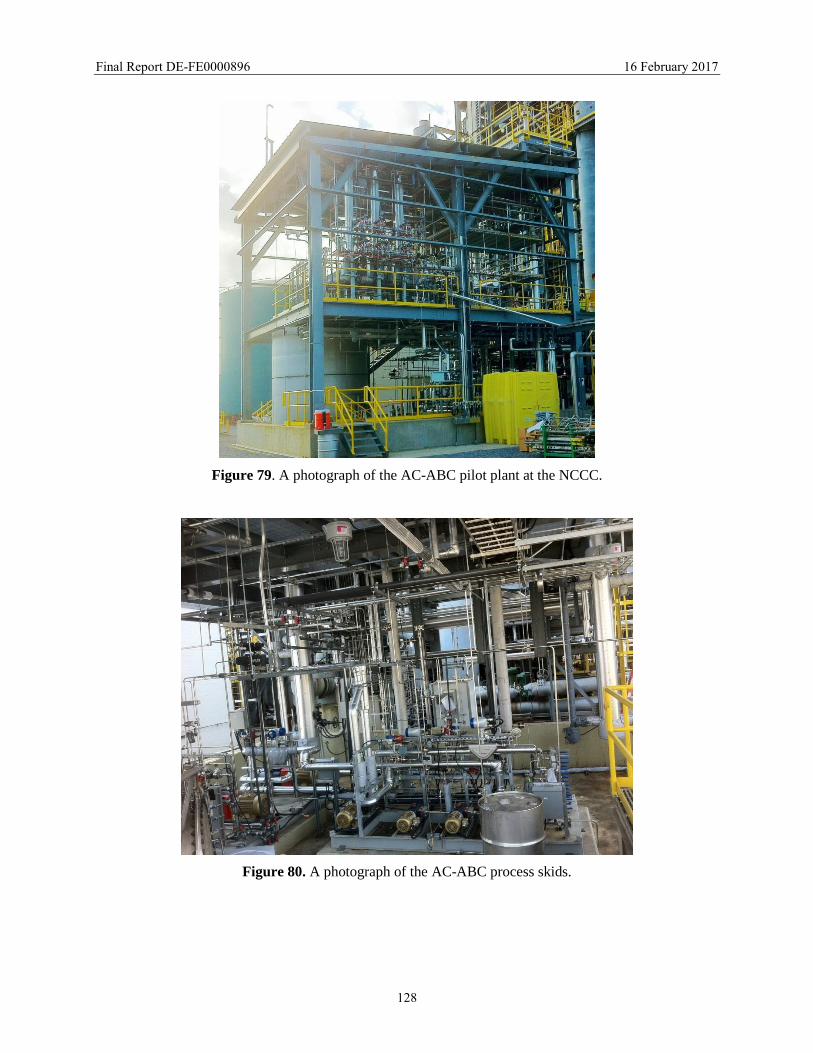
Figure 79. A photograph of the AC-ABC pilot plant at the NCCC. .......................................... 128
Figure 80. A photograph of the AC-ABC process skids............................................................ 128
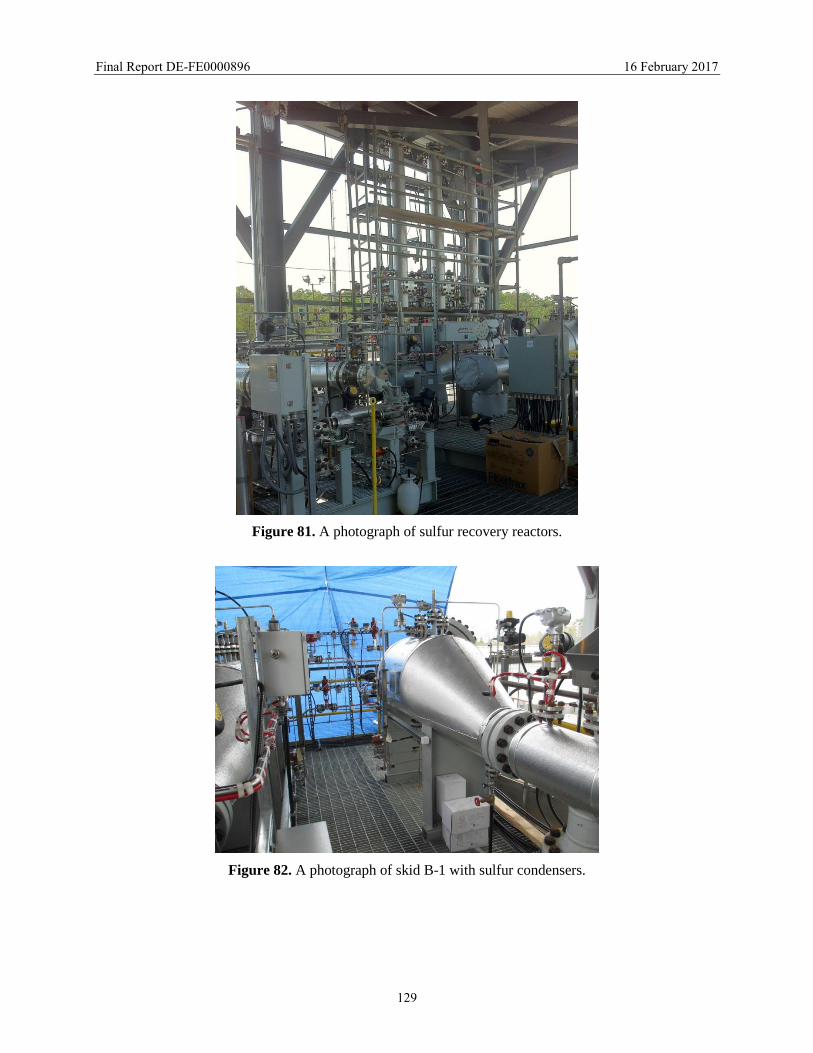
Figure 81. A photograph of sulfur recovery reactors. ................................................................ 129
Figure 82. A photograph of skid B-1 with sulfur condensers. ................................................... 129
Page 8
Final Report DE-FE0000896 16 February 2017
7
ABSTRACT
The objective of this project was to develop a novel, low-cost CO2 capture process from
pre-combustion gas streams. The bench-scale work was conducted at the SRI International. A
0.15-MWe integrated pilot plant was constructed and operated for over 700 hours at the National
Carbon Capture Center, Wilsonville, AL.
The AC-ABC (ammonium carbonate-ammonium bicarbonate) process for capture of CO2
and H2S from the pre-combustion gas stream offers many advantages over Selexol-based
technology. The process relies on the simple chemistry of the NH3-CO2-H2O-H2S system and on
the ability of the aqueous ammoniated solution to absorb CO2 at near ambient temperatures and
to release it as a high-purity, high-pressure gas at a moderately elevated regeneration
temperature. It is estimated the increase in cost of electricity (COE) with the AC-ABC process
will be ~ 30%, and the cost of CO2 captured is projected to be less than $27/metric ton of CO2
while meeting 90% CO2 capture goal.
The Bechtel Pressure Swing Claus (BPSC) is a complementary technology offered by
Bechtel Hydrocarbon Technology Solutions, Inc. BPSC is a high-pressure, sub-dew-point Claus
process that allows for nearly complete removal of H2S from a gas stream. It operates at gasifier
pressures and moderate temperatures and does not affect CO2 content. When coupled with AC-
ABC, the combined technologies allow a nearly pure CO2 stream to be captured at high pressure,
something which Selexol and other solvent-based technologies cannot achieve.
Page 9
Final Report DE-FE0000896 16 February 2017
8
EXECUTIVE SUMMARY
Capturing CO2 from coal-fired power plants is a critical step in carbon sequestration. In
the integrated gasification combined cycle (IGCC) process, which generates electricity more
efficiently than do pulverized coal (PC) combustion power plants, coal is reacted with steam and
O2 under pressure in the range of 300 to 1000 psi to form a fuel gas containing mainly CO, H2,
H2S, CO2, and residual steam. The current “best-case” option for carbon capture is using a liquid
solvent such as Selexol or Rectisol to absorb CO2 and H2S at elevated pressures, and it is
estimated that the cost of electricity (COE) will increase by more than 41% if CO2 is captured by
a Selexol-based process (NETL 2015).
The AC-ABC (ammonium carbonate-ammonium bicarbonate) process for capture of CO2
and H2S from the pre-combustion gas stream offers many advantages over Selexol-based
technology. The process relies on the simple chemistry of the NH3-CO2-H2O-H2S system and on
the ability of the aqueous ammoniated solution to absorb CO2 at near ambient temperatures and
to release it as a high-purity, high-pressure gas at a moderately elevated temperature. It is
estimated the increase in COE with the AC-ABC process will be ~ 30%, and the cost of CO2
captured is projected to be less than $27/metric ton of CO2 while meeting 90% CO2 capture goal.
In Budget Period 1, we used a bench-scale absorber and determined the optimum
operating conditions for absorption of CO2 and H2S from simulated fuel gas streams using
ammoniated solutions at elevated pressures. A bench-scale reactor was also used to strip CO2
and H2S from loaded solutions containing carbonates and sulfides. A preliminary economic
analysis was performed to estimate the COE for CO2 capture using the AC-ABC process and
compare it with a Selexol-based process. The results of this analysis showed that the AC-ABC
process offers a significant reduction in the increase in the COE and has the potential to meet the
DOE target.
Based on the bench-scale test results, a small-scale pilot plant (0.15 MWe) was designed
to process 500 lb/hr of shifted syngas from an air blown gasifier at the National Carbon Capture
Center (NCCC) in Wilsonville, Alabama during Budget Period 2. Bechtel Hydrocarbon
Technologies, Inc. designed a sub-dew-point Claus process that was installed downstream to
separate H2S from CO2 and convert the same to elemental sulfur.
The pilot plant was operated for over 700 hours in two test campaigns including a
continuous 7-day (175 hr) run. Based on the results from the test runs and liquid and gas
analysis, the following conclusions can be drawn:
Page 10
Final Report DE-FE0000896 16 February 2017
9
Ammoniated solution is very effective in rapid absorption of CO2 with high CO2
loading at elevated pressure. CO2 capture efficiency greater than 99% was
demonstrated, with 12% CO2 effective loading.
H2S can be simultaneously absorbed along with CO2 in a single absorber column. The
H2S capture efficiency was greater than 99%.
The absorption and thus loss of fuel gas species like H2, CO, and CH4 was shown to
be very low.
Low ammonia loss from the system was demonstrated.
Both the absorber and regenerator were operated at similar elevated pressure, thus
reducing the need for pumping solvents across pressure boundaries.
Simultaneous stripping of CO2 and H2S was demonstrated in a single column at
elevated pressure and moderate temperature.
The Bechtel Pressure-Swing Claus Process (BPSC) process demonstrated conversion
of H2S to high-purity elemental sulfur, and a clean CO2 gas stream at elevated
pressure was available for sequestration or transportation.
Availability of regenerated CO2 at elevated pressure significantly reduced the
compressor requirements for CO2 sequestration.
A techno-economic analysis showed the cost of CO2 capture using the AC-ABC /
BPSC process from the IGCC gas stream is less than $27/metric ton of CO2.
Page 11
Final Report DE-FE0000896 16 February 2017
10
INTRODUCTION
Capturing CO2 from coal-fired power plants is a critical step in carbon sequestration. In
the IGCC process, which generates electricity more efficiently than do pulverized coal (PC)
combustion power plants, coal is reacted with steam and O2 under pressure in the range of 300 to
1000 psi to form a fuel gas containing mainly CO, H2, H2S, CO2, and residual steam. The CO in
the gas stream is converted to CO2 and H2 by using the water-gas shift reaction at about 200 to
285C. The gas stream leaving the water-gas shift reactor (WGSR) contains mainly H2, CO2,
H2S, and H2O. An H2-rich fuel gas suitable for combustion in a gas turbine is produced by
condensing the steam and removing the CO2 and H2S. The current “best-case” option for carbon
capture is using a liquid solvent such as Selexol or Rectisol to absorb CO2 and H2S at elevated
pressures.
The AC-ABC process for capture of CO2 and H2S in the precombustion gas stream offers
many advantages over solvent-based technology. The process relies on the simple chemistry of
the NH3-CO2-H2O-H2S system and on the ability of the aqueous ammoniated solution to absorb
CO2 at near ambient temperatures and to release it as a high-pressure gas at a moderately
elevated temperature.
Bechtel’s Pressure Swing Claus (BPSC) technology is used to recover sulfur from a high-
pressure gas (CO2, syngas, or hydrocarbons) as liquid sulfur using SO2 as an oxidant. Multiple sub-
dew-point reactors are used in rotation (Lead/Lag/Regeneration) similar to a molecular sieve
dehydration unit (Mole-Sieve), a pressure swing absorption unit (PSA), or a low-pressure sub-dew-
point Claus process.
The overall objective of the program was to develop, for IGCC-based power plants, an
innovative, low-cost CO2 capture technology based on absorption on a high-capacity and low-
cost aqueous ammoniated solution. The specific objectives were to:
1. Test the technology on a bench-scale batch reactor to validate the concept and to
determine the optimum operating conditions for a small pilot-scale reactor,
2. Design, build, and perform tests using a small pilot-scale reactor capable of
continuous integrated operation, and
3. Perform a technical and economic evaluation on the technology.
The experimental program consisted of three tasks:
1. Bench-scale batch tests
2. Pilot-scale integrated, continuous tests
3. Project management
Page 12
Final Report DE-FE0000896 16 February 2017
11
WORK PERFORMED
BUDGET PERIOD 1
The work performed in Budget Period 1 was mainly in Task 1. Task 1 consists of several
subtasks:
1. Bench-scale test unit construction
2. Development of test plans
3. Absorber tests
4. Regenerator tests
5. Bench-scale test data analysis
6. Preliminary process modeling
7. Preliminary economic analysis
Bench-scale Test Unit Construction
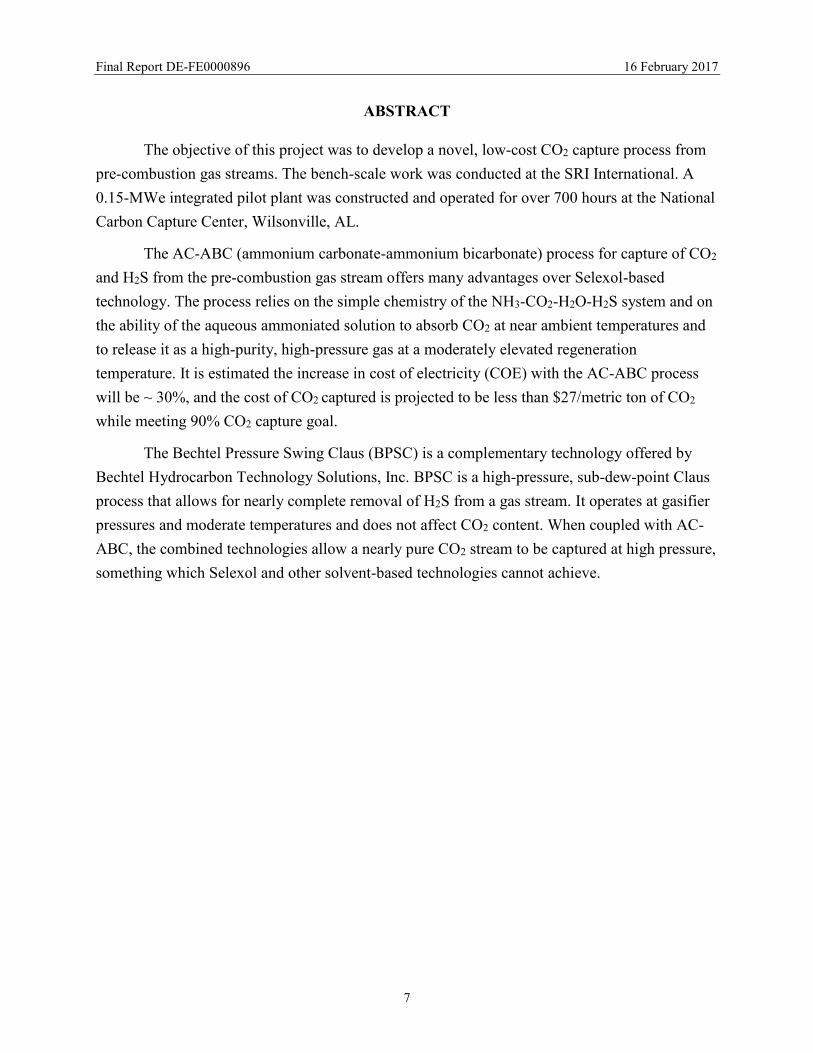
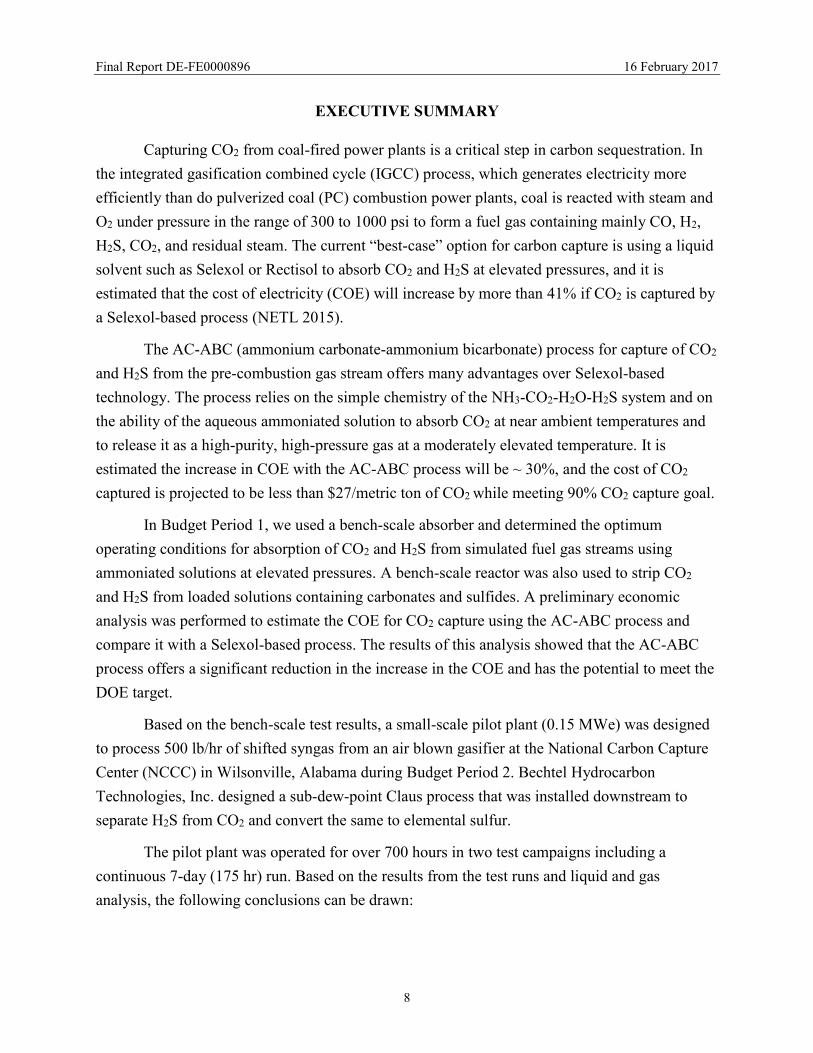
We modified an existing high-pressure reactor to conduct absorption tests with simulated
IGCC gas streams representative of those downstream of a WGSR. Figures 1 and 2 are a
schematic diagram and photograph of the bench-scale unit, respectively. The high-pressure
reactor or absorption column was constructed of stainless steel and is rated for operating up to
600 psi. It has an internal diameter (ID) of 4 in and a length of 48 in. A stainless steel structural
packing (22-in long) with a packing density of 425 m2/m3 is placed inside the column to facilitate
the gas-liquid contact. The ammonium carbonate feed solution is injected at the top of the
column using a high-pressure metering pump. The test gas stream consisting of CO2, H2, H2S,
and N2 is blended using pure or mixed gases and metered into the bottom of the column using
mass flow controllers. The absorber solution is circulated through the column with a gear pump,
and the liquid level inside the column is monitored with a level indicator that is capable of
operating at elevated pressures. The heat generated by the absorption reaction is removed from
the circulating solution with an external heat exchanger. The pressure, temperature, and flow rate
of liquid and gas streams are monitored and recorded. The gas exiting the reactor is scrubbed to
remove trace levels of H2S and vented. The circulating liquid is withdrawn at a rate to maintain a
constant level in the column and collected in the spent solution reservoir.
Page 13
Final Report DE-FE0000896 16 February 2017
12
Figure 1. Schematic diagram of the bench-scale test unit.
F
F
F
FEED SOLUTION
RESERVOIR
INJECTION
PUMP
RTD
CIRCULATION
PUMP
RTD
PRESSURE
GAUGE
LIQUID
LEVEL
INDICATOR
TO
ANALYZER
SCRUBBER
AND GAS
ANALYZER
F
P
P
OUTLET FLOW
HE
AT
EX
CH
AN
GE
R
F
F
H2, CO2, H2S
GAS CYLINDERS
MASS FLOW
CONTROLLERS
SPENT
SOLUTION
RESERVOIR
AB
SO
RP
TIO
N
CO
LU
MN
Page 14
Final Report DE-FE0000896 16 February 2017
13
Figure 2. A photograph of the bench-scale test unit.
The composition of the gas stream leaving the absorber was monitored by several
techniques including an on-line infrared absorption CO2 monitor, gas chromatography, and
liquid chromatography depending on the nature of the component. Infrared absorption is a
Ab
sorb
er
Co
lum
n
Le
ve
l G
au
ge
ReservoirHeat
Exchanger
Circulation
Pump
Injection Pump
Liquid
Flow
Meter
To gas
analyzer
Ab
sorb
er
Co
lum
n
Le
ve
l G
au
ge
ReservoirHeat
Exchanger
Circulation
Pump
Injection Pump
Liquid
Flow
Meter
To gas
analyzer
Page 15
Final Report DE-FE0000896 16 February 2017
14
standard technique for monitoring the CO2 concentration in a gas mixture. The gas
chromatography was used to determine the H2 and H2S concentrations in the gas stream. We
determined the residual NH3 concentration in the absorber exit gas by dissolving the gas in a
dilute acid and measuring NH3+ concentration with a liquid by ion chromatograph. The NH3 and
CO2 levels in the solution were determined by titration.
Bench-scale Absorber Tests
CO2 Absorption Rate Measurements: In the first series of tests (Test Series A), a 4 M
ammonia solution was tested at two different pressure (165 and 265 psi) and four different
temperatures (20°, 30°, 45°, and 55°C) to determine the effects of temperature and pressure on
the CO2 capture efficiency. Table 1 shows the test conditions. When conducting these tests, the
reactor was filled initially with the predetermined amount of 4 M ammonia solution with known
CO2 loading followed by solution recycle through the packing and the heat exchanger at the set
pressure; in most cases, N2 is used to set the pressure to the desired test pressure. Once the
system is equilibrated at a known temperature, pressure, and starting CO2 loading, the gas
mixture to be tested is introduced through the bottom of the absorber. The percentage of CO2
capture efficiency of the ammonia solution for capturing CO2 from the test gas stream is
evaluated by measuring the inlet CO2 concentration, and the outlet CO2 concentration is
measured using a Horiba infrared CO2 analyzer.
Table 1. Details of the initial absorber test conditions for a 50-SLPM test gas flow rate.
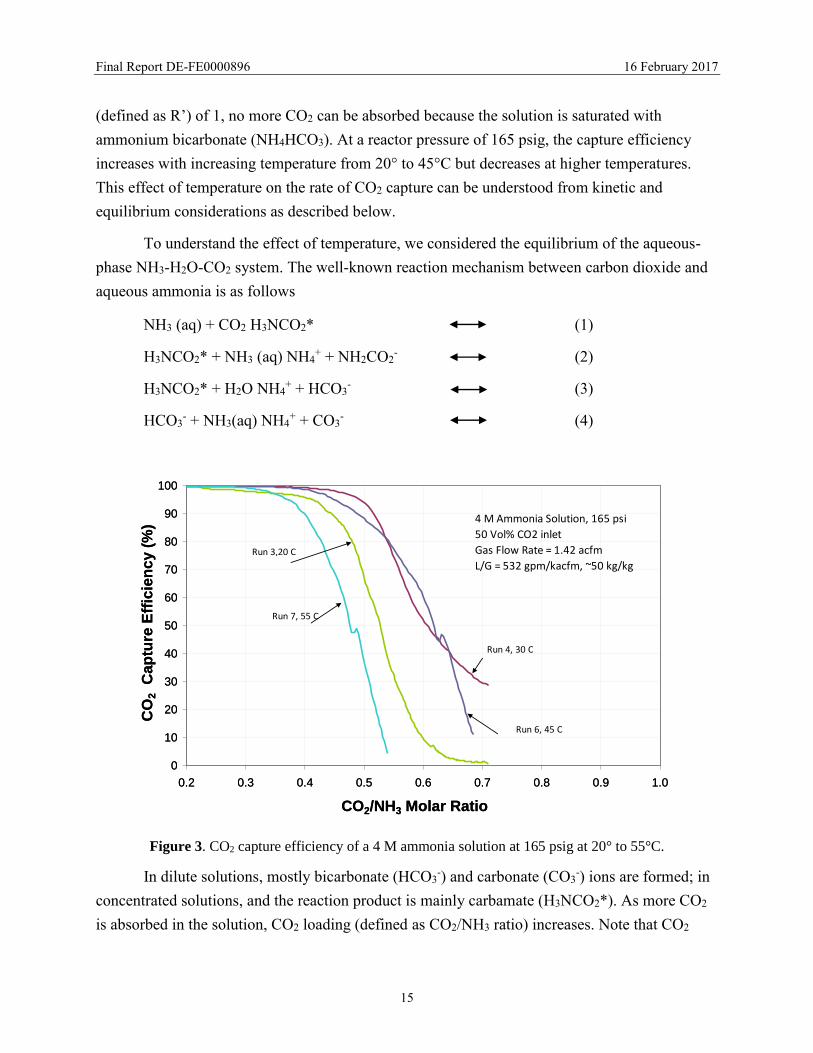
Figure 3 shows the data from Runs #3, 4, 6, and 7 that compares the effect of temperature
on the CO2 capture efficiency at 165 psi pressure. A test gas stream with a 50% v/v inlet CO2 at a
gas feed flow rate of 50 SLPM was used in these tests. The operating liquid-to-gas ratio of the
absorber was 50 kg/kg. The data shows that the capture efficiency is ~ 100% when the solution’s
CO2/NH3 ratio is less than 0.4, indicating that the absorption of CO2 into the solution is rapid. As
more CO2 is absorbed into the solution, the rate of CO2 capture decreases. At a CO2/NH3 ratio
Run Number NH3 Concenetration Starting CO2 Loading CO2-Feed Gas Temperature Pressure
(M) (CO2/NH3 molar ratio) (%) ( oC) (psi)
Run 3 4 0.14 50 20 165
Run 4 4 0.14 50 30 265
Run 5 4 0.14 50 20 165
Run 6 4 0.14 50 45 165
Run 7 4 0.14 50 55 165
Page 16
Final Report DE-FE0000896 16 February 2017
15
(defined as R’) of 1, no more CO2 can be absorbed because the solution is saturated with
ammonium bicarbonate (NH4HCO3). At a reactor pressure of 165 psig, the capture efficiency
increases with increasing temperature from 20° to 45°C but decreases at higher temperatures.
This effect of temperature on the rate of CO2 capture can be understood from kinetic and
equilibrium considerations as described below.
To understand the effect of temperature, we considered the equilibrium of the aqueous-
phase NH3-H2O-CO2 system. The well-known reaction mechanism between carbon dioxide and
aqueous ammonia is as follows
NH3 (aq) + CO2 H3NCO2* (1)
H3NCO2* + NH3 (aq) NH4+ + NH2CO2
- (2)
H3NCO2* + H2O NH4+ + HCO3
- (3)
HCO3- + NH3(aq) NH4
+ + CO3- (4)
Figure 3. CO2 capture efficiency of a 4 M ammonia solution at 165 psig at 20° to 55°C.
In dilute solutions, mostly bicarbonate (HCO3-) and carbonate (CO3
-) ions are formed; in
concentrated solutions, and the reaction product is mainly carbamate (H3NCO2*). As more CO2
is absorbed in the solution, CO2 loading (defined as CO2/NH3 ratio) increases. Note that CO2
0
10
20
30
40
50
60
70
80
90
100
0.2 0.3 0.4 0.5 0.6 0.7 0.8 0.9 1.0
CO2/NH3 Molar Ratio
CO
2
Cap
ture
Eff
icie
nc
y (
%)
4 M Ammonia Solution, 165 psi
50 Vol% CO2 inlet
Gas Flow Rate = 1.42 acfm
L/G = 532 gpm/kacfm, ~50 kg/kg
Run 7, 55 C
Run 3,20 C
Run 6, 45 C
Run 4, 30 C
0
10
20
30
40
50
60
70
80
90
100
0.2 0.3 0.4 0.5 0.6 0.7 0.8 0.9 1.0
CO2/NH3 Molar Ratio
CO
2
Cap
ture
Eff
icie
nc
y (
%)
4 M Ammonia Solution, 165 psi
50 Vol% CO2 inlet
Gas Flow Rate = 1.42 acfm
L/G = 532 gpm/kacfm, ~50 kg/kg
Run 7, 55 C
Run 3,20 C
Run 6, 45 C
Run 4, 30 C
Page 17
Final Report DE-FE0000896 16 February 2017
16
loadings of 1 and 0.5 correspond to NH4HCO3 and (NH4)2CO3 compounds, respectively.
Ammonium bicarbonate solids precipitate when the CO2 loading increases above a certain value,
depending on the ammonia molarity of the solution and temperature. The above-discussed tests
were conducted at CO2 loading values below the precipitation point.
Figure 4 illustrates the measured CO2 capture efficiency as a function of temperatures for
various CO2 loadings. The data indicates that the capture efficiency increases with temperatures
up to a 35°C as the reaction kinetics increase. At a higher temperature, the partial pressure of
CO2 in equilibrium with the solution also increases, providing a backpressure for absorption, and
the rate of CO2 capture decreases.
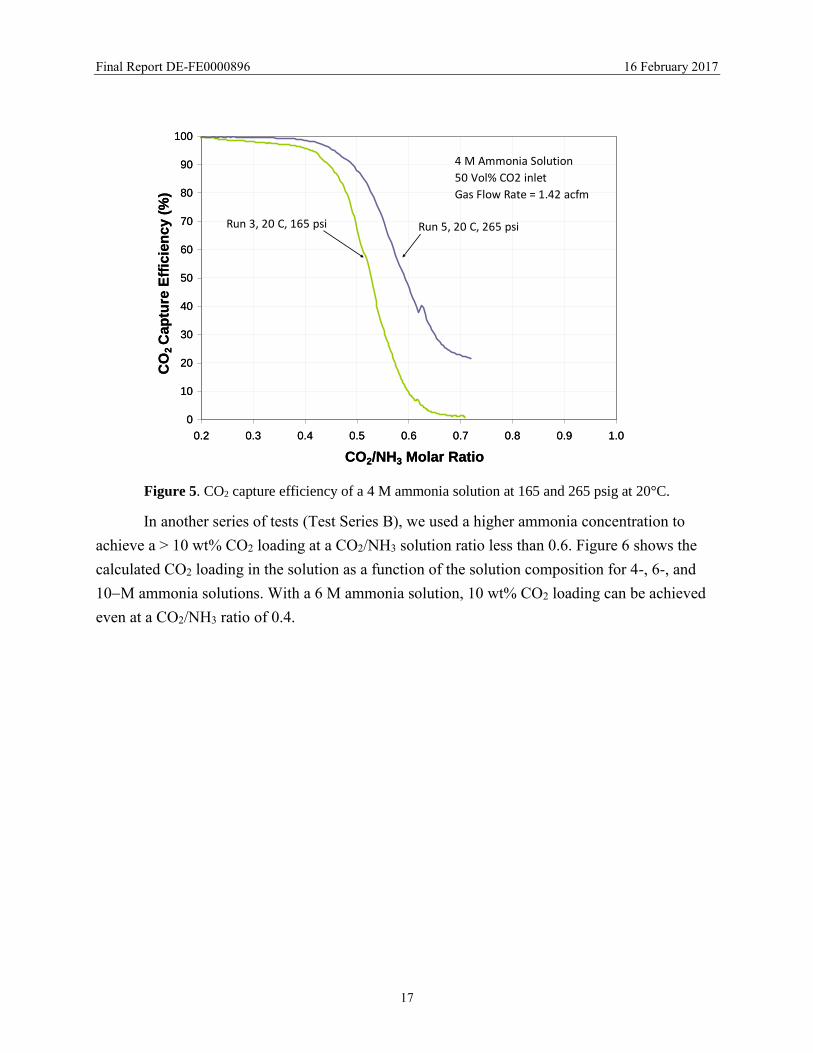
Figure 5 compares the effect of pressure on CO2 capture efficiency using the data from
Runs #3 and 5. This data indicates that the CO2 capture efficiency increases with increasing
absorber pressure from 165 psi to 265 psi, as expected for a gas-liquid reaction. We believe that
at a given temperature, the rate of CO2 capture will continue to increase with the pressure.
Figure 4. Variation of CO2 capture efficiency with temperature for 4 M ammonia solution at 165 psi at
varying CO2 loadings.
0
20
40
60
80
100
120
0 10 20 30 40 50 60
Temperature (C)
CO
2 C
aptu
re E
ffic
ien
cy (
%)
CO2/NH3 = 0.62
CO2/NH3 = 0.55
CO2/NH3 = 0.50
CO2/NH3 = 0.42
CO2 /NH3 = 0.45
Page 18
Final Report DE-FE0000896 16 February 2017
17
Figure 5. CO2 capture efficiency of a 4 M ammonia solution at 165 and 265 psig at 20°C.
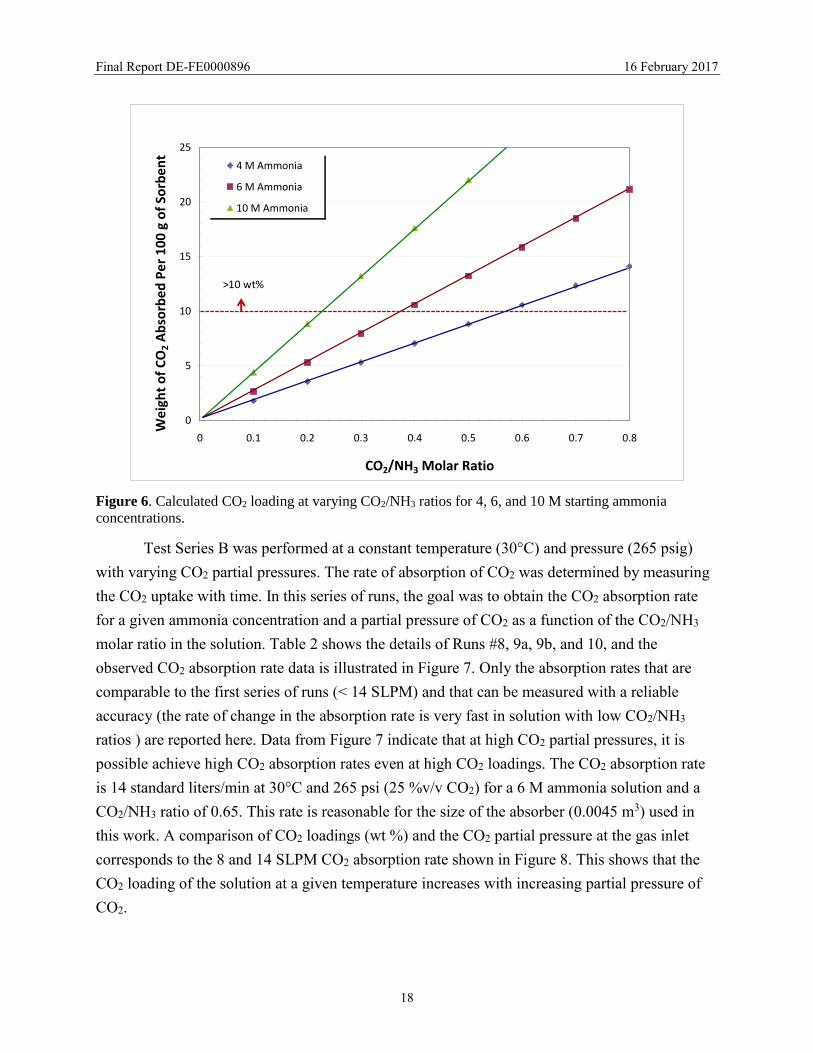
In another series of tests (Test Series B), we used a higher ammonia concentration to
achieve a > 10 wt% CO2 loading at a CO2/NH3 solution ratio less than 0.6. Figure 6 shows the
calculated CO2 loading in the solution as a function of the solution composition for 4-, 6-, and
10M ammonia solutions. With a 6 M ammonia solution, 10 wt% CO2 loading can be achieved
even at a CO2/NH3 ratio of 0.4.
0
10
20
30
40
50
60
70
80
90
100
0.2 0.3 0.4 0.5 0.6 0.7 0.8 0.9 1.0
CO2/NH3 Molar Ratio
CO
2 C
ap
ture
Eff
icie
ncy (
%)
4 M Ammonia Solution
50 Vol% CO2 inlet
Gas Flow Rate = 1.42 acfm
Run 3, 20 C, 165 psi Run 5, 20 C, 265 psi
0
10
20
30
40
50
60
70
80
90
100
0.2 0.3 0.4 0.5 0.6 0.7 0.8 0.9 1.0
CO2/NH3 Molar Ratio
CO
2 C
ap
ture
Eff
icie
ncy (
%)
4 M Ammonia Solution
50 Vol% CO2 inlet
Gas Flow Rate = 1.42 acfm
Run 3, 20 C, 165 psi Run 5, 20 C, 265 psi
Page 19
Final Report DE-FE0000896 16 February 2017
18
Figure 6. Calculated CO2 loading at varying CO2/NH3 ratios for 4, 6, and 10 M starting ammonia
concentrations.
Test Series B was performed at a constant temperature (30°C) and pressure (265 psig)
with varying CO2 partial pressures. The rate of absorption of CO2 was determined by measuring
the CO2 uptake with time. In this series of runs, the goal was to obtain the CO2 absorption rate
for a given ammonia concentration and a partial pressure of CO2 as a function of the CO2/NH3
molar ratio in the solution. Table 2 shows the details of Runs #8, 9a, 9b, and 10, and the
observed CO2 absorption rate data is illustrated in Figure 7. Only the absorption rates that are
comparable to the first series of runs (< 14 SLPM) and that can be measured with a reliable
accuracy (the rate of change in the absorption rate is very fast in solution with low CO2/NH3
ratios ) are reported here. Data from Figure 7 indicate that at high CO2 partial pressures, it is
possible achieve high CO2 absorption rates even at high CO2 loadings. The CO2 absorption rate
is 14 standard liters/min at 30°C and 265 psi (25 %v/v CO2) for a 6 M ammonia solution and a
CO2/NH3 ratio of 0.65. This rate is reasonable for the size of the absorber (0.0045 m3) used in
this work. A comparison of CO2 loadings (wt %) and the CO2 partial pressure at the gas inlet
corresponds to the 8 and 14 SLPM CO2 absorption rate shown in Figure 8. This shows that the
CO2 loading of the solution at a given temperature increases with increasing partial pressure of
CO2.
0
5
10
15
20
25
0 0.1 0.2 0.3 0.4 0.5 0.6 0.7 0.8
CO2/NH3 Molar Ratio
We
igh
t o
f C
O2 A
bso
rbe
d P
er
10
0 g
of
Sorb
en
t4 M Ammonia
6 M Ammonia
10 M Ammonia
>10 wt%
0
5
10
15
20
25
0 0.1 0.2 0.3 0.4 0.5 0.6 0.7 0.8
CO2/NH3 Molar Ratio
We
igh
t o
f C
O2 A
bso
rbe
d P
er
10
0 g
of
Sorb
en
t4 M Ammonia
6 M Ammonia
10 M Ammonia
>10 wt%
Page 20
Final Report DE-FE0000896 16 February 2017
19
Table 2. Details of the absorber test conditions at 30°C.
Run Number NH3 Concenetration Starting CO2 Loading Total Pressure
(M) (CO2/NH3 molar ratio) (vol. %) ( psi) (psia)
Run 8 6 0.12 6 15.9 265
Run 9a 6 0.17 9 23.8 265
Run 9b 6 0.17 9 23.8 265
Run 9c 6 0.17 9 23.9 265
Run 10 6 0.17 25 66.2 265
CO2 Partial Pressure
Page 21
Final Report DE-FE0000896 16 February 2017
20
Figure 7. Observed CO2 capture as a function of the CO2/NH3 ratio and the CO2 partial pressure at 30°C
and 265 psia.
Figure 8. Observed CO2 loading for a 6 M ammonia solution as a function of CO2 partial pressure at 30 C
and 265 psig.
0
2
4
6
8
10
12
14
16
0.1 0.2 0.3 0.4 0.5 0.6 0.7 0.8
CO
2A
bs
orp
tio
n R
ate
(S
LP
M)
CO2/NH3 Molar Ratio
6 vol.% CO2 9 vol.% CO2 25 vol. % CO2
Run 8
Run 9a
Run 9b
Run 10
Run 9c
0
2
4
6
8
10
12
14
16
0 25 50 75 100
CO2 Partial Pressure (psi)
CO
2 C
ap
ture
(w
t.%
)
6 M ammonia
265 psi, 30 C
CO2 Abs. Rate = 14 SLPM
CO2 Abs. Rate = 8 SLPM
0
2
4
6
8
10
12
14
16
0 25 50 75 100
CO2 Partial Pressure (psi)
CO
2 C
ap
ture
(w
t.%
)
6 M ammonia
265 psi, 30 C
CO2 Abs. Rate = 14 SLPM
CO2 Abs. Rate = 8 SLPM
Page 22
Final Report DE-FE0000896 16 February 2017
21
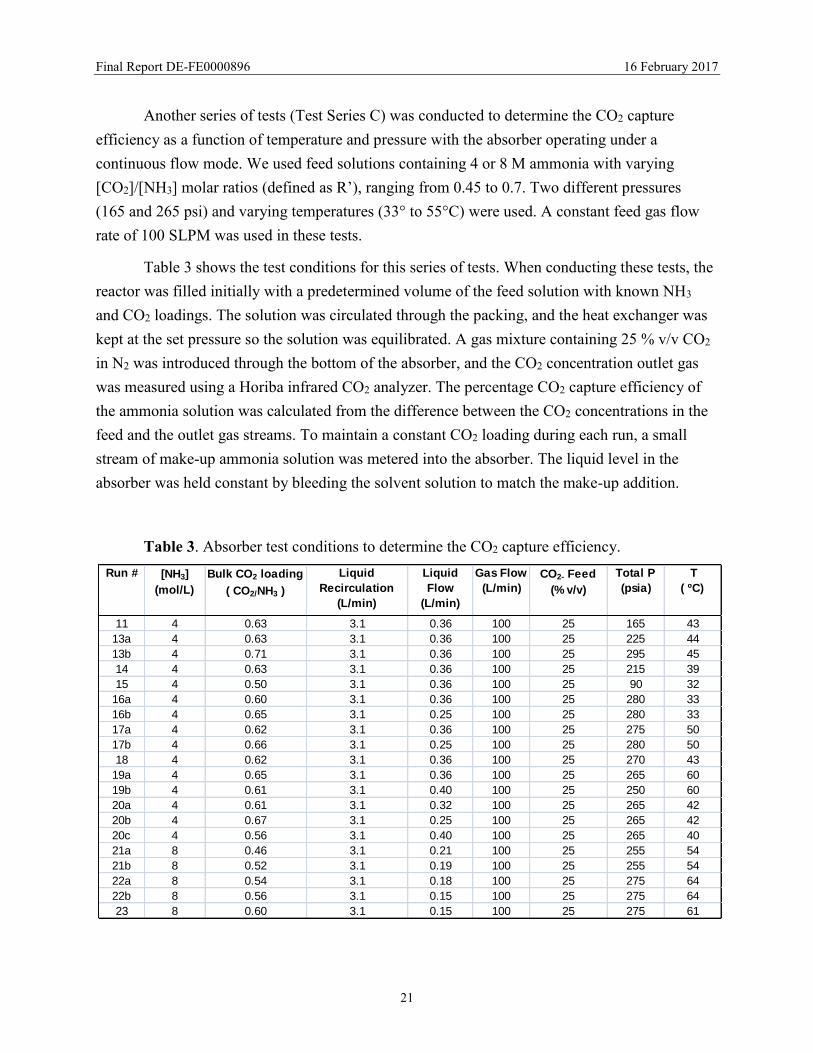
Another series of tests (Test Series C) was conducted to determine the CO2 capture
efficiency as a function of temperature and pressure with the absorber operating under a
continuous flow mode. We used feed solutions containing 4 or 8 M ammonia with varying
[CO2]/[NH3] molar ratios (defined as R’), ranging from 0.45 to 0.7. Two different pressures
(165 and 265 psi) and varying temperatures (33° to 55°C) were used. A constant feed gas flow
rate of 100 SLPM was used in these tests.
Table 3 shows the test conditions for this series of tests. When conducting these tests, the
reactor was filled initially with a predetermined volume of the feed solution with known NH3
and CO2 loadings. The solution was circulated through the packing, and the heat exchanger was
kept at the set pressure so the solution was equilibrated. A gas mixture containing 25 % v/v CO2
in N2 was introduced through the bottom of the absorber, and the CO2 concentration outlet gas
was measured using a Horiba infrared CO2 analyzer. The percentage CO2 capture efficiency of
the ammonia solution was calculated from the difference between the CO2 concentrations in the
feed and the outlet gas streams. To maintain a constant CO2 loading during each run, a small
stream of make-up ammonia solution was metered into the absorber. The liquid level in the
absorber was held constant by bleeding the solvent solution to match the make-up addition.
Table 3. Absorber test conditions to determine the CO2 capture efficiency.
Run # [NH3]
(mol/L)
Bulk CO2 loading
( CO2/NH3 )
Liquid
Recirculation
(L/min)
Liquid
Flow
(L/min)
Gas Flow
(L/min)
CO2- Feed
(% v/v)
Total P
(psia)
T
( ºC)
11 4 0.63 3.1 0.36 100 25 165 43
13a 4 0.63 3.1 0.36 100 25 225 44
13b 4 0.71 3.1 0.36 100 25 295 45
14 4 0.63 3.1 0.36 100 25 215 39
15 4 0.50 3.1 0.36 100 25 90 32
16a 4 0.60 3.1 0.36 100 25 280 33
16b 4 0.65 3.1 0.25 100 25 280 33
17a 4 0.62 3.1 0.36 100 25 275 50
17b 4 0.66 3.1 0.25 100 25 280 50
18 4 0.62 3.1 0.36 100 25 270 43
19a 4 0.65 3.1 0.36 100 25 265 60
19b 4 0.61 3.1 0.40 100 25 250 60
20a 4 0.61 3.1 0.32 100 25 265 42
20b 4 0.67 3.1 0.25 100 25 265 42
20c 4 0.56 3.1 0.40 100 25 265 40
21a 8 0.46 3.1 0.21 100 25 255 54
21b 8 0.52 3.1 0.19 100 25 255 54
22a 8 0.54 3.1 0.18 100 25 275 64
22b 8 0.56 3.1 0.15 100 25 275 64
23 8 0.60 3.1 0.15 100 25 275 61
Page 23
Final Report DE-FE0000896 16 February 2017
22
Figure 9 compares the effect of CO2 loading in the solution (R’) on the CO2 capture
efficiency; the data (Runs #16, 17, 18, 19, and 20) was normalized to a CO2 partial pressure of
450 kPa (66.25 psi). The data shows that the capture efficiency (moles of CO2 absorbed/moles of
NH3 in feed) is ~ 100% at R’ values less than 0.4, indicating that the absorption of CO2 into the
solution is rapid. As more CO2 is absorbed into the solution, the CO2 capture rate decreases due
to increased CO2 loading in the solution. The capture efficiency decreases at high temperatures
due to the increasing equilibrium partial pressure of CO2 with increasing temperatures.
The corresponding CO2 absorption rates (mole/min) are shown in Figure 10. This data
shows that even at high CO2 loadings (R’=0.6) and a temperature of 50°C, CO2 can be captured
at 70% efficiency (CO2 capture rate = 7 x 10⁻¹ mole/min rate) in a 0.0045 m3 absorber. We
limited our test to R’ < 0.6 because operating an absorber with less than 70% CO2 capture
efficiency is not desirable. The data shows that the temperature dependency on the CO2 capture
efficiency is not high at efficiencies approaching100% (1 mole/min CO2 capture rate). Even at
higher CO2 loadings, there is only a minimal temperature effect on the CO2 capture rate at
265 psi.
Figure 9. CO2 capture efficiency of 4 and 8 M ammonia solutions at 265 psia at 30° to 60°C.
0
10
20
30
40
50
60
70
80
90
100
0.40 0.45 0.50 0.55 0.60 0.65 0.70 0.75 0.80
Ca
ptu
re E
ffic
ien
cy
(%
)
R' (Molar Ratio, CO2/NH3)
Run 17 (4 M, 50 C)
Run 16 (4 M, 33 C)
Run 18 (4 M, 45 C)
Run 19 (4 M, 60 C)
Run 20 (4 M, 43 C)
Run 21 (8 M, 55 C)
Inlet CO2 Partial Pressure 450 kPa
8 M, 55 C
4 M, 60 C
4 M, 43 C
Reactor Volume = 0.0045 m3
Reactor Pressue = 265 psia
Page 24
Final Report DE-FE0000896 16 February 2017
23
Figure 10. CO2 capture rates of 4 and 8 M ammonia solutions at 265 psia at 43° to 60°C.
Figure 11 illustrates the temperature dependence at R’ values at two higher CO2 loading
values (R’ = 0.55 and 0.6). Our preliminary data on temperature effect on CO2 capture indicated
that at a reactor pressure of 265 psi, the capture efficiency increased with increasing temperature
from 20° to 45°C due to increased reaction kinetics, but may decrease at higher temperatures due
to thermodynamic limitations (see Figure 4). In this series, we investigated the absorption
temperature up to 60°C to study the temperature effect under steady-state conditions. The new
data suggests the absorber can be operated up to 60°C with only a slight decrease in the capture
rate.
600
700
800
900
1000
1100
1200
0.40 0.45 0.50 0.55 0.60 0.65 0.70 0.75 0.80
CO
2A
bs
orp
tio
n R
ate
x1
03
(mo
le/m
in)
R' (Molar Ratio, CO2/NH3)
Run 17 (4 M, 50 C)
Run 18 (4 M, 45 C)
Run 19 (4 M, 60 C)
Run 20 (4 M, 43 C)
Run 21 (8 M, 55 C)
Inlet CO2 Partial Pressure 450 kPaReactor PRessure = 265 psia
8 M, 55 C
4 M, 60 C
4 M, 43 C
Reactor Volume = 0.0045 m3
4 M, 50 C
Page 25
Final Report DE-FE0000896 16 February 2017
24
Figure 11. CO2 capture rate of 4 and 8 M ammonia solutions at 265 psia at 33° to 60°C.
Residual NH3 and CO2 Levels in the Absorption Step: As the absorption temperature
increased at a given absorber total pressure, both the equilibrium partial pressures of NH3 and
CO2 increased. The increased partial pressure of NH3 led to the loss of NH3 from the solution.
The residual NH3 vapor in the absorber exit gas can be scrubbed, recovered, and reabsorbed in
the absorber feed solution. However, process conditions that minimize NH3 loss from the
absorber are preferred. The residual ammonia partial pressure is function of temperature, the
solution ammonia concentration, and CO2 loading. Table 4 shows the measured absorber residual
ammonia levels in the gas. The measured ammonia partial pressures were less than 500 ppmv at
60°C and 265 psia.
Table 4. Residual NH3 partial pressures at varying temperature and CO2 loadings.
0
300
600
900
1200
1500
20 30 40 50 60 70
CO
2A
bs
orp
tio
n R
ate
x1
03
(mo
le/m
in)
Temperature (oC)
Run 17 (50 C)
Run 16 (33 C)
Run 13 (45 C)
Run 11 (45 C)
Run 18 (45 C)
Run 19 (60 C)
Run 20 (43 C)
R'~0.55
R'~0.60
Absorber Pressure = 1800 kPa (265 psia)4 M Ammonia, CO2 inlet = 25% v/v
Run # T
( ºC)
Bulk CO2 loading
( CO2/NH3 )
Total P
(psia)
NH3
Partial
Pressure
(ppmv)
14 39 0.63 215 150
16a 33 0.60 280 280
18 43 0.62 270 250
19a 60 0.65 265 300
19b 60 0.61 250 200
20a 42 0.61 265 225
20b 42 0.67 265 100
20c 40 0.56 265 325
Page 26
Final Report DE-FE0000896 16 February 2017
25
At a higher temperature, the partial pressure of CO2 in equilibrium with the solution also
increases, providing a backpressure for absorption and the rate of CO2 capture decreases. The
partial pressure of CO2 (back pressure) is a function of temperature, solution molarity, and CO2
loading (R’ value). Figure 12 shows the correlation between calculated CO2 back pressure and
measured CO2 absorption rates at different R’ values in the range 0.46 to 0.67 at 265 psia and
temperatures in the range 40° to 60°C. As expected, as the solution is loaded with CO2, the
partial pressure of CO2 in equilibrium with the solution increases and the rate of absorption
decreases.
Figure 12. The relationship between calculated CO2 back pressure and the measured CO2 capture rate.
Absorption of H2S in Ammonia Solutions with Varying CO2 Loadings: The IGCC gas stream
downstream of the water-gas shift reaction contains mainly H2, CO2, and small quantities of H2S.
H2S will react with the ammoniated solution, forming sulfide or bisulfides.
A series of tests (Test Series D) was performed to determine the efficiency of the test
solutions to capture H2S at varying CO2 loadings. In these tests, we used solutions containing 2.3
and 7.6 M ammonia with a CO2/NH3 molar ratio (R’ value) ranging from 0.25 to 0.5. The feed
gas is a mixture of N2 containing 1 to 2 % v/v H2S flowing at a rate varying from 20 to
50 SLPM. We used N2 instead of H2 as the major gas because the solubility of H2 in the
ammonium carbonate solution is extremely low, and the gas substitution will not influence the
results. Three different pressures (135, 205, and 215 psia) and two temperatures (20° and 50°C)
were used. In these tests, no make-up liquid was introduced so that the capture efficiency at
different H2S loading in the solution could be determined.
0
250
500
750
1000
1250
1500
1750
2000
0 5 10 15 20 25 30 35 40 45 50
CO
2A
bs
orp
tio
n R
ate
x1
03
(mo
le/m
in)
CO2 Partial Pressure- Absorber Top (psi)
Run 17 (4 M, 50 C)
Run 16 (4 M, 33 C)
Run 13 (4 M, 45 C)
Run 12 (4 M, 45 C)
Run 11 (4 M, 45 C)
Run 18 (4 M, 45 C)
Run 19 (4 M, 60 C)
Run 20 (4 M, 43 C)
Run 21 (8 M, 55 C)
Inlet CO2 Partial Pressure= 450 kPa Absorber Pressure = 1800 kPa (265 psia)
Page 27
Final Report DE-FE0000896 16 February 2017
26
Table 5 shows the test conditions for test series D. When conducting these tests, the
reactor was filled initially with a predetermined volume (4 to 6 liter) of 2.3 or 7.6 M ammonia
solution with known CO2 loading. After the temperature and pressure in the column were
stabilized, a gas mixture containing 1-2 % v/v H2S in N2 was introduced through the bottom of
the absorber. No make-up ammonia solution was added during these tests to allow the H2S
loading in the solution to change with time. The H2S capture efficiency of the solution for
capturing H2S from the test gas stream was evaluated by measuring the inlet and outlet H2S
concentration using an online gas chromatograph.
Table 5. Absorber test conditions to determine the H2S capture efficiency.
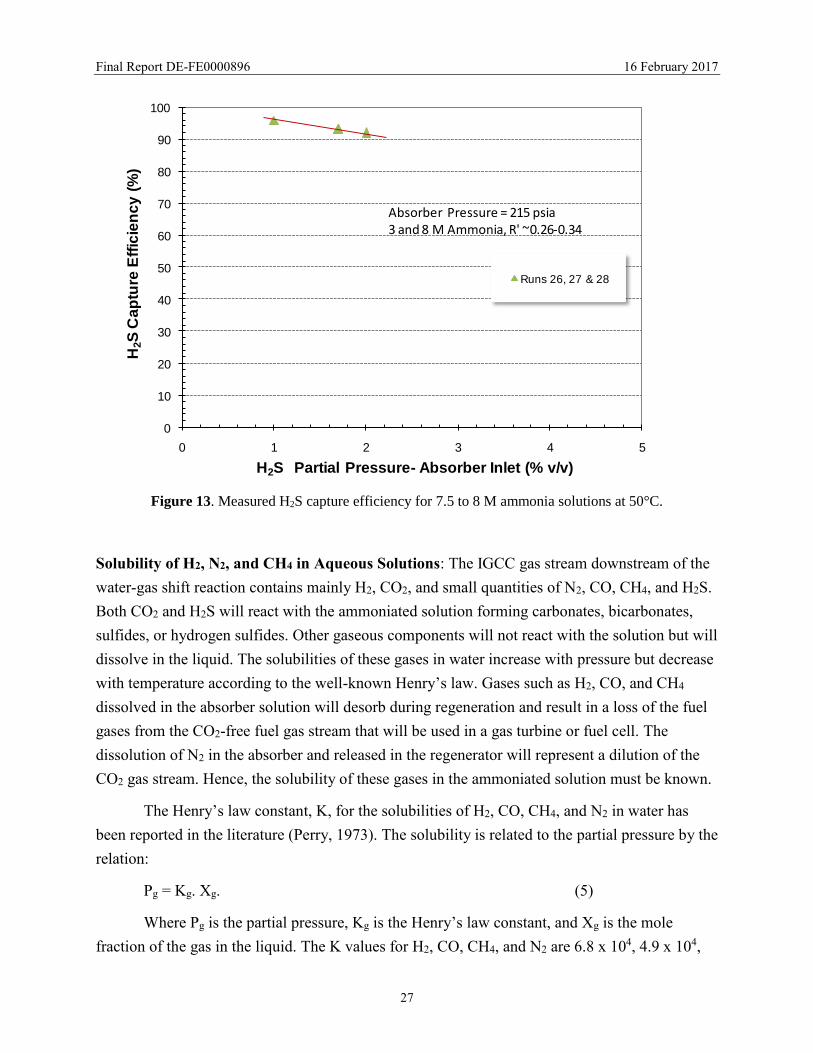
The measured H2S capture efficiency is shown in Figure 13 for 8 M ammonia solutions
with R’ values in the range 0.26 to 0.34. In these tests, the feed gas was 1% (v/v) H2S in N2 and
the absorber pressure was ~ 210 psia. Under these conditions, the H2S capture efficiency
exceeded 90%.
Run # [NH3]
(mol/L)
Bulk CO2 loading
(CO2/NH3 )
Liquid
Recirculation
(L/min)
Gas Flow
(L/min)
H2S- Feed
(% v/v)
Total P
(psia)
T
( ºC)
25 2.3 0.48 3.1 50 2 135 25
26 7.7 0.27 3.1 20 1 215 50
27 7.5 0.34 3.1 20 1.7 215 50
28 7.6 0.26 3.1 20 1.7 250 50
Page 28
Final Report DE-FE0000896 16 February 2017
27
Figure 13. Measured H2S capture efficiency for 7.5 to 8 M ammonia solutions at 50°C.
Solubility of H2, N2, and CH4 in Aqueous Solutions: The IGCC gas stream downstream of the
water-gas shift reaction contains mainly H2, CO2, and small quantities of N2, CO, CH4, and H2S.
Both CO2 and H2S will react with the ammoniated solution forming carbonates, bicarbonates,
sulfides, or hydrogen sulfides. Other gaseous components will not react with the solution but will
dissolve in the liquid. The solubilities of these gases in water increase with pressure but decrease
with temperature according to the well-known Henry’s law. Gases such as H2, CO, and CH4
dissolved in the absorber solution will desorb during regeneration and result in a loss of the fuel
gases from the CO2-free fuel gas stream that will be used in a gas turbine or fuel cell. The
dissolution of N2 in the absorber and released in the regenerator will represent a dilution of the
CO2 gas stream. Hence, the solubility of these gases in the ammoniated solution must be known.
The Henry’s law constant, K, for the solubilities of H2, CO, CH4, and N2 in water has
been reported in the literature (Perry, 1973). The solubility is related to the partial pressure by the
relation:
Pg = Kg. Xg. (5)
Where Pg is the partial pressure, Kg is the Henry’s law constant, and Xg is the mole
fraction of the gas in the liquid. The K values for H2, CO, CH4, and N2 are 6.8 x 10⁴, 4.9 x 10⁴,
0
10
20
30
40
50
60
70
80
90
100
0 1 2 3 4 5
H2S
Ca
ptu
re E
ffic
ien
cy
(%
)
H2S Partial Pressure- Absorber Inlet (% v/v)
Runs 26, 27 & 28
Runs 26, 27 & 28
Absorber Pressure = 215 psia3 and 8 M Ammonia, R' ~0.26-0.34
Page 29
Final Report DE-FE0000896 16 February 2017
28
3.8 x 10⁴, and 8 x 10⁴, respectively. The constant is a weak function of pressure in the range of
interest.
The solubility of these gases in aqueous solution decreases when salts are dissolved in
water. This salting effect is known for several electrolytes and is described as the activity
coefficient, g, modifying equation 5 as follows:
Pg = Kg. g .Xg. (6)
The activity coefficient increases with the salt content of the solution. For a solution of
10 M KOH (40 wt%) aqueous solution at 25C, the coefficient is 20 (Shoor, 1966). The
solubility of H2, CO, and CH4 in a 2.5 M K2CO3 aqueous solution is decreased by a factor of 5
(Field, 1960). Table 6 lists the calculated solubility of these gases in water at 1 and 40 atm and in
a concentrated solution at 40 atm assuming that the activity coefficient is 5. These results
indicate that in the concentrated aqueous solution of ammonium carbonate-bicarbonate, the
solubility of the H2, CO, CH4, and N2 will be negligibly small. The solution will contain less than
0.002 wt% of these gases if they were present as pure gases at a pressure of 40 atm. H2 is the
major component of the IGCC gas stream at less than 50% v/v; the loss of H2 will be negligibly
small, and the loss of other gases will be even smaller.
Table 6. Solubility of gases in aqueous solutions at 20°C.
Bench-scale Absorber Tests: Mixed Gas Experiments: In addition to operating the absorber
for preparing CO2 and H2S-rich solutions for regenerator operation, additional tests (Test Series
E and F) were also conducted to complete the analysis of data from data generated in Test Series
C and D. Table 7 provides the data for H2S loading at ~ 50°C and pressures near 215 to 250 psia
for ~ 8 M ammonia solutions with varying CO2 loadings (Test Series E). The CO2 and H2S
capture efficiencies observed in this study clearly show that both CO2 and H2S can be captured at
efficiencies higher than 90% even at high loadings of CO2 (see Figure 14). The data shown in
Figure 14 are for individual H2S and CO2 absorption.
Gas K X (1atm) X (40 atm)
H2 6.80E+04 1.47E-05 5.88E-04 0.013 50.0 0.0065
CO 4.90E+04 2.04E-05 8.16E-04 0.018 2.0 0.0004
CH4 3.80E+04 2.63E-05 1.05E-03 0.023 2.0 0.0005
N2 8.00E+04 1.25E-05 5.00E-04 0.011 1.0 0.0001
Mole Fraction in Waterg Gas/kg Solution at
40 atm pressure
Gas Component
Concentration
(%v/v)
g Gas/kg Solution at
40 atm toal pressure
Page 30
Final Report DE-FE0000896 16 February 2017
29
Table 7. Absorber test conditions to determine the H2S capture efficiency in gas mixtures.
Figure 14. CO2 and H2S capture efficiencies of ammonia solutions at varying CO2 loadings.
Mixed gas experiments were also conducted to determine the H2S capture rates
(Test Series F). The 8 M ammoniated solutions were tested at three different CO2/NH3 molar
ratios (R’ values) varying from 0.33 to 0.45 and at two different liquid circulation rates and gas
flow rates. These tests were conducted under ambient conditions to determine the effect of gas
flow rate and liquid recirculation rate on the H2S capture efficiency and the sulfide loading in the
absorber solution. The absorber was operated under continuous flow mode. In this testing,
0
10
20
30
40
50
60
70
80
90
100
5 10 15 20 25
Ca
ptu
re E
ffic
ien
cy
(%
)
CO2 Loading (wt. %)
8 M Ammonia: CO2 at 50 to 60 C
8 M Ammonia: H2S at 53 CReactor Volume =0.0045 m3
Reactor Pressure = 265 psia
Run No. [NH3]
Bulk CO2
Loading
H2S
Loading
Liquid
Recirculation
Gas
Flow H2S Feed
Total
Pressure T
(mol/l) (CO2/NH3) mol/l (l/min) (l/min) (vol%) (psia) (oC)
26 7.7 0.27 NM 3.1 20 1 215 50
27 7.5 0.34 NM 3.1 20 1.7 215 50
28 7.6 0.26 NM 3.1 20 1.7 250 50
29 8.5 0.4 0.51 3.1 95 0.8 210 53
29 8.4 0.32 0.42 3.1 95 0.8 210 53
30 8.2 0.37 0.49 3.1 95 1 215 52
30 8.2 0.4 0.49 3.1 95 1 215 52
NM: Not Measured
Page 31
Final Report DE-FE0000896 16 February 2017
30
1% v/v H2S in N2 or 1% v/v H2S, or 20% CO2 in N2 were used to test the efficiency of H2S
capture. In each run, both the remaining H2S in the gas stream exiting the absorber and the H2S
loading in the recirculating liquid were measured. Table 8 shows the test conditions and the
measured data for H2S exiting the absorber and the measured H2S concentration in the
recirculating liquid at the end of each run.
Table 8. Bench-scale absorber data for H2S absorption under varying conditions.
In the tests shown above, we observed the rate of H2S capture increased with decreasing
R’ (CO2/NH3 ratio) in the solution as expected. Even at an R’ value of 0.33, a greater than 98%
H2S absorption efficiency can be achieved at a gas flow rate of 9 SLPM with a 3 liter/min liquid
recirculation rate at 25°C. Figures 15, 16, and 17 illustrate the effects of gas flow rate, R’, liquid
circulation rate, and the ratio of the liquid circulation rate to the gas flow rate (L/G ratio) on the
H2S concentration in the exit gas. The data in Figure 15 clearly shows that the effect of R’ is
significant at lower gas flow rates. In general, with increasing gas flow rate, the gas residence
time will decrease, thereby reducing the amount of H2S absorbed. However, at higher gas flow
NH3 Concentration, M 8 8 8 8 8 8
CO2/NH3, R' 0.33 0.33 0.33 0.33 0.33 0.33
L/G, gpm/Kacfm 7574 4545 2525 5050 3030 1683
Liquid Recycle, LPM 3 3 3 2 2 2
Gas Flow Rate, SLPM 3 5 9 3 5 9
Inlet H2S Cocentration (v/v%) 1 1 1 1 1 1
Outlet H2S Concentration (gas stream), ppmv 200 300 200 300 500 200
H2S Concentration (liquid), ppm 54 214 286 243 286
NH3 Concentration, M 8 8 8 8 8 8
NH3/CO2, R 0.25 0.25 0.25 0.25 0.25 0.25
L/G, gpm/Kacfm 7574 4545 2525 5050 3030 1683
Liquid Recycle, LPM 3 3 3 2 2 2
Gas Flow Rate, SLPM 3 5 9 3 5 9
Inlet H2S Cocentration (v/v%) 1 1 1 1 1 1
Outlet H2S Concentration (gas stream), ppmv 250 500 120 500 800 150
H2S Concentration (liquid), ppm 83 25 273 417 359 490
NH3 Concentration, M 8 8 8 8 8 8 8 8 8 8
NH3/CO2, R 0.2 0.2 0.2 0.2 0.2 0.2 0.2 0.2 0.2 0.2
L/G, gpm/Kacfm 7574 4545 3246 2525 1515 5050 3030 2164 1683 1010
Liquid Recycle, LPM 3 3 3 3 3 2 2 2 2 2
Gas Flow Rate, SLPM 3 5 7 9 15 3 5 7 9 15
Inlet H2S Cocentration (v/v%) 1 1 1 1 1 1 1 1 1 1
Outlet H2S Concentration (gas stream), ppmv 100 150 90 40 34 100 100 100 200 200
H2S Concentration (liquid), ppm 185 243 408 432 437 345 417 319 446 348
Page 32
Final Report DE-FE0000896 16 February 2017
31
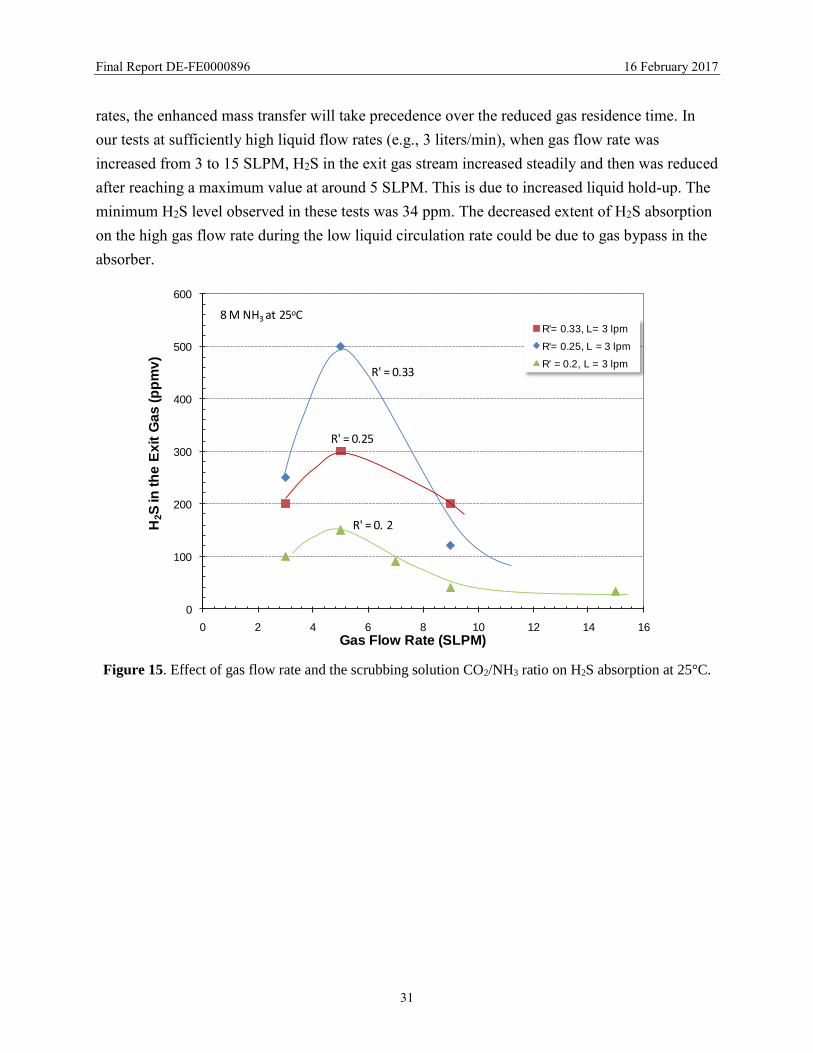
rates, the enhanced mass transfer will take precedence over the reduced gas residence time. In
our tests at sufficiently high liquid flow rates (e.g., 3 liters/min), when gas flow rate was
increased from 3 to 15 SLPM, H2S in the exit gas stream increased steadily and then was reduced
after reaching a maximum value at around 5 SLPM. This is due to increased liquid hold-up. The
minimum H2S level observed in these tests was 34 ppm. The decreased extent of H2S absorption
on the high gas flow rate during the low liquid circulation rate could be due to gas bypass in the
absorber.
Figure 15. Effect of gas flow rate and the scrubbing solution CO2/NH3 ratio on H2S absorption at 25°C.
0
100
200
300
400
500
600
0 2 4 6 8 10 12 14 16
H2S
in t
he
Ex
it G
as
(p
pm
v)
Gas Flow Rate (SLPM)
R'= 0.33, L= 3 lpm
R'= 0.25, L = 3 lpm
R' = 0.2, L = 3 lpm
8 M NH3 at 25oC
R' = 0.33
R' = 0.25
R' = 0. 2
Page 33
Final Report DE-FE0000896 16 February 2017
32
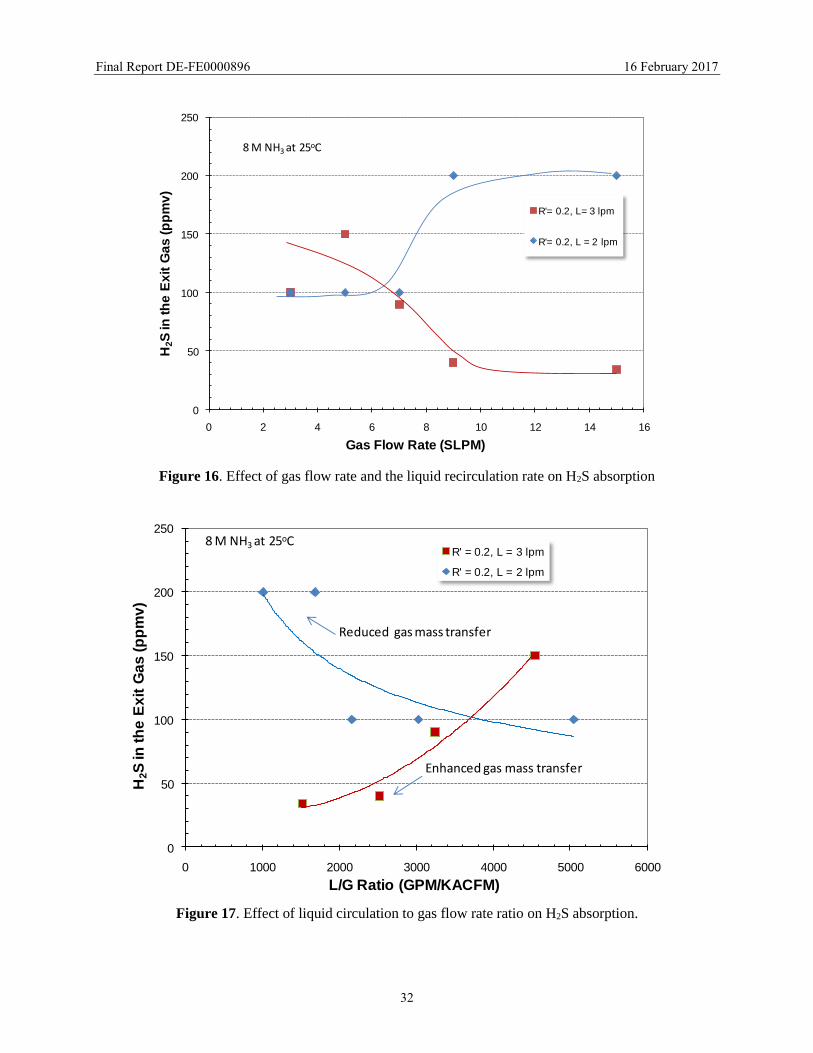
Figure 16. Effect of gas flow rate and the liquid recirculation rate on H2S absorption
Figure 17. Effect of liquid circulation to gas flow rate ratio on H2S absorption.
0
50
100
150
200
250
0 2 4 6 8 10 12 14 16
H2S
in t
he
Ex
it G
as
(p
pm
v)
Gas Flow Rate (SLPM)
R'= 0.2, L= 3 lpm
R'= 0.2, L = 2 lpm
8 M NH3 at 25oC
0
50
100
150
200
250
0 1000 2000 3000 4000 5000 6000
H2S
in t
he
Ex
it G
as
(p
pm
v)
L/G Ratio (GPM/KACFM)
R' = 0.2, L = 3 lpm
R' = 0.2, L = 2 lpm
8 M NH3 at 25oC
Reduced gas mass transfer
Enhanced gas mass transfer
Page 34
Final Report DE-FE0000896 16 February 2017
33
Bench-scale Regenerator Testing
Figure 18 is the schematic diagram of the bench-scale regenerator system. In the
regenerator, the CO2 and H2S-rich solutions are heated to liberate CO2 and H2S, leaving behind a
CO2 and H2S-lean solution that is suitable for subsequent use in the absorber. The main
component of the regenerator system is the high-pressure reactor (with an ID of 4 in and a length
of 48 in) that is constructed of stainless steel and capable of operating up to 600 psi and 200°C.
The feed ammonium carbonate solution with high CO2 and H2S loading was injected at the top
of the column using a high-pressure metering pump. The feed solution reservoir was maintained
at ~ 40C to avoid precipitation of ammonium bicarbonate from the highly CO2-loaded solution.
The solution was further heated to a temperature of 60C using a heat exchanger before it
entered the regenerator column. The solution flowed down the reactor and was heated to the
regeneration temperature by an immersion heater (reboiler) located at the bottom of the reactor
releasing CO2 and H2S. A stainless steel structural packing was placed above the reboiler to
facilitate the contact between up-flowing vapor and down-flowing liquid. This arrangement
minimizes the escape of NH3 and H2O vapors from the reactor as they equilibrate rapidly with
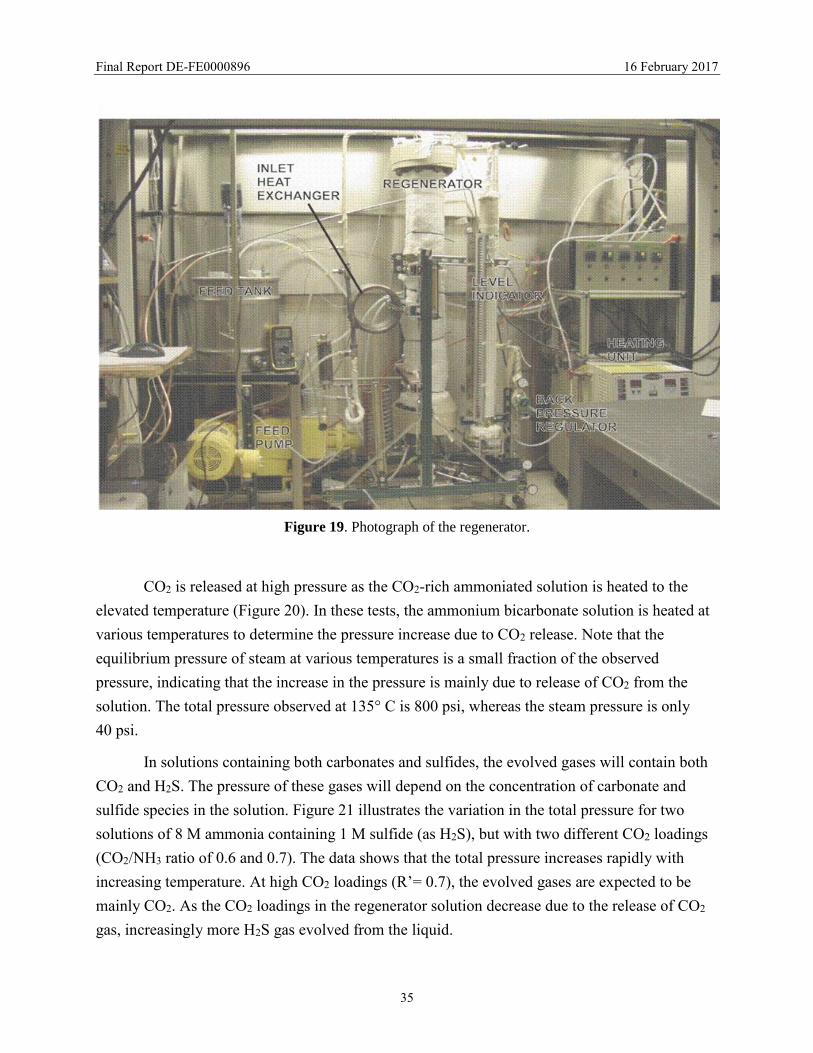
the incoming solution. Figure 19 is a photograph of the regenerator.
In a typical test, the regenerator reboiler section of the column is filled with sufficient
starting solution to cover the heating coil. Once the desired temperature and pressure are
achieved, feed solution (rich solution) is continuously added at the top of the column, while the
lean solution is removed at the same rate from the bottom of the column to maintain a constant
liquid level in the system. The process variables such as pressure, temperature, and flow rates of
liquid and gas streams are monitored and recorded. The regenerated lean solution is collected
and analyzed to determine the rate of regeneration and the residual CO2 and H2S levels in the
regenerated liquid. The gas mixture exits from the top of the column through a series of pressure
control valves that maintain the regenerator column pressure to a set value. The evolved gas
consisting of CO2, NH3, H2O, and H2S is scrubbed to remove H2S and NH3 and vented. A slip
stream of the gas is analyzed for its composition by gas chromatography.
The temperature and pressure conditions were varied to determine the extent of
regeneration as a function of these variables. In the first series of regenerator testing
(Test Series G), temperature was varied between 110 to 175°C, and the pressure was varied from
150 to 300 psig.
Page 35
Final Report DE-FE0000896 16 February 2017
34
Figure 18. Schematic diagram of the bench-scale regenerator unit.
22"
4"
12"
6"
46" height
3.75" diameter
6"
T
TRupture disc
P
F
L
GC
Horiba
Cooled Lean
Solution
Rich
Solution
Pre-Heating
P
60C
0.3lit/m
85C
8mole/lit
R’=0.62
150C
3KW
<60C150C
18lit/min CO2
3% H2O
1% NH3
7.9mole/lit
R’=0.3
205C
1.5lit/min
175C
205C
5KW
3/8"OD, L=10ft
Page 36
Final Report DE-FE0000896 16 February 2017
35
Figure 19. Photograph of the regenerator.
CO2 is released at high pressure as the CO2-rich ammoniated solution is heated to the
elevated temperature (Figure 20). In these tests, the ammonium bicarbonate solution is heated at
various temperatures to determine the pressure increase due to CO2 release. Note that the
equilibrium pressure of steam at various temperatures is a small fraction of the observed
pressure, indicating that the increase in the pressure is mainly due to release of CO2 from the
solution. The total pressure observed at 135° C is 800 psi, whereas the steam pressure is only
40 psi.
In solutions containing both carbonates and sulfides, the evolved gases will contain both
CO2 and H2S. The pressure of these gases will depend on the concentration of carbonate and
sulfide species in the solution. Figure 21 illustrates the variation in the total pressure for two
solutions of 8 M ammonia containing 1 M sulfide (as H2S), but with two different CO2 loadings
(CO2/NH3 ratio of 0.6 and 0.7). The data shows that the total pressure increases rapidly with
increasing temperature. At high CO2 loadings (R’= 0.7), the evolved gases are expected to be
mainly CO2. As the CO2 loadings in the regenerator solution decrease due to the release of CO2
gas, increasingly more H2S gas evolved from the liquid.
Page 37
Final Report DE-FE0000896 16 February 2017
36
Figure 20. Evolution of CO2 from the ammonium bicarbonate solution as a function of temperature.
Figure 21. Measured P-T curves for H2S-H2O-CO2-NH3 from static experiments.
0
100
200
300
400
500
600
700
800
900
0 50 100 150 200 250
To
tal P
res
su
re (
ps
i)
Temperature (oC)
Run 1
Run 2
Run 3
Run 4
Run 5
Satuared Vapor Pressureof Water
AC-ABC
0
60
120
180
240
300
360
420
480
540
600
50 65 80 95 110 125 140 155 170 185 200
To
tal P
res
su
re (p
sia
)
Temperature (oC)
R' = 0.71
R' = 0.62
8 M Ammonia, 1 M H2S
Page 38
Final Report DE-FE0000896 16 February 2017
37
We used a thermodynamic equilibrium calculation of the NH3-CO2-H2S-H2O system to
determine the maximum equilibrium loading of H2S at varying CO2 loadings at 20 and 40 bar
(Figure 22). Based on this data, the maximum solubility of H2S at 50°C at 20 bar with 1 vol% of
H2S in the gas phase is 0.45 M while that at 40 bar is 0.75 M. Therefore, we elected to determine
the regeneration of the CO2-loaded ammonia solution with H2S concentrations closer to 0.4 M
for regeneration tests at 20 bar. The data from modeling was confirmed by the measured H2S
absorption data as well.
Figure 22. Equilibrium solubilities of H2S in H2S-H2O-CO2-NH3 system at a temperature of 50°C and
pressures of 20 and 40 bar.
Experiments (Test Series H) were performed in the bench-scale regenerator to determine
the effect of temperature on the regenerability of the CO2 and H2S rich solutions. Table 9
describes the results and test conditions from selected regenerator runs: (1) regeneration of
saturated solution containing CO2 only, and (2) regeneration of saturated solutions containing
both H2S and CO2.
0.0
0.5
1.0
1.5
2.0
2.5
3.0
3.5
4.0
0 5 10 15 20 25
H2S
in
So
luti
on
(M
)
CO2 Loading (Wt.%)
8 M Ammonia at 50oCH2S (vap) = 1 % vol
40 bar
20 bar
Page 39
Final Report DE-FE0000896 16 February 2017
38
Table 9. Test conditions and results from regenerator runs.
Figure 23 shows the change in the NH3/CO2 molar ratio (defined as R values) of
regenerated CO2 rich absorber solution with regenerator temperature. As an example, in
Run #33, an 8 M ammonia solution with a 22 wt% CO2 loading was regenerated in the
temperature range of 140° to 165°C at 300 psig pressure. Based on this data, lean solutions with
only 1 wt% CO2 (R = 4.5 or R’= 0.22) can be achieved at 165°C while releasing CO2 at 20 bar.
This translates into removal of 95% of absorbed CO2 from the CO2 rich solution from the
absorber. This level of CO2 removal is more than sufficient because the absorber tests have
shown that 90% CO2 capture can be achieved using solutions containing less than 15 wt% CO2.
Run P/psig T reboiler T top T feed Liq Feed Rate [S2-]aq [CO2]aq [NH3]aq H2Sg CO2g
psig oC oC oC lpm M M M vol % vol %
No H2S
33 298 145 75 60 0.1 0 NM NM 0 5*
33 300 150 85 60 0.2 0 NM NM 0 11*
33 304 157 98 56 0.2 0 NM NM 0 12*
33 310 158 80 52 0.2 0 NM NM 0 13*
33 feed 0 5 8
With H2S
34 250 135 58 58 0.1 0.25 NM NM 5.2 NM
34 300 150 62 58 0.1 0.22 NM NM 4.9 NM
34 300 156 79 58 0.1 0.20 NM NM 5.0 NM
34 300 163 90 58 0.1 NM NM NM 5.0 NM
34 300 165 101 58 0.1 NM NM NM 5.3 NM
34 275 165 108 58 0.1 NM NM NM 6.9 NM
34 185 165 116 58 0.1 NM NM NM 13.9 NM
34 172 162 120 58 0.1 0.095 NM NM 19.7 NM
34 feed 0.4 4.4 8
With H2S
36 250 100 53 60 0.2 0.18 2.9 7.3 NM NM
36 250 110 53 60 0.2 0.19 3.0 7.4 3.3 83
36 250 118 54 60 0.2 0.18 1.9 7.3 3.5 90
36 300 118 60 53 0.2 0.13 2.1 7.3 3.3 92
36 200 118 65 53 0.2 0.13 1.4 7.2 3.6 93
36 200 118 65 53 0.2 0.12 1.4 7.1 3.6 93
36 150 118 65 53 0.2 NM NM NM 3.5 94
36 feed 0.4 3.9 7.5
* Gas flow rate in lpm, NM: Not Measured
Page 40
Final Report DE-FE0000896 16 February 2017
39
Figure 23. Variation of the R value (molar NH3/CO2 ratio) in the regenerated solution as a function of
regenerator temperature at 300 psig.
The regeneration of 8 M ammonia solution loaded with 19 wt% of CO2 and 1.4 wt% of
H2S is shown in Figure 24, which shows the volume percentage of H2S in the exit gas from the
regenerator at varying regenerator temperatures. This data indicates that the effect of temperature
on the H2S gas composition is very minimal in the tested temperature range of 110° to 165°C
while the effect of pressure is more pronounced. Figure 25 shows the H2S composition in the
regenerator exit at 125 and 165°C. This data indicates the pressure effect for H2S removal only
becomes important at high temperature. This behavior is expected, as the H2S removal step
requires a higher temperature than that of CO2.
Page 41
Final Report DE-FE0000896 16 February 2017
40
Figure 24. Effect of temperature and pressure on H2S composition in the regenerator exit gas.
Figure 25. Effect of pressure on H2S composition in the regenerator exit gas at 120° and 165°C.
0
10
20
30
40
50
100 110 120 130 140 150 160 170 180
H2S
in t
he
Exi
t G
as (
v/v%
)
Temperature (oC)
300 psi
250 psi
185 psi
170 psi
8 M Ammonia, 0.4 M Sulfide, R' =0.60
0
5
10
15
20
25
30
150 200 250 300 350 400
H2S
in t
he
Exi
t G
as (
v/v%
)
Pressure (psig)
8 M Ammonia, 0.4 M Sulfide, R'= 0.60
165 C
120 C
7.5 M Ammonia, 0.4 M Sulfide, R'= 0.58
Page 42
Final Report DE-FE0000896 16 February 2017
41
Figure 26 shows the variation of the CO2 to H2S ratio in the regenerator exit gas as a
function of pressure at 125°C and 165°C. The concentration of H2S in the regenerator exit gas is
an indication of its suitability to produce elemental sulfur from the gas mixture by the Claus
process. At 125°C (and throughout the tested pressure range), the ratio of CO2/H2S remains very
high (25 to 28 vol%). At 165°C, the ratio of CO2/H2S was 5 at 175 psig and about 18 at 300 psig.
These results show that the regeneration process produces a H2S-rich stream suitable for the
Claus process.
Figure 26.Variation of CO2/H2S ratio in the regenerator exit gas with pressure at 120° and 165°C.
Polishing of Fuel Gas for Fuel Cell and Chemical Production Applications: Although
electricity generation using the IGCC does not require a fuel gas that is free of H2S, electricity
generation using fuel cells will require H2S concentrations of 1 ppm or less. The ability of the
AC-ABC process to attain a fuel gas stream containing such trace levels of H2S is shown
experimentally in Figure 27. The data clearly shows that sub-ppm levels of H2S can be achieved
by the AC-ABC process.
0
5
10
15
20
25
30
150 200 250 300 350 400
Rat
io C
O2
/H2
S in
th
e E
xit
Gas
(v/v
%)
Pressure (psig)
8 M Ammonia, 0.4 M Sulfide, R' = 0.60
165 C
120 C
7.5 M Ammonia, 0.4 M Sulfide, R' = 0.58
Page 43
Final Report DE-FE0000896 16 February 2017
42
Figure 27. Trace removal of hydrogen sulfide from the absorber exit gas.
Bench-scale Test Data Analysis
In our experience, the high-temperature regeneration of the CO2-rich solution and the
evolution of CO2 are very rapid and the rates are controlled by heat transfer. However, the
absorption step is performed at a relatively low temperature and the chemical reactions cannot be
assumed to reach equilibrium. Hence, we analyzed the results from the absorption reaction in
terms of its ability to reach equilibrium.
Figure 28 depicts the data from runs with 4 and 8 M ammonia at 265 psia with 25 v/v%
CO2 in the inlet gas stream. This figure shows the concentration of CO2 (in the gas stream at the
top of the absorber column) as a function of CO2/NH3 ratio (R’ value) in the solution. Also
shown is the expected equilibrium CO2 partial pressure for a 10 M ammonia solution at 55°C
and 265 psi pressure. It is clear from this data that the system can be operated very close to the
equilibrium line when R’ values are closer to 0.4 (~ 12 wt% CO2 loading). This data allow us to
design multistage CO2 absorbers for capturing 90% CO2.
Page 44
Final Report DE-FE0000896 16 February 2017
43
Figure 28. Partial pressure of CO2 at the top of the absorber column as a function of the scrubbing
solution CO2/NH3 ratio.
We calculated the heat of reaction for CO2 absorption based on the measured data.
Figure 29 shows the measured temperature rise (temperature difference across the absorber
packing) with the change in the CO2 absorption rate. The heat of reaction is a function of the
CO2/NH3 ratio in the scrubbing solution at a given temperature. We calculate the heat of the CO2
absorption reaction to be 57 kJ/mole based on an observed temperature increase of 4°C for an
8 M ammonia solution with a CO2/NH3 ratio of 0.43. Although the data was obtained in a small
bench-scale reactor with relatively poor thermal management, it provides the information
necessary for estimating the heat requirements of the CO2 stripper.
0
10
20
30
40
50
0.1 0.2 0.3 0.4 0.5 0.6 0.7
CO
2P
art
ial
Pre
ss
ure
-A
bs
orb
er
To
p (p
sia
)
R', Molar Ratio CO2/NH3
Run 17 (4 M, 50 C)
Run 16 (4 M, 33 C)
Run 13 (4 M, 45 C)
Run 11 (4 M, 45 C)
Run 18 (4 M, 45 C)
Run 19 (4 M, 60 C)
Run 20 (4 M, 43 C)
Run 21 (8 M, 55 C)
Equilibrium Line (10 M, 55 C)
Absorber Operating Pressure = 1800 kPa (265 psia)4 M and 8M Ammonia, 0.88 acfm CO2 flow rate (25 %v/v)
Page 45
Final Report DE-FE0000896 16 February 2017
44
Figure 29. Estimated heat of reaction for CO2 absorption into an 8 M NH3 solution.
Below, we discuss the estimation of the required column heights for 90% CO2 capture
using a pilot-scale absorber for a given stream containing 40-50 v/v% CO2.
In this estimation, we apply the concept of absorption coefficient, which is the most
convenient approach for a packed-column design. Volumetric-based calculations are generally
used in order to determine the total absorber volume. We estimated the volumetric CO2
absorption rates from our 4-in packed column test data. We applied the well-established
relationships between the gas absorption rate and the gas mass transfer driving forces to estimate
the required absorber volumes for a given volumetric flow rate.
The theoretical height required to provide a product with a specified concentration in a
separation process (absorption and distillation) is governed by the following relationship:
Zt = HTU. NTU (1)
Where Zt is the tower height, HTU is the height of a transfer unit, and NTU is the number
of transfer units. From our absorber test data, we have calculated the height of the mass transfer
unit to correspond to different CO2-loaded ammonia solutions. This estimation is specific to the
packing type used (SRI bench-scale absorber packing density: 425 m2/m3) at 50-55°C and at
20 bar of operating pressure. The value of HTU is inversely proportional to the overall gas
transfer mass coefficient, KG (mol/h/m3,) based on the gas-phase driving force.
0
500
1000
1500
2000
0.0 0.5 1.0 1.5 2.0 2.5 3.0 3.5 4.0 4.5 5.0
CO
2A
bs
orp
tio
n R
ate
x1
03
(mo
le/m
in)
Delta-T (oC)
Run 17 (50 C)
Run 16 (33 C)
Run 18 (44 C)
Run 19 (60 C)
Run 20 (43 C)
Run 21 (55 C)
4 M ammonia (Runs 16-20), 8 M Ammonia (Run 21)Absorber Operation Pressure = 1800 kPa (265 psia)
57 kJ/mole (R' ~ 0.43)8 M Ammonia
Page 46
Final Report DE-FE0000896 16 February 2017
45
HTU = (V/S)/ KG (2)
Where V is the volumetric gas flow rate and S is the absorber cross section.
In estimating HTU values that correspond to the tests conducted using 4-in diameter
absorber, we used the expanded version of the mass transfer equation for the packed tower
𝑍𝑡 = (V
S
KG)
dy
y−y∗ (3)
The expanded version of Eqn (3) can be expressed as
NTU= dy/(y-y*) = (ya-yb)/ΔyL (4)
ΔyL= logarithmic mean driving force (yb -yb *) and (ya -ya *)
ya = mole percent CO2 in the gas phase at column bottom
yb = mole percent CO2 in the gas phase at column top
Figure 30 illustrates the values of gas mass-transfer coefficient for CO2 absorption at
55 C and 20 bar. The rate of absorption (mole/hr) relates to the NTU and KG(m3/hr/m3) as given
in Eq (5), where Vt is the gross tower volume
R = KG (Vt)ΔyL (5)
By using the HTU values calculated from the test data at various CO2 loadings, we were
able to estimate the required column height, achieving a desired efficiency at fixed-solution R’
values (CO2/NH3 values).
Page 47
Final Report DE-FE0000896 16 February 2017
46
Figure 30. Gas mass-transfer coefficient for CO2 capture at 55°C and 20 bar.
The corresponding HTU values for CO2 scrubbing solutions with varying CO2 loadings
are shown in Figure 31. This data shows that the absorber system is very efficient even at
18 wt% CO2 loadings (e.g., HTU is < 14 inch). In the current lab scale absorber, only 5 wt%
solvent loading in the absorber packing is used due to the pump limitations in small-scale
operations. For scale-up operations, the absorber solvent loading can easily be increased to 10%,
thereby further reducing the HTU values. The result will be an enhancement in absorber
efficiency.
0
1
2
3
4
5
0 0.2 0.4 0.6 0.8 1
Ga
s T
ran
sfe
r C
oe
ffc
ien
t, K
Ga
(m
3/m
in.m
3)
R' (Molar Ratio, CO2/NH3)
4 M Ammonia
8 M Ammonia
Page 48
Final Report DE-FE0000896 16 February 2017
47
Figure 31. Height of mass-transfer unit for CO2 absorption as a function of CO2 loading of the ammonia
capture at 55°C and 20 bar.
0.0
0.1
0.2
0.3
0.4
0.5
0.6
10 11 12 13 14 15 16 17 18 19 20
HT
U (m
)
CO2 Loading (wt%)
8 M Ammonia
Reactor Volume = 0.0045 m3
55 oC, 20 bar
Page 49
Final Report DE-FE0000896 16 February 2017
48
Preliminary Process Modeling and Cost Economics
Preliminary process modelling and cost economic analysis were performed using ASPEN
Plus and GT Pro, and the analyses were updated based on test data from the pilot plant. The
topical report of process modelling and the techno-economic analysis was submitted to NETL,
and a summary is included in this document.
BUDGET PERIOD 2
Small Pilot-Scale Design
Based on the data obtained from bench-scale batch testing, a small pilot plant, 0.15 MWe,
was designed to process 500 lb/hr syngas from the syngas cleanup unit (SCU) at the NCCC.
Construction of small-scale pilot plant was completed at the NCCC during spring/summer 2015.
An integrated system was designed (see Figure 32) and installed with a single absorber column
for simultaneous capture of CO2 and H2S from syngas and a single regenerator for simultaneous
stripping of CO2 and H2S at moderate temperature and elevated pressure. A compressor was used
to increase the syngas pressure supplied from the air blown gasifier at the NCCC. The syngas
compressor was equipped with a variable frequency drive to enable syngas mass flow control to
the absorber.
The absorber was comprised of an 8-in ID, 40-foot tall stainless steel column with three
absorption stages. Commercially available stainless steel structural packing was used in the first
and second absorption stages for gas-liquid contacting. The third stage used bubble cap trays,
also fabricated out of stainless steel. The purpose of the third absorption stage was to control
ammonia emission from the system. A Horiba CO2 analyzer based on infrared (IR) technology
was used to monitor CO2 concentration in the incoming syngas.
Two positive displacement pumps were used to circulate the solvent in each of the first
and second stages of absorption. A third positive displacement pump was used to deliver fresh
lean solution to the top of the third absorption stage. The bottom of the absorber column was
maintained at 120°F using heat tracing to prevent precipitation.
An 8-in ID and 40-foot tall water-wash column was installed downstream of the absorber
to capture ammonia from the clean syngas using deionized (DI) water. The water-wash column
was equipped with one stage of structural packing and a second stage of bubble cap trays to
minimize ammonia emissions. An automated back-pressure control valve was used to maintain
desired pressure in the absorber and water-wash columns. A positive displacement pump
delivered DI water to the top of the water-wash column, while another positive displacement
Page 50
Final Report DE-FE0000896 16 February 2017
49
pump was used to circulate the water through the first absorption stage. A Horiba CO2 analyzer
was used to monitor CO2 concentration in the clean syngas. A Fourier transform infrared (FTIR)
spectrometer was installed to monitor ammonia loss in clean syngas.
A slip stream of rich solution was taken out of the first absorption stage at the bottom of
the absorber column recirculation loop using a level controller and an automatic control valve.
The level controller maintained the rich solution inventory in the bottom of the absorber column,
and the slip stream was delivered to the regenerator for stripping CO2 and H2S. The rich solution
delivery lines were heat-traced to prevent precipitation.
The regenerator column was equipped with a reboiler to use moderate pressure steam and
strip CO2 and H2S from the rich solution. The regenerator column was designed with 8-in ID and
40-foot tall stainless steel column. The top stage of the regenerator contained the water wash for
the stripped gas stream to reduce ammonia emission. An automated back-pressure control valve
maintained the stripping gas pressure in the regenerator column.
The rich solvent was transferred from the absorber to the regenerator using a small
pressure differential between the two columns, while lean solution from the regenerator bottom
was transferred to a lean solution surge tank and pumped to the top of the absorber using a
positive displacement pump
The waste water streams from the absorber water-wash and regenerator water-wash
columns were collected into a spent water tank for disposal. In a larger system, the waste water
will be sent to a sour-water stripper to recover ammonia. Chemical analysis of the samples from
liquid waste streams and the lean solution demonstrated a low loss of ammonia during normal
operation of the pilot plant.
Page 51
Final Report DE-FE0000896 16 February 2017
50
Figure 32. Process flow diagram of the AC-ABC system.
Integrated Plant Operation – First Test Campaign
The small-scale AC-ABC pilot plant was operated using a slipstream of up to 500 lb/hr
syngas from air-blown gasifier at the NCCC, Wilsonville, AL in September / October 2015.
Lignite coal with a high sulfur content was used by the NCCC in the gasifier, resulting in
~ 2000 ppmv hydrogen sulfide in the syngas slipstream. A shift reactor operated by the NCCC
converted carbon monoxide to carbon dioxide using high-pressure steam. Syngas obtained after
the shift reactor and quench typically had 14 – 16% CO2, 0.2% H2S, 1% CO, 12% H2, 0.5% O2,
and 0.5% CH4 with the balance as nitrogen. Syngas was supplied at 60°F, -70°F, and 180 psig.
During upset conditions of the gasifier or syngas clean-up unit, the slipstream of syngas was
replaced with nitrogen by the NCCC.
A syngas compressor, which was part of the AC-ABC pilot plant, was equipped with a
variable frequency drive used to control the syngas mass flow through the AC-ABC absorber
column. Syngas flow was varied between 300 – 450 lb/hr at 450 psig. An IR-based CO2 analyzer
was used to measure CO2 in the syngas slip stream on a dry basis. In addition, the NCCC
E-700
Syngas to NCCC
pipe / Disposal
Steam
CO2/H2S to
vent / BHPC
F
FE-721
Condensate
K-150
E-720
[32]
Gas Water
Separator
Re
bo
iler
Th
erm
osip
ho
n
[45]
[41]
[4]
Piston
Compressor
TI
711
[42]
G-721
V-700
Syngas from
NCCC tar
removal
OF
DATE:
SHEET
DRAWING TITLE
JOB NO:
APPROVED BY:
DESIGNED BY:DRAWN BY:
SCALE:
PR
OJE
CT
TIT
LE
CHARGE NO:
333 RAVENSWOOD AVE.
MENLO PARK, CA 94025
REVISION LOG
# DATEBY DESCRIPTION
PIPING &
INSTRUMENT
DIAGRAM
A AN ISSUED FOR REVIEW 08-14-12
ABSORBERREGENERATOR
SRIR
International
E-320
S
SV-152
[3] E-500
PV-521
[5]
[12]
[12c]/[25]
[12a]
FE-501
V-600
WATER WASH
LEAN
SOLUTION
SURGE
TANK
[11]
V-620
[73]
SPENT
WATER
TANK
P-641
V-640
TREATED
WATER
TANK
[21]
[22]
[24]
S
NY-611
[1]
Air
P-651
P-601
P-501
P-301
P-321
ISSUED FOR REVIEWB AN 03-28-13
[72]
[44]
[43]
[20]
Makeup water
[46]
E-640
E-300
[11]
PFD-01
Page 52
Final Report DE-FE0000896 16 February 2017
51
monitored the composition of the syngas after the shift reactor and provided the syngas
composition data. A high-pressure, positive displacement pump was used to feed lean solution at
the top of the absorber column. The pump was equipped with a variable frequency drive to
control the solvent flow through the system. The lean solvent flow was varied between 500 –
1000 lb/hr.
Figure 33. CO2 concentration in syngas (Run #3).
Figure 33 shows CO2 concentration in the incoming syngas at the inlet of the absorber
and in the clean syngas at the outlet of the absorber water wash. It also shows availability of
syngas flow. During the interruption at the syngas cleanup unit (SCU) syngas stream was
replaced with nitrogen by the NCCC staff. Between ~ 75 hr to 95 hr, the outlet CO2 analyzer
experienced water ingress and showed erroneous readings. The objective of this run was to
demonstrate high CO2 capture efficiency, shown in Figure 34, under a steady-state, 100-hour
operation of the pilot plant. Figure 35 shows H2S concentration in incoming syngas and in the
clean syngas at the outlet of absorber water wash. H2S was measured by NCCC staff using a gas
chromatograph (GC). The data shows high capture efficiency for H2S.
0.00
2.00
4.00
6.00
8.00
10.00
12.00
14.00
16.00
18.00
CO
2 %
Hours
CO2 in Syngas
CO2 in Clean Syngas
Syngas ON
Water Ingress in CO2 meter
Page 53
Final Report DE-FE0000896 16 February 2017
52
Figure 34. CO2 capture efficiency (Run #3).
Figure 35. H2S concentration in syngas (Run #3).
80
85
90
95
100
105
% C
ap
ture
d
Hours
CO2 % Captured
0
20
40
60
80
100
120
140
160
180
200
0.0
500.0
1000.0
1500.0
2000.0
2500.0
H2
S p
pm
in C
lea
n S
yn
ga
s
H2
S p
pm
in S
yn
gas
Hours
H2S in Syngas
H2S in Clean Syngas
NOTE: Data from GC measurement by NCCC
Page 54
Final Report DE-FE0000896 16 February 2017
53
The bottom section of the absorber column was used as a reservoir for rich solution. A
positive displacement pump circulated the rich solution through the first absorption stage of the
absorber. The reservoir and first stage of the absorber were heat-traced, and the temperature was
maintained at 120°F to prevent precipitation of solids from the CO2-rich solution. A positive
displacement pump was used to circulate the solvent through a water-cooled heat exchanger with
a bypass control to maintain the temperature and maximize CO2 capture in the second stage of
absorber. Both the first- and second-stage absorbers were comprised of stainless steel structural
packing.
The third stage of the absorber was equipped with bubble cap trays. The purpose of the
trays was to minimize ammonia loss by controlling the lean solution and semi-rich solution flow
rates.
Clean syngas was obtained after the capture of CO2 and H2S and was passed through a
water-wash column to remove ammonia. An automated back-pressure control valve at the exit of
water-wash column was used to control the absorption pressure in the absorber.
Demineralized water was added to the top of the water-wash column using a positive
displacement pump to reduce the ammonia emission. An IR-based CO2 analyzer was used to
monitor CO2 in the clean syngas to determine efficacy of CO2 absorption process. In addition, an
FTIR spectrometer was installed to monitor ammonia content in the clean syngas stream. The
clean syngas composition was monitored by the NCCC staff using a GC on a continuous basis.
As the lean solution was added to the top of the absorber, an automated level control
valve sent a side stream of rich solution to the regenerator column. All rich-solution lines,
instrumentation, and control valves were heat-traced to prevent precipitation of solids.
Liquid samples were collected from the water-wash waste stream to monitor ammonia
loss.
Figure 36 shows the syngas pressure at the absorber inlet, near the first absorber stage,
and near the top of the absorber column. The pressure at the absorber water wash was controlled
using a backpressure control valve.
Page 55
Final Report DE-FE0000896 16 February 2017
54
Figure 36. Absorber pressure (Run #3).
The rich-solution side stream to the regenerator was passed through a heat-recovery
exchanger to recover heat from the lean solution. Low-pressure steam was supplied to the
reboiler attached to the regenerator. Steam flow was controlled using a manual control valve. As
expected, a thermal siphon developed between the regenerator and reboiler. Part of the rich-
solution stream was split from the main stream and fed to the middle stage of regenerator to
reduce ammonia loss from the regeneration process. A water-wash stage using demineralized
water was added to the top of the regenerator column to remove ammonia from the regenerated
gas stream. Liquid samples were collected from the water-wash waste stream and monitored for
ammonia content.
150.00
200.00
250.00
300.00
350.00
400.00
Pre
ssu
re,
psi
g
Hours
PT-151-Inlet Gas Pressure psig PT-321-Lower Column Pressure psig
PT-341-Upper Column Pressure psig PT-521-Water Wash Column Pressure psig
Page 56
Final Report DE-FE0000896 16 February 2017
55
Figure 37. Regenerator pressure (Run #3).
An automated back-pressure control valve was used to maintain the regenerator pressure,
and the regenerated stream was sent to the BPSC skid to convert H2S to elemental sulfur.
Figure 37 shows that CO2 can be regenerated at high pressure under steady-state operation.
Operating the regenerator at near the absorber pressure required less pump power for circulating
solvent through the system. This also reduced the number of compression stages for the CO2
compressor used for CO2 transportation. The level controller maintained the liquid level in the
regenerator bottom section, and the lean solution was returned to lean solution surge tank
through a heat recovery heat exchanger.
The reboiler was operated at 290°F – 310°F by controlling the steam input and
maintaining a back pressure of 300-350 psig.
Analytical Testing
Liquid samples were collected periodically from the lean solution stream and analyzed
for ammonia and CO2 loading. A target CO2/NH3 loading ratio for the lean solution was set at
0.4 – 0.45. A CO2 loading of ~ 100g/liter of solvent was demonstrated under one operating
condition [Figure 40: CO2 loading (Run #2)] during the first test campaign.
100.00
150.00
200.00
250.00
300.00
350.00
400.00
450.00
Pre
ssu
re,
psi
g
Hours
Regenerator pressure
Page 57
Final Report DE-FE0000896 16 February 2017
56
Figure 38. CO2 loading (Run #3).
As mentioned earlier, syngas was replaced by nitrogen during the upset conditions of the
gasifier and/or SCU at the NCCC. This caused a system upset in AC-ABC pilot plant and a loss
of ammonia from the solvent [Figure 38. CO2 loading (Run #3)]. A modified operating
procedure was implemented to minimize ammonia loss in the second test campaign.
Based on lean solution analysis, the CO2/NH3 ratio was determined to be at 0.4 – 0.45.
Rich-solution loading was calculated as 0.7 [Figure 39. CO2 / NH3 loading (Run #3)]. With heat
tracing in place, there was no appreciable solids precipitation in the rich-solution path. A higher
CO2 loading in the rich solution (0.8) and a lower loading (0.35) in the lean solution were
targeted for the second test campaign to improve CO2 loading in the water up to 150 g/liter or
higher.
0.0
0.2
0.4
0.6
0.8
1.0
1.2
0.0
1.0
2.0
3.0
4.0
5.0
6.0
7.0
CO
2/N
H3
CO
2 %
Lo
ad
ing
/ A
mm
on
ia i
n l
ea
n s
olu
tio
n (
Mo
lal)
Hours
CO2 loading % Ammonia in Lean solution mol/kg CO2/NH3 in lean solution
Ammonia Loss during Syngas stoppage
Page 58
Final Report DE-FE0000896 16 February 2017
57
Figure 39. CO2 / NH3 loading (Run #3).
Figure 40. CO2 loading (Run #2).
0.0
0.1
0.2
0.3
0.4
0.5
0.6
0.7
0.8
0.9
1.0
CO
2/N
H3
Lo
ad
ing
Hours
Rich Solution
Lean Solution
CO
2 l
oa
din
g i
n s
olv
en
t, w
t%
Hours
CO2 loading %
Page 59
Final Report DE-FE0000896 16 February 2017
58
The regenerated gas stream was analyzed for H2S content using Draeger tubes. H2S
varied between 0.7 to 1.5% in the regenerated stream (Figure 41).
Figure 41. NH3 & H2S concentrations in regenerator gas.
A pressure-sampling vessel was used to collect gas samples from the regenerated gas
stream, and it was analyzed at the NCCC using a GC. The gas analysis demonstrated a very low
level of fuel gas species in the regenerated gas stream as shown in Figure 42 [Gas composition
(dry basis) of regenerated gas stream]; thus, there was a negligible loss of fuel gas species from
syngas, (Figure 43).
0.0
0.2
0.4
0.6
0.8
1.0
1.2
1.4
1.6
0.0
2.0
4.0
6.0
8.0
10.0
12.0
14.0
16.0
18.0
20.0
H2
S,
%
Am
mo
nia
, p
pm
Regenerated stream NH3 ppm Regenerated stream H2S %
NOTE: Draeger tube measurements during runs 3, 4 & 5
Page 60
Final Report DE-FE0000896 16 February 2017
59
10/13/2015 10/15/2015
Hydrogen (vol %) 0.07 0.08
Nitrogen (vol %) 1.56 0.45
Carbon monoxide (vol %) 0.02 0
Methane (vol %) 0 0
Argon (vol %) 0.26 0.01
Hydrogen sulfide (vol %) 1.42 1.56
Carbon dioxide (vol %) 96.67 97.9
Carbonyl sulfide (ppmv) 25 19
Figure 42. Gas composition (dry basis) of regenerated gas stream.
Figure 43. Mass balance of hydrogen.
0
2
4
6
8
10
12
14
16
Mo
le f
ract
ion
(%
) /
Gas
flo
w (
lb/h
r)
H2 in syngas (lb/hr) H2 in clean syngas (lb/hr) H2 % in syngas H2 % in clean syngas
H2 % in Clean Syngas
H2 % in Syngas
Calculated Hydrogen massflow (lb/hr) in Syngas and Clean Syngas
Page 61
Final Report DE-FE0000896 16 February 2017
60
Figure 44. NH3 concentration in clean syngas.
An FTIR was installed to monitor the ammonia concentration in the clean syngas stream.
During the startup, the FTIR was damaged due to the presence of particles in the gas stream.
Draeger tubes were used instead of FTIR to periodically monitor the ammonia concentration.
The maximum ammonia concentration measured was 600 ppm in the clean syngas stream as
shown in Figure 44. This level of ammonia was caused by failure of the bubble cap trays in the
third stage of the absorption column.
System Modification and Maintenance
A high-pressure positive displacement pump for the lean solution failed during operation.
The diaphragm was replaced, and the pilot plant was restarted. The probable cause of diaphragm
failure was a pressure surge or the presence of syngas-entrained particles.
During upset conditions, particles were entrained with raw syngas. These particles were
analyzed and found to be less than 100 micron in size and contained calcium, magnesium, iron,
and chromium as main constituents. The syngas compressor was equipped with an inlet filter that
0
100
200
300
400
500
600
700p
pm
Ammonia concentration in the clean syngas , by Draeger tube measurement
Page 62
Final Report DE-FE0000896 16 February 2017
61
was sized to remove 100-micron or larger particles from the gas stream. The particles clogged
several control valves, and the pilot plant had to be shut down. After removing the solvent, the
system was rinsed several times to clean the control valves, lines, and columns, and the system
was restarted. The source of particles is undetermined. The particles were recovered from the
liquid stream and tested for size and composition (Figures 45-47).
Figure 45. Entrained particles – size distribution.
Page 63
Final Report DE-FE0000896 16 February 2017
62
Figure 46. X-ray fluorescence analysis of the syngas-entrained particles.
Page 64
Final Report DE-FE0000896 16 February 2017
63
Figure 47. Semi-quantitative analysis by X-ray diffraction of syngas-entrained particles.
Page 65
Final Report DE-FE0000896 16 February 2017
64
CO2 / H2S Separation Process
A BPSC process was installed downstream of the AC-ABC system to separate H2S from
the CO2 regenerated gas stream and convert the same to elemental sulfur using SO2. There were
several design, installation, and operational shortcomings in the BPSC system. A positive
displacement pump was used to provide liquid SO2 at a calculated rate based on H2S
concentration in the regenerated stream. Due to the small flows involved, it was difficult to
control the pump output to match the desired demand. As shown in Figures 48 and 49, a
significant amount of sulfur was recovered in elemental form from the regenerated gas stream,
even after all the system problems. However, inadequate heat tracing prevented measurement of
the flow and quantification of the sulfur produced.
Figure 48. Sulfur in outlet plenum of reactor intercooler HX-04.
Page 66
Final Report DE-FE0000896 16 February 2017
65
Figure 49. Close-up view of sulfur in outlet plenum of reactor intercooler HX-04.
Page 67
Final Report DE-FE0000896 16 February 2017
66
Second Test Campaign
Based on the data from the first test campaign and operating experience, the following
objectives were targeted for the second test campaign during April / May 2016:
1. Objective: Steady, continuous operation for 100 hours or more at 99+% CO2 and H2S
capture efficiency; regeneration and sulfur production.
Results: A total of over 400 hr of operating data was collected from the second test
campaign, including a 175-hr (7-day) continuous integrated run. The test results show that both
CO2 and H2S can be captured in a single absorber operating at 350 psig, 120F. A high capture
efficiency for both CO2 and H2S (> 99+ %) was demonstrated during this test campaign. This
test campaign had > 80% uptime for the pilot plant.
CO2 in clean syngas was measured at 500 – 1000 ppm, compared to 14% CO2 in the feed
gas, when absorption was performed at 350 psig. Operation at higher pressure will further reduce
this residual CO2 emission. H2S was reduced from 2000 ppm in the inlet gas stream to < 2 ppm
(below the detection limit of GC) in the clean syngas stream.
A stream of > 98+ mol% CO2 and 1.5 mol% H2S was regenerated at 350 psig from a
single regenerator. The downstream process demonstrated high conversion of H2S to high-purity
elemental sulfur. However, due to heat tracing problems on small-diameter interconnecting
tubing, the liquid sulfur solidified and did not flow to the appropriate vessels; as such, sulfur
production could not be quantified.
2. Objective: Achieve > 100 g CO2 loading per 1000 g water using an 8-molal NH3 solution.
Results: An effective loading of 120 gCO2/1000 g water was demonstrated under steady-
state operation during the test campaign with maximum loading, and 140 gCO2/1000 g water
was achieved.
3. Objective: Optimize operation of the top of absorber to minimize NH3 flow to the water
wash.
Results: Bubble cap trays in the top absorber section were replaced by structural packing
for this test campaign, and later the top absorber section was bypassed due to ineffective liquid-
to-gas contact. The absorber was operated with only two stages, and still the test results show
high CO2 capture efficiency. Ammonia emission from the absorber was measured at 500 –
1000 ppm under steady operating conditions. During operation at higher pressure and with the
third-stage absorption, ammonia emissions can easily be reduced to a very low value (~ 20 ppm).
In a commercial system, ammonia will be recovered in a sour-water stripper.
Page 68
Final Report DE-FE0000896 16 February 2017
67
4. Objective: Optimize the water-wash operation to demonstrate low water use.
Results: Based on lab tests carried out at atmospheric pressure at SRI International, the
bubble cap trays were modified to eliminate flooding experienced during the first test campaign.
However, the modified bubble cap trays did not perform as expected, and low water use could
not be demonstrated. ASPEN modeling shows it is possible to capture ammonia emissions from
the absorber with minimal water use when properly designed bubble cap trays are used.
Commercially designed bubble cap trays were not available for the small pilot-scale setup;
however, the same will be included in a future test campaign to demonstrate low water use in the
water-wash column at a larger scale.
5. Objective: Operate the regenerator steam in steady mode and operate the lean solution with
CO2 loading < 0.35.
Results: The regenerator was operated with steady steam flow, and a low CO2 loading in
the lean solution (< 0.35 CO2/NH3 ratio) was demonstrated. It is possible to automate steam flow
control using a reboiler temperature feedback loop control. The same will be considered for a
future test campaign.
6. Objective: Operate the BPSC skid with controlled SO2 flow and quantify sulfur formation.
Results: The sulfur dioxide delivery system was modified to enable controlled flow of
SO2 to the process system. The test results show high conversion of H2S to high-purity elemental
sulfur. However, due to problems with heat tracing, liquid sulfur did not flow to the collection
vessel and instead froze at cold spots in lines and/or valves and hence could not be quantified. A
future test campaign could use higher-temperature heat tracing and better insulation.
Pilot-Plant Modification
Based on operational experience, data collected, and lessons learned from the first test
campaign during September/October 2015, the following modifications were carried out prior to
the second test campaign at the pilot plant.
1. During the first test campaign, some solid particles were entrained with raw syngas. An inlet
syngas particle filter was installed upstream of the syngas compressor to remove any solids
entrained in the raw syngas and prevent damage to the compressor.
2. Heat tracing and insulation on the system process piping and vessels were improved to
prevent precipitation from the rich solution during the process upset conditions. The gas-
sampling lines were heat-traced to prevent precipitation from the gas phase.
Page 69
Final Report DE-FE0000896 16 February 2017
68
3. It was a challenge to commercially source the bubble cap trays for the small diameter of the
pilot process vessels for the AC-ABC process. To demonstrate low water use for ammonia
emission control, bubble cap trays are the most efficient gas-liquid contactors. For the first
test campaign, in-house designed and fabricated bubble cap trays were installed. During the
pilot plant operation, tray flooding was observed and the trays were bypassed during
extended operation. Bubble cap trays were field-modified based on atmospheric pressure
tests carried out at the SRI lab. The modified bubble cap trays did not perform as intended in
the water-wash column and had to be bypassed again. For a future test campaign, we expect
that commercial bubble cap trays will be used, and a potential source for them has been
identified.
4. The absorber top stage also contained bubble cap trays to effectively control ammonia
emissions from the absorber by adjusting the ratio of the lean solution feed rate to a
recirculation flow rate. The first test campaign resulted in bubble cap trays flooding and
solvent carryover to water-wash column. The top absorber stage bubble cap trays were
replaced by structural packing. Due to low liquid loads, the structural packing was not
effective. The third stage of absorber was bypassed, and the absorber was operated with two
working stages. Test results show that capture efficiency was still very high for both CO2 and
H2S even with only two operating stages. The recorded ammonia emissions were between
500 – 1000 ppmv.
5. Steam-cleaning valves were added to the piping where clogging was experienced due to
process upset conditions during the first test campaign. This enabled faster turnaround
between two test runs and resulted in > 80% uptime for the pilot plant during the second test
campaign.
6. The solvent circulation pump’s Viton diaphragms were replaced with EPDM material, which
is more chemically compatible with sulfides in the solvent.
7. Thermal mass flow meters in the exit gas lines were replaced by a Coriolis meter for better
data collection in the gas flows.
8. The particles entrained in raw syngas during the first test campaign damaged the FTIR
mirrors. Hence, ammonia emissions could not be monitored during the first test campaign.
The FTIR spectrometer was repaired and installed to monitor ammonia in the gas outlet from
the absorber column.
9. A gas heater was added to provide heated nitrogen for regeneration of sulfur from the
catalytic bed for the BPSC skid.
Page 70
Final Report DE-FE0000896 16 February 2017
69
10. The SO2 delivery system was modified, and a pulsation dampener was added to the SO2 line
to reduce flow fluctuations due to diaphragm pump. A new SO2 vaporizer was installed to
convert liquid sulfur dioxide to vapor. Under the modified arrangement for SO2 delivery, a
recirculation loop was added to the pump and a Coriolis-based flow control was designed to
withdraw the desired amount of liquid from the loop. The performance of the SO2 delivery
system improved somewhat, but further improvements can be made by replacing the pump
with one that has a larger flow rate such that the recirculation loop always has more than the
desired quantity of liquid.
11. The sulfur product cooler/melter serves a dual purpose. As the gas product enters the
cooler/melter before returning to the facility, this is the last opportunity to remove sulfur
vapor and simultaneously provide a more dense vapor for compression. As a result,
elemental sulfur vapor solidifies on the tubes. During the cycle, this exchanger moves from
being a "cooler" to a "melter". Elemental sulfur is melted off of the tubes using steam on the
opposite side of the heat exchanger. The sulfur is then collected with the other liquid sulfur
from the normal process outlet. Steam tracing was added to the sulfur product cooler/melter
to provide faster heating and cooling steps. Electric tracing was deemed not fast enough for
the heat-up step. By using steam in the coil around the vessels, the desired temperature was
achieved in a short time. During the cooling step, steam was replaced with cooling water to
reduce the shell temperature of the vessel in a short period of time.
The above-mentioned modifications significantly improved the pilot operation during the
second test campaign. During the April/May 2016 test campaign, five test runs were carried out
with a total of 400 hr of data collected from 480 hr of syngas availability from the gasifier. This
campaign included one continuous run of 175 hr (7 days).
Pilot-Plant Operation
The second test campaign of the AC-ABC / BPSC pilot plant was carried out at the
NCCC in Alabama in April/May 2016. The NCCC operated the coal gasifier using PRB, a mix
of PRB/lignite, and lignite coal. The SCU at the NCCC provided 500 lb/hr shifted syngas after
tar removal at 170 psig and 50 – 60F. Shifted syngas contained 12-15 mol% CO2 and 1800 –
2000 ppmv H2S. Availability of raw syngas from the NCCC gasifier was hampered by gasifier
maintenance issues. The gasifier had to be shut down for maintenance a few times during the test
campaign for multiple days at a time. The raw syngas with H2S > 1000 ppmv was available for
~ 480 hours during the G4 test campaign.
Page 71
Final Report DE-FE0000896 16 February 2017
70
Table 10. Typical raw syngas stream composition from the lignite coal gasifier at NCCC.
Syngas Temp
Syngas Pressure Ar N2 CO CO2 CH4 H2 H2S
TI9860 PI9863 AI2603A AI2603B AI2603C AI2603D AI2603E AI2603G AI2603J
°F psig % % % % % % ppm
67.4 170.2 0.6 74.4 0.03 13.4 0.6 10.1 2081.7
Figure 50. Raw syngas availability.
A syngas compressor was used to increase the pressure of raw syngas to 350 psig. The
compressor is equipped with a variable speed drive to control the flow of syngas to the absorber.
A particle filter was added to the compressor inlet, and a compressor bypass line was installed to
vent any residual gases in the syngas supply line. IR-based CO2 monitors were used to measure
CO2 concentration in the inlet raw syngas and clean syngas. In addition, the NCCC provided raw
syngas composition and also measured clean syngas composition using a GC. A separate GC
measured H2S in the clean syngas. The repaired FTIR spectrometer was used to monitor
ammonia concentration in the gas stream exiting the absorber. Coriolis meters were used
measure mass flow of raw and clean syngas and regenerated stream. Grab samples of
regenerated gas stream were taken periodically and analyzed for composition by the NCCC
SYNGAS ON
SYNGAS OFF
SYNGAS FROM PRB
SYNGAS FROM LIGNITE COAL
Page 72
Final Report DE-FE0000896 16 February 2017
71
using a GC. H2S in the clean CO2 gas after the sulfur recovery system was measured using
Draeger tubes.
Discussion of Results
Detailed data and analysis are presented here for Run #10, when the pilot plant was
operated for ~ 175 hr (7 days) on a 24-hr basis. During the run, some ammoniated solution was
removed and fresh solution was added to the system. There was some interruption to syngas
during this run; the pilot plant was put in a hot-standby mode and solvent circulation continued
but the steam was cutback. The inlet and outlet syngas streams were closed. Another interruption
was caused by back pressure in the syngas return line, probably due to clogging. The inlet syngas
was temporarily stopped to clear the clog, and the pilot operation resumed.
Figure 51. Syngas availability during Run #10.
During Run #10, raw syngas flow was maintained at 300 lb/hr with a back pressure
regulated in the water-wash column at 350 psig. Near the very end of the run, the raw syngas
flow rate was increased to 350 lb/hr to demonstrate high CO2 loading. Figure 52 below shows
mass flow rates of the three gas streams: raw syngas, clean syngas, and the regenerated gas
stream. All gas flows were monitored using Coriolis flow meters.
0:00 12:00 24:00 36:00 48:00 60:00 72:00 84:00 96:00 108:00 120:00 132:00 144:00 156:00 168:00 180:00 192:00
Time (hh:mm)
SYNGAS ON
SYNGAS OFF
Page 73
Final Report DE-FE0000896 16 February 2017
72
Figure 52. Raw syngas, clean syngas, and regenerated gas stream mass flow rate (Run #10).
Raw syngas contained 14 – 15 mol% CO2 and ~ 2000 ppm H2S. Figure 53 shows the
concentration of CO2 in raw and clean syngas, and Figure 54 shows H2S concentration in raw
and clean syngas.
Figure 53. Concentration of CO2 in raw and clean syngas (Run #10).
0
50
100
150
200
250
300
350
400
0:00 12:00 24:00 36:00 48:00 60:00 72:00 84:00 96:00 108:00 120:00 132:00 144:00 156:00 168:00 180:00 192:00
Gas
Flo
w (
lb/h
r)
Time (hh:mm)
Raw Syngas
Clean Syngas
Regenerated Gas
SYNGAS RETURN LINE TO NCCC CLOGGED
0
2
4
6
8
10
12
14
16
0
0.05
0.1
0.15
0.2
0.25
0.3
0.35
0.4
0.45
0.5
0:00 24:00 48:00 72:00 96:00 120:00 144:00 168:00 192:00
CO
2in
inle
t sy
nga
s, v
ol %
dry
bas
is
CO
2vo
l% in
cle
an s
ynga
s, d
ry b
asis
Time (hh:mm)
CO2 in Raw Syngas
CO2 in Clean Syngas
Page 74
Final Report DE-FE0000896 16 February 2017
73
Figure 54. Concentration of H2S in raw and clean syngas (Run #10).
Raw syngas was introduced in the absorber first stage. Semi-rich solvent was circulated
at the bottom of the absorber with no external cooling. A PID controller and back-pressure
regulating valve were used to maintain pressure in the absorber and water-wash column. After
being scrubbed in the water-wash column, clean syngas was returned to the thermal oxidizer
with a gas sampling line to a GC to monitor the gas composition. Solvent circulation was
maintained using a level sensor in the absorber reservoir and a level control valve. Rich solution
from the bottom of the absorber was sent to regenerator.
The regenerated gas stream was either returned to the thermal oxidizer or sent to the
sulfur removal unit. Grab samples from the regenerated gas stream were tested by the NCCC to
determine gas composition.
Bubble cap trays in the top stage of the absorber flooded during the first test campaign
due to inadequate design. The trays were replaced by structural packing for the second test run.
The packing did not perform well due to low liquid loads and was bypassed during the test runs.
The absorber was operated with two stages and achieved > 99.5% CO2 capture and > 99.5% H2S
capture in a single vessel as shown in Figure 55.
During a period from 30 to 84 hr, the capture efficiencies for both CO2 and H2S were
marginally lower due to low ammonia concentration in the solvent. Fresh ammonia solution was
added to the system resulting in high capture efficiency for both CO2 and H2S. Effective CO2
loading was calculated based on the mass of CO2 captured and the water content of the
0
500
1000
1500
2000
2500
0
20
40
60
80
100
120
0:00 24:00 48:00 72:00 96:00 120:00 144:00 168:00 192:00
H2S
in r
aw s
ynga
s, p
pm
H2S
in C
lean
syn
gas,
pp
m
Time (hh:mm)
H2S in clean syngas
H2S in raw syngas
Page 75
Final Report DE-FE0000896 16 February 2017
74
circulating solution. The solvent circulation rate was varied to change the effective loading of
CO2 in solvent.
Figure 55. Capture efficiency and CO2 loading in solvent (Run #10).
0
2
4
6
8
10
12
14
16
18
20
90
91
92
93
94
95
96
97
98
99
100
0:00 24:00 48:00 72:00 96:00 120:00 144:00 168:00 192:00
Effe
ctiv
e C
O2
load
ing,
wt%
Cap
ture
eff
icie
ncy
, w
t%
Time (hh:mm)
H2S capture efficiency
CO2 capture efficiency
Effective CO2 loading
Page 76
Final Report DE-FE0000896 16 February 2017
75
Figure 56. CO2 loading varied by changing solvent recirculation rate (Run #10).
Ammonia concentration in the circulating solvent and CO2 and sulfide loading were
determined by wet analysis of liquid samples in the lab. Figure 57 shows ammonia concentration
and sulfide concentration in lean solution, and Figure 58 shows the CO2-to-ammonia
concentration in lean solution. A titrator was used to determine ammonia and CO2 loading in
lean solution and the same was calculated for the rich solution. An ultraviolet visible (UV/Vis)
spectrometer was used for sulfide concentration determination. Sulfides were stabilized in the
liquid samples using a buffer, and color was developed using methylene blue. Sulfide was
observed at a 665-nm wavelength.
0
200
400
600
800
1000
1200
1400
0
2
4
6
8
10
12
14
0:00 24:00 48:00 72:00 96:00 120:00 144:00 168:00 192:00
Inle
t sy
nga
s fl
ow
, so
lve
nt
reci
rcu
lati
on
rat
e (
lb/h
r)
CO
2lo
adin
g w
t%
time (hh:mm)
Raw Syngas Flow
Solventrecirulation rate
CO2 loading
Page 77
Final Report DE-FE0000896 16 February 2017
76
Figure 57. Ammonia and sulfide concentrations in lean solution (Run #10).
Relative CO2 loading in the lean and rich solution determines the effectiveness of the
CO2 capture process. The titration method of liquid sampling to determine relative concentration
can be replaced by an online concentration measurement system. Online measurement can guide
the operation to improve effective CO2 loading without precipitation and optimize steam use in
the reboiler where CO2 is regenerated.
0
200
400
600
800
1000
1200
1400
1600
1800
2000
2200
2400
0.00
1.00
2.00
3.00
4.00
5.00
6.00
7.00
8.00
9.00
10.00
11.00
12.00
0:00 24:00 48:00 72:00 96:00 120:00 144:00 168:00 192:00
Sulf
ide
in le
an s
olu
tio
n (
pp
m)
Am
mo
nia
in le
an s
olu
tio
n (
Mo
lal)
Time (hh:mm)
Ammonia
Sulfide content
Page 78
Final Report DE-FE0000896 16 February 2017
77
Figure 58. CO2 loading in lean and rich solution (Run #10).
Figure 59. Ammonia in clean syngas from absorber (Run #10).
0.00
1.00
2.00
3.00
4.00
5.00
6.00
7.00
8.00
9.00
10.00
11.00
12.00
13.00
0.00
0.10
0.20
0.30
0.40
0.50
0.60
0.70
0.80
0.90
1.00
1.10
1.20
1.30
0:00 24:00 48:00 72:00 96:00 120:00 144:00 168:00 192:00
Am
mo
nia
, M
CO
2/N
H3
rati
o
Time (hours)
CO2/NH3 ratio in lean solution
CO2/NH3ratio in rich solution Ammonia in solution
0:00 24:00 48:00 72:00 96:00 120:00 144:00 168:00 192:00
0
0.05
0.1
0.15
0.2
0.25
0.3
0.35
0.4
0.45
0.5
0
500
1000
1500
2000
2500
3000
3500
4000
4500
5000
CO
2in
Cle
an s
ynga
s (v
ol.
%, d
ry b
asis
)
Am
mo
nia
in A
bso
rbe
r G
as o
utl
et
(pp
m)
Time (hh:mm)
Lean solution to 2nd stage absorber
Added Ammonia to lean solution surge tank
Lost syngas
Syngas return line clogged
Page 79
Final Report DE-FE0000896 16 February 2017
78
As explained earlier, bubble cap trays did not perform as designed. This resulted in
operating the absorber with only two stages. Ammonia emissions from the absorber were
recorded using an FTIR spectrometer. Figure 59 shows ammonia in the clean syngas stream from
the absorber. This gas stream was subsequently passed through a water-wash column. Ammonia
in the clean syngas from the water-wash column was monitored using Draeger tubes, and it was
found to be present at 250 ppm or less.
Process modeling using ASPEN shows that it is possible to reduce ammonia emissions to
< 50 ppm using a water wash with well-designed bubble cap trays. In a future test campaign, we
expect to install commercially designed bubble cap trays and show efficacy of ammonia capture
in the water-wash column. Ammonia from the water-wash waste stream will be recovered in a
sour-water stripper in a commercial plant.
Electric heat tracing was used to maintain the 120F temperature in the bottom of the
absorber to prevent precipitation from the rich solution. All rich-solution transfer lines from the
absorber to the regenerator were heat-traced. The second stage of the absorber had a recirculation
loop to cool the semi-rich solution. Fresh lean solution was added to the second absorber stage to
reduce ammonia emission.
Figure 60. Absorber bottom-stage temperature profile (Run # 10).
Both the absorber and regenerator were operated at similar pressures (~ 350 psig) to
reduce pumping needs across pressure boundaries. High-pressure absorption results in reduced
ammonia emission and thus lowers the operating cost by minimizing solvent make-up costs.
0
20
40
60
80
100
120
140
160
180
200
0:00 24:00 48:00 72:00 96:00 120:00 144:00 168:00 192:00
Tem
pe
ratu
re (
F)
Time (hh:mm)
Absorber bottom Recirculation loop
Absorber 1st stage packing
Page 80
Final Report DE-FE0000896 16 February 2017
79
Figure 61. Absorber and regenerator pressure (Run #10).
Figure 62. Reboiler temperature for thermal siphon (Run #10).
A vertical reboiler was used to regenerate rich solution using steam in a counter-current
heat exchanger at moderate pressure. The temperature in the regenerator was maintained by
controlling the steam flow in the reboiler. It was determined that both CO2 and H2S can be
0
50
100
150
200
250
300
350
400
450
0:00 24:00 48:00 72:00 96:00 120:00 144:00 168:00 192:00
Pre
ssu
re p
sig
Time (hh:mm)
Absorber top
Regenerator top
0
50
100
150
200
250
300
350
400
0:00 24:00 48:00 72:00 96:00 120:00 144:00 168:00 192:00
Tem
pe
ratu
re (
F)
Time (hh:mm)
Reboiler top temperature
Reboiler bottom temperature
Page 81
Final Report DE-FE0000896 16 February 2017
80
regenerated in a single vessel, and lean solution is recirculated back to the absorber. In a
commercial system, the heat source in the reboiler can be syngas and this can potentially result in
significantly increased efficiency and reduced operating expenses. It may be noted that ammonia
does not degrade at the operating temperature of reboiler. The higher the reboiler temperature,
the higher the pressure of regenerated streams of CO2 and H2Sthereby reducing the
compression needs of CO2 stream after converting H2S to elemental sulfur in the BPSC.
The regenerated stream was tested for composition. Grab samples from the regenerated
gas stream were taken in a pressure vessel and analyzed with a GC. It is evident that the
solubilities of fuel species like H2, CO, and CH4 in solvent are very low; thus, there is minimal
loss of fuel species.
Figure 63. Regenerated gas stream main constituents.
Solubility of methane and carbon monoxide was below the detection limit of the GC.
Figure 64 shows the GC measurement results for CH4 and CO in the regenerated gas stream and
Figure 65 shows the GC measurement results of hydrogen and argon in the regenerated gas
stream.
95
96
97
98
99
100
0
0.5
1
1.5
2
2.5
4/10/2016 0:00 4/20/2016 0:00 4/30/2016 0:00 5/10/2016 0:00 5/20/2016 0:00
CO
2 v
ol %
H2
S, v
ol%
time
H2S (%) CO2 (vol% dry)
Page 82
Final Report DE-FE0000896 16 February 2017
81
Figure 64. Methane and carbon monoxide in the regenerated stream.
Figure 65. Hydrogen and argon in the regenerated gas stream.
Coriolis meters were used to measure various gas flows in the process system, including
the inlet raw syngas flow, clean syngas return flow, and regenerated gas stream flow. Figure 66
shows a mass balance between product and inlet gas flow rates.
0
0.0005
0.001
0.0015
0.002
0.0025
0.003
4/10/2016 0:00 4/20/2016 0:00 4/30/2016 0:00 5/10/2016 0:00 5/20/2016 0:00
Vo
l %CH4 (%) CO (%)
0
0.02
0.04
0.06
0.08
0.1
0.12
0
0.02
0.04
0.06
0.08
0.1
0.12
4/10/2016 0:00 4/20/2016 0:00 4/30/2016 0:00 5/10/2016 0:00 5/20/2016 0:00
Arg
on
vo
l %
Hyd
roge
n (
vol%
)
Time hh:mm)
H2 (%) Ar (%)
Page 83
Final Report DE-FE0000896 16 February 2017
82
Figure 66. Gas mass balance (Run #10).
The AC-ABC / BPSC system setup at the NCCC is rated for ~ 150,000 scfd syngas
flowrate. The absorber and regenerator columns are 8-in ID and 40-feet tall. This is a relatively
small system to measure heat of reaction. ASPEN Plus was used to model the system and to
calculate the heat of reaction. Based on the modelling results, the program predicted the heat of
reaction for CO2 and H2S absorption and regeneration as ~ 690 BTU/l b or 1.45 GJ/ton of
regenerated gas stream.
The measured heat input was higher than calculated due to heat losses in a small system.
Figure 67 shows the heat of reaction based on steam input to the system during the 7-day steady-
state run.
0
0.2
0.4
0.6
0.8
1
1.2
1.4
1.6
1.8
2
0:00 24:00 48:00 72:00 96:00 120:00 144:00 168:00 192:00
Rat
io
Time (hh:mm)
Regenerated stream, lb/hr / (raw syngas, lb/hr - clean syngas, lb/hr)
Page 84
Final Report DE-FE0000896 16 February 2017
83
Figure 67. Energy input to reboiler (Run #10).
Corrosion
During the second test campaign, some dark solids were observed in the solvent. Four
samples were collected and sent for analysis to an outside lab. X-ray diffraction (XRD) analysis
showed iron and sulfides.
The waste collected during the test campaign included spent solvent, rinse water, and
stream from two water-wash columns. As per the report provided by the NCCC, the spent
solvent contained 28 mg/kg of chromium (the specification for disposal is 5), the rinse water had
3.6 mg/kg, and the waste water from water-wash columns contained 0.154 mg/kg.
The above tests indicate possible corrosion in the system; however, it is not yet clear
where this corrosion may be happening. The regenerator and reboiler are the hottest parts of the
system, but the solvent is lean in H2S and CO2 in these vessels and rich in ammonia. Another
possibility is in the bottom of absorber, where rich solution is circulated at 120 - 140F. Both the
absorber and regenerator were constructed out of 316 steel. According to one study of sour-water
strippers in refineries, SS316 is more prone to corrosion than carbon steel, especially in
ammonia-rich environments due to ammonia-metal complex formation.
During the first test campaign in September/October 2015, water samples were collected
at the beginning and end of each of five runs. Some chromium was reported in the water samples
of the first two of the five test runs during the test campaign. Solids transported with syngas
0
100
200
300
400
500
600
700
800
900
1000
0:00 24:00 48:00 72:00 96:00 120:00 144:00 168:00 192:00
He
at o
f re
acti
on
, B
TU/l
b C
O2
Time (hh:mm)
Page 85
Final Report DE-FE0000896 16 February 2017
84
during the first two test runs (as shown by the presence of calcium and magnesium) were
assumed to be the sources of chromium during the first test campaign. There was no chromium
recorded in test Runs #3, 4, and 5 of the first test campaign.
The location of corrosion is not determined.
H2S to Sulfur
Bechtel holds U.S. Patent7,374,742 for what is now known as the Bechtel Pressure
Swing Claus (BPSC) technology. Proof of concept was achieved at the Idaho National Energy
and Engineering Laboratory (INEEL), and the subsequent tests in pilot plants were conducted in
2015 and 2016 and are the subject of the text below. The purpose of the technology is to recover
sulfur from a high-pressure gas (CO2, syngas, or hydrocarbons) as liquid sulfur using SO2 as an
oxidant. Multiple sub-dew-point reactors are used in rotation (Lead/Lag/Regeneration) similar to
a molecular sieve dehydration unit (Mole-Sieve), a pressure swing absorption unit (PSA), or a
low pressure sub-dew-point Claus.
In this process, SO2 is introduced to the acid gases (“feed gas”) and they are heated
indirectly by steam in the “reactor feed heater”. Then the mixture is fed to the first or primary
on-line reactor (“primary reactor”), where most of the H2S, COS, and SO2 are converted to sulfur
and adsorbed on the catalyst. Based on the bench-scale testing, the primary reactor is expected to
produce a sweet gas of about 100 ppmv total sulfur (including residual elemental sulfur vapor).
The gas flows through a cooler (“reactor intercooler”), where it is cooled by generating steam.
Provisions are made to accommodate any sulfur that may condense at this location. Any
recovered sulfur drains to a sulfur pit, and the vapor goes to the next reactor (“secondary
reactor/sulfur trap”), which acts as a sulfur trap/guard bed. Here, it is expected that residual
sulfur vapor will be adsorbed and most of the remaining residual H2S, COS, and SO2 will be
converted to sulfur and/or adsorbed. The second reactor is expected to reduce the sulfur in the
product gas to less than 20 ppmv total sulfur. The product gas is returned to the facility for
compression. After about 8-12 hours online, the primary reactor is rotated to regeneration, the
secondary reactor moves up to the primary position, and the regenerated reactor is switched to
the secondary reactor position. The “regen reactor” is shown in regeneration in Figure 78. The
sulfur-loaded bed is partially regenerated by pressure let down. Flash gas passes through a sulfur
condenser (“sulfur condenser”) and is recompressed (“regen recycle compressor and regen gas
compressor”) prior to being mixed into the BPSC feed stream. There is a heating and cooling
cycle (“regeneration heater and cooler”) using recycled sweep gas to complete the reactor
Page 86
Final Report DE-FE0000896 16 February 2017
85
regeneration. High-pressure SO2 is produced from some of the product sulfur by reacting it with
oxygen from a proprietary reactor or a third-party vendor.
BPSC allows recovery of sulfur species as elemental sulfur while maintaining system
pressure. Due to the higher pressures compared to traditional Claus units, equipment size is
reduced.
Figure 68. BPSC diagram.
The 2008 INEEL work, documented in report INEEL/EXT-05-02663 and sponsored by a
Bechtel Technical Grant, showed proof-of-concept for high-pressure sub-dew-point operation of
Claus catalyst using typical -activated alumina. At INEEL, the reaction between H2S and SO2
was accomplished at pressures between 220-420 psig and 270-600 F, with H2S concentrations of
0.2-0.9 volume %. After sitting overnight at atmospheric pressure, the catalyst was found to be
“regenerated”, meaning no sulfur was found on the catalyst, and it was reused. Both nitrogen and
laboratory-synthesized syngas were used as the carrier gases. The initial “direct oxidation”
Page 87
Final Report DE-FE0000896 16 February 2017
86
approach using O2 failed due to side reactions with the syngas components (CO + H2), but
success was seen when SO2 was used as an oxidant.
The objectives of the pilot plant efforts were to:
A. Test overall recoveries of sulfur from the feed gas.
B. Measure catalyst capacity for sulfur during high-pressure, sub-dew-point operation.
C. Evaluate catalyst capacity as it ages during operation (absorption and regeneration
cycles).
D. Test different sulfur condenser design parameters.
These parameters are well known for sub-dewpoint Claus operations conducted at near
atmospheric pressure but are not known when operating at elevated pressures.
Some of the initial objectives had to be sacrificed due to the size of the plant and the time
available. Measurement of the effects of recycling the regeneration gas into the process feed is
one example, as a recycle compressor was not commercially available in this size range.
Similarly, supplementing the H2S concentration available at the facility was ultimately not
allowed due to concerns about potential H2S releases.
The BPSC pilot plant was offered at a total flow rate of ~ 111 lb/hr, although only 60%-
80% of that rate was typically received. Typical scale-up for pilot plant activities is a factor of no
more than 100x the size of the pilot plant. Therefore, Bechtel was aware that additional work
would be needed before making a commercial offering. However, a commercial demonstration
unit would be within reach.
A total of eight regenerations were executed during the second campaign, with two
showing “on-spec” sulfur recovery when the reactor was returned to service. The regeneration
efficiency appears to be a function of the pressure used, catalyst temperature, the composition of
the regeneration gas, the flow rate of the regeneration gas, and duration of the regeneration step.
The other six regenerations had difficulties, which are understood and can be corrected. Such
difficulties ranged from inconsistently maintained catalyst temperatures, test interruptions due to
problems with the host facility, test interruptions due to problems with the upstream AC-ABC
units, and valves/piping plugged with elemental sulfur.
Page 88
Final Report DE-FE0000896 16 February 2017
87
Table 11. Regenerations #1-#4.
Reactor 1 1 2 3
Date 5/1/2016 5/3/2016 5/11/2016 5/12/2016
Start Time 10:22 10:36 14:18 17:55
Prev Run, hr 15.6 21.8 15.0 19.8-21.5
Final H2S (Lead) 800-1500 400-750 1000
Final SO2 (Lead) 300 1200 400
Final H2S (Lag) >900 1-3 BDL 2
Final SO2 (Lag) unclear (0?) 0 150 15
REGENERATION
Pressure 12-33 9-50 11-13 15
Notes: FIRST LEAD RUN FIRST LEAD RUN FIRST LEAD RUN
later, RX-2 = 140 H2S
Table 12. Regenerations #5-#8.
Reactor 2 3 2 1
Date 5/13/2016 5/13-5/15 5/15-5/16 5/15/2016
Start Time 1:00 5/13/2016 0:00 18:22 23:53
Prev Run, hr 7.7 45 (<16.5) 12.2
Final H2S (Lead) 900 600 (200) 2000+ RX-1&3 solo
Final SO2 (Lead) 10 600 (1500) 300 RX-1&3 solo
Final H2S (Lag) 200 600 1900 RX-1&3 = 1000+
Final SO2 (Lag) 10 500 300 RX-1&3 = 1000+
REGENERATION
Pressure 5-10 5-8 7-25 6-8
Notes:
As can be seen in Table 11’s first data column, Reactor #1 saturated after 15.6 hours
using virgin catalyst. Although the reactor outlet concentrations of H2S and SO2 were not
directly measured, the outlet of the lag reactor was over 900 ppmv H2S, with an unclear amount
of SO2. Immediately after, the subsequent measurements of Reactor 2 when put into the lead
position showed a decreasing H2S concentration from several hundred to 140 ppmv H2S, thus
showing the need for a regeneration of the lead bed – in this case, Reactor #1.
Page 89
Final Report DE-FE0000896 16 February 2017
88
As can be seen in Table 11’s second data column, subsequent operation of Reactor #1 in
the lead position was successful. Because this was early in our data collection, the focus was on
the outlet of the lag reactor and sufficient inter-reactor data was not taken to prove how efficient
the regeneration was for the lead reactor. The second run through Reactor #1 saturated with
sulfur after 21.8 hours of operation. The increase in run time (vs. 15.6 hours in the virgin run) is
attributed to fluctuations in flow and H2S concentration in the feed gas, as well as imperfect
process control of SO2. As the overall quality of process control during that period of operation
actually decreased, one would expect net sulfur recovery to decrease as well, which is reflected
in an artificially extended run time. Ideally, we would have taken additional readings between
the reactors, as was done for data regarding Reactors #2 and #3. However, we were able to
measure Reactor #1 outlet concentrations while in the lag position (after a subsequent
regeneration), and they were below detectable limits (BDL) for H2S and 65 ppmv SO2. A
catalyst bed that was still saturated with sulfur would not be able to produce these levels of sulfur
species. That is, H2S and SO2 would have desorbed in much higher concentrations (several
hundred) based on subsequent observations during the pilot.
Reactor #1 was not reused in the lead position due to concerns about sulfation of the
catalyst from off-spec pilot operation. The other two reactors were not in the lead position of
service during this off-spec operation; thus, there was no concern about sulfation of those
reactors.
As can be seen in Table 11’s third data column, Reactor #2 saturated after 15.0 hours
using virgin catalyst. The outlet of Reactor #2 was 400-750 ppmv H2S and 1200 ppmv SO2
before saturation was declared. After regeneration at the conditions shown, Reactor #2 was
placed into the lead position and provided 20 ppmv H2S and 20 ppmv SO2 product, reflecting a
successful regeneration. That run lasted 7.7 hours. The decrease in performance is closer to
meeting our expectations compared to that of Reactor #1. The decrease in operating time before
saturation is believed to better reflect on-spec operation realized by improved process control in
both the BPSC unit (SO2 delivery) as well as upstream units (H2S fed to the BPSC unit).
Figure 69 shows Reactor #2 temperature profile during regeneration. The reactor flow
was top to bottom, which is reflected in the temperatures shown, with hotter temperatures at the
top of the beds at steady state.
Page 90
Final Report DE-FE0000896 16 February 2017
89
Figure 69. The graph shows good regeneration and different temperatures at various catalytic reactor
locations. Multiple temperature levels (once stabilized) show significant heat loss from the reactor vessel.
The last data column of Table 11 and several of those in Table 12 show “suspect data”
followed by a number. Because of the questionable nature of the data, it cannot be taken too
seriously. The Draeger apparatus in question had two needle valves in series fed to a gas-filled
glass bottle. The gas sample then flowed out of that glass bottle, past a check valve, and to a twin
glass bottle filled half-way with 10 wt% caustic. After bubbling through caustic, the gas sample
was passed through a color changing adsorbent (based on H2S and CO2 adsorbed) and then
discharged to the local atmosphere. Because the process gas was primarily CO2, sodium
carbonate was generated in the caustic bottle in sufficient quantities to plug the vapor path
through the liquid. Back pressure was generated sufficiently to cause wildly inaccurate
measurements as taken by the operator. After discovery, a subsequent measurement of H2S was
reduced from 6,000 ppmv to 200 ppmv. Thus, false readings for H2S were recorded; they were
too high by several fold.
A simultaneous error during the second test campaign resulted in SO2 readings being low
compared to the actual value. The samples from the middle reactor had significant quantities of
water, as the water had not yet been removed by the process. As the sample was cooled (so as
not to melt the plastic tubing associated with the Draeger apparatus), the water also condensed
and was eventually collected in the first glass bottle. In retrospect, nearly all of the SO2 was
condensed in this stream, causing an erroneously low measurement in the gas phase. After
Page 91
Final Report DE-FE0000896 16 February 2017
90
discovery (at the same time as the carbonate salts were discovered), the reading went from
30 ppmv SO2 to 1500 ppmv.
At that time, we were aware of a potential sulfating problem on the remaining beds of
catalyst. However, as mechanical difficulties began to resurface, we were unable to observe or
test the effects on proper regeneration before the conclusion of the second test campaign.
Looking at overall sulfur removal, the data in Table 13 were collected using Draeger
tubes from the second of two reactors operating in series. The dividing line represents a change
in the lead reactor and lag reactor.
Table 13. Near complete removal of sulfur in BPSC.
Date Time Feed Rx
Feed H2S
Prod H2S
Prod SO2
Notes
mole % mole % mole %
2-May 2300 1 1.1 0.0040 0.0010
3-May 100 1 1.2 0.0020 0.0030
300 1 1.3 0.0005 0.0050
500 1 1.0 0.0005 0.0110 Process upset seen in H2S inlet.
806 1 0.65 0.0002 0.0000
10-May 2300 2 1.3 0.0020 0.0060
11-May 1200 2 1.6 BDL 0.0150 H2S below detectable limits.
1500 3 0.9 BDL 0.0060 H2S below detectable limits.
1700 3 1.3 0.0010 0.0040
1900 3 1.3 0.0002 0.0010
2100 3 1.2 0.0002 0.0015
2300 3 1.4 0.0001 0.0010
12-May 300 3 0.5 0.0001 0.0015
500 3 1.5 0.0002 0.0020
700 3 1.5 0.0001 0.0025
12-May 1800 2 1.3 0.0050 0.0005 Reactor 2 on second use.
1900 2 1.1 0.0006 0.0010
2100 2 1.2 0.0005 0.0010
2300 2 1.2 0.0200 0.0010 Breakthrough in the bed or bad data (unclear).
Page 92
Final Report DE-FE0000896 16 February 2017
91
As can be seen from the data, each reactor set was able to achieve the stated DOE target
of 0.01 volume % (100 ppmv) H2S and was frequently much lower than thatsometimes below
the detectable limit (BDL) of 1 ppmv H2S.
Regarding the objectives of the BPSC skid:
A. Test overall recoveries of sulfur from the feed gas: This objective was met. On
multiple occasions, residual H2S levels (after passing through two catalytic reactor beds
in series) were below detectable limits (< 0.5 ppmv H2S) as measured by Draeger tubes.
Typical guarantee levels are expected to be between 4-100 ppmv for two reactors in
series.
B. Measure catalyst capacity for sulfur during high-pressure, sub-dewpoint operation:
This objective was partially met. Fresh catalyst capacity was measured at 15-22 hours of
operation before break-through at the given volumes. Multiple regenerations on the same
catalyst were difficult to obtain due to various mechanical problems within the unit and
within upstream units. Naturally, increased catalyst volumes would result in longer
periods before break-through. The measured saturation points were significantly longer
than expected and may have allowed for decreasing the required reactor volume, which
reduces capex. Increased catalyst volumes would result in longer periods before
saturation of the bed.
C. Evaluate catalyst capacity as it ages during operation (absorption and regeneration
cycles): This objective was only partially met. Again, multiple regenerations on the same
catalyst were difficult to obtain due to various mechanical problems within the unit and
within upstream units. However, each of two reactor beds was regenerated with
subsequent operation meeting specifications for several hours. This needs to be studied
further in the next stage of development.
D. Test different sulfur condenser design parameters: This objective was partially met.
Because of the various problems encountered, sulfur condenser design parameters were
not optimized. The data collected indicates that the values used in the pilot plant sulfur
condenser design are sufficient to move forward to the next phase, where they can be
optimized further.
Process Modelling
Description of the Selexol Process: A schematic of the Selexol process for CO2 and H2S
capture from syngas is shown in Figure 70. The system treats cooled syngas from a GE gasifier
after the sour shift so that the main species in the gas are CO2 and H2, and the minor species are
CO, CH4, H2S, Ar, N2, and H2O. Due to the relatively low efficiency of CO2 capture and the
need to achieve 90% carbon capture, the system requires a deep shift reaction to reduce the CO
concentration to below 1%. To achieve the low CO concentration, a large amount of high-
Page 93
Final Report DE-FE0000896 16 February 2017
92
pressure steam is injected upstream of the shift system and a few stages of shift reactors with
inter-cooling are required.
The syngas pressure entering the acid gas removal (AGR) is at about 750 psi and is
treated in a H2S absorber and then in a CO2 absorber. The H2S absorber captures a lot more CO2
than H2S. To improve the H2S/CO2 ratio of the solution and to make the stripped gas suitable for
Claus plant feed, the solution from the H2S absorber is first heated to an intermediate
temperature and sent to the H2S enrichment tower, where CO2 is stripped from the solution by
clean and treated syngas. After enrichment, the solution is sent to an H2S/CO2 stripper, and the
H2S-rich stream from the stripper is sent to the Claus plant. The Claus plant in the current system
is an oxygen-blown plant; the tail gas is compressed and sent to the Selexol absorber.
The CO2 is regenerated by a pressure swing in which the solution is flashed in a series of
steps to atmospheric pressure. The pressurized Selexol solution from the absorber is first flashed
from 770 psi to about 250-300 psi to strip and recover H2, CO, and CH4, which dissolve into the
solution in the absorber. The stripped gas from the first flash chamber contains 70-90% CO2, and
it is recompressed in compressor C1 and sent back to the process. The main stripping of the CO2
is accomplished in few flashing steps including (optionally) a below-atmospheric-pressure
stripping step to reduce the CO2 content of the solution and increase its net CO2 loading. The
CO2 gas from the flashing chambers is compressed to 2,200 psig for sequestration or for
enhanced oil recovery. The high compression ratio of the CO2 requires 5-6 compression stages
with inter-cooling.
The power required for the compressor when treating 1,000,000 lb/CO2 (compressor
stages C4-C7 in Figure 70 is estimated at 30-40 MWe, depending on the average pressure of the
stripped CO2). The power required to pump about 50,000 gpm Selexol solution (based on
absorbing the 1,000,000 lb/hr CO2 at net load of 40 g/L using pump P1 from atmospheric
pressure to 800 psi) is about 20 MWe. The pumps P2-P4 and the compressors C1-C3 add
significant power consumption to the process. In addition, chilling of the solution to 41°F is
required for removing H2S and CO2 to low concentration levels, and this requires additional
power consumption.
The H2S stripping is performed at low pressure and high temperature. Typically, 150 psig
steam is used for the stripping; heat consumption per lb of H2S is high due to the low
concentration of H2S in the feed solution to the stripper and the need to generate H2S-free
solution in order to achieve low H2S emissions in the syngas. Recent data obtained from an
operating Selexol plant show that the actual heat consumption of the H2s stripper is 8,500 btu/lb
of H2S stripped.
Page 94
Final Report DE-FE0000896 16 February 2017
93
[9]
[1]
[3]
[2]
[4] [5]
[8]
[12]
[13]
[14]
Syngas
Treated Syngas
H2S/CO2
CO2
[10]To H2S Enrichment
[10]
Treated Syngas
[11]
C1
C7
C2
P1
[6]
[7]
C4 C5 C6
C3
120psig steam
P2
P4
P3
CO2+H2S+Syngas
HP H2S/CO2
Absorber
HP CO2
Absorber
LP CO2 stripping
LP H2S stripping
H2S
Enrichment
Claus &
TGTO2
Sulfur
CO2/N2
Figure 70. Schematic of the Selexol process for 90% CO2 capture and sequestration at 2,200 psi; H2S
outlet is 10 ppm.
Page 95
Final Report DE-FE0000896 16 February 2017
94
Description of the AC-ABC Process. A schematic of the AC-ABC process for CO2 and
H2S capture from syngas is shown in Figure 71. The system treats cooled syngas from a GE
gasifier after the sour shift and cooling. The system is designed for > 99% CO2 capture and
complete H2S capture. Since practically all the CO2 is captured in the absorber and 90% capture
of carbon is required, the residual carbon (< 10%) can be in the form of CO in the clean syngas.
This translates to about 4% CO in the raw syngas (dry basis) from the water-gas shift reactor. As
a result, only a moderate shift is required, and significantly less steam is injected into the syngas
compared to the Selexol case. After the shift, the main species in the gas are CO2, CO, and H2,
and the minor species are CH4, H2S, Ar, N2, and H2O. The gas pressure is about 750 psi, and it is
sent to the AGR for CO2 and H2S capture. The simultaneous capture of CO2 and H2S
dramatically simplifies the process and significantly reduces its capital cost.
The absorber is a multistage vessel in which CO2 and H2S are captured by using a high-
concentration aqueous ammoniated solution. The top stage of the absorber is a polishing step in
which residual CO2, H2S, and ammonia vapor are captured in water and in the weak ammoniated
solution from the sour water stripper.
The CO2 and H2S are regenerated at elevated temperature and pressure; the CO2-rich
solution is first heated in a regenerative heat exchanger in a counter current flow with the CO2-
lean solution and is then sent to the stripper. A polishing stage at the top of the regenerator using
water from the sour water stripper for the gas wash ensures that the CO2/H2S gas stream is
practically ammonia free.
The heat source in the CO2/H2S stripper can be steam. Alternatively, the heat source can
be hot syngas, which can be used directly in the reboiler since the ammoniated solution does not
decompose at high temperature. In the reboiler, the syngas is cooled and a fraction of its water
condensed while boiling the CO2 and H2S from the rich solution. Significant energy efficiency
and capital cost advantages can be achieved by using hot syngas as the source of heat in the
process compared to using hot syngas to generate steam in a boiler and heat the reboiler. For the
purpose of this study, intermediate pressure (IP) steam was used to regenerate the rich solution.
The higher the reboiler temperature, the higher the regenerator pressure, the resultant CO2
pressure, and the lean solution pressure can be. Higher CO2 pressure results in a much lower CO2
compressor power, and higher lean solution pressure results in lower pumping power for
pumping the lean solution to the absorber.
The CO2/H2S gas from the stripper is sent to a BPSC system. The BPSC is a low-cost and
simple process for in-situ reduction of H2S to elemental sulfur at high gas pressure. Oxygen is
used to convert sulfur to SO2 and then, through the classical Claus reaction, to convert the H2S to
Page 96
Final Report DE-FE0000896 16 February 2017
95
sulfur. The clean CO2 gas stream from the BPSC is compressed from 300 to 750 psi to
2,200 psig for sequestration or for enhanced oil recovery. The compression of the CO2 requires
1-2 compression stages with inter-cooling.
The power required for the compressor when treating 1,000,000 lb/CO2, (compressor
stages C1-C2 in Figure 14) is estimated at 15-20 MWe for CO2 stripped at 300-750 psi. The
power required to pump ~ 17,000 gpm lean solution (based on absorbing the 1,000,000 lb/hr CO2
at net load of 120 g/lit) using pump P1 from 300-750 psi to 800 psi is in the range of 2-4 MWe.
There is no need for refrigeration, since there is efficient removal of H2S and CO2 such that low
concentrations of these gases are achieved at ambient temperature conditions.
[6]
[3]
Treated Syngas
CO2
C2[4]
[5]
C1
[7]
[9]
[8]
Heat Source
P1
HP CO2/H2S
Absorber
HP CO2/H2S
stripping
BPSC
O2 Sulfur
Heat Source
Syngas
Sour water
Stripper
Figure 71. Schematic of the AC-ABC process for 90% CO2 capture and sequestration at 2,200 psi; the
emissions at the H2S outlet are 10 ppm.
Page 97
Final Report DE-FE0000896 16 February 2017
96
Power for CO2 Compression: About 500 st/h of CO2 is captured in the CO2 absorber.
The CO2 is stripped from the solution in the CO2 stripper. The CO2 must be delivered at a
pressure of 2,215 psia for sequestration or for enhanced oil recovery and is compressed from the
stripper outlet pressure using a multistage CO2 compressor with inter-cooling between each
stage. The power required for the CO2 compression as a function of the compressor inlet pressure
and assuming 84% compression efficiency (DOE estimate for future highly efficient compressor)
and inter-cooling to 130°F is shown in Figure 72.
Figure 72. CO2 compressor power for compression of 500 st/h of CO2 to 2,215 psia.
As shown in Figure 72, stripping the CO2 at atmospheric pressure results in power
consumption of 60 MWe and requires a 5-stage compressor with very large first stage and an
inlet of about 250,000 NM3/hr of CO2 at atmospheric pressure. Stripping the CO2 gas at 300 psi
pressure requires a two-stage compressor and results in a 20-MWe power consumption.
Stripping the CO2 gas at 750 psi requires only a one-stage compressor and results in 10 MWe of
power consumption.
In most commercial operating Selexol systems, the CO2 is stripped from the solution in a
few stages with average pressures in the range of 15-50 psi. The Coffeeville Selexol plant
generates 1/6 of its total CO2 at 150 psia, and the balance is vented to the atmosphere at about
20 psia, which is an average of slightly over 40 psia. However, the higher pressure CO2 stream
contains as much as 2-5% H2 and as much as 0.5% CO and CH4, which represents losses from
the plant and requires purification of the CO2 via oxidation step.
0
10
20
30
40
50
60
0 100 200 300 400 500 600 700 800
Po
we
r C
on
sum
pti
on
, MW
e
Compressor Inlet Pressure, psi
CO2 Compressor Power, Pf=2215psi
500 st/h of CO2, intercooling to 130F, Pressure ratio<3
Page 98
Final Report DE-FE0000896 16 February 2017
97
It can be concluded from Figure 72 that power consumption for CO2 compression in the
Selexol process is 45-60 MWe, while the CO2 compression power in the AC-ABC process is
significantly lower. In addition, multistage compressors need a significant amount of water for
inter-stage cooling.
Power for Pumping Solution between CO2 Absorber and CO2 Stripper: The
500 st/hr of CO2 captured in the absorber is transferred to the CO2 stripper in a CO2-rich solution.
The returning lean solution has to be pumped from the pressure of the CO2 stripper to that of the
absorber, and the power required is a function of the flow rate and of the pressure increase across
the pump.
The flow rate is determined by the net CO2 loading of the solution, which depends on
many optimization considerations. Typical net CO2 loading for the Selexol process is 40-50 gm
per liter, requiring 40,000 to 50,000 gpm of solution to be pumped around the system. Typical
net CO2 loading for the AC-ABC is 120-150 gm per liter, requiring 13,500 to17,000 gpm of
solution to be pumped around the system. The power required for pumping is shown in
Figure 73.
Figure 73. Pump power for pumping lean solution to the CO2 absorber as a function of the CO2 stripper
operating pressure (pump feed pressure).
In the Selexol process, the last stage of the CO2 release is at atmospheric pressure,
requiring 15 MWe and 19 MWe of electric power to pump the lean solution back to the absorber
0
2
4
6
8
10
12
14
16
18
20
0 100 200 300 400 500 600 700 800
pu
mp
Po
we
r, M
We
pump feed pressure, psi
Lean Solution Pump Power vs. Feed Pressure
AC-ABC 12% AC-ABC 15% Selexol 4% Selexol 5%
Page 99
Final Report DE-FE0000896 16 February 2017
98
when the net CO2 loadings are 5% and 4%, respectively. In the AC-ABC process, the CO2
stripper operates in the range of 300 to 750 psi, and pumping power is about 4 MWe at the low-
pressure range and less than 1 MWe at the high end of the pressure range.
Steam Consumption for the Shift Reaction: The Selexol and the AC-ABC processes
are designed for an overall removal of 90% of the carbon input so that the carbon content of the
CO2 in the turbine flue gas is 10% of the carbon content of the coal input to the gasifier.
In the Selexol process, CO2 capture efficiency is limited to 90-95%, and higher efficiency
requires refrigerating the top of the absorber at high cost, operating the last stage of CO2 flash at
negative pressure, and utilizing a high rate of solution recycle between the absorber and stripper,
i.e., low CO2 loading and high pumping cost. To comply with the requirements for 90% capture
of carbon, the system has to be installed with deep shift to reduce CO concentration in the syngas
to below 1% and increase the CO2 concentration of the gas. This deep shift requires steam
injection to the syngas upstream of the shift reactors and multiples of shift reactors with inter-
cooling.
The steam injected to the syngas has to be at a pressure above the syngas pressure and is
high-quality steam. In the current study, the injected steam is at a temperature of 615F and
875 psia. A total of about 240,000 lb/hr of steam is required. While a portion of the heat content
of the steam is recovered in the form of lower-pressure steam, the energy loss and reduction in
the plant efficiency amounts to a loss of about 15 MWe in steam turbine power production.
The AC-ABC process is designed to capture practically all the CO2 in the gas stream with
minimal additional cost relative to 90-95% capture efficiency. In addition, the use of the BPSC
for the H2S capture results in no CO2 venting from the system. As a result of the high efficiency
of CO2 capture, almost 10% of the carbon in the syngas can be fed to the gas turbine as CO. This
means that the CO content of the syngas can be about 4%. Achieving the limited CO shift
conversion to CO2 requires no steam injection to the syngas and additional production of about
5 MWe power in the steam turbine relative to the Selexol deep-shift case. The limited shift also
results in significant cost savings.
Effect of Steam Quality and Consumption Rate on Steam Turbine Power: The
operating pressure of CO2 depends mainly on the reboiler temperature. When steam is used in
the reboiler, the entire heat input is at the top required temperature.
The heat source temperature required to achieve the stripping of CO2 pressure in the
range of 100-700 psi to generate lean solution containing CO2/NH3= 0.35 mole ratio based on
vapor-liquid equilibrium (VLE) models and experiments conducted at SRI is given in Figure 74.
Page 100
Final Report DE-FE0000896 16 February 2017
99
It takes only a 276°F heat source (steam at 50 psia pressure) to generate the CO2 at 100 psi, a
314°F heat source (steam at 85 psia pressure) to generate the CO2 at 300 psi, and a 350°F heat
source (steam at 140 psia pressure) to generate the CO2 at 700 psia.
There is no thermal degradation of the solution, and the high-temperature heat
sourcesuch as hot syngas or hot combustion gas from a coal-fired boiler or from a gas turbine
exhaustcan be used directly in the reboiler. When syngas is used as the heat source in the
reboiler, an innovative design for boiling CO2 from ammoniated solutions requires that only the
top temperature is as shown in Figure 74. As a result, a very efficient and effective utilization of
the heat content of the syngas can be applied.
Figure 74. Saturated steam temperature required for the stripping of CO2.
Steam Consumption for H2S stripping: About 12,500 lb/hr of H2S is captured in the
process. The stripping of the H2S in the H2S stripper in the Selexol process is energy intensive
and requires 8,500 btu/lb of H2S stripped (together with CO2) using 150 psia steam. It amounts to
more than 100 MMbtu/hr of MP steam use in the H2S reboiler and significant loss of power
production in the steam turbine.
The AC-ABC process has no separate stripper for the H2S. Rather, the H2S is stripped
together with the CO2 in the CO2/H2S stripper. The marginal heat consumption for the H2S
stripping is 1,100 btu/lb and a total of less than 14 MMbtu/hr.
0
100
200
300
400
500
600
700
800
260 270 280 290 300 310 320 330 340 350 360
CO
2 S
trip
pe
r, p
sia
Top reboiler heat source, F
CO2 Stripper pressure vs. Top heat temp
SRI VLE Data + 10F
Page 101
Final Report DE-FE0000896 16 February 2017
100
SRI used the Aspen Plus Model in combination with GT Pro to evaluate the power loss
due to the use of steam and additional heat extraction from the process and to calculate total
power production and efficiency. The results are summarized in Table 14.
Table 14. Net power output and relative efficiency in CO2 capture.
Net Power, MWe Relative Efficiency, %
Base case - no capture 622.05 100
Selexol capture 543.25 87.3
AC-ABC with limited shift and BPSC 551.63 88.7
Page 102
Final Report DE-FE0000896 16 February 2017
101
TECHNO-ECONOMIC ANALYSIS OF AC-ABC PROCESS: SUMMARY
Tables 15 and 16 summarize the costs of CO2 capture from coal-fired power plants using
the AC-ABC process. Case B5A from (NETL 2015), a non-capture IGCC plant with a GE
gasifier, is used as the reference case. The CO2 capture costs using the AC-ABC process are
compared to the costs of using a dual-stage Selexol process (Case B5B from Ref. 1). CO2 capture
costs are 25-32% lower using the AC-ABC process than the Selexol process, and the capital
costs required to implement the AC-ABC process are 48% lower than the Selexol capital costs.
Table 15. CO2 capture costs compared to IGCC base case (Case B5A).
Power Plant Inputs DOE Case B5A: Baseline GEE IGCC- No Capture
DOE Case B5B: Selexol Capture
AC-ABC CO2 & H2S Capture
Heat Rate (BTU/kWh) 8,756 10,458 10,299
Gross Power, kWe 747,800 734,000 714,173
Net Power, kWe 622,050 543,250 551,634
Total Overnight Cost ($/net-kW) $3,036 $4,195 $3,701
An
nu
al
Ou
tpu
t at
10
0%
Cap
acit
y
Fact
or
Net Power (GWH/year) 5,449 4,759 4,832
CO2 Captured (million metric tons per year) - 4.0 4.0
Cost of Electricity
CO
E ($
/MW
h)
Power Plant Capital 53.7 74.3 65.6
Power Plant Fuel 25.8 30.8 30.3
Power Plant O&M 23.1 30.5 28.7
CO2 Transport, Storage, and Monitoring - 9.2 9.2
Total 102.6 144.8 133.7
COE (% Increase) 41.2% 30.4%
Avoided Cost (cost of CO2 capture, $/metric ton) $50.21 $37.89
Cost of CO2 Captured, $/metric ton $39.26 $26.71
Table 16. Capital cost comparison to IGCC base case (Case B5A).
Capital Cost, 2011 (x $1,000)
DOE Case B5A: Baseline GEE IGCC- No Capture
DOE Case B5B: Selexol Capture
AC-ABC CO2 & H2S Capture
Selexol $251,145
SRI AGR $121,104
CO2 Compression $84,088 $17,212
Water-Gas Shift Reactors $21,370 $17,981
Claus $40,699
Pressure Swing Claus $49,615
Subtotal (WGS, AGR, H2S Conversion, and CO2 Compression steps only)
$397,302 $205,912
Total Overnight Cost (TOC) of Complete IGCC Plant
$1,888,393 $2,278,752 $2,041,739
Page 103
Final Report DE-FE0000896 16 February 2017
102
IGCC REFERENCE CASE
Capturing CO2 from coal-fired power plants is a critical step in carbon sequestration. In
the IGCC process, coal is reacted with steam and O2 under pressure in the range of 300 to
1,000 psi to form a fuel gas containing mainly CO, H2, H2S, CO2, and residual steam. The CO in
the gas stream is converted to CO2 and H2 by using the water-gas shift reaction at about 200 to
285C. The gas stream leaving the water-gas shift reactor (WGSR) contains mainly H2, CO2,
H2S, and H2O. An H2-rich fuel gas suitable for combustion in a gas turbine is produced by
condensing the steam and removing the CO2 and H2S. The current “best-case” option for carbon
capture is using a liquid solvent such as Selexol or Rectisol to absorb CO2 and H2S at elevated
pressures.
Case B5B of the DOE/NETL report “Cost and Performance Baseline for Fossil Energy
Plants, Volume 1b: Bituminous Coal (IGCC) to Electricity,” Revision 2b, July 2015, was used as
a reference case for this analysis (NETL 2015). Case B5B was an IGCC plant with a GE gasifier
and CO2 and H2S capture using a dual-stage Selexol process and production of elemental sulfur
from H2S using the Claus process. A block flow diagram of this process is shown below.
Page 104
Final Report DE-FE0000896 16 February 2017
103
Figure 75. Case B5B block flow diagram.
GAS
TURBINE
COMBUSTOR
TURBINE COOLING AIR
QUENCH AND
SYNGAS
SCRUBBER
GAS COOLING
BFW HEATING
& KNOCKOUT
SHIFT
REACTORS
ELEVATED
PRESSURE
ASU
GEE GASIFIER
SECTION
(RADIANT
COOLER)
SOUR
WATER
STRIPPER
MERCURY
REMOVAL
DUAL
STAGE
SELEXOL
UNIT
CLAUS
PLANT
HRSG
AMBIENT AIR
SYNGAS
EXPANDER
HYDROGENATION
REACTOR AND GAS
COOLER
CO2
COMPRESSION
1
5
9
10
11
12 13 14
16
18
19
20
17
6 8
2 3
4
21
22 23
AIR TO ASU
AS-RECEIVED
COAL
SLAG
SHIFT
STEAM
WATER RECYCLE
TO PROCESS
DEMAND
NOTE: WATER FROM TAIL
GAS COOLER MODELED,
BUT NOT SHOWN
NITROGEN DILUENT
SYNGAS
CLEAN
GAS
CO2
STREAMS
CO2
PRODUCT
SULFUR
TAIL GAS
RECYCLE TO
SELEXOL
NOTE: TAIL GAS BOOST
COMPRESSOR MODELED,
BUT NOT SHOWN
FLUE GAS
STACK GAS
VENT GAS
CLAUS
PLANT
OXIDANT
2X ADVANCED
F CLASS
GAS TURBINE
SYNGAS
H/P
REHEAT
15
CLAUS
PLANT
OXIDANT
STEAM
TURBINE
24263.5 MWe
6.5 MWe
464 MWe
Note: Block Flow Diagram is not
intended to represent a complete
material balance. Only major process
streams and equipment are shown.
20
TAIL GAS
RECYCLE FROM
CLAUS PLANT
SLURRY
MIXER
7SLURRY
WATER
Page 105
Final Report DE-FE0000896 16 February 2017
104
IGCC CASE WITH AC-ABC CO2 AND H2S CAPTURE
The AC-ABC process for capture of CO2 and H2S in the pre-combustion gas stream
offers many advantages over other solvent-based technologies. The process relies on the simple
chemistry of the NH3-CO2-H2O-H2S system and on the ability of the aqueous ammoniated
solution to absorb CO2 at near ambient temperatures and to release it as a high-pressure gas at a
moderately elevated temperature. The AC-ABC process exhibits several advantages over the
Selexol process in the IGCC application, which are listed below. These advantages have been
validated by several hundred hours of pilot-scale testing at the NCCC in Wilsonville, AL.
The AC-ABC process exhibits CO2 capture efficiencies greater than 99%.
CO2 and H2S stripping can be accomplished at elevated pressures, greatly reducing the
costs required to compress the exiting CO2 stream to pipeline pressure. H2S recovery
from the regenerated gas stream is accomplished with the BPSC process, which allows
the CO2 stream to remain at elevated pressure.
The solubility of fuel gases such as H2, CO, and CH4 in the aqueous ammoniated
solutions is very low, which eliminates the need for a flash step to recover these gases
from the solution.
The low solubility of the fuel gases and the high efficiency of CO2 absorption allow the
overall target of 90% carbon capture to be achieved without needing to convert all of the
CO in the syngas to CO2. Allowing lower conversion in the water-gas shift reactors
eliminates the need to add steam to the unshifted syngas, which preserves more of the
steam for power generation. It has been confirmed with shift catalyst vendors Johnson-
Matthey and Haldor-Topsoe that the shift reactions can theoretically be run at such a low
conversion, though the efficacy of this has yet to be tested at large scale.
The capital cost of the AC-ABC process can be significantly lowered in comparison to
the Selexol process due to: (i) absorption of the H2S and the CO2 in the same absorber
vessel, resulting in the elimination of a separate H2S absorber vessel and its auxiliary
equipment; (ii) elimination of H2S enrichment vessel and clean gas stripping compressor;
(iii) smaller shift reactors for achieving reduced level of water gas shift reaction; (iv) the
stripping of the H2S together with the CO2, which eliminates the need for a separate H2S
stripper and its auxiliary equipment; and (v) a much smaller CO2 compressor.
The parasitic electric power consumption is low for the AC-ABC process because the
CO2 is stripped at elevated pressures, high CO2 loadings can be attained in the solution,
and the absorber and stripper can be operated at nearly the same pressure. Capital costs
for pumps and compressors are reduced as well.
The AC-ABC steam consumption to strip the H2S is a small fraction of the heat
consumption of the Selexol process for H2S stripping. In addition, recovering some heat
from the hot syngas, either directly or using IP steam as an intermediary to be used as a
heat source for CO2/H2S stripping, reduces the steam usage and thus the power output
penalty.
Page 106
Final Report DE-FE0000896 16 February 2017
105
A block flow diagram for the GEE IGCC process using AC-ABC instead of Selexol is shown
below.
Figure 76. GEE IGCC block flow diagram with AC-ABC and BPSC.
The IGCC plant with AC-ABC was modeled in Aspen Plus, version 8.8. Figure 76 shows
the process flow diagram and stream compositions; properties for the major streams within the
IGCC plant are provided in Table 17. The Peng-Robinson property method was used for most of
the IGCC plant, with the exception of the steam turbines and heat recovery steam generator
(HRSG) power, which were modeled with the STEAM-NBS property method as in the DOE
base cases. The AC-ABC process was modeled with the OLI Systems (OLI) property method,
which better accounts for an aqueous electrolyte system such as the NH3- CO2- H2S -H2O system
that is the basis of the AC-ABC CO2/ H2S capture method. Using the OLI property method
requires the purchase of the OLI Engine for Aspen Plus. The most recent version of OLI,
Version 9.2, was used in this analysis. The power island was modeled in GT-PRO.
Page 107
Final Report DE-FE0000896 16 February 2017
106
Table 17. Stream tables: GEE IGCC with AC-ABC and BPSC.
1 2 3 4 5 6 7 8 9 10 11 Temperature F 59 70 90 385 90 60 410 2400 410 0 450
Pressure psia 14.4 16.4 145 450 125 14.4 797.7 814.7 797.7 0 770
Enthalpy Btu/lb -81.74 -76.29 0.024 93.99 1.14 0 0 -1884.62 -4281.33 0 -4523.86
Density lb/cuft 0.075 0.101 0.791 1.393 0.682 0 0 0.537 1.697 0 1.563
Mole Flow scfm 397976 15262 1677 276461 80117 0 0 322718 416857 0 416857
V-L Mass Flow lb/hr 1815330 64658 8531 1226680 407652 0 0 1041360 1308800 0 1308800
Solids Mass Flow lb/hr
0 0 0 0 0 487005 53457 0 0 0 0
V-L Mole Fraction
Ar 0.009 0.024 0.029 0.002 0.032 0 0 0.008 0.006 0 0.006
CH4 0 0 0 0 0 0 0 992 PPM 768 PPM 0 768 PPM
CO 0 0 0 0 0 0 0 0.344 0.266 0 0.038
CO2 295 PPM 0.008 0 0 0 0 0 0.152 0.117 0 0.345
COS 0 0 0 0 0 0 0 188 PPM 146 PPM 0 38 PPM
H2 0 0 0 0 0 0 0 0.335 0.26 0 0.488
H2O 0.011 0.249 0 0 0 0 0 0.142 0.337 0 0.108
HCl 0 0 0 0 0 0 0 0 0 0 0
H2S 0 0 0 0 0 0 0 0.007 0.006 0 0.006
N2 0.772 0.503 0.011 0.992 0.018 0 0 0.009 0.007 0 0.007
NH3 0 0 0 0 0 0 0 0.002 0.001 0 0.001
O2 0.208 0.217 0.96 0.005 0.95 0 0 trace trace 0 trace
SO2 0 0 0 0 0 0 0 0 0 0 0
12 13 14 15 16 17 18 19 20 21 22 Temperature F 73 95 72.6 311.3 176 601.1 328.1 246.6 59 1053.1 270
Pressure psia 745 740 739.7 460 364.7 356.2 356.2 2215 14.7 15.24 15.24
Enthalpy Btu/lb -3985.64 -3985.64 -127.04 -67.19 -3888.32 3.72 -3904.20 -3860.63 -317.26 -
1854.91
-1854.91
Density lb/cuft 2.621 2.568 0.602 0.255 2.312 6.02 1.801 17.744 0.076 0.026 0.026
Mole Flow scfm 372000 372000 224772 224772 150343 398 151353 144890 1544750 1936640 1936640
V-L Mass Flow lb/hr 1181050 1181050 165097 165097 1024820 12102 1023120 1004710 7046210 8437990 8437990
Solids Mass Flow lb/hr
0 0 0 0 0 0 0 0 0 0 0
V-L Mole Fraction
Ar 0.007 0.007 0.011 0.011 51 PPM 0 370 PPM 386 PPM 0.009 0.009 0.009
CH4 861 PPM 861 PPM 0.001 0.001 6 PPM 0 6 PPM 7 PPM 0 0 0
CO 0.042 0.042 0.07 0.07 209 PPM 0 0 0 0 0 0
CO2 0.387 0.387 64 PPM 64 PPM 0.957 0 0.952 0.995 295 PPM 0.009 0.009
COS 43 PPM 43 PPM 70 PPM 70 PPM 211 PPB 0 10 PPB 11 PPB 0 0 0
H2 0.547 0.547 0.903 0.903 0.003 0 0.003 0.003 0 0 0
H2O 0.001 0.001 0.001 0.001 0.022 0 0.043 0 0.011 0.114 0.114
HCl 0 0 0 0 0 0 0 0 0 0 0
H2S 0.006 0.006 856
PPB
856 PPB 0.016 0 5 PPM 6 PPM 0 0 0
N2 0.008 0.008 0.013 0.013 19 PPM 0 0.002 0.002 0.772 0.759 0.759
NH3 837 PPM 837 PPM 15 PPM 15 PPM 0.002 0 45 PPM 47 PPM 0 2 PPM 2 PPM
O2 trace trace trace trace 0 0 0 0 0.208 0.11 0.11
SO2 0 0 0 0 0 0 25 PPM 26 PPM 0 8 PPM 8 PPM
Page 108
Final Report DE-FE0000896 16 February 2017
107
COST ESTIMATING METHODOLOGY AND ASSUMPTIONS
General Site Assumptions
Site characteristics: Same as in (NETL 2015): Greenfield, Midwestern USA.
Coal: Same as in (NETL 2015): Illinois No. 6 coal with a cost of $2.78/GJ or
$2.94/MMBtu.
Emissions: The IGCC case with AC-ABC CO2/H2S capture meets all emissions limits
described in the baseline IGCC cases in (NETL 2015) (PM, SO2, NOx, mercury).
CO2 captured/avoided costs: Calculated using the below equations from ( NETL 2015).
Capacity factor: Same as in (NETL 2015) for IGCC cases: 80%.
Raw water withdrawal and consumption: Same as in (NETL 2015).
Capital Cost Calculations and Assumptions
Bare erected cost (BEC), total plant cost (TPC), and total overnight cost (TOC) were
calculated as “overnight” costs and expressed in 2011 dollars. For the purposes of our
comparison, it was not necessary to calculate a total as-spent cost (TASC). The BEC includes
process equipment, supporting facilities, and both direct and indirect labor. The TPC includes
BEC plus the engineering, construction, & contractor’s fee (EPC), process contingency, and
project contingency. The TOC includes TPC plus preproduction costs, inventory capital,
financing costs, and other owner’s costs.
Summary of BEC, TPC, and TOC Calculations
The TPC for sections of the process other than CO2/ H2S capture was assumed to be the
same as in Case B5B of (NETL 2015). Two exceptions to this were: (1) the water-gas shift
reactors, whose costs were scaled back based on the decreased capacity requirement since no
added steam is present; and (2) the CO2 compression and drying costs, which were scaled back
based on the decreased compression power requirement due to regenerating CO2 at high
pressure. To account for the capital costs of the CO2/ H2S capture processes, the capital costs
related to the dual-stage Selexol process and the elemental sulfur plant in the DOE Case B5B
were deleted (at the TPC level) and replaced by the TPC of the AC-ABC system and the BPSC
system. The TPC estimates for AC-ABC were generated by: (1) simulating the full AC-ABC
Page 109
Final Report DE-FE0000896 16 February 2017
108
process in Aspen Plus; (2) using the stream flows, column sizes, equipment power, and heat
transfer requirements calculated by Aspen to size the process equipment; (3) costing the
equipment based on correlations from Peters et al. 2013 and Towler et el. 2013; (4) using the
delivered-equipment ratio factor method from Peters, et el. 2013, to calculate the BEC from the
delivered equipment cost; and (5) using factors from (NETL 2015) for the EPC, process
contingency, and project contingency to calculate the TPC from the BEC. The factors from
Peters et al. 2013 and (NETL 2015) are shown in Table 18 below.
Table 18. Factors for calculating BEC and TPC from delivered equipment cost.
Factors included in BEC Percent of delivered equipment cost for fluid processing plant
Purchased equipment delivered 100 Purchased-equipment installation 47 Instrumentation and controls (installed) 36 Piping (installed) 68 Electrical systems (installed) 11 Buildings (including services) 18 Yard improvements 10 Service facilities (installed) 70
Total direct plant cost (bare erected cost) 3.6 x delivered equipment cost
Factors included in TPC Percent of delivered equipment cost for fluid processing plant
Engineering, construction, & contractor’s fee (EPC) 10 Contingency (process) 20 Contingency (project) 30% of the sum of delivered equipment cost,
process contingency and EPC fees
Total indirect plant cost Project contingency + process contingency + EPC fees
Fixed Capital Investment (Total Plant Cost) TPC = BEC plus total indirect plant cost
Other Capital Cost Assumptions
Plant maturity, contracting strategy, and estimate scope: Same as in (NETL 2015).
Exclusions: Same as in (NETL 2015): taxes (except payroll and property), site-specific
considerations, labor incentives in excess of 5-10%, and additional EPC premiums are
excluded from the capital cost estimate.
Process contingency: Same as (NETL 2015) for Selexol IGCC case: 20%. This 20%
value is reasonable based on the Association for the Advancement of Cost Engineering
(AACE) guidelines for process contingency, which recommend 20-35% for technologies
with small pilot-plant data.
Project contingency: The guideline for project contingency given in (NETL 2015) was
15-30% of the sum of BEC, EPC fees, and process contingency; 20% was used here.
Owner’s costs and TASC/TOC ratio: Same as in (NETL 2015), Case B5B.
Capital charge factor: Same as in (NETL 2015): a first-year capital charge factor of
0.1243 was assumed.
Page 110
Final Report DE-FE0000896 16 February 2017
109
Based on the above assumptions, the TPC for the IGCC plant with AC-ABC and BPSC
CO2/H2S capture was calculated and compared to the Selexol case (Case B5B). Results are
summarized in Table 19. Detailed equipment costs are provided in Appendix A.
Table 19. Difference in Selexol and AC-ABC total plant cost.
Item from DOE Case B5B Cost Details: (All Costs in $ x 1000)
DOE Cost* Action Cost with AC/ABC-BPSC
5A.1 Double-Stage Selexol $251,145 Delete All $0
5A.2 Elemental Sulfur Plant $40,699 Delete All $0
5A.4 Shift Reactors $21,370 Reduce by 13.3% $17,981
5B.2 CO2 Compression and Drying $84,088 Reduce $17,212
New.1 AC/ABC System single stage Add $121,104
New.2 BPSC System Add $49,615
Sub-totals $397,302 $205,912
Total Plant Cost * $1,840,115 $1,648,725
Delta $191,390
% Cost Reduction: 10.40% *DOE Costs from “Cost and Performance Baseline for Fossil Energy Plants, Volume 1b: Bituminous Coal
(IGCC) to Electricity,” Revision 2b. DOE/NETL, July 2015. Does not include owner's costs, financing costs, and
TASC multiplier.
Operations and Maintenance Cost Calculations and Assumptions
Operating labor: Total operating labor requirements and costs are assumed to be the
same as in DOE Case B5B.
Maintenance material and labor: Labor costs are assumed to be the same as in DOE
Case B5B. Maintenance material costs were scaled from Case B5B based on the capital
cost.
Consumables: Consumables not related to CO2/H2S removal were scaled based on flow-
rate differences from DOE Case B5B. Consumables for CO2/H2S removal were
calculated based on the Aspen Plus and GT Pro simulation results. Since an oxygen-
blown Claus plant was used in the base case, the oxygen stream required for the BPSC
sulfur recovery process (which replaces the Claus plant) was assumed to have no
additional cost.
Waste disposal: Waste disposal not related to CO2/H2S removal was scaled based on
flow-rate differences from DOE Case B5B. No additional waste disposal costs were
incurred from the AC-ABC process.
Co-products and by-products: Same as in (NETL 2015). No credit was taken for any
potential salable value of byproducts such as sulfur.
Page 111
Final Report DE-FE0000896 16 February 2017
110
CO2 transport, storage, and monitoring (TS&M): Same as in (NETL 2015), Case
B5B.
AC-ABC PROCESS DETAILS AND ASSUMPTIONS
AC-ABC Process Details
A schematic of the AC-ABC process for CO2 and H2S capture from syngas is shown in
Figure 77. Stream tables from the Aspen simulation of the AC-ABC process are provided in
Table 20. The system treats cooled syngas from a GE gasifier after the sour water-gas shift
reactors. The system is designed for 99+% CO2 capture and near-complete H2S capture. Since
practically all of the CO2 in the shifted syngas is captured in the absorber and 90% capture of
carbon is required to meet the DOE target, the residual 10% carbon can be in the form of CO that
is not converted in the shift reactors. This translates to about 4% CO in the syngas (dry basis).
No additional steam needs to be injected into the syngas if the CO does not need to be
completely converted ("shallow shift"). After the shift, the main species in the syngas are CO2,
CO, and H2 and the minor species are CH4, H2S, Ar, N2, and H2O. The gas pressure is about
750 psi, and it is sent to the AGR for CO2 and H2S capture. The AC-ABC process allows
simultaneous capture of the CO2 and H2S in a single absorber vessel and regeneration of the CO2
and H2S in a regenerator vessel operating at high pressure.
The absorber is a multistage vessel in which the bulk of CO2 and H2S are captured at the
bottom stages using high-concentration (6-12 molal) ammoniated solution from the high-
pressure CO2/H2S regenerator. Following the absorber is a water-wash step in which residual
ammonia vapor is captured and sent to a sour-water stripper for recovery. The following
reversible aqueous phase reactions occur between NH3, CO2, and H2S in the absorber:
NH4OH + CO2 ↔ NH4HCO3 (1)
2 NH3 + CO2 ↔ NH4(NH2CO2) (2)
(NH4) 2CO3 + CO2 + H2O ↔ 2 NH4HCO3 (3)
NH4(NH2CO2) + H2O ↔ (NH4) 2CO3 (4)
2 NH4OH + H2S ↔ 2 NH4HS + H2O (5)
(NH4) 2CO3 + H2S ↔ NH4HS + NH4HCO3 (6)
The CO2 and H2S regeneration is performed at elevated temperature and pressure; the
CO2-rich solution is first heated in a regenerative heat exchanger in counter current flow with the
CO2-lean solution and is then sent to the stripper. The reactions listed above proceed in reverse
Page 112
Final Report DE-FE0000896 16 February 2017
111
order in the regenerator. A polishing water-wash stage at the top of the regenerator ensures that
the CO2/H2S gas stream is free of ammonia (< 10 ppm).
The heat of reaction for CO2, which depends on temperature, molality, and the CO2/NH3
loading, is in the range of 300-700 Btu/lb CO2. The heat of reaction for H2S is in the range 800-
1,100 Btu/lb H2S. The heat source in the CO2/H2S stripper can be steam. Alternatively, the heat
source could be hot syngas, which can be cooled and a fraction of its water condensed while
boiling CO2 and H2S from the rich solution in the reboiler.
The higher the reboiler temperature, the higher the regenerator pressure and the resultant
CO2 pressure and the lean solution pressure. Higher CO2 pressure results in a much lower CO2
compressor power, and higher lean solution pressure results in lower power for pumping the lean
solution to the absorber. However, steam usage in the reboiler is greater.
The CO2/H2S gas from the stripper is sent to a BPSC system. The BPSC is a low-cost and
simple process for in-situ reduction of H2S to elemental sulfur at high gas pressure. Oxygen is
used to convert sulfur to SO2 and then through the classical Claus reaction to convert the H2S to
sulfur. The clean CO2 gas stream from the BPSC is compressed from 300 to 750 psi to
2,200 psig for sequestration or for enhanced oil recovery. The compression of the CO2 requires
only one or two compression stages with inter-cooling.
Page 113
Final Report DE-FE0000896 16 February 2017
112
AC-ABC Process Block Flow Diagram and Stream Tables
Figure 77. AC-ABC block flow diagram.
Page 114
Final Report DE-FE0000896 16 February 2017
113
Table 20. AC-ABC process stream tables.
A1 A2 A3 A4 A5 A6
Temperature F 98.6 85 159.6 250.9 159.6 85
Pressure psia 740 739.7 741.7 727.7 741.7 357.7
Enthalpy Btu/lb -3981.1 -43413 -47459.2 -42531.4 -4081.5 -43375
Density lb/cuft 2.50 68.40 69.49 38.66 69.49 68.38
Mole Flow lbmol/h 58814 375813 399046 364728 34318 375403
V-L Mass Flow lb/hr 1181050 7143800 8157680 7456120 701561 7137970
Solids Mass Flow lb/hr
V-L Mole Fraction
Ar 0.007 0 3 PPM 3 PPM 3 PPM trace
CH4 867 PPM 0 330 PPB 330 PPB 330 PPB trace
CO 0.043 0 14 PPM 14 PPM 14 PPM trace
CO2 0.387 0.042 0.097 0.097 0.097 0.042
COS 43 PPM 0 14 PPB 14 PPB 14 PPB 0
H2 0.547 0 183 PPM 183 PPM 183 PPM trace
H2O 999 PPM 0.836 0.787 0.787 0.787 0.836
HCl 0 0 0 0 0 0
H2S 0.006 0.001 0.002 0.002 0.002 0.001
N2 0.008 0 2 PPM 2 PPM 2 PPM trace
NH3 835 PPM 0.121 0.114 0.114 0.114 0.121
O2 0 0 0 0 0 0
SO2 0 0 0 0 0 0
A7 A8 A9 A10 A11 A12
Temperature F 77.6 176 75 78 80 179
Pressure psia 739.7 364.7 14.7 739.7 14.7 364.7
Enthalpy Btu/lb -125.8 -3874.8 -681.8 -678.2 -119.1 -122.2
Density lb/cuft 0.58 2.49 62.25 62.34 62.20 65.75
Mole Flow lbmol/h 35578 23593 5543 5533 969 1018
V-L Mass Flow lb/hr 166699 1017350 99859 99729 17462 19827
Solids Mass Flow lb/hr
V-L Mole Fraction
Ar 0.012 46 PPM 0 7 PPM 0 11 PPB
CH4 0.001 6 PPM 0 863 PPB 0 1 PPB
CO 0.071 231 PPM 0 31 PPM 0 47 PPB
CO2 331 PPB 0.958 0 533 PPM 0 0.058
COS 71 PPM 237 PPB 0 56 PPB 0 trace
H2 0.901 0.003 0 311 PPM 0 712 PPB
H2O 0.001 0.023 1 0.995 1 0.879
HCl 0 0 0 0 0 0
H2S 831 PPB 0.015 0 216 PPM 0 0.001
N2 0.013 27 PPM 0 4 PPM 0 4 PPB
NH3 16 PPM 4 PPM 0 0.003 0 0.062
O2 0 0 0 0 0 0
SO2 0 0 0 0 0 0
Page 115
Final Report DE-FE0000896 16 February 2017
114
AC-ABC-Specific Cost Estimation Assumptions
The operating pressure for the AC-ABC absorber in this cost analysis was assumed to be
725 psig, and the regenerator pressure 350 psigalthough regeneration should be
feasible up to at least 725 psig as well.
The lean AC-ABC solvent in the model consisted of 8 molal aqueous ammonia with a
CO2/NH3 molar ratio (CO2 loading) of 0.35. The rich solution CO2/ NH3 loading was
0.85.
Operating parameters such as the recycle rates within the absorber and water-wash
columns were based on the operating conditions of the AC-ABC pilot plant at the
National Carbon Capture Center in Wilsonville, AL.
Steam used in the regenerator reboiler was assumed to be at 458°F and 458 psia, as
extracted from the IP steam turbine.
Flow rates of clean water into the water-wash column and the regenerator water wash
were optimized to minimize water usage while achieving targets of 30 ppm NH3 in the
clean syngas and 10 ppm NH3 in the regenerated CO2/H2S stream.
No additional sour-water stripper was included in the AC-ABC capital cost estimation
because the amount of sour water produced from AC-ABC is less than the amount of
sour water avoided by not adding additional steam to the water-gas shift reactors.
Therefore, the sour water from the AC-ABC water washes can be sent to the existing
sour-water stripper within the IGCC plant without adding any new capacity.
Equipment in the AC-ABC process was assumed to be constructed of 316 stainless steel
for the purpose of resisting corrosion.
Heat requirements: The following sources of heat were considered to be available for supplying
regeneration heat to the AC-ABC reboiler (in the form of IP steam, as in the reference cases):
The hot syngas exiting the first sour-gas shift (SGS) stage. In the Selexol case, this heat
was used to generate the steam added before the SGS reactors, but in the AC-ABC case
this additional steam stream can be used to supply the reboiler.
The hot syngas exiting the second SGS stage. In the DOE cases, this was used to preheat
unshifted syngas or used to generate IP steam sent to the heat recovery steam generator
(HRSG). For the AC-ABC case, this IP steam was used to supply the reboiler, so no
credit was taken for recycling this heat back to the HRSG.
Further cooling of the hot syngas prior to the mercury removal stage. Some of the steam
raised from the heat removed here was used to reheat the clean syngas prior to expansion.
IP steam directly from the HRSG was used to provide the remainder of the steam
required in the AC-ABC reboiler. Because the AC-ABC solvent does not degrade at high
temperatures, high-temperature process streams such as the hot syngas could potentially be used
for direct heat exchange to regenerate the rich AC-ABC solvent, rather than using IP steam as an
intermediary. This would provide cost savings and reduce the steam usage requirement.
Page 116
Final Report DE-FE0000896 16 February 2017
115
Bechtel Pressure-Swing Claus Process: Bechtel Hydrocarbon Technology Solutions,
Inc. is developing an alternate process to convert H2S to elemental sulfur at elevated pressures
(Figure 78). This process can use the CO2-H2S stream produced in the regenerator of the AC-
ABC process to produce elemental sulfur and a CO2 gas stream that is suitable for sequestration.
Figure 78. Bechtel pressure-swing Claus process to convert H2S to elemental sulfur.
In this process, SO2 is introduced to the acid gases (“feed gas”) and they are heated
indirectly by steam in the “reactor feed heater”. Then the mixture is fed to the first or primary
on-line reactor (“primary reactor”), where most of the H2S, COS, and SO2 are converted to sulfur
and adsorbed on the catalyst. Based on the bench-scale testing, the primary reactor is expected to
produce a sweet gas of about 100 ppmv total sulfur (including residual elemental sulfur vapor).
The gas flows through a cooler (“reactor intercooler”), where it is cooled by generating steam.
Provisions are made to accommodate any sulfur that may condense at this location. Any
recovered sulfur drains to a sulfur pit, and the vapor goes to the next reactor (“secondary
reactor/sulfur trap”), which acts as a sulfur trap/guard bed. Here, it is expected that residual
sulfur vapor will be adsorbed and most of the remaining residual H2S, COS, and SO2 will be
converted to sulfur and/or adsorbed. The second reactor is expected to reduce the sulfur in the
Page 117
Final Report DE-FE0000896 16 February 2017
116
product gas to less than 20 ppmv total sulfur. The product gas is returned to the facility for
compression. After about 8-12 hours online, the primary reactor is rotated to regeneration, the
secondary reactor moves up to the primary position, and the regenerated reactor is switched to
the secondary reactor position. The “regen reactor” is shown in regeneration in Figure 78. The
sulfur-loaded bed is partially regenerated by pressure let down. Flash gas passes through a sulfur
condenser (“sulfur condenser”) and is recompressed (“regen recycle compressor and regen gas
compressor”) prior to being mixed into the BPSC feed stream. There is a heating and cooling
cycle (“regeneration heater and cooler”) using recycled sweep gas to complete the reactor
regeneration. High-pressure SO2 is produced from some of the product sulfur by reacting it with
oxygen from a proprietary reactor or a third-party vendor.
BPSC allows recovery of sulfur species as elemental sulfur while maintaining system
pressure. Due to the higher pressures compared to traditional Claus units, equipment size is
reduced.
PLANT PERFORMANCE SUMMARY WITH AC-ABC CO2 AND H2S CAPTURE
The gas turbine, steam turbine, and HRSG were modeled in GT Pro. Given the
composition of the clean syngas as an input, GT Pro calculates the amount of clean syngas
needed to achieve the specified gas turbine power of 464 MW. Given the process steam
requirements and conditions, the gross steam turbine power and auxiliary power requirements
are calculated. Table 21 summarizes the gross and net power plant outputs for the three IGCC
cases: no CO2 capture, Selexol capture, and AC-ABC capture.
Page 118
Final Report DE-FE0000896 16 February 2017
117
Table 21. Plant performance summary.
DOE Case B5A: Baseline, No CO2 Capture
DOE Case B5B: Selexol CO2 Capture
AC-ABC CO2 & H2S Capture
GROSS POWER PLANT OUTPUT Gas Turbine Power 464,000 464,000 464,000 kWe Sweet Gas Expander Power 7,500 6,500 6,359 kWe Steam Turbine Power 276,300 263,500 243,814 kWe
TOTAL POWER 747,800 734,000 714,173 kWe
AUXILIARY LOAD Coal Handling 460 470 470 kWe Coal Milling 2,180 2,270 2,270 kWe Coal Slurry Pumps 180 190 190 kWe Slag Handling and Dewatering 1,120 1,160 1,160 kWe Air Separation Unit Auxiliaries 1,000 1,000 1,000 kWe ASU Main Air Compressor 53,820 67,330 67,330 kWe Oxygen Compressor 10,260 10,640 10,640 kWe Nitrogen Compressor 33,340 35,640 35,640 kWe Other Auxiliaries3 17,290 18,330 17,406 kWe Quench Water Pump 520 540 540 kWe Ground Water Pump 430 530 530 kWe Scrubber Pumps 220 230 230 kWe AGR Removal 2,590 19,230 - kWe AC-ABC CO2 & H2S Capture - - 3,576 kWe Claus Plant/TGTU Auxiliaries 250 250 - kWe Pressure Swing Claus Auxiliaries - - 4,697 kWe Tail Gas Recycle Compressor 2,090 1,780 - kWe CO2 Compressor - 31,160 16,861 kWe
TOTAL AUXILIARIES 125,750 190,750 162,539 kWe
Net Plant Performance Auxiliary Load 125,750 190,750 162,539 kWe
NET PLANT POWER 622,050 543,250 551,634 kWe
Net Plant Efficiency (HHV) 39.0% 32.6% 33.1%
CONSUMABLES
Coal Feed Flowrate 466,898 487,005 487,005 lb/hr Thermal Input1 1,596,309 1,665,074 1,665,075 kWth
CO2 CAPTURE PERFORMANCE
CO2 Captured - 1,005,720 1,000,970 lb/hr CO2 Removal - 90% 90.1%
1 – HHV of as-received Illinois No. 6 coal is 27,135 kJ/kg (11,666 Btu/lb)
2 – Includes plant control systems, lighting, HVAC, and miscellaneous low-voltage loads
3 – Includes boiler feed-water pumps, condensate pumps, circulating water pump, cooling tower
fans, gas turbine auxiliaries, steam turbine auxiliaries, miscellaneous balance of plant and
transformer losses.
COST ADVANTAGES OF AC-ABC PROCESS
In summary, the AC-ABC process has many advantages over Selexol-based processes.
Page 119
Final Report DE-FE0000896 16 February 2017
118
1. The advantage of parasitic electric power consumption with the AC-ABC process over
the Selexol process is considerable as described below.
a. The CO2 stripping in the AC-ABC process can be accomplished at elevated
pressures in the range of 300-750 psig, resulting in a 3 to 7.5 pressure ratio to
compress the gas to the pipeline pressure of 2,215 psia. In the Selexol process, the
pressure ratio of the CO2 compressor is 100-150, requiring five stages of
compression to achieve the pipeline pressure and consuming a significant amount
of electrical energy.
b. The AC-ABC process does not require compressors other than the CO2
compressor. The Selexol process deploys additional high-pressure-ratio
compressors to return flashed syngas to the main syngas stream in both the CO2
absorber and in the sulfur enrichment step prior to H2S stripping.
c. High CO2 loading and high-pressure CO2 strippers in the AC-ABC process reduce
the pumping power between the absorber and the regenerator compared to the
Selexol process, in which lower CO2 loading is combined with pumping the
solvent from almost-ambient pressure in the CO2 stripping to the higher absorber
pressure.
d. The AC-ABC process has these characteristics:
No steam injection is required to enhance the shift reaction.
The steam consumption to strip the H2S is a small fraction of the heat
consumption of the Selexol process for H2S stripping.
The heat consumption for CO2 stripping is high compared to no steam for
CO2 stripping in the Selexol process. However, using the hot syngas as
the main heat source for the CO2 stripping instead of using IP steam
would reduce the power output penalty.
2. The net power production in the case of CO2 capture by the AC-ABC process with
limited shift and BPSC is 8.4 MWe higher compared to the case in which Selexol solvent
is used.
3. The capital cost of an IGCC plant using the AC-ABC process for AGR is 10.4% lower
than the same IGCC plant using the Selexol process due to reduced equipment sizes and
complexity.
Absorption of the H2S and the CO2 in the same absorber vessel allows for the
elimination of the separate H2S absorber vessel and its auxiliary equipment.
H2S enrichment is eliminated in the vessel and clean gas-stripping compressor.
Stripping of the H2S together with the CO2 results in the elimination of H2S
stripper and its auxiliary equipment.
Using the pressure-swing Claus process results in the elimination of the Claus
plant and the tail gas treatment, which are replaced with a simple, low-cost, and
low-energy system to convert the H2S to elemental sulfur in-situ in the high-
pressure CO2 stream.
Page 120
Final Report DE-FE0000896 16 February 2017
119
High-pressure CO2 stripping results in a simple, low-cost, and low-power CO2
compressor with single-stage intercooling compared to a large, costly compressor
with multiple intercoolers for the Selexol CO2 compressor.
There is virtually no hydrogen dissolution in the AC-ABC solvent, resulting in no
hydrogen loss and no need for recycling of gas streams by using compression
back into the syngas.
4. Considering only the capital costs of the sour gas shift, CO2 removal and compression,
and H2S capture and recovery steps, the AC-ABC/BPSC process is only 52% of the cost
of the Selexol/Claus process.
SENSITIVITY ANALYSES
Several sensitivity analyses were carried out to determine the effect on net plant power
output, capital cost, cost of electricity (COE), and CO2 avoided and captured costs of process
variables such as syngas composition in the inlet to AC-ABC, CO2 capture efficiency, and
process steam usage. Each sensitivity case was modeled in Aspen Plus, with the power island
modeled in GT Pro. The contributions to costs from the BPSC process for H2S recovery were
assumed to be constant in each of the sensitivity cases. Capital costs were calculated using the
same methods described earlier. The cases studied are listed below, and results are summarized
in Table 22.
Case 1: Increased (50 mol%) CO2 concentration in inlet syngas to AC-ABC
Case 2: Increased H2S concentration (1.5 mol%) in inlet syngas to AC-ABC
Case 3A: AC-ABC captures only 99% of CO2 in inlet syngas
Case 3B: AC-ABC captures only 90% of CO2 in inlet syngas
Case 4A: Steam usage 20% lower than expected
Case 4B: Steam usage 20% higher than expected
Table 22. Summary of sensitivity analysis results.
Net Power (kWe)
Total Overnight
Cost (2015 $)
COE (% increase over GEE IGCC
Without Capture
Avoided Cost ($/metric ton)
Cost of CO2 Captured
($/metric ton) Base Case 551,634 $2,043,373 30.5% $37.96 $26.79
Case 1 545,248 $2,078,030 33.1% $38.50 $28.08
Case 2 551,639 $2,043,945 30.5% $38.57 $27.22
Case 3A 557,364 $2,043,778 29.2% $36.51 $25.31
Case 3B 546,530 $2,055,559 32.1% $40.29 $29.02
Case 4A 560,372 $2,043,373 28.6% $36.17 $24.81
Case 4B 544,056 $2,043,373 32.2% $39.52 $28.50
Page 121
Final Report DE-FE0000896 16 February 2017
120
Case 1: Effect of CO2 Concentration of Inlet Syngas to AC-ABC
Case 1 considers the effect of increasing the CO2 concentration in the syngas exiting the
water-gas shift reactors and entering the AC-ABC process from 38 to 50 mol percent. The total
flow rate of the syngas was assumed to remain constant, so the flow rates of the non-CO2
components were reduced proportionally. It was assumed for this case that the processes
upstream of AC-ABC (i.e., the water-gas shift reactors) remained unchanged.
The main effects of the increased CO2 concentration were that: (1) the capital costs of the
process increased by 1.6% due to the need for a larger regenerator and reboiler, and (2) the net
power output of the plant decreased by 1.2% due to the greater steam requirements to regenerate
the extra CO2 within the AC-ABC process. Overall, this case resulted in an 8.5% increase in
COE and a 4.8% increase in the cost of CO2 captured.
Case 2: Effect of H2S Concentration of Inlet Syngas to AC-ABC
Case 2 considers the effect of increasing the H2S concentration in the syngas exiting the
water-gas shift reactors and entering the AC-ABC process from 0.6 to 1.5 mol percent. The total
flow rate of the syngas was assumed to remain constant, so the flow rates of the non-H2S
components were reduced proportionally. It was assumed for this case that the processes
upstream of AC-ABC (i.e., the water-gas shift reactors) remained unchanged.
Increasing the H2S concentration had an insignificant effect on the net power output of
the plant and the capital costs. The AC-ABC solvent easily absorbs the additional H2S, and the
heat required for regeneration is not much more than in the base case because the amount of H2S
in the rich solution is still small compared to the amount of CO2. The avoided cost and cost of
CO2 captured are higher in Case 2 than in the base case only because of the assumption that the
total flow rate of the inlet syngas to AC-ABC remains unchanged, which leads to a lower flow
rate of CO2 through AC-ABC, which in turn decreases the total CO2 captured by the process.
Case 3: Effect of AC-ABC CO2 Capture Efficiency
Case 3A considers what would happen if the AC-ABC process were only able to capture
99% of the CO2 in the syngas instead of the > 99.9% capture in the base case. In order to meet
the 90% carbon capture target if only 99% of the CO2 can be captured by AC-ABC, the
conversion of CO to CO2 in the water-gas shift reactors must be higher than in the base case. The
base case did not require the addition of high-pressure steam before the water-gas shift reactors,
but in order to increase the CO to CO2 conversion in Case 3A it was necessary to add a small
steam stream (800 psia, 20,000 lb/h). This stream is much smaller than the added steam in
Case 3B or the Selexol case (Case B5B in the DOE reports).
Page 122
Final Report DE-FE0000896 16 February 2017
121
The main effects of the decreased capture efficiency were: (1) the capital costs of the
process increased very slightly due to larger water-gas shift reactors, and (2) the net power
output of the plant increased by 1.0% due to the larger flow rate and higher heat capacity of the
syngas that resulted from the steam addition, yielding a greater amount of heat that could be
recovered from the syngas between/after the water-gas shift reactors. This increased heat
recovery decreased the amount of intermediate-pressure steam that needed to be taken from the
turbine and used in the AC-ABC reboiler substantially, which was enough to offset the power
output penalty that resulted from the need to take the small high-pressure steam stream from the
steam turbine. Overall, this case resulted in a 4.3% decrease in COE and a 5.4% decrease in the
cost of CO2 captured.
Case 3B considers what would happen if the AC-ABC process were only able to capture
90% of the CO2 in the syngas instead of the > 99.9% capture in the base case. In order to meet
the 90% carbon capture target if only 90% of the CO2 can be captured by AC-ABC, a near-
complete conversion of CO to CO2 in the water-gas shift reactors is required. Therefore, the
elimination of added steam to the water-gas shift reactor in the base case is no longer valid. As in
the Selexol case (Case B5B in the DOE reports), a high-pressure steam stream (800 psia,
285,691 lb/h) must be taken from the steam turbine and fed to the first water-gas shift reactor.
The main effects of the decreased capture efficiency were: (1) the capital costs of the
process increased by 0.6% due to larger water-gas shift reactors, and (2) the net power output of
the plant decreased by 1.0% due to the high-pressure steam stream that was taken from the steam
turbine, reducing plant power output. Part of this steam usage penalty, however, was made up for
by the increased amount of heat that could be recovered from the syngas between/after the water-
gas shift reactors due to the larger flow rate and higher heat capacity of the syngas that resulted
from the steam addition. Overall, this case resulted in an 8.3% increase in COE and a 5.2%
increase in the cost of CO2 captured.
Case 4: Effect of Steam Usage
Case 4A considers what would happen if the AC-ABC process required 20% less steam
than currently predicted in the base case to regenerate the captured CO2. It was assumed that
equipment sizes and costs were unchanged from the base case. The only change from the base
case is that 20% less steam is extracted from the IP turbine.
The effect of the decreased steam usage was that the power plant output increased by
1.6%, which resulted in a 6.2% lower COE and a 7.4% lower CO2 capture cost as compared to
the base case.
Page 123
Final Report DE-FE0000896 16 February 2017
122
Case 4B considers what would happen if the AC-ABC process required 20% more steam
than currently predicted in the base case to regenerate the captured CO2. It was assumed that
equipment sizes and costs were unchanged from the base case. The only change from the base
case is that 20% more steam is extracted from the IP turbine.
The effect of the decreased steam usage was that the power plant output decreased by
1.4%, which resulted in a 6.6% higher COE and a 6.4% higher CO2 capture cost as compared to
the base case.
Page 124
Final Report DE-FE0000896 16 February 2017
123
APPENDIX A
Equipment Cost List for AC-ABC Process
Table 23. Equipment costs for AC-ABC and BPSC process.
Equipment Size Unit Cost, 2011
Absorber
Column
316 SS column 64 height (ft) $5,898,640
20 diameter (ft)
Packing (3.5” SS pall rings) 8 stages $4,022,114
Cooler on top absorber recycle stream
Cooling duty - top absorber recycle cooler -1.92E+08 Btu/h
Plate and frame exchanger area 112815 sqft $2,989,006
Pumps on absorber recycle loops
Pump duty (lower absorber recirculation pump) 171 hp
Electrical usage (kW) 127 kW $1,056,646
Pump duty (upper absorber recirculation pump) 806 hp
Electrical usage (kW) 601 kW $744,449
Regenerator
Column
316 SS column 40 height (ft) $2,764,283
14 diameter (ft)
Trays (316 SS valve trays) 8 trays $77,005
Reboiler
Reboiler duty 7.65E+08 Btu/h
Reboiler (316 SS floating head exchanger) 31250 sqft $1,781,318
Lean/Rich Recirculation Equipment
Lean/Rich Heat Exchanger
Exchanger duty 8.46E+08 Btu/h
Exchanger area (316 SS, plate and frame exchanger) 254626 sqft $6,473,162
Rich/Lean circulation pump (from regenerator to absorber)
Pump duty 3673 hp
Electrical usage (kW) 2739 kW $156,205
Cooler on lean stream
Cooling duty - lean stream cooler -5.59E+08 Btu/h
Exchanger area (316 SS, plate and frame exchanger) 73834 sqft $1,599,425
Water Washes
Absorber Water Wash Column
316 SS column 14 height (ft) $625,636
6.8 diameter (ft)
Trays (316 SS valve trays) 2 trays $5,177
Page 125
Final Report DE-FE0000896 16 February 2017
124
Cooler on water wash recycle stream
Cooling duty - water wash recycle cooler -4.12E+05 Btu/h
Exchanger area (316 SS, floating head exchanger) 203 sqft $49,388
Absorber Water Wash Pumps
Pump duty (water wash recirculation pump) 30 hp
Electrical usage (kW) 23 kW $49,854
Pump duty (water wash inlet water pump) 106 hp
Electrical usage (kW) 79 kW $14,869
Regenerator Water Wash Column
316 SS column 20 height (ft) $860,803
7.9 diameter (ft)
Trays (316 SS valve trays) 4 trays $13,468
Regenerator Water Wash Pumps
Pump duty (regenerator water wash inlet water pump) 9.1 hp
Electrical usage (kW) 6.8 kW $12,196
Sum of Equipment Costs $29,193,643
CAPITAL COST ESTIMATES
Direct Costs
Purchased equipment delivered 1 $29,193,643 purchased equipment installation 0.47 $10,554,625 Instrumentation & controls 0.36 $8,084,393 Piping 0.68 $19,851,677 Electrical 0.11 $2,470,231 Buildings 0.18 $4,042,197 Yard improvements 0.1 $2,245,665 Service facilities 0.7 $15,719,654
Total Direct Plant Cost (~bare erected cost in (NETL 2015) $92,162,084
Indirect Costs
Engineering, construction, & contractor's fee 0.1 $2,919,364 Contingency (Process) 0.2 $5,838,729 Contingency (Project) 0.2 $20,184,035
Total indirect plant cost $28,942,128
Fixed Capital Investment (~Total plant cost in (NETL 2015), AC-ABC Only
$121,104,212
BPSC Equipment Costs
Fixed capital investment (~Total Plant Cost in (NETL 2015), BPSC Only
$49,614,853
Other Changed Equipment Costs in IGCC Plant
Water-Gas Shift Reactors (84% of base-case throughput) 1,308,800 Throughput (lb/h) $17,980,565
CO2 Compressor 22610 hp $17,212,379
16861 kW
Fixed capital investment (~Total Plant Cost in (NETL 2015), WGS Reactors and CO2 Compressor Only
$35,192,943
Page 126
Final Report DE-FE0000896 16 February 2017
125
Operating and Maintenance Cost Summary
Table 24. GEE IGCC with AC-ABC/ BPSC: initial/annual operating and maintenance costs.
INITIAL & ANNUAL O&M EXPENSES Cost Base 2011
GEE Radiant 550 MW IGCC w/ SRI CO2 Capture and BPSC Sulfur Removal
Heat Rate-net (Btu/kWh): 9,636
MWe-net 552
OPERATING & MAINTENANCE LABOR Capacity Factor (%): 80
Operating Labor
Operating Labor Rate (base): 39.70 $/hour
Operating Labor Burden: 30.00 % of base
Annual Unit Cost $/kW-net
Labor O-H Charge Rate: 25.00 % of labor
Operating Labor Requirements (O.J.) per Shift: 1 unit/mod. Total Plant
Skilled Operator 2.0 2.0
Operator 10.0 10.0
Annual Cost $
Foreman 1.0 1.0
Lab Techs, etc. 3.0 3.0
TOTAL-O.J.’s 16.0 16.0
Annual Operating Labor Cost $7,233,658 $13.316
Maintenance Labor Cost $18,843,231 $34.687
Administrative & Support Labor $6,519,222 $12.001
Property Taxes & Insurance $36,802,296 $67.747
TOTAL FIXED OPERATING COSTS $69,398,406 $127.751
VARIABLE OPERATING COSTS $/kWh-net
Maintenance material cost unit cost
initial fill
cost
$31,671,981
Consumables Initial Fill /day
Water (/1000 gallons) 3412.6 1.67 $1,664,120 $0.00044
Chemicals
MU & WT Chem. (lb) 0 24994 0.27 $0 $1,970,525 $0.00052 Carbon (Mercury Removal) (lb) 135009 231 5.5 $742,550 $370,511 $0.00010 COS Catalyst (m3) 0 0 2397.36 $0 $0 $0.00000 WGS Catalyst (ft3)
5255 4 771.99 $4,057,07
0 $811,778 $0.00021 Selexol Solution (gal) 0 0 36.79 $0 $0 $0.00000 BPSC Catalyst (m3) 0 0 0 $0 $266,667 $0.00007 Ammonia (19% NH3) (ton) 441 1 263 $116,045 $56,215 $0.00001 Claus Catalyst (ft3) w/equip 0 203.15 $0 $0.00000
Subtotal-Chemicals
$4,915,664 $5,139,816 $0.00091
Other
Supplemental Fuel (Mbtu) 0 0 0 $0 $0 $0.00000
Gases, O2, N2 etc. (/100 scf) 0 0 0 $0 $0 $0.00000
Page 127
Final Report DE-FE0000896 16 February 2017
126
LP Steam (/1000 pounds) 0 0 0 $0 $0 $0.00000
Subtotal-Other $0 $0 $0.00000
Waste Disposal
Spent Mercury Catalyst (lb) 0 231 0.65 $0 $43,788 $0.00001 Fly-ash (ton) 0 0 0 $0 $0 $0.00000 Slag (ton) 0 640 25.11 $0 $4,693,875 $0.00123
Subtotal Waste Disposal $0 $4,737,662 $0.00125 Byproducts & Emissions 0 0 0 $0 $0 $0.00000
Sulfur (ton) 0 0 0 $0 $0 $0.00000
Subtotal Byproducts $0 $0 $0.00000
TOTAL VARIABLE OPERATING COSTS
$4,915,664 $41,549,459 $0.00260
Fuel (ton) 0 5837 68.54 $0 $116,810,277 $0.03070
Page 128
Final Report DE-FE0000896 16 February 2017
127
Table 25. DOE Case B5B: initial and annual operating and maintenance costs (NETL 2015).
Page 129
Final Report DE-FE0000896 16 February 2017
128
Figure 79. A photograph of the AC-ABC pilot plant at the NCCC.
Figure 80. A photograph of the AC-ABC process skids.
Page 130
Final Report DE-FE0000896 16 February 2017
129
Figure 81. A photograph of sulfur recovery reactors.
Figure 82. A photograph of skid B-1 with sulfur condensers.
Page 131
Final Report DE-FE0000896 16 February 2017
130
CONCLUSIONS
Based on the test results from the two test campaigns and the techno-economic analysis
results, the AC-ABC technology is able to meet DOE’s performance goal of 90% CO2 capture
with a cost of CO2 capture much lower than the DOE goal of $40/ton of CO2 and with significant
system availability even at the small pilot-scale level.
The following conclusions can be drawn:
The ammoniated solution is very effective in rapid absorption of CO2 with high CO2
loading at elevated pressure. CO2 capture efficiency greater than 99% was
demonstrated, with 12% CO2 effective loading.
H2S can be simultaneously absorbed along with CO2 in a single absorber column. The
H2S capture efficiency was greater than 99%.
The absorption and thus loss of fuel gas species like H2, CO, and CH4 were shown to
be very low.
There was low ammonia loss from the system.
Both the absorber and regenerator were operated at similar elevated pressure, thus
reducing the need for pumping solvents across pressure boundaries.
Simultaneous stripping of CO2 and H2S was demonstrated in a single column at
elevated pressure and moderate temperature.
The Bechtel Pressure-Swing Claus Process (BPSC) process demonstrated conversion
of H2S to high-purity elemental sulfur, and a clean CO2 gas stream at elevated
pressure was available for sequestration or transportation.
Availability of regenerated CO2 at elevated pressure significantly reduced the
compressor requirements for CO2 sequestration.
The techno economic analysis showed the cost of CO2 capture using AC-ABC/BPSC
process from IGCC gas stream was less than $30/metric ton of CO2
Solvent-based technologies have proven themselves to be effective and relatively easy to
operate compared to some of the newer technologies for CO2 capture. The equipment for solvent
technologies, i.e., pumps, valves, heat exchangers, etc., is readily available, and the scale-up
factors and challenges are well understood in the industry. We do not envision any new custom-
built equipment, which will increase the likelihood of success at larger-scale demonstration level.
System modeling tools, property methods, and solvent performance data are well developed and
Page 132
Final Report DE-FE0000896 16 February 2017
131
documented and are readily available and require few assumptions and extrapolations. The
ammoniated solution used in this process is readily available. The low cost of the solvent
coupled with demonstrated low losses from the process significantly reduced the operating costs
of the plant. There is a vast industrial experience in ammonia-based processes including
operation of sour-water strippers across refineries and other industries. With the long-term goal
to sequester and/or utilize CO2 instead of venting it to the atmosphere, the availability of high-
pressure CO2 from this process offers a unique benefit over the currently available technologies.
Although the commercial interest in the IGCC for power generation has declined over the past
few years, there is a potential for this technology to be used for other syngas applications such as
the production of ammonia and other chemicals, for acid gas removal from biomass gasification,
and for acid gas removal from natural gas and other hydrocarbon streams.
Page 133
Final Report DE-FE0000896 16 February 2017
132
REFERENCES
Environmental Protection Agency (EPA) proposed new source performance standard on April
13, 2012, for emission of carbon dioxide for a new fossil fuel fired electric utility
generating unit.
Field, J. H., G. E. Johnson, H. E. Benson, and J. S. Tosh, “Removing Hydrogen Sulfide by Hot
Potassium Carbonate Solution,” U.S. Bureau of Mines Reports of Investigation No. 5660
(1960).
Nagar, A., SRI International. CO2 Capture from IGCC Gas Streams using the AC-ABC Process.
Quarterly Progress Report 27 (April-June 2016). SRI International, July 2016.
National Energy Technology Laboratory (NETL). “Cost and Performance Baseline for Fossil
Energy Plants, Volume 1b: Bituminous Coal (IGCC) to Electricity,” Revision 2b.
DOE/NETL, July 2015.
National Energy Technology Laboratory (NETL). “Cost and Performance Baseline for Fossil
Energy Plants, Volume 1: Bituminous Coal and Natural Gas to Electricity,” Final Report,
Revision 2. DOE/NETL, 2010.
National Energy Technology Laboratory (NETL). “Quality Guidelines for Energy Systems
Studies.
National Energy Technology Laboratory (NETL). “Quality Guidelines for Energy Systems
Studies – Process Modeling Design Parameters.” DOE/NETL, May 2014.
Perry, J. Chemical Engineering Handbook, 5th edition, pp 3-101 to 3-103 (1973).
Peters, M., Timmerhaus, K., and West, R., Plant Design and Economics for Chemical Engineers,
McGraw Hill, 2003.
Shoor, S. K., R. D. Walker, and K. E. Gubbins, “Salting out of Nonpolar Gases in Aqueous
Potassium Hydroxide solution,” J. Phys. Chem., 73, 312-317 (1966).
Towler, G., and Sinnott, R., Chemical Engineering Design: Principles, Practice and Economics
of Plant and Process Design, Elsevier, 2013.