TECHNOLOGY SPECIAL REPORT Vello Kuuskraa Matt Wallace Advanced Resources International Arlington, Va. CO 2 -EOR set for growth as new CO 2 supplies emerge Development of large natural sources of CO 2 in Colorado (McElmo Dome/Doe Canyon) and New Mexico (Bravo Dome) plus construction of high-volume CO 2 pipelines en- abled CO 2 enhanced oil recovery (CO 2 -EOR) to achieve its first burst of growth in the Permian ba- sin starting in the 1980s. Subsequent development of natural CO 2 sup- plies at Jackson Dome, Mississippi, and the cap- ture of vented CO 2 at the massive LaBarge nat- ural gas processing plant in western Wyoming provided the foundations for the second round of CO 2 -EOR growth at the turn of the century in the Gulf Coast and the Rocky Mountains. Based on these first two phases of growth, the industry now injects 3.5 bcfd (68 million tonnes/year [tpy]) of natural and industrial CO 2 to produce 300,000 b/d of oil via EOR. Fig. 1 provides the state-by-state locations for the 136 currently active CO 2 -EOR projects. Much of the activity is in West Texas with 77 projects, followed by Mississippi (19 projects), and Wyoming (14 projects). Fig. 1 also shows the location of existing CO 2 sup- ply sources. While much of the CO 2 is from natural CO 2 fields, industrial sources in growing numbers also provide CO 2 to the EOR industry. A robust in- frastructure of CO 2 pipelines, totaling more than 3,000 miles, links CO 2 supply areas with oil fields. While oil production from CO 2 -EOR has steadi- ly increased, its growth has slowed in the past few years (Fig. 2). This is due primarily to limits on ac- DRILLING & PRODUCTION FIG. 1 CO 2 -EOR OPERATIONS, CO 2 SOURCES: 2014 136 Number of CO 2 -EOR projects Natural CO 2 source Industrial CO 2 source CO2 pipeline CO 2 proposed pipeline Oil production, 2014 CO2 supplies, 2014 19 2 2 77 9 1 1 2 2 14 9 Number of sources 17 • Natural 5 • Industrial 12 CO2 supply, MMcfd 3.5 • Natural 2.8 • Industrial 0.7 CO 2 –EOR projects 136 Oil production, 1,000 b/d 300 Source: Advanced Resources International Inc. based on OGJ EOR/Heavy Oil Survey 2014 and other sources Denbury/Green pipeline Air products hydrogen plant Greencore pipeline Val Verde gas plants Century gas plant Jackson Dome Mississippi IGCC plant PCS nitrogen plant Agrium nitrogen plant Enid fertilizer plant Coffeeville fertilizer plant Conestoga ethanol plant Conestoga Bonanza Bravo Dome Doe Canyon McElmo Dome Sheep Mountain LaBarge gas plant Riley Ridge Dakota Coal gasification plant Reprinted with revisions to format, from the April 7, 2014 edition of OIL & GAS JOURNAL Copyright 2014 by PennWell Corporation
Transcript
TECHNOLOGY
SPECIALREPORT
Vello Kuuskraa Matt WallaceAdvanced Resources International Arlington, Va.
CO2-EOR set for growth
as new CO2 supplies emerge
Development of large natural sources of CO2 in Colorado
(McElmo Dome/Doe Canyon) and New Mexico (Bravo Dome) plus construction of high-volume CO
2 pipelines en-
abled CO2 enhanced oil recovery (CO
2-EOR) to
achieve its first burst of growth in the Permian ba-sin starting in the 1980s.
Subsequent development of natural CO2 sup-
plies at Jackson Dome, Mississippi, and the cap-ture of vented CO
2 at the massive LaBarge nat-
ural gas processing plant in western Wyoming provided the foundations for the second round of CO
2-EOR growth at the turn of the century in
the Gulf Coast and the Rocky Mountains.Based on these first two phases of growth, the industry
now injects 3.5 bcfd (68 million tonnes/year [tpy]) of natural and industrial CO
2 to produce 300,000 b/d of oil via EOR.
Fig. 1 provides the state-by-state locations for the 136 currently active CO
2-EOR projects. Much of the activity is
in West Texas with 77 projects, followed by Mississippi (19 projects), and Wyoming (14 projects).
Fig. 1 also shows the location of existing CO2 sup-
ply sources. While much of the CO2 is from natural
CO2 fields, industrial sources in growing numbers
also provide CO2 to the EOR industry. A robust in-
frastructure of CO2 pipelines, totaling more than
3,000 miles, links CO2 supply areas with oil fields.
While oil production from CO2-EOR has steadi-
ly increased, its growth has slowed in the past few years (Fig. 2). This is due primarily to limits on ac-
DRILLING &PRODUCTION
z14
04
07
OG
Jsku
01
FIG. 1CO2-EOR OPERATIONS, CO2 SOURCES: 2014
136 Number of CO2-EOR projects
Natural CO2 source
Industrial CO2 source
CO2 pipeline
CO2 proposed pipeline
Oil production, 2014
CO2 supplies, 2014
19
2
277
9
1
1
2
2
14
9
Number of sources 17
• Natural 5
• Industrial 12
CO2 supply, MMcfd 3.5
• Natural 2.8
• Industrial 0.7
CO2 –EOR projects 136
Oil production, 1,000 b/d 300
Source: Advanced Resources International Inc. based on OGJ EOR/Heavy Oil Survey 2014 and other sources
Denbury/Greenpipeline
Air productshydrogen plant
Greencorepipeline
Val Verde gas plants
Century gas plant
Jackson DomeMississippiIGCC plant
PCS nitrogenplant
Agriumnitrogen
plant
Enid fertilizer plantCoffeeville fertilizer plant
Conestoga ethanol plant
Conestoga Bonanza
Bravo Dome
Doe CanyonMcElmo Dome
Sheep Mountain
LaBarge gas plantRiley Ridge
Dakota Coalgasi�cation plant
Reprinted with revisions to format, from the April 7, 2014 edition of OIL & GAS JOURNALCopyright 2014 by PennWell Corporation
TECHNOLOGY
cessible, affordable supplies of CO2.
As such, large-scale capture and uti-lization of CO
2 from industrial facili-
ties, chemical complexes, and electric power plants will be essential if the CO
2-EOR industry is to achieve its full
economic potential.We now envision a third round of
growth for CO2-EOR supported by (1)
development of large additional in-dustrial sources of CO
2 plus modest
expansions of natural CO2 supplies,
(2) the recent completion of a series of large-volume CO
2 pipelines in the
Rockies, Gulf Coast, and Midconti-nent, and (3) a favorable outlook for oil prices.
Table 1 provides a partial listing of recently announced industrial plants planning to capture CO
2 emissions for
sale to the EOR market. Fig. 3 shows the recent expansion in available nat-ural CO
2 supplies from the McElmo
Dome and Doe Canyon CO2 fields.
Augmenting OGJ surveyOil & Gas Journal’s bienneal EOR/Heavy Oil Survey is the “gold standard” for information on EOR operations in the US. The information in the survey is collected at an EOR project level, providing detailed, highly valuable data on the nature, location, reservoir settings, and oil production from EOR for each of the major EOR technologies: CO
2-EOR,
chemical EOR, and thermal EOR. The survey contains data for 1986-2014. The 2014 EOR/Heavy Oil Survey appears nearby.
The objective of this article is to augment this valuable snapshot of the status of CO
2-EOR with a look forward. For
this, our article captures industry information on existing
and future sources of CO2 as well as data on existing and an-
nounced CO2-EOR projects.
As such, our projections of future oil production from CO
2-EOR are based on industry data as well as project-by-
project matching of available CO2 supplies in concert with
CO2 utilization. Where the announced volumes of available
CO2 supplies exceed demand for CO
2 by existing or an-
nounced CO2-EOR projects, we estimate the additional oil
production that could result from expansion of existing CO2
floods or the initiation of yet-to-be announced CO2 floods.
CO2-EOR outlookOil production from CO
2-EOR in onshore, Lower 48 oil res-
ervoirs provided 300,000 b/d of incremental oil supply at the start of year 2014. This rate of oil production has grown
HISTORICAL CO2-EOR PRODUCTION
z14
04
07
OG
Jsku
02
FIG. 2
Source: Advanced Resources International Inc. adjustment to OGJ EOR/Heavy Oil Survey 2014
RECENTLY ANNOUNCED INDUSTRIAL SOURCES OF CO2 Table 1
Region Project name Company State Status Year online
Gulf Coast Port Arthur Air Products La. Online 2013 Kemper County IGCC Southern Co. Miss. Expected 2014 Nitrogen plant PCS Nitrogen La. Online 2013 Ammonia plant Not available La. Expected 2016 W.A. Parish NRG Energy Tex. Expected 2016 Sasol GTL Sasol La. Expected 2018 Lake Charles Leucadia Energy La. Expected 2018 Chemical plant Not available La. Expected 2020Rockies Lost Cabin ConocoPhillips Wyo. Online 2013 Medicine Bow DRKW Wyo. Expected 2016 Riley Ridge Denbury Wyo. Expected 2017 Wyoming UCG Linc Energy Wyo. Expected 2017 Quintana South Heart Great Northern Power ND Expected 2017Midcontinent Bonanza Conestoga Kan. Online 2013 Coffeyville CVR Energy Kan. Online 2013Permian basin Century plant expansion Sand Ridge/Occidental Tex. Expected 2015 Texas Clean Energy Summit Energy Tex. Expected 2016
TECHNOLOGY
operators. Without a CO2-EOR market
for captured CO2 emissions, however,
these plants may vent their CO2 emis-
sions rather than be able to sell their captured CO
2 for productive use by
EOR.Our outlook for growth in industri-
al sources of CO2 includes the follow-
ing announced projects:• Large expansions in CO
2 cap-
tured from gas processing plants, such as at Lost Cabin, LaBarge, and Riley
Ridge in the Rockies and the Century Phase 2 plant in West Texas.
• Capture of CO2 from a host of nitrogen, hydrogen, fer-
tilizer, and other industrial plants in the Midcontinent and along the Gulf Coast.
• Potential for captured CO2 emissions from Summit En-
ergy’s TCEP integrated gasification/combined cycle (IGCC) plant in West Texas, Sasol’s gas-to-liquids (GTL) plant in Louisiana, Leucadia’s coal gasification plant in Mississippi, and DKRW’s Phase 1 coal-to-liquids plant in the Rockies, among others.
No doubt some of these industrial projects expecting to capture CO
2 may be delayed or even canceled. As such, we
have used probabilities on the likelihood of each plant be-coming operational by 2020.
Here is a region-by-region assessment of future CO2 sup-
plies.• Permian basin. The current sources of CO
2 supply for
the Permian basin include McElmo Dome, Doe Canyon, and Sheep Mountain/La Veta in Colorado, Bravo Dome in New Mexico, and the Century and Val Verde gas plants in Texas. With recently completed expansions, these sources are pro-jected to provide 1.9 bcfd of CO
2 in 2014 for use by CO
2-EOR.
A new source of natural CO2 (300 MMcfd of capacity)
steadily for the past 30 years.Given the new volumes of CO
2 sup-
plies and the numerous announced CO
2-EOR projects, we envision strong
growth in near-term oil production and CO
2 utilization from CO
2-EOR.
Our analysis shows that incremental oil production from CO
2-EOR opera-
tions is likely to double to 638,000 b/d by 2020 (Fig. 4; Table 2).
Our outlook for CO2-EOR incorpo-
rates growth (or decline) in oil produc-tion from previously initiated CO
2-EOR projects as well as
expected oil production from recently announced new CO2-
EOR projects expected to come online by 2020.For example:• The recently initiated CO
2-EOR projects at Bell Creek,
Burbank, Goldsmith, Hastings, Katz, and Oyster Bayou (among others) have yet to reach peak production.
• A series of large-scale CO2-EOR projects, such as at
Conroe, Thompson, and Webster, together holding nearly 250 million bbl of CO
2-EOR oil potential, are scheduled to
achieve first production by 2020.
CO2 supply outlookCurrently, the majority of CO
2 used by EOR is from natural
sources, notably from the McElmo Dome, Bravo Dome, and Doe Canyon natural CO
2 fields, which supply the Permian
basin and portions of the Midcontinent, and from Jackson Dome, which supplies CO
2 for EOR in East Texas and along
the Gulf Coast.Natural CO
2 resources are limited, however. As such,
future development of CO2-EOR will need to rely on new
sources of industrial CO2. Importantly, the capture and sale
of industrial CO2 emissions would provide revenues to in-
dustrial plants, gas processing plants, and power generation
z14
04
07
OG
Jsku
03
FIG. 3
FIG. 3bFIG. 3a
RECENT EXPANSION OF NATURAL CO2 SUPPLIES FOR EORMcElmo Dome CO2 �eld Doe Canyon CO2 �eld
taking into account available informa-tion. Operator projections for future oil production were available for most of the CO
2-EOR projects in the Gulf
production to increase to 638,000 b/d in 2020 from 300,000 b/d in 2014 (Fig. 5). This estimate of future CO
2-EOR oil
production derives from several sources:• Existing CO
2 floods. The start-
ing point for estimating future oil production is the set of 136 currently
other by NRG, will capture and supply CO
2 for EOR in 2014 and 2016, respec-
tively. Total CO2 supply for EOR in the
Gulf Coast-East Texas region will in-crease to 2.6 bcfd by 2020.
• Rocky Mountains. The majority of CO
2 supply in the Rockies comes
from the Shute Creek/LaBarge gas pro-cessing plant. A small volume of natu-ral CO
2 supply from McElmo Dome is
supplied to the CO2 flood at Greater
Aneth oil field. Total supply of CO2 for
EOR in the Rockies is projected at 370 MMcfd for 2014.
In addition to expansion of CO2
capture at the Shute Creek/LaBarge and Lost Cabin gas processing plants, four sources of industrial CO
2 are to
come online, including the Riley Ridge gas processing plant, the DKRW Medi-cine Bow fuel plant, the Linc Energy gasification plant, and the Quintana South Heart IGCC plant.
Under a probability-based estimate, these expansions and new projects would add nearly 400 MMcfd of CO
2
supply for Rockies EOR by 2020.• Midcontinent. The great bulk of
the CO2 supply in the Midcontinent
comes from industrial sources, in-cluding the Koch nitrogen plant, the Agrium fertilizer plant, the CVR Cof-feyville chemical plant, and the Con-estoga Arkalon and Bonanza nitrogen plants.
A modest amount of natural CO2, 35
MMcfd, is currently supplied to the Postle oil field in Oklahoma from Bravo Dome. Projected total CO
2 supply for Midconti-
nent EOR is 150 MMcfd in 2014.Several new sources of CO
2 are like-
ly for the Midcontinent. The Lilly Lat-eral pipeline will extend Bravo Dome CO
2 supply to the N.E. Hardesty EOR
project, and increased supplies of CO2
from other industrial plants will sup-port expansion of CO
2-EOR at Bur-
bank and surrounding oil fields. Pro-jected total CO
2 supply for EOR in the
Midcontinent will reach reach 300 MMcfd by 2020.
CO2-EOR productionOur outlook is for CO
2-EOR-based oil
UTILIZATION OF NATURAL, INDUSTRIAL CO2 FOR EOR, SOURCES
z14
04
07
OG
Jsku
07
FIG. 7
Source: Advanced Resources International Inc. adjustment to OGJ EOR/Heavy Oil Survey 2014
2013 2014 2015 2016 2017 2018 2019 2020
7
6
5
4
3
2
1
0
CO
2 s
uppl
y, M
Mcf
d
Industrial sourcesNatural sources
UTILIZATION OF NATURAL, INDUSTRIAL CO2 FOR EOR BY REGION
z14
04
07
OG
Jsku
06
FIG. 6
Source: Advanced Resources International Inc. adjustment to OGJ EOR/Heavy Oil Survey 2014
MidcontinentRocky MountainGulf CoastPermian basin
2014 2015 2016 2017 2018 2019 2020
7
6
5
4
3
2
1
0
CO
2 s
uppl
y, M
Mcf
d
TECHNOLOGY
The Kinder Morgan Phase I ROZ project would involve nine 20-acre, inverted five-spot patterns expected to provide 4.7 million bbl of recoverable reserves, with oil production from the Phase I ROZ project peaking at about 2,400 b/d. Additional phases of ROZ development are likely. Under an expected oil recovery rate of 18% of original oil in place, the Phase I ROZ project would provide a 30% internal rate of return.
Longer-term, Kinder Morgan sees a potential CO2 mar-
ket of 750 MMcfd for ROZ in the Permian basin, including 450 MMcfd in currently leased ROZ areas plus 300 MMcfd for additional ROZ development, according to a presentation for investment analysts in January. Kinder Morgan’s Phase I ROZ project and its future ROZ expectations are not includ-ed in the OGJ’s 2014 survey.
International CO2-EORWith some exceptions, use of CO
2 injection for oil recovery
has been slow to catch on outside of the US. One notable exception is Weyburn oil field, where EnCana and Apache have field-wide CO
2-EOR projects. Additional exceptions in-
clude the injection of CO2 into Bati Raman heavy oil field in
Turkey and the use of CO2 in a series of heavy oil fields in
Trinidad.Recently, interest has emerged for productively using oth-
erwise vented CO2 for EOR in oil fields in Abu Dhabi, Brazil,
China, Malaysia, the North Sea, and other areas.For additional information, see the International Energy
Agency’s Greenhouse Gas R&D Programme report “CO2
Storage in Depleted Oilfields: Global Application Criteria for Carbon Dioxide Enhanced Oil Recovery” (Technical Report
Coast, Midcontinent, and the Rockies. For the Permian basin, the study used a combination of operator projections and project-by-project historical trend data to estimate future oil production for each existing CO
2 flood.
• Planned CO2-EOR floods. Opera-
tors often provide data on start date, peak production year, and expected ultimate recovery for new CO
2-EOR.
We used this information to estimate oil production for the 11 new CO
2-EOR
projects included in the study.• Potential CO
2-EOR floods. Where
the available CO2 supply exceeded CO
2
demand from existing and planned CO2-
EOR floods, we estimated future oil pro-duction using regional CO
2 utilization
factors (Mcf of CO2/bbl of oil production)
for potential (yet-to-be announced) CO2
floods.It is likely that additional yet-un-
known natural gas processing and chemical plants will be installed in the US during the next 6 years and sell their captured CO
2 to the
EOR industry. This would lead our projections of CO2-EOR-
based oil production to be conservative.
CO2-EOR; ROZsThe pursuit of residual-oil-zone (ROZ) resources offers the promise of greatly increasing CO
2 demand and oil produc-
tion in the Permian basin. Early ROZ projects were under-taken by Shell in the Denver Unit of giant Wasson oil field. Occidental acquired these projects from Shell and has con-tinued to operate these ROZ assets as well as expand ROZ development to other units in Wasson field.
Since then, several additional ROZ projects are reported to be under way in the oil fields of the Permian basin. Recent information on development of ROZ resources has come from Hess and Kinder Morgan.
• Hess. A series of ROZ projects has been undertaken by Hess in Seminole (San Andres) oil field. The company start-ed in 1996 with the 500-acre (Phase 1) ROZ pilot project and followed in 2004 with a 480-acre ROZ pilot (Phase 2).
Subsequently, Hess launched the 2,320-acre Stage 1 ROZ project in 2007 which has recently been expanded.
The above ROZ projects reported oil production of 3,500 b/d in OGJ’s 2012 EOR/Heavy Oil survey, with 7,800 b/d reported in the 2014 survey.
• Kinder Morgan. Following successful drilling of ROZ appraisal wells, Kinder Morgan announced in early 2014 plans for drilling 29 new wells, constructing production fa-cilities, and investing $78 million in a major ROZ project in the Permian basin.
POTENTIAL FOR STORAGE OF INDUSTRIAL CO2 USING CO2-EOR
z14
04
07
OG
Jsku
08
FIG. 8
Source: Advanced Resources International Inc. adjustment to OGJ EOR/Heavy Oil Survey 2014
Number: 2009-12, December, by Michael Godec, Advanced Resources International Inc.).
The futureBased on the analysis presented here, we offer these obser-vations:
• We anticipate significant growth in CO2 supplies available
to the EOR industry. Overall CO2 utilization by CO
2-EOR (in-
cluding both industrial and natural CO2) will nearly double by
2020—to 6.5 bcfd by 2020 from 3.5 bcfd in 2014 (Fig. 6).• Much of the growth in CO
2 supplies for EOR will be
from capture and utilization of CO2 from industrial sources,
chemical facilities, and power plants.Current (2014) utilization of industrial CO
2 by EOR is 0.7
bcfd (14 million tpy). This rate will reach 3.1 bcfd (60 million tpy) by 2020 (Fig. 7). Much of the increased capture of indus-trial CO
2, between today and 2020, will be from the numerous
announced industrial plants along the Gulf Coast that would otherwise vent their high-purity CO
2 emissions.
• We anticipate that CO2-EOR production will grow sig-
nificantly, reaching 638,000 b/d by 2020. While CO2-EOR
oil production grows in all four regions examined by this study, the Permian basin and the Gulf Coast will lead the way, each with more than 100,000 b/d of increased CO
2-
EOR oil production.The outlook by region:Permian basin. Continued oil production from current
CO2-EOR projects and their expansion to field-wide would
increase oil production to 323,000 b/d in 2020 from 199,000 b/d in 2014.
Gulf Coast. Increased oil production from the 20 cur-rent Gulf Coast CO
2 floods combined with start-up of new
CO2 floods in East Texas (Webster, Conroe, and Thompson
counties) will increase oil production to 152,000 b/d in 2020 from 47,000 b/d in 2014.
Rocky Mountains. The addition of the Bell Creek and Grieve CO
2 floods (plus other, yet-to-be announced projects)
will increase CO2-EOR production in the Rockies to 103,000
b/d in 2020 from 39,000 b/d in 2014.Midcontinent. The addition of the Northeast Hardesty
CO2 flood and significant expansion of the Burbank project
will increase CO2-EOR in the Midcontinent to 59,000 b/d by
2020 from 14,000 b/d in 2014.• Based on already announced and likely CO
2–EOR proj-
ects, we project oil production from CO2-EOR to continue to
grow after 2020. In addition to the numerous CO2-EOR proj-
ects coming online between now and 2020, numerous other CO
2 floods, such as at Cedar Creek anticline and in the San
Joaquin basin, are to start after 2020.These major projects provide the basis for our anticipation
of continued growth of CO2-EOR oil production after 2020.
• Along with increased US oil production, the CO2-EOR
industry is on pace to store 1-2 billion tonnes of industri-al CO
2 that would otherwise be vented during the next 20
years. We estimate that 14 million tonnes of industrial CO2
was stored in underground formations in 2014 through CO2-
EOR. This will increase to nearly 60 million tonnes in 2020.Assuming a constant industrial CO
2 storage rate of 60
million tpy after 2020, more than 1 billion tonnes of indus-trial CO
2 will be stored with CO
2-EOR in the next 20 years
(Fig. 8, baseline industrial CO2 case). If the growth in in-
dustrial CO2 utilization and storage rate were to continue
increasing by about 10 million tpy, nearly 2 billion tonnes of industrial CO
2 would be stored with CO
2-EOR in the next 20
years (Fig. 8, upside industrial CO2 storage Case 8).
AcknowledgmentThis article has been extracted and updated from the US DOE/National Energy Technology Laboratory draft analytical paper entitled “Near-Term Projections of CO
2 Utilization by
Enhanced Oil Recovery Production” prepared for US/NETL in 2014 by Advanced Resources International Inc. The authors received valuable assistance with research for this article from Steve Melzer, Melzer Consulting, Midland, Tex.
The authorsVello A. Kuuskraa ([email protected]) is president of Advanced Resources International Inc. with more than 40 years’ experience with enhanced oil recovery and unconventional gas. He was the 2007-08 SPE Distinguished Lecturer on integrating enhanced oil recovery and carbon dioxide sequestration following his original lecturer season of 1986-87, and he has worked with numerous firms and countries examining how to coordinate the productive use and storage of CO2 with EOR. He holds an MBA (highest distinction) from the Wharton School of the University of Pennsylvania and a BS in applied mathematics-economics from North Carolina State University.
Matthew Wallace ([email protected]), a consultant with Advanced Resources Interna-tional, specializes in analysis of CO2 capture and utilization for CO2-enhanced oil recovery, as well as reservoir modeling and analysis of CO2-enhanced oil recovery operations. Most recently, he has contributed studies for the US Depart-ment of Energy on the development and implementation of next-generation CO2-enhanced oil recovery technology. Wallace holds a degree in environmental studies from Washington & Lee University, Lexington, Va.
TECHNOLOGY
the previous OGJ survey, published in 2012 (OGJ, Apr. 2, 2012, p. 56). Production from this technique, accounts for 38% of US output from EOR.
Production from steam injection has decreased by 6% from 2012.
Miscible CO2 continues to eclipse steam injection in Oil &
Gas Journal’s 2014 EOR/Heavy Oil Survey.Production from US miscible CO
2 floods totals 292,735 b/d
vs. 284,725 b/d for steam, according to the survey (Table 1).The miscible CO
Miscible CO2 dominates US EOR in project totals at 109
in 2014 (Table 2). The 2012 total in this category was 112.The number of steam projects remains at 48 in 2014.Total oil production by EOR in the US is now 778,048,
according to OGJ’s survey, up 2% from 2012.Tables A-E show survey results for projects in the US and
around the world.
Oil & Gas Journal prepared the EOR/Heavy Oil Survey this year with the help of Advanced Resources International Inc., Arlington, Va., which supplemented survey results with information about specific projects and contributed the ac-companying article on the outlook for CO
2-EOR. Steve Mel-
zer of Melzer Consulting, Midland, provided valuable assis-tance.
SPECIALREPORT
2014 worldwide EOR survey
GUIDE TO EOR TABLES
A. Planned EOR projectsB. Producing thermal EOR in USC. Producing CO2, other gas, and chemical EOR in USD. Producing Canadian EOR projectsE. Producing EOR outside of US and Canada
Size, Depth, Gravity, StartType and operator Field Location Pay zone acres ft °API date
CO2 immiscibleAnadarko Sussex Wyoming, Natrona County Tensleep 1,598 9,000 29.5 6/14Denbury Resources Webster Texas, Harris County Frio 4,446 6,000 29 2015
Polymer Belayim Petroleum Company Belayim Land Egypt, Sinai, Gulf of Suez Belayim Formation, Fieran Member, Zone II–A 5,560 7,200 20.5 4/14 Combustion BP Clair UK, West of Shetland Clair Group 14,000 5,577 25.2 2016
PLANNED PROJECTS TABLE A
ABBREVIATIONSFormation type Previous production Project maturity Project evaluation Project scope
S: Sandstone Prim.: Primary JS: Just started TETT: Too early to tell P: Pilot projectLS: Limestone WF: Waterflood HF: Half finished Prom.: Promising FW: Field–wideDolo.: Dolomite GI: Gas injection NC: Nearing completion Succ.: Successful LW: Lease–wideCongl.: Conglomerate C: Cyclic steam C: Completed Disc.: Discouraging RW: Reservoir–wideTripol.: Tripolite HW: Hot water PP: Postponed None: Not evaluated Exp. L: Expansion likelyUS: Unconsolidated sand SS: Steam soak Term.: Terminated Exp. UL: Expansion unlikely S: Steam Del.: Deleted SD: Steam drive TS: Temporarily suspended SF: Steam flood HC: Hydrocarbon
Leena KoottungalSurvey Editor/News Writer
TECHNOLOGY
SteamAera Energy South Belridge Calif. Kern 1995 155 350 245 Diatomite Opal A Tripol. 60 1–5 1,000–1,800 28–30 2–50 110 WF 45 20 JS 15,000 3,000 Prom. Yes PAera Energy Coalinga Calif. Fresno 1965 540 468 93 Temblor S 32 200–2,500 825–1650 12–13 2,000–10,000 84–98 Prim. 60 10 HF 4,917 4,917 Succ. Yes FWAera Energy Coalinga Calif. Fresno 1987 290 104 21 Etchegoin S 34 800–1,000 650–1000 9–10 11,500–28,000 84 Prim. 55 10 HF 1,277 1,277 Succ. Yes FWAera Energy Cymric Calif. Kern 1986 600 130 70 Tulare S 36 1,000–3,000 1,000 11–14 1,000–2,000 95–105 Prim. 65 20 NC 1,900 1,900 Succ. Yes FWAera Energy Lost Hills Calif. Kern 1975 170 450 135 Tulare US 40 1,000–3,000 200 13 1,500–4,000 82 Prim. 60 20 HF 6,300 6,300 Succ. Yes FWAera Energy McKittrick Calif. Kern 3/88 160 100 45 Tulare S 36 1,000–2,000 600 10–12 13,000–51,000 83 Prim. 60 20 HF 1,300 1,300 Succ. Yes FWAera Energy Midway–Sunset Calif. Kern 11/67 1,600 1,351 77 Potter S 30 1,000–4,000 500–1,500 12 91–110 Prim. 60–75 15 NC 7,892 7,892 Succ. Yes FWAera Energy Midway–Sunset Calif. Kern 10/70 1,230 1,189 230 Monarch S 25–32 700–4,000 800–1,500 13 1,500–5,000 85–100 Prim. 50–75 15 NC 10,519 10,519 Succ. Yes FWAera Energy Midway–Sunset Calif. Kern 1984 15 3 Sub Lakeview S 30 4,500 1,300 13 4,000 90 Prim. 60 15 NC 24 24 Succ. Yes LWAera Energy Midway–Sunset Calif. Kern 1969 50 82 17 Metson S 30 3,000 1,100 11 10,000 130 Prim. 75 15 NC 1,091 1,091 Succ. Yes LWAera Energy Midway–Sunset Calif. Kern 1988 73 76 52 Marvic S 30 300 1,100 13 3,500 104 SS 65 15 HF 767 767 Succ. Yes LWAera Energy Midway–Sunset Diatomite Calif. Kern 1997 48 5 Diatomite 65 5 0–1,100 12.5 1,000 90 Prim. 75 HF 62 62 Succ. Yes LWAera Energy Midway–Sunset Calif. Kern 1980 510 510 35 Tulare S 31 300–6,000 1,000 11–14 6,000 90 Prim. 60 16 HF 4,376 4,376 Succ. Yes FWAera Energy San Ardo Calif. Monterey 6/68 125 16 Aurignac S 34.5 2,000 2,300 12 1,000 130 SS 55 27 NC 200 200 Succ. Yes FWAera Energy San Ardo Calif. Monterey 3/80 560 218 57 Lombardi S 32.5 2,260 2,100 11 3,000 125 SS 55 27 HF 9,113 9,113 Succ. Yes FW Berry Midway–Sunset Calif. Kern 11/02 15 35 20 Tulare S 30 3,500 800 10 10,000 90 CS 60 23 JS 1,000 750 Succ. Yes RWBerry North Midway–Sunset Calif. Kern 1965 160 125 Potter S 30 3,000 1,300 14 4,000 85 Prim. 70 15 NC 550 400 Succ. Yes FWBerry South Midway–Sunset Calif. Kern 1964 600 1,200 Monarch S 30 2,000 1,000 13 8,000 80 Prim. 70 15 HF 10,000 7,000 Succ. Yes FWBerry Placerita Calif. Los Angeles 1987 120 50 58 Lower Kraft S 27 1,500 1,800 13 10,000 90 Prim./Cyclic 60 HF 3,000 2,700 Succ. Yes FW, RW, Exp. LBerry Midway–Sunset South Calif. Kern 2005 40 50 4 Main 10–10 S 30 1,500 1,700 13 8,000 80 Prim./Cyclic 60 JS 400 300 TETT RWBerry Poso Creek Calif. Kern 2005 200 77 3 Etchegoin/Chanac S 33 4,000 1,200 13 2,800 110 Cyclic 50 JS 700 650 Prom. FWBerry North Midway–Sunset Calif. Kern 2006 100 87 Diatomite Tripol. 65 1 800 14 SD 65 JS 1,530 1,530 Prom. TETT Exp. L, LWBerry Midway–Sunset South Calif. Kern 2007 10 4 Diatomite Tripol. 65 1 1,100 14 4,000 90 60 JS 25 TETT TETT Exp. L, LWBerry Midway–Sunset South Calif. Kern 2007 60 10 1 Monarch S 30 800 1,400 14 4,000 90 C 65 JS 200 TETT TETT Exp. L, LW Carrizo Camp Hill Tex. Anderson 12/09 125 80 25 Carrizo S 37 3,500 450–500 19 1,200 75 Prim. 65 29 JS 60 100 TETT TETT LW Chevron Cymric 1Y Calif. Kern 1/80 380 510 Antelope 58 5 1,500 13 110 Prim. 20–60 NC 21,200 21,200 Succ. Yes LWChevron Cymric Calif. Kern 5/75 552 360 80 Tulare S 34.8 2,700 1,200 12 5,200 100 SS 53 18 HF 10,200 10,200 Succ. Yes LWChevron Midway Calif. Kern 1964 1,214 2,039 225 Potter US 30 3,000 1,500 12 4,000 100 C 60 15 HF 21,000 21,000 Succ. Yes FWChevron Midway Calif. Kern 1982 80 123 3 Tulare US 31 1,300 1,500 11 5,000 100 Prim. 50 43 HF 500 500 Succ. Yes Exp. LChevron Midway Calif. Kern 1970 1,200 711 69 Spellacy US 30 2,250 1,500 12 5,000 100 Prim. 60 20 HF 9,400 9,400 Succ. Yes Exp. LChevron West Coalinga Calif. Fresno 6/90 1,291 541 132 Temblor S 34 1,510 1,640 14 3,720 100 SS 44 14 HF 6,558 6,558 Succ. Yes RWChevron Kern River Calif. Kern 9/68 9,660 8,692 1,219 Kern River S 32 2,000 1,000 13 4,000 90 Prim. 50 15 HF 86,000 86,000 Succ. Yes FWChevron San Ardo Calif. Monterey 7/87 125 92 13 Lombardi S 34 6,700 1,900 12 1,200 135 C 46 15 HF 2,750 2,750 Succ. Yes P (Exp. L) Derek Oil & Gas Corp. LAK Ranch Wyo. Newcastle 4/04 20 1 3 Newcastle S 22 100 1,000 16 20 54 NA 85 60 JS 40 40 TETT TETT PDerek Oil & Gas Corp. Newcastle Wyo. Weston 3/07 30 8 4 Newcastle Sandstone S 22 100 800 20 20 54 SD 85 60 C 30 30 Prom. P ExxonMobil South Belridge Calif. Kern 12/87 90 48 24 Tulare S 38 2,000 1,250 13 450 95 HF 1,000 800 Succ. Yes FW MegaWest Energy Corp. Deerfield Mo. Vernon 3/08 40 110 38 Warner S 22 500 250 17.6 2,900 55 60 20 JS 180 180 TETT break Exp. L. even Naftex Edison 27–RT Calif. Kern 7/77 30 65 29 Chanac S 30 2,800 1,000 14 2,000 90 Prim. 50 15 NC 550 550 Succ. Yes FW Occidental Kern Front Calif. Kern 1981 3,380 697 122 Etchegoin & Chanac S 30 2,000 1,800 14.8 1,525 95 Prim. 45 15 HF 10,500 8,500 Succ. Yes FWOccidental North Antelope Hills Calif. Kern 1980 300 82 27 Packwood & Point S 32 1,500 1,200 14 1,400 80 Prim. 50 10 HF 629 500 Succ. Yes FW of Rocks Occidental Lost Hills Calif. Kern 2008 324 231 67 Tulare US 40.3 3,048 175 12.7 2,200 75 C 55 15 JS 3,270 3,000 Prom Yes Exp. LOccidental Lost Hills Calif. Kern 2011 30 42 10 Etchegoin US 39.2 955 300 13.9 1,000 80 C 48 15 JS 330 330 Prom Yes Exp. L Seneca Resources Midway–Sunset South Calif. Kern 9/01 90 45 40 Antelope S 34 200–1,500 900 –1,400 15–16 345 100 Prim. 80 60 NC 360 345 Succ. Yes FWSeneca Resources Midway–Sunset South Calif. Kern 6/02 94 17 17 Antelope S 34 500–2,000 450 11 20,000 80 NA 85 60 JS 200 200 TETT TETT P (Exp. L)Seneca Resources Midway–Sunset Calif. Kern 1968 320 800 Potter Sand US 37 1,000–10,000 1,100–1,700 12 3,000 100 Prim. 65 20 HF 6,000 4,500 Succ. RW Stockdale Kern Front Calif. Kern 2/93 160 54 6 Etchegoin S 30 1,000 2,000 13 80 SS 70 JS 700 550 Succ. Yes Exp. L Tidelands Wilmington (Parcel A) Calif. Los Angeles 6/96 44 3 2 S Tar US 31 1,000 2,300 13 300 125 WF 58 28 JS 350 350 Succ. P
Hot water Chevron San Ardo Calif. Monterey 7/87 700 7 3 Aurignac S 32 2,000 2,100 12 900 135 SF 15 10 NC 253 226 Succ. Yes LWChevron West Coalinga Calif. Fresno 5/73 780 194 180 Temblor S 34 1,500 1,350 14 3,350 100 SS 48 15 1,450 1,450 Succ. Yes RW
Combustion Bayou State Bellevue La. Bossier 1970 200 115 15 Nacatoch S 32 650 400 19 660 Prim. 94 49 HF 240 240 Succ. Yes FW Continental Resources Medicine Pole Hills ND Bowman 1985 8,960 13 9 Red River B & C Dolo. 17 15 9,500 38 2 230 Prim. 52 30 C 394 394 Succ. Yes FWContinental Resources West Medicine Pole Unit ND Bowman 2001 14,335 22 6 Red River B & C Dolo. 17 10 9,500 33 2 215 Prim. 50 33 C 981 981 Succ. Yes FWContinental Resources South Medicine Pole Unit ND Bowman 2003 11,500 11 7 Red River B Dolo. 17 10 9,200 33 2 220 Prim. 50 30 C 405 405 Succ. Yes FWContinental Resources Cedar Hills North Unit ND Bowman 2002 51,200 117 121 Red River Dolo. 18 10 9,000 33 2 215 Prim. 55 26 C 12,733 12,733 Succ. Yes FWContinental Resources West Cedar Hills Unit MT Fallon 2003 7,800 10 5 Red River B Dolo. 17 10 9,000 33 2 215 Prim. 55 26 C 581 581 Succ. Yes FWContinental Resources Buffalo SD Harding 1979 7,680 13 7 Red River B Dolo. 20 10 8,450 31 2 215 Prim. 55 20 C 465 465 Succ. Yes FWContinental Resources West Buffalo SD Harding 1987 4,640 11 6 Red River B Dolo. 20 10 8,450 32 2 215 Prim. 55 20 C 357 357 Succ. Yes FWContinental Resources South Buffalo SD Harding 1983 20,800 35 13 Red River B Dolo. 20 10 8,450 31 2 215 Prim. 55 20 C 805 805 Succ. Yes FW Encore Acquisition Pennel Phase 1 Mont. Fallon 2002 2,924 22 8 Red River A Dolo. 17 10 8,800 33 1.44 200 WF 75 39 JS 429 160 Succ. Yes Exp. LEncore Acquisition Pennel Phase 2 Mont. Fallon 2002 10,010 56 24 Red River A Dolo. 17 10 8,800 33 1.44 200 WF 85 46 JS 1,550 100 Prom. Yes Exp. LEncore Acquisition Little Beaver Mont. Fallon 2002 10,400 57 29 Red River A & B Dolo. 17 10 8,300 33 1.44 200 WF 83 60 JS 1,650 750 Prom. Yes Exp. L
PRODUCING THERMAL EOR IN US TABLE B No. No. Poros–Type and Start Area, wells wells Forma– ity,operator Field State County date acres prod. inj. Pay zone tion %
TECHNOLOGY
SteamAera Energy South Belridge Calif. Kern 1995 155 350 245 Diatomite Opal A Tripol. 60 1–5 1,000–1,800 28–30 2–50 110 WF 45 20 JS 15,000 3,000 Prom. Yes PAera Energy Coalinga Calif. Fresno 1965 540 468 93 Temblor S 32 200–2,500 825–1650 12–13 2,000–10,000 84–98 Prim. 60 10 HF 4,917 4,917 Succ. Yes FWAera Energy Coalinga Calif. Fresno 1987 290 104 21 Etchegoin S 34 800–1,000 650–1000 9–10 11,500–28,000 84 Prim. 55 10 HF 1,277 1,277 Succ. Yes FWAera Energy Cymric Calif. Kern 1986 600 130 70 Tulare S 36 1,000–3,000 1,000 11–14 1,000–2,000 95–105 Prim. 65 20 NC 1,900 1,900 Succ. Yes FWAera Energy Lost Hills Calif. Kern 1975 170 450 135 Tulare US 40 1,000–3,000 200 13 1,500–4,000 82 Prim. 60 20 HF 6,300 6,300 Succ. Yes FWAera Energy McKittrick Calif. Kern 3/88 160 100 45 Tulare S 36 1,000–2,000 600 10–12 13,000–51,000 83 Prim. 60 20 HF 1,300 1,300 Succ. Yes FWAera Energy Midway–Sunset Calif. Kern 11/67 1,600 1,351 77 Potter S 30 1,000–4,000 500–1,500 12 91–110 Prim. 60–75 15 NC 7,892 7,892 Succ. Yes FWAera Energy Midway–Sunset Calif. Kern 10/70 1,230 1,189 230 Monarch S 25–32 700–4,000 800–1,500 13 1,500–5,000 85–100 Prim. 50–75 15 NC 10,519 10,519 Succ. Yes FWAera Energy Midway–Sunset Calif. Kern 1984 15 3 Sub Lakeview S 30 4,500 1,300 13 4,000 90 Prim. 60 15 NC 24 24 Succ. Yes LWAera Energy Midway–Sunset Calif. Kern 1969 50 82 17 Metson S 30 3,000 1,100 11 10,000 130 Prim. 75 15 NC 1,091 1,091 Succ. Yes LWAera Energy Midway–Sunset Calif. Kern 1988 73 76 52 Marvic S 30 300 1,100 13 3,500 104 SS 65 15 HF 767 767 Succ. Yes LWAera Energy Midway–Sunset Diatomite Calif. Kern 1997 48 5 Diatomite 65 5 0–1,100 12.5 1,000 90 Prim. 75 HF 62 62 Succ. Yes LWAera Energy Midway–Sunset Calif. Kern 1980 510 510 35 Tulare S 31 300–6,000 1,000 11–14 6,000 90 Prim. 60 16 HF 4,376 4,376 Succ. Yes FWAera Energy San Ardo Calif. Monterey 6/68 125 16 Aurignac S 34.5 2,000 2,300 12 1,000 130 SS 55 27 NC 200 200 Succ. Yes FWAera Energy San Ardo Calif. Monterey 3/80 560 218 57 Lombardi S 32.5 2,260 2,100 11 3,000 125 SS 55 27 HF 9,113 9,113 Succ. Yes FW Berry Midway–Sunset Calif. Kern 11/02 15 35 20 Tulare S 30 3,500 800 10 10,000 90 CS 60 23 JS 1,000 750 Succ. Yes RWBerry North Midway–Sunset Calif. Kern 1965 160 125 Potter S 30 3,000 1,300 14 4,000 85 Prim. 70 15 NC 550 400 Succ. Yes FWBerry South Midway–Sunset Calif. Kern 1964 600 1,200 Monarch S 30 2,000 1,000 13 8,000 80 Prim. 70 15 HF 10,000 7,000 Succ. Yes FWBerry Placerita Calif. Los Angeles 1987 120 50 58 Lower Kraft S 27 1,500 1,800 13 10,000 90 Prim./Cyclic 60 HF 3,000 2,700 Succ. Yes FW, RW, Exp. LBerry Midway–Sunset South Calif. Kern 2005 40 50 4 Main 10–10 S 30 1,500 1,700 13 8,000 80 Prim./Cyclic 60 JS 400 300 TETT RWBerry Poso Creek Calif. Kern 2005 200 77 3 Etchegoin/Chanac S 33 4,000 1,200 13 2,800 110 Cyclic 50 JS 700 650 Prom. FWBerry North Midway–Sunset Calif. Kern 2006 100 87 Diatomite Tripol. 65 1 800 14 SD 65 JS 1,530 1,530 Prom. TETT Exp. L, LWBerry Midway–Sunset South Calif. Kern 2007 10 4 Diatomite Tripol. 65 1 1,100 14 4,000 90 60 JS 25 TETT TETT Exp. L, LWBerry Midway–Sunset South Calif. Kern 2007 60 10 1 Monarch S 30 800 1,400 14 4,000 90 C 65 JS 200 TETT TETT Exp. L, LW Carrizo Camp Hill Tex. Anderson 12/09 125 80 25 Carrizo S 37 3,500 450–500 19 1,200 75 Prim. 65 29 JS 60 100 TETT TETT LW Chevron Cymric 1Y Calif. Kern 1/80 380 510 Antelope 58 5 1,500 13 110 Prim. 20–60 NC 21,200 21,200 Succ. Yes LWChevron Cymric Calif. Kern 5/75 552 360 80 Tulare S 34.8 2,700 1,200 12 5,200 100 SS 53 18 HF 10,200 10,200 Succ. Yes LWChevron Midway Calif. Kern 1964 1,214 2,039 225 Potter US 30 3,000 1,500 12 4,000 100 C 60 15 HF 21,000 21,000 Succ. Yes FWChevron Midway Calif. Kern 1982 80 123 3 Tulare US 31 1,300 1,500 11 5,000 100 Prim. 50 43 HF 500 500 Succ. Yes Exp. LChevron Midway Calif. Kern 1970 1,200 711 69 Spellacy US 30 2,250 1,500 12 5,000 100 Prim. 60 20 HF 9,400 9,400 Succ. Yes Exp. LChevron West Coalinga Calif. Fresno 6/90 1,291 541 132 Temblor S 34 1,510 1,640 14 3,720 100 SS 44 14 HF 6,558 6,558 Succ. Yes RWChevron Kern River Calif. Kern 9/68 9,660 8,692 1,219 Kern River S 32 2,000 1,000 13 4,000 90 Prim. 50 15 HF 86,000 86,000 Succ. Yes FWChevron San Ardo Calif. Monterey 7/87 125 92 13 Lombardi S 34 6,700 1,900 12 1,200 135 C 46 15 HF 2,750 2,750 Succ. Yes P (Exp. L) Derek Oil & Gas Corp. LAK Ranch Wyo. Newcastle 4/04 20 1 3 Newcastle S 22 100 1,000 16 20 54 NA 85 60 JS 40 40 TETT TETT PDerek Oil & Gas Corp. Newcastle Wyo. Weston 3/07 30 8 4 Newcastle Sandstone S 22 100 800 20 20 54 SD 85 60 C 30 30 Prom. P ExxonMobil South Belridge Calif. Kern 12/87 90 48 24 Tulare S 38 2,000 1,250 13 450 95 HF 1,000 800 Succ. Yes FW MegaWest Energy Corp. Deerfield Mo. Vernon 3/08 40 110 38 Warner S 22 500 250 17.6 2,900 55 60 20 JS 180 180 TETT break Exp. L. even Naftex Edison 27–RT Calif. Kern 7/77 30 65 29 Chanac S 30 2,800 1,000 14 2,000 90 Prim. 50 15 NC 550 550 Succ. Yes FW Occidental Kern Front Calif. Kern 1981 3,380 697 122 Etchegoin & Chanac S 30 2,000 1,800 14.8 1,525 95 Prim. 45 15 HF 10,500 8,500 Succ. Yes FWOccidental North Antelope Hills Calif. Kern 1980 300 82 27 Packwood & Point S 32 1,500 1,200 14 1,400 80 Prim. 50 10 HF 629 500 Succ. Yes FW of Rocks Occidental Lost Hills Calif. Kern 2008 324 231 67 Tulare US 40.3 3,048 175 12.7 2,200 75 C 55 15 JS 3,270 3,000 Prom Yes Exp. LOccidental Lost Hills Calif. Kern 2011 30 42 10 Etchegoin US 39.2 955 300 13.9 1,000 80 C 48 15 JS 330 330 Prom Yes Exp. L Seneca Resources Midway–Sunset South Calif. Kern 9/01 90 45 40 Antelope S 34 200–1,500 900 –1,400 15–16 345 100 Prim. 80 60 NC 360 345 Succ. Yes FWSeneca Resources Midway–Sunset South Calif. Kern 6/02 94 17 17 Antelope S 34 500–2,000 450 11 20,000 80 NA 85 60 JS 200 200 TETT TETT P (Exp. L)Seneca Resources Midway–Sunset Calif. Kern 1968 320 800 Potter Sand US 37 1,000–10,000 1,100–1,700 12 3,000 100 Prim. 65 20 HF 6,000 4,500 Succ. RW Stockdale Kern Front Calif. Kern 2/93 160 54 6 Etchegoin S 30 1,000 2,000 13 80 SS 70 JS 700 550 Succ. Yes Exp. L Tidelands Wilmington (Parcel A) Calif. Los Angeles 6/96 44 3 2 S Tar US 31 1,000 2,300 13 300 125 WF 58 28 JS 350 350 Succ. P
Hot water Chevron San Ardo Calif. Monterey 7/87 700 7 3 Aurignac S 32 2,000 2,100 12 900 135 SF 15 10 NC 253 226 Succ. Yes LWChevron West Coalinga Calif. Fresno 5/73 780 194 180 Temblor S 34 1,500 1,350 14 3,350 100 SS 48 15 1,450 1,450 Succ. Yes RW
Combustion Bayou State Bellevue La. Bossier 1970 200 115 15 Nacatoch S 32 650 400 19 660 Prim. 94 49 HF 240 240 Succ. Yes FW Continental Resources Medicine Pole Hills ND Bowman 1985 8,960 13 9 Red River B & C Dolo. 17 15 9,500 38 2 230 Prim. 52 30 C 394 394 Succ. Yes FWContinental Resources West Medicine Pole Unit ND Bowman 2001 14,335 22 6 Red River B & C Dolo. 17 10 9,500 33 2 215 Prim. 50 33 C 981 981 Succ. Yes FWContinental Resources South Medicine Pole Unit ND Bowman 2003 11,500 11 7 Red River B Dolo. 17 10 9,200 33 2 220 Prim. 50 30 C 405 405 Succ. Yes FWContinental Resources Cedar Hills North Unit ND Bowman 2002 51,200 117 121 Red River Dolo. 18 10 9,000 33 2 215 Prim. 55 26 C 12,733 12,733 Succ. Yes FWContinental Resources West Cedar Hills Unit MT Fallon 2003 7,800 10 5 Red River B Dolo. 17 10 9,000 33 2 215 Prim. 55 26 C 581 581 Succ. Yes FWContinental Resources Buffalo SD Harding 1979 7,680 13 7 Red River B Dolo. 20 10 8,450 31 2 215 Prim. 55 20 C 465 465 Succ. Yes FWContinental Resources West Buffalo SD Harding 1987 4,640 11 6 Red River B Dolo. 20 10 8,450 32 2 215 Prim. 55 20 C 357 357 Succ. Yes FWContinental Resources South Buffalo SD Harding 1983 20,800 35 13 Red River B Dolo. 20 10 8,450 31 2 215 Prim. 55 20 C 805 805 Succ. Yes FW Encore Acquisition Pennel Phase 1 Mont. Fallon 2002 2,924 22 8 Red River A Dolo. 17 10 8,800 33 1.44 200 WF 75 39 JS 429 160 Succ. Yes Exp. LEncore Acquisition Pennel Phase 2 Mont. Fallon 2002 10,010 56 24 Red River A Dolo. 17 10 8,800 33 1.44 200 WF 85 46 JS 1,550 100 Prom. Yes Exp. LEncore Acquisition Little Beaver Mont. Fallon 2002 10,400 57 29 Red River A & B Dolo. 17 10 8,300 33 1.44 200 WF 83 60 JS 1,650 750 Prom. Yes Exp. L
PRODUCING THERMAL EOR IN US TABLE B Tot. Enh. Perme– Depth, Gravity, Oil, Prev. Satur. Satur. Proj. prod., prod., Proj. Project ability, md ft °API Oil, cp °F. prod. % start % end matur. b/d b/d eval. Profit scope
TECHNOLOGY
Anadarko Patrick Draw Monell Wyo. 9/1/03 5,800 S Prim./WF C Succ. Yes RW, Exp. LAnadarko Salt Creek Southern Unit Wyo. Natrona 2012 570 42 26 Frontier, Wall First Oil Creek 1 Member SS 17 25 1,750 39 0.6 105 Prim. 32 24 C 100 10/12 Succ. Yes RW, Exp LAnadarko Salt Creek Southern Unit Wyo. Natrona 2012 1,325 48 32 Frontier, Wall First Oil Creek 2 Member SS 18 30 2,200 39 0.6 112 Prim. 32 24 C 150 10/12 Succ. Yes RW, Exp LAnadarko Salt Creek Ph 1–8 Wyo. Natrona 1/04 6,000 321 279 Wall Creek 2 (Frontier) S 18 75 1,900 37 0.6 105 WF 39 24 H 9,500 9,500 Succ. Yes RW, Exp LAnadarko Salt Creek Ph 7 Wyo. Natrona 1/10 600 40 27 Wall Creek 1 (Frontier) SS 17 30 1,600 35 0.6 99 Prim./WF 32 24 C 1,200 1,200 Succ. Yes RW, Exp LAnadarko Sussex Wyo. Johnson 12/04 25 4 1 Tensleep S 10 16 9,000 30 2.0 200 WF C Prom. P Apache Adair Tex. Gaines 1997 5,338 90 61 San Andres Dolo. 14.1 4 4,789 34 104 WF HF 2,350 Succ. Apache Adair Tex. Gaines 2004 2,550 11 11 Wolfcamp Dolo. 12.4 28 8,500 42 126 WF JS 420 Prom. Exp. LApache Roberts Tex. 2012 13,600 222 186 San Andres Dolo. 8.5 2,300 Apache Slaughter Tex. Hockley, Terry 5/85 569 43 21 San Andres Dolo. 12.5 6 4,900 32 1 110 WF HF 600 580 Succ. Yes TETTApache Slaughter Tex. Hockley, Cochran 6/89 8,559 259 164 San Andres Dolo. 10 3 5,000 32 2 107 WF 45 8 JS 5,800 4,000 Succ. Yes LW Breitburn Energy Postle–PUMU Okla. 11/1/95 4,032 43 36 Morrow SS 16 10–40 6,200 40 1.3 145 WF 75 25 912 912 Succ. Breitburn Energy Postle–HMAU Okla. 11/1/95 3,396 38 29 Morrow SS 16 10–40 6,200 40 1.3 145 WF 75 25 619 619 Succ. Breitburn Energy Poslte–WHMU Okla. 1/1/98 7,724 96 74 Morrow SS 16 10–40 6,200 40 1.3 145 WF 75 25 2,429 2,429 Succ. Breitburn Energy Postle–HMU Okla. 8/1/07 5,415 61 43 Morrow SS 16 10–40 6,200 40 1.3 145 WF 75 25 3,110 3,110 Succ. Breitburn Energy Northeast Hardesty Okla. Chaparral Energy NW Velma Hoxbar Okla. 9/1/10 410 26 9 Hoxbar S 26 280 2,228 27 2 84 WF 77 JS Succ. Yes FWChaparral Energy Camrick Okla. Beaver 4/01 2,320 38 32 Morrow S 15 63 7,260 38.5 2 152 WF 52 JS 1,510 1,410 Succ. Yes Chaparral Energy North Perryton Tex. Ochiltree 12/07 2,500 12 6 Upper Morrow S 15.2 63 7,300 38 2 152 WF 52 JS 380 350 TETT TETT FWChaparral Energy Albert Spicer Unit Tex. Ochiltree 10/9 577 5 2 Upper Morrow S 21 50 8,060 39 2 177 WF 51 JS 6 TETT TETT Phase 1, 2, 3Chaparral Energy Booker Trosper Unit Tex. Ochiltree 10/9 1,325 3 3 Upper Morrow S 20 50 8,060 39 2 177 WF 56 JS 6 TETT TETT Phase 1Chaparral Energy Gramstorff Unit Tex. Ochiltree 10/9 829 5 3 Upper Morrow S 21 109 8,060 39 2 177 WF 57 JS 19 TETT TETT Chaparral Energy Farnsworth Tex. 12/15/10 10,300 80 11 Upper Morrow S 14 48 7,940 38 0.99 170 WF 60 25 JS Succ. Yes 50% of fieldChaparral Energy Burbank Okla. 6/6/13 50,000 650 500 Burbank 17 50 3,000 37 3 122 WF 70 30 JS TETT Phase 1 of 16 Chevron Rangely Weber Sand Colo. Rio Blanco 10/86 18,000 378 262 Weber SS S 12 10 6,000 35 2 160 WF 38 29 JS 15,300 11,600 Succ. Yes Chevron Mabee Tex. Andrews–Martin 1/92 3,600 220 85 San Andres Dolo. 9 4 4,700 32 2 104 WF 36 10 NC 3,100 2,000 Succ. Yes Chevron Slaughter Sundown Tex. Hockley Co 1/94 5,500 155 144 San Andres Dolo. 11 6 4,950 33 1 105 WF 41 25 HF 5,950 4,747 Succ. Yes Chevron Vacuum NM Lea Co. 7/97 1,084 48 24 San Andres Dolo. 12 22 4,550 38 1 101 WF 36 15 HF 4,500 2,950 Succ. Yes FWChevron Dollarhide (Devonian) Unit Tex. Andrews 5/85 6,183 83 66 Devonian Dolo./Tri- politic chert 13.5 9 8,000 40 0 122 Prim./WF 35 22 HF 2,420 1,970 Succ. Yes Exp. LChevron Dollarhide (Clearfork “AB”) Unit Tex. Andrews 11/95 160 21 4 Clearfork Dolo. 11.5 4 6,500 40 1 113 Prim./WF 30 10 JS 230 124 Prom. Yes LWChevron Reinecke Tex. Borden 1/98 700 32 8 Cisco Canyon Reef LS/Dolo. 10.4 170 6,700 43.5 0.4 139 WF 35 10 JS 977 830 Succ. Yes LW ConocoPhillips South Cowden Tex. Lea 2/81 4,900 43 22 San Andres Dolo. 11.7 11 4,500 38 1 101 Prim. 70 50 JS 450 250 Succ. Yes FWConocoPhillips Vacuum NM Lea 2/81 4,900 192 103 San Andres Dolo. 11.7 11 4,500 38 1 101 Prim. 70 50 HF 6,200 5,200 Succ. Yes Exp. L Core Energy Charlton 6 Mich. Otsego 2006 60 1 1 Silurian–A1/Niagaran LS/Dolo. 8 0.1–100 5,450 43 0.8 103 Prim. 54 44 NC 10 10 Succ. Exp. LCore Energy Charlton 30–31 Mich. Otsego 2005 285 2 1 Silurian–A1/Niagaran LS/Dolo. 8 0.1–100 5,450 42 0.8 103 Prim. 47 40 HF 75 75 Succ. FWCore Energy Dover 33 Mich. Otsego 1996 85 2 1 Silurian–A1/Niagaran LS/Dolo. 5 0.1–100 5,500 43 0.8 100 Prim 51 40 C Succ. FWCore Energy Dover 35 Mich. Otsego 2004 70 3 2 Silurian–A1/Niagaran LS/Dolo. 7 0.1–100 5,500 41 0.8 101 Prim. 51 35 HF 210 210 Succ. FWCore Energy Dover 36 Mich. Otsego 1997 190 1 2 Silurian–A1/Niagaran LS/Dolo. 7 0.1–100 5,600 42 0.8 102 Prim. 52 42 HF 70 70 Succ. FWCore Energy Chester 5 Mich. Otsego 2010 120 2 1 Silurian–A1/Niagaran LS/Dolo. 11 0.1–100 5,500 42 0.8 101 Prim. 50 40 JS Succ. Exp. LCore Energy Charlton 19 Mich. 2014 75 2 1 Silurian–A1/Niagaran LS/Dolo. 9 0.1–100 5,200 43 0.8 102 Prim. 38 32 JS TETT FWCore Energy Chester 16 Mich. 2014 185 2 1 Silurian–A1/Niagaran LS/Dolo. 8 0.1–100 5,800 42 0.8 102 WF 49 42 JS TETT FWCore Energy Chester 2 Mich. 2009 75 1 1 Silurian–A1/Niagaran LS/Dolo. 5 0.1–100 5,600 42 0.8 102 Prim. 52 37 JS TETT FW Denbury Resources Bell Creek Mont. Pike 5/13 2,740 26 26 Muddy S 0.23 1035 4,500 36 3 108 Prim./WF JS TETT FWDenbury Resources Little Creek Miss. Powder River 1985 6,200 38 36 Lower Tuscaloosa S 23 90 10,750 40 250 WF 44 NC 1,100 1,100 Succ. FWDenbury Resources Lazy Creek Miss. Lincoln, Pike 12/01 840 8 10 Lower Tuscaloosa S 23.4 65 10,400 39 242 Prim. 27.4 NC 300 300 Succ. Exp. LDenbury Resources Grieve Wyo. Natrona 3/13 2,280 12 10 Muddy S 0.20 247 6,500–6,650 36 1 180 Prim. JS TETT FWDenbury Resources Hastings Tex. Brazoria, Galveston 5/10 4,420 44 32 Frio S 0.3 1,000–2,000 0 36 165 Prim./WF JS TETT Denbury Resources West Mallalieu Miss. Lincoln 11/01 8,240 42 45 Lower Tuscaloosa S 26 75 10,550 40 248 Prim. 44 NC 2,700 2,700 Succ. Denbury Resources East Mallalieu Miss. Pike 12/03 880 13 12 Lower Tuscaloosa S 26 75 10,550 40 248 Prim./WF 52 NC 500 500 Succ. Denbury Resources McComb Miss. Amite 11/03 12,600 25 10 Lower Tuscaloosa S 26 90 10,900 40 250 Prim. 52 HF 1,700 1,700 Prom FWDenbury Resources Smithdale Miss. Lincoln 3/05 4,100 12 5 Lower Tuscaloosa S 23 90 11,000 41 250 Prim. 50 HF 500 500 Succ. Denbury Resources Brookhaven Miss. Lincoln 1/05 10,800 40 37 Lower Tuscaloosa S 25.5 60 10,300 40 250 Prim./GI/WF 47 HF 3,700 3,700 Succ. FWDenbury Resources Martinville Miss. Simpson 3/06 280 3 2 Mooringsport S 18 40 11,550 38 244 WF 55 NC 250 250 Succ. Denbury Resources Martinville Miss. Simpson 3/06 200 4 3 Rodessa S 12 200 11,600 42 250 WF 64 NC 200 200 Succ. FWDenbury Resources Soso Miss. Jones 9/06 1,800 12 9 Rodessa 11,180 S 17 171 11,500 45 228 WF 55 HF 2,500 2,500 Succ. Exp. L.Denbury Resources Soso Miss. Jones 4/06 2,600 28 16 Bailey 11,701 S 17 273 11,950 43 234 WF 50 HF 200 200 Succ. Exp. L.Denbury Resources Cranfield Miss. Adams 07/08 7,754 26 27 Tuscaloosa S 23 100 10,300 39 260 Prim./GI 32 HF 1,500 1,500 Succ. Exp. L.Denbury Resources Lockhart Crossing La. Livingston 12/07 3,500 19 12 Wilcox S 20 30 10,100 40 212 Prim./WF 32 HF 1,500 1,500 Succ. FWDenbury Resources Delhi La. Madison, Richland 11/09 6,189 101 39 Tuscaloosa, Paluxy S 0.3 1,000 3,500 42 0.77 135 Prim./WF JS TETT FWDenbury Resources Oyster Bayou Tex. Chambers 12/10 3,912 29 12 Frio S 25–28 210–2,300 0 39.5 0.49 190 Prim./WF JS TETT FW Devon Beaver Creek Wyo. Fremont 7/08 980 17 17 Madison Dolo. 10 10 11,100 39.5 0.64 232 Prim./WF 60 50 JS 2,700 2,425 Prom. Prom. Exp. L. Energen Resources East Penwell (SA) Unit Tex. Ector 5/96 1,020 49 30 San Andres Dolo. 10 4 4,000 34 2 86 WF 55 40 HF 1,626 827 Succ. Yes Exp. L. ExxonMobil Means (San Andres) Tex. Andrews 11/83 8,500 484 284 San Andres Dolo. 9 20 4,300 29 6 97 WF HF 10,000 8,700 Succ. Yes Exp. L. Fasken Abell (Devonian) Tex. Crane 4/09 809 18 14 Devonian Tripol. 21.9 3 5,300 42 1 105 WF 45 JS 240 200 Prom. Prom. Exp. LFasken Hanford Tex. Gaines 7/86 1,120 23 26 San Andres Dolo. 10.5 4 5,500 32 1 104 Prim. 60.7 18.7 NC 400 400 Succ. Fasken Hanford East Tex. Gaines 3/97 340 7 4 San Andres Dolo. 10 4 5,500 32 1 105 WF 45 19 C 45 45 Succ. Exp. L Fasken Hanford (San Andres) Tex. Gaines 7/09 150 7 4 San Andres Residual Oil Zone Dolo. 10 5 5,700 32 1 105 Prim. 50 JS 280 TETT Exp. LFasken River Bend (Devonian) Tex. Crane 4/09 400 9 7 Devonian Tripol. 23.7 4.5 5,500 42 0.51 105 WF 55 46 JS 290 180 Prom. Prom. Exp. L Great Western Drilling Twofreds Tex. Loving,Ward,Reeves 1/74 4,392 32 9 Delawar, Ramsey S 19.5 32 4,900 36 2 105 WF 50 NC 170 170 Succ. Yes George R. Brown Garza Tex. 11/09 1,778 San Andres 3,000 LW Hess Seminole Unit–Main Pay Zone Tex. Gaines 7/83 15,699 370 110 San Andres Dolo. 12 1.3–123 5,300 35 1 104 WF 84 HF 14,500 14,000 Succ. Yes FWHess Seminole Unit–ROZ Phase 1 Tex. Gaines 7/96 500 15 10 San Andres Dolo. 12 1.3–123 5,500 35 1 104 none 30 HF 1,200 1,200 Prom. Yes Hess Seminole Unit–ROZ Phase 2 Tex. Gaines 4/04 480 16 9 San Andres Dolo. 12 1.3–123 5,500 35 1 104 none 30 HF 1,800 1,800 Prom. Yes PHess Seminole Unit–ROZ Stage 1 Tex. Gaines 10/07 2,320 44 29 San Andres Dolo. 12 1.3–123 5,500 35 1 104 none 30 HF 3,500 3,500 Prom. Yes Exp. L
PRODUCING CO2, OTHER GAS, AND CHEMICAL EOR IN US TABLE C No. No. Poros–Type and Start Area, wells wells Forma– ity,operator Field State County date acres prod. inj. Pay zone tion %
TECHNOLOGY
Anadarko Patrick Draw Monell Wyo. 9/1/03 5,800 S Prim./WF C Succ. Yes RW, Exp. LAnadarko Salt Creek Southern Unit Wyo. Natrona 2012 570 42 26 Frontier, Wall First Oil Creek 1 Member SS 17 25 1,750 39 0.6 105 Prim. 32 24 C 100 10/12 Succ. Yes RW, Exp LAnadarko Salt Creek Southern Unit Wyo. Natrona 2012 1,325 48 32 Frontier, Wall First Oil Creek 2 Member SS 18 30 2,200 39 0.6 112 Prim. 32 24 C 150 10/12 Succ. Yes RW, Exp LAnadarko Salt Creek Ph 1–8 Wyo. Natrona 1/04 6,000 321 279 Wall Creek 2 (Frontier) S 18 75 1,900 37 0.6 105 WF 39 24 H 9,500 9,500 Succ. Yes RW, Exp LAnadarko Salt Creek Ph 7 Wyo. Natrona 1/10 600 40 27 Wall Creek 1 (Frontier) SS 17 30 1,600 35 0.6 99 Prim./WF 32 24 C 1,200 1,200 Succ. Yes RW, Exp LAnadarko Sussex Wyo. Johnson 12/04 25 4 1 Tensleep S 10 16 9,000 30 2.0 200 WF C Prom. P Apache Adair Tex. Gaines 1997 5,338 90 61 San Andres Dolo. 14.1 4 4,789 34 104 WF HF 2,350 Succ. Apache Adair Tex. Gaines 2004 2,550 11 11 Wolfcamp Dolo. 12.4 28 8,500 42 126 WF JS 420 Prom. Exp. LApache Roberts Tex. 2012 13,600 222 186 San Andres Dolo. 8.5 2,300 Apache Slaughter Tex. Hockley, Terry 5/85 569 43 21 San Andres Dolo. 12.5 6 4,900 32 1 110 WF HF 600 580 Succ. Yes TETTApache Slaughter Tex. Hockley, Cochran 6/89 8,559 259 164 San Andres Dolo. 10 3 5,000 32 2 107 WF 45 8 JS 5,800 4,000 Succ. Yes LW Breitburn Energy Postle–PUMU Okla. 11/1/95 4,032 43 36 Morrow SS 16 10–40 6,200 40 1.3 145 WF 75 25 912 912 Succ. Breitburn Energy Postle–HMAU Okla. 11/1/95 3,396 38 29 Morrow SS 16 10–40 6,200 40 1.3 145 WF 75 25 619 619 Succ. Breitburn Energy Poslte–WHMU Okla. 1/1/98 7,724 96 74 Morrow SS 16 10–40 6,200 40 1.3 145 WF 75 25 2,429 2,429 Succ. Breitburn Energy Postle–HMU Okla. 8/1/07 5,415 61 43 Morrow SS 16 10–40 6,200 40 1.3 145 WF 75 25 3,110 3,110 Succ. Breitburn Energy Northeast Hardesty Okla. Chaparral Energy NW Velma Hoxbar Okla. 9/1/10 410 26 9 Hoxbar S 26 280 2,228 27 2 84 WF 77 JS Succ. Yes FWChaparral Energy Camrick Okla. Beaver 4/01 2,320 38 32 Morrow S 15 63 7,260 38.5 2 152 WF 52 JS 1,510 1,410 Succ. Yes Chaparral Energy North Perryton Tex. Ochiltree 12/07 2,500 12 6 Upper Morrow S 15.2 63 7,300 38 2 152 WF 52 JS 380 350 TETT TETT FWChaparral Energy Albert Spicer Unit Tex. Ochiltree 10/9 577 5 2 Upper Morrow S 21 50 8,060 39 2 177 WF 51 JS 6 TETT TETT Phase 1, 2, 3Chaparral Energy Booker Trosper Unit Tex. Ochiltree 10/9 1,325 3 3 Upper Morrow S 20 50 8,060 39 2 177 WF 56 JS 6 TETT TETT Phase 1Chaparral Energy Gramstorff Unit Tex. Ochiltree 10/9 829 5 3 Upper Morrow S 21 109 8,060 39 2 177 WF 57 JS 19 TETT TETT Chaparral Energy Farnsworth Tex. 12/15/10 10,300 80 11 Upper Morrow S 14 48 7,940 38 0.99 170 WF 60 25 JS Succ. Yes 50% of fieldChaparral Energy Burbank Okla. 6/6/13 50,000 650 500 Burbank 17 50 3,000 37 3 122 WF 70 30 JS TETT Phase 1 of 16 Chevron Rangely Weber Sand Colo. Rio Blanco 10/86 18,000 378 262 Weber SS S 12 10 6,000 35 2 160 WF 38 29 JS 15,300 11,600 Succ. Yes Chevron Mabee Tex. Andrews–Martin 1/92 3,600 220 85 San Andres Dolo. 9 4 4,700 32 2 104 WF 36 10 NC 3,100 2,000 Succ. Yes Chevron Slaughter Sundown Tex. Hockley Co 1/94 5,500 155 144 San Andres Dolo. 11 6 4,950 33 1 105 WF 41 25 HF 5,950 4,747 Succ. Yes Chevron Vacuum NM Lea Co. 7/97 1,084 48 24 San Andres Dolo. 12 22 4,550 38 1 101 WF 36 15 HF 4,500 2,950 Succ. Yes FWChevron Dollarhide (Devonian) Unit Tex. Andrews 5/85 6,183 83 66 Devonian Dolo./Tri- politic chert 13.5 9 8,000 40 0 122 Prim./WF 35 22 HF 2,420 1,970 Succ. Yes Exp. LChevron Dollarhide (Clearfork “AB”) Unit Tex. Andrews 11/95 160 21 4 Clearfork Dolo. 11.5 4 6,500 40 1 113 Prim./WF 30 10 JS 230 124 Prom. Yes LWChevron Reinecke Tex. Borden 1/98 700 32 8 Cisco Canyon Reef LS/Dolo. 10.4 170 6,700 43.5 0.4 139 WF 35 10 JS 977 830 Succ. Yes LW ConocoPhillips South Cowden Tex. Lea 2/81 4,900 43 22 San Andres Dolo. 11.7 11 4,500 38 1 101 Prim. 70 50 JS 450 250 Succ. Yes FWConocoPhillips Vacuum NM Lea 2/81 4,900 192 103 San Andres Dolo. 11.7 11 4,500 38 1 101 Prim. 70 50 HF 6,200 5,200 Succ. Yes Exp. L Core Energy Charlton 6 Mich. Otsego 2006 60 1 1 Silurian–A1/Niagaran LS/Dolo. 8 0.1–100 5,450 43 0.8 103 Prim. 54 44 NC 10 10 Succ. Exp. LCore Energy Charlton 30–31 Mich. Otsego 2005 285 2 1 Silurian–A1/Niagaran LS/Dolo. 8 0.1–100 5,450 42 0.8 103 Prim. 47 40 HF 75 75 Succ. FWCore Energy Dover 33 Mich. Otsego 1996 85 2 1 Silurian–A1/Niagaran LS/Dolo. 5 0.1–100 5,500 43 0.8 100 Prim 51 40 C Succ. FWCore Energy Dover 35 Mich. Otsego 2004 70 3 2 Silurian–A1/Niagaran LS/Dolo. 7 0.1–100 5,500 41 0.8 101 Prim. 51 35 HF 210 210 Succ. FWCore Energy Dover 36 Mich. Otsego 1997 190 1 2 Silurian–A1/Niagaran LS/Dolo. 7 0.1–100 5,600 42 0.8 102 Prim. 52 42 HF 70 70 Succ. FWCore Energy Chester 5 Mich. Otsego 2010 120 2 1 Silurian–A1/Niagaran LS/Dolo. 11 0.1–100 5,500 42 0.8 101 Prim. 50 40 JS Succ. Exp. LCore Energy Charlton 19 Mich. 2014 75 2 1 Silurian–A1/Niagaran LS/Dolo. 9 0.1–100 5,200 43 0.8 102 Prim. 38 32 JS TETT FWCore Energy Chester 16 Mich. 2014 185 2 1 Silurian–A1/Niagaran LS/Dolo. 8 0.1–100 5,800 42 0.8 102 WF 49 42 JS TETT FWCore Energy Chester 2 Mich. 2009 75 1 1 Silurian–A1/Niagaran LS/Dolo. 5 0.1–100 5,600 42 0.8 102 Prim. 52 37 JS TETT FW Denbury Resources Bell Creek Mont. Pike 5/13 2,740 26 26 Muddy S 0.23 1035 4,500 36 3 108 Prim./WF JS TETT FWDenbury Resources Little Creek Miss. Powder River 1985 6,200 38 36 Lower Tuscaloosa S 23 90 10,750 40 250 WF 44 NC 1,100 1,100 Succ. FWDenbury Resources Lazy Creek Miss. Lincoln, Pike 12/01 840 8 10 Lower Tuscaloosa S 23.4 65 10,400 39 242 Prim. 27.4 NC 300 300 Succ. Exp. LDenbury Resources Grieve Wyo. Natrona 3/13 2,280 12 10 Muddy S 0.20 247 6,500–6,650 36 1 180 Prim. JS TETT FWDenbury Resources Hastings Tex. Brazoria, Galveston 5/10 4,420 44 32 Frio S 0.3 1,000–2,000 0 36 165 Prim./WF JS TETT Denbury Resources West Mallalieu Miss. Lincoln 11/01 8,240 42 45 Lower Tuscaloosa S 26 75 10,550 40 248 Prim. 44 NC 2,700 2,700 Succ. Denbury Resources East Mallalieu Miss. Pike 12/03 880 13 12 Lower Tuscaloosa S 26 75 10,550 40 248 Prim./WF 52 NC 500 500 Succ. Denbury Resources McComb Miss. Amite 11/03 12,600 25 10 Lower Tuscaloosa S 26 90 10,900 40 250 Prim. 52 HF 1,700 1,700 Prom FWDenbury Resources Smithdale Miss. Lincoln 3/05 4,100 12 5 Lower Tuscaloosa S 23 90 11,000 41 250 Prim. 50 HF 500 500 Succ. Denbury Resources Brookhaven Miss. Lincoln 1/05 10,800 40 37 Lower Tuscaloosa S 25.5 60 10,300 40 250 Prim./GI/WF 47 HF 3,700 3,700 Succ. FWDenbury Resources Martinville Miss. Simpson 3/06 280 3 2 Mooringsport S 18 40 11,550 38 244 WF 55 NC 250 250 Succ. Denbury Resources Martinville Miss. Simpson 3/06 200 4 3 Rodessa S 12 200 11,600 42 250 WF 64 NC 200 200 Succ. FWDenbury Resources Soso Miss. Jones 9/06 1,800 12 9 Rodessa 11,180 S 17 171 11,500 45 228 WF 55 HF 2,500 2,500 Succ. Exp. L.Denbury Resources Soso Miss. Jones 4/06 2,600 28 16 Bailey 11,701 S 17 273 11,950 43 234 WF 50 HF 200 200 Succ. Exp. L.Denbury Resources Cranfield Miss. Adams 07/08 7,754 26 27 Tuscaloosa S 23 100 10,300 39 260 Prim./GI 32 HF 1,500 1,500 Succ. Exp. L.Denbury Resources Lockhart Crossing La. Livingston 12/07 3,500 19 12 Wilcox S 20 30 10,100 40 212 Prim./WF 32 HF 1,500 1,500 Succ. FWDenbury Resources Delhi La. Madison, Richland 11/09 6,189 101 39 Tuscaloosa, Paluxy S 0.3 1,000 3,500 42 0.77 135 Prim./WF JS TETT FWDenbury Resources Oyster Bayou Tex. Chambers 12/10 3,912 29 12 Frio S 25–28 210–2,300 0 39.5 0.49 190 Prim./WF JS TETT FW Devon Beaver Creek Wyo. Fremont 7/08 980 17 17 Madison Dolo. 10 10 11,100 39.5 0.64 232 Prim./WF 60 50 JS 2,700 2,425 Prom. Prom. Exp. L. Energen Resources East Penwell (SA) Unit Tex. Ector 5/96 1,020 49 30 San Andres Dolo. 10 4 4,000 34 2 86 WF 55 40 HF 1,626 827 Succ. Yes Exp. L. ExxonMobil Means (San Andres) Tex. Andrews 11/83 8,500 484 284 San Andres Dolo. 9 20 4,300 29 6 97 WF HF 10,000 8,700 Succ. Yes Exp. L. Fasken Abell (Devonian) Tex. Crane 4/09 809 18 14 Devonian Tripol. 21.9 3 5,300 42 1 105 WF 45 JS 240 200 Prom. Prom. Exp. LFasken Hanford Tex. Gaines 7/86 1,120 23 26 San Andres Dolo. 10.5 4 5,500 32 1 104 Prim. 60.7 18.7 NC 400 400 Succ. Fasken Hanford East Tex. Gaines 3/97 340 7 4 San Andres Dolo. 10 4 5,500 32 1 105 WF 45 19 C 45 45 Succ. Exp. L Fasken Hanford (San Andres) Tex. Gaines 7/09 150 7 4 San Andres Residual Oil Zone Dolo. 10 5 5,700 32 1 105 Prim. 50 JS 280 TETT Exp. LFasken River Bend (Devonian) Tex. Crane 4/09 400 9 7 Devonian Tripol. 23.7 4.5 5,500 42 0.51 105 WF 55 46 JS 290 180 Prom. Prom. Exp. L Great Western Drilling Twofreds Tex. Loving,Ward,Reeves 1/74 4,392 32 9 Delawar, Ramsey S 19.5 32 4,900 36 2 105 WF 50 NC 170 170 Succ. Yes George R. Brown Garza Tex. 11/09 1,778 San Andres 3,000 LW Hess Seminole Unit–Main Pay Zone Tex. Gaines 7/83 15,699 370 110 San Andres Dolo. 12 1.3–123 5,300 35 1 104 WF 84 HF 14,500 14,000 Succ. Yes FWHess Seminole Unit–ROZ Phase 1 Tex. Gaines 7/96 500 15 10 San Andres Dolo. 12 1.3–123 5,500 35 1 104 none 30 HF 1,200 1,200 Prom. Yes Hess Seminole Unit–ROZ Phase 2 Tex. Gaines 4/04 480 16 9 San Andres Dolo. 12 1.3–123 5,500 35 1 104 none 30 HF 1,800 1,800 Prom. Yes PHess Seminole Unit–ROZ Stage 1 Tex. Gaines 10/07 2,320 44 29 San Andres Dolo. 12 1.3–123 5,500 35 1 104 none 30 HF 3,500 3,500 Prom. Yes Exp. L
PRODUCING CO2, OTHER GAS, AND CHEMICAL EOR IN US TABLE C Tot. Enh. Perme– Depth, Gravity, Oil, Prev. Satur. Satur. Proj. prod., prod., Proj. Project ability, md ft °API Oil, cp °F. prod. % start % end matur. b/d b/d eval. Profit scope
TECHNOLOGY
Kinder Morgan SACROC Tex. Scurry 1/72 49,900 390 503 Canyon LS 4 19 6,700 39 1 135 Prim./WF 78 39 HF 29,580 26,530 Succ. Yes LWKinder Morgan Katz Tex. 1/1/11 5,000 156 101 Strawn LS 17 75 4,950 38 2 117 Prim./WF 70 40 JS Succ. Yes FWKinder Morgan Goldsmith–Landreth Tex. 21,205 637 389 San Andres Carbonate 12 32 4,100 35 1 95 Prim./WF 80 35 HF Succ. Yes FW Merit Energy Lost Soldier Wyo. Sweetwater 5/89 1,345 33 39 Tensleep S 9.9 31 5,000 35 1 178 WF NC 4,672 4,545 Succ. Yes Exp. LMerit Energy Lost Soldier Wyo. Sweetwater 5/89 790 16 17 Darwin–Madison S/LS–Dolo. 10.3 4 5,400 35 1 181 WF NC 2,232 1,661 Succ. Yes Exp. LMerit Energy Lost Soldier Wyo. Sweetwater 6/96 120 11 7 Cambrian S 7 10 7,000 35 WF JS 1,740 1,015 Succ. Yes Merit Energy Wertz Wyo. Carbon, Sweetwtr. 10/86 1,400 12 22 Tensleep S 10 20 6,000 35 1 163 WF NC 3,912 2,986 Succ. Yes FWMerit Energy Wertz Wyo. Carbon, Sweetwtr. 9/00 810 12 18 Darwin–Madison S/LS–Dolo. 10 5 6,400 35 1 170 WF NC 1,685 1,033 Succ. Yes Merit Energy Northeast Purdy Okla. Garvin 9/82 3,400 85 49 Springer S 13 44 9,400 38 1 148 WF HF 1,800 1,800 Succ. Merit Energy Bradley Unit Okla. Garvin/Gardy 2/97 700 29 12 Springer S 14 50 9,400 38 1 150 WF JS 800 600 Prom. Orla Petco East Ford Tex. Reeves 7/95 1,953 8 4 Delaware, Ramsey S 23 30 2,680 40 1 82 Prim. 49 36 HF 128 128 Disc. No FW Occidental Anton Irish Tex. Hale 4/97 4,437 157 93 Clearfork Dolo. 7 4 5,800 30 3.0 109 Prim./WF 50 30 HF 5,000 4,000 Succ. Yes Exp. LOccidental Cedar Lake Tex. Gaines 8/94 2,870 230 96 San Andres Dolo. 14 5 4,800 32 2.3 102 WF 50 35 HF 3,900 3,000 Succ. Yes LWOccidental Cogdell Tex. Scurry/Kent 10/01 2,684 109 90 Canyon Reef LS 13 6 6,800 40 0.7 130 WF 46 15 HF 5,700 5,650 Succ. Yes Exp. LOccidental El Mar Tex. Loving 4/94 7,100 16 20 Delaware S 16 20 4,500 41 1.1 97 Prim./WF 40 NC 102 94 Disc. Yes Exp. ULOccidental GMK South Tex. Gaines 1982 1,143 29 26 San Andres Dolo. 10 3 5,400 30 3.0 101 Prim. 55 28 HF 480 215 Succ. Yes LWOccidental Levelland (Levelland) Tex. Hockley 9/04 1,179 137 110 San Andres Dolo. 12 2 4,900 34 1.4 108 WF 45 26 JS 3,071 2,198 Succ. Yes Exp. LOccidental Devonian Unit (Mid Cross) Tex. Crane, Upton, Crockett 7/97 1,326 11 6 Devonian Tripol. 18 2 5,400 42 0.4 104 Prim./GI 60 20 HF 297 294 Disc. Yes FWOccidental Devonian Unit (North Cross) Tex. Crane, Upton 4/72 1,155 26 16 Devonian Tripol. 22 5 5,300 44 0.4 104 Prim./GI 49 21 NC 1,283 1,283 Succ. Yes FWOccidental North Cowden Tex. Ector 2/95 465 30 15 Grayburg Dolo. 10 41,675 4,200 34 1.5 91 WF 40 25 Term. 5,090 64 Disc. No Exp. ULOccidental North Dollarhide Devonian Tex. Andrews 11/97 1,280 30 20 Devonian Tripol. 22 5 7,500 40 0.5 123 WF 38 23 HF 1,020 407 Succ. Yes FWOccidental North Hobbs NM Lea 3/03 3,300 134 83 San Andres Dolo. 15 15 4,200 35 0.9 102 WF 35 24 HF 6,615 5,315 Succ. Yes Exp. LOccidental Devonian Unit (South Cross) Tex. Crockett 6/88 2,090 74 43 Devonian Tripol. 21 4 5,200 43 0.6 104 Prim./GI 43 24 HF 4,572 4,440 Succ. Yes FWOccidental Salt Creek Tex. Kent 10/93 12,000 168 145 Canyon LS 20 12 6,300 39 1.0 125 WF 89 15 HF 7,344 6,950 Succ. Yes LWOccidental Sharon Ridge Tex. Scrurry 2/1 1,400 45 43 Canyon Reef LS 10 70 6,600 43 0.4 125 WF 39 26 HF 1,500 1,350 Succ. Yes Exp. LOccidental Slaughter (Alex Slaughter Estate) Tex. Hockley 8/00 246 18 18 San Andres Dolo./LS 10 5 4,950 31 1.8 105 WF 40 25 HF 200 183 Succ. Yes FWOccidental Slaughter (Central Mallet Unit) Tex. Hockley 1984 6,412 167 116 San Andres Dolo. 10 2 4,900 31 1.8 105 WF 48 25 HF 2,300 2,100 Succ. Yes FWOccidental Slaughter (Frazier Unit) Tex. Hockley 12/84 1,600 66 52 San Andres Dolo./LS 12 8 4,950 31 1.8 105 WF 38 23 NC 800 700 Succ. Yes FWOccidental Slaughter (H.T. Boyd) Tex. Cochran 8/01 1,240 39 22 San Andres Dolo. 10 4 5,000 31 1.6 108 WF 47 36 HF 950 850 Succ. Yes LWOccidental Slaughter (Igoe Smith) Tex. Cochran 9/05 1,235 46 34 San Andres Dolo. 11 4 5,040 34 1.5 105 WF 47 36 HF 850 650 Succ. Yes Exp. ULOccidental Slaughter (North West Mallet) Tex. Cochran, Hockley 2008 1,048 96 30 San Andres Dolo. 10 2 4,950 32 2.0 105 WF 47 31 JS 1,085 180 Prom. Yes Exp. LOccidental Slaughter (Slaughter Estate Unit) Tex. Hockley 12/1/84 5,700 182 143 San Andres Dolo./LS 12 5 4,950 31 1.8 105 WF 40 23 HF 3,300 2,900 Succ. Yes FWOccidental Slaughter (Smith Igoe) Tex. Cochran 8/5/14 177 6 3 San Andres Dolo. 10 4 5,000 31 1.6 108 WF 47 36 HF 180 100 Succ. Yes Exp. LOccidental Slaughter (West RKM Unit) Tex. Hockley 2006 1,561 71 48 San Andres Dolo. 9 4 4,900 32 2.0 105 WF 42 29 JS 1,740 450 Succ. Yes Exp. LOccidental South Wasson Clearfork Tex. Yoakum 10/84 4,720 86 68 Clearfork Dolo. 7 2 8,200 33 1.2 120 WF 70 Term. 1,007 0 Disc. No Exp. ULOccidental South Welch Tex. Dawson 9/93 1,160 120 72 San Andres Dolo. 11 4 4,900 34 2.3 98 WF 50 35 NC 800 600 Succ. Yes Exp. LOccidental T–Star (Slaughter Consolidated) Tex. Hockley 7/99 1,700 52 29 Abo Dolo. 7 2 7,850 28 1.9 134 Prim./WF 75 45 HF 1,950 1,000 Succ. Yes LWOccidental Wasson (BRU) Tex. Yoakum 6/95 2,154 207 168 San Andres Dolo. 11 8 5,250 34 1.2 105 WF 55 37 HF 4,900 4,300 Succ. Yes Exp. LOccidental Wasson (Denver Unit) Tex. Yoakum, Gaines 4/83 27,848 1,073 594 San Andres Dolo. 12 8 5,200 33 1.2 105 WF 51 31 HF 24,834 24,441 Succ. Yes FWOccidental Wasson (ODC Unit) Tex. Yoakum 11/84 7,800 329 321 San Andres Dolo./LS 10 5 5,100 34 1.3 110 WF 49 34 HF 8,023 7,617 Succ. Yes FWOccidental Wasson (Willard Unit) Tex. Yoakum 1/86 8,020 327 237 San Andres Dolo. 9 2 5,100 32 1.2 105 WF 56 41 HF 6,907 6,567 Succ. Yes Exp. LOccidental West Welch Tex. Gaines 10/97 240 San Andres Dolo. 10 3 4,900 34 2.3 98 WF 50 15 Term. Disc. No POccidental Levelland (South East Levelland) Tex. Hockley 04/11/14 1,184 187 38 San Andres Dolo. 10 2 4,850 32 1.4 108 WF 30 15 JS 550 250 Succ. Yes Exp. LOccidental West Seminole San Andres Unit Tex. Gaines 7/1/13 360 16 9 San Andres Dolo 12 10 5,000 34 0.9 102 WF 65 30 JS 150 TETT No Exp L Resolute Natural Resources Aneth Unit Utah San Juan 10/98 11,000 126 118 Desert Creek LS 12 5 5,700 42 0.6 129 WF 80 37 HF 1,200 400 Prom. Yes LWResolute Natural Resources McElmo Unit Utah 1/1/1985 13,000 138 107 Desert Creek LS 14 5 5,600 41 0.6 125 WF 80 37 NC Succ. Yes LW Stanberry Oil Hansford Marmaton Tex. Hansford 6/80 2,010 5 6 Marmaton S 18.1 48 6,500 44 2 142 Prim. 43 NC 102 102 Succ. Yes Exp. UL Tabula Rasa East Seminole Tex. 10/1/13 160 12 4 Dolomite 10 6 5,400 33 2 108 Prim./WF 80 43.9 JS Prom. TETT Exp. L Trinity Wellman Tex. 7/1/83 1,400 14 9 Wolfcamp LS 9.2 100 9,800 43.5 1 151 WF 35 10 HF 1,930 1,930 Succ. Yes FW Whiting Petroleum North Ward Estes Tex. Ward/Winkler 5/07 16,300 816 816 Yates SS 16 37 2,600 36 1.6 83 Prim./WF 26.5 21 JS 7,800 4,700 Prom. Yes Exp. L XTO Energy Inc. Goldsmith Tex. Ector 12/96 330 16 9 San Andres Dolo. 11.6 32 4,200 35 105 WF JS TETT Exp. ULXTO Energy Inc. Cordona Lake Tex. Crane 12/85 2,084 44 23 Devonian Tripol. 22 4 5,500 40 1 101 WF HF 1,050 350 Prom. Yes Exp. LXTO Energy Inc. Wasson (Cornell Unit) Tex. Yoakum 7/85 1,923 96 64 San Andres Dolo. 8.6 2 4,500 33 1 106 WF HF 1,700 875 Succ. Yes LWXTO Energy Inc. Wasson (Mahoney) Tex. Yoakum 10/85 640 49 27 San Andres Dolo. 13 6 5,100 33 1 110 WF 54.4 39.2 HF 1,600 1,350 Succ. Yes Exp. L CO2 immiscible Anadarko Salt Creek Wyo. Natrona 10/05 5 4 1 Wall Creek 1 (Frontier) S 17 30 1,150 35 0.6 99 Prim./WF 32 24 C Prom. P Denbury Resources Eucutta Miss. Wayne 3/06 2,100 55 49 Eutaw S 27 250 5,050 22 152 Prim./WF 42 NC 3,700 3,700 Succ. FWDenbury Resources Martinville Miss. Simpson 9/06 180 3 1 Wash–Fred 8500 S 27 107 8,500 11 198 Prim. 86 HF 300 300 Succ. Exp. LDenbury Resources Tinsley Miss. Yazoo 01/07 10,104 122 47 Woodruff S 23 500 5,000 34 164 Prim./WF 30 HF 9,000 9,000 Succ. Exp. LDenbury Resources Heidelberg, West Miss. Jasper 12/08 2,500 122 47 Eutaw S 28 300 4,800 22 152 WF 37 NC 3,500 3,500 Prom. FWDenbury Resources East Heidelberg Miss. Jasper 6/1/11 857 48 17 Eutaw S 0.28 10–700 5,050 22.8 17.4 152 Prim./WF JS Succ. Denbury Resources East Heidelberg Miss. Jasper 5/12 480 21 9 Christmas S 26–29 160–1,800 5,000 22.8 17.4 152 Prim, WF JS Succ Denbury Resources West Hastings Tex. Brazoria 12/10 4,420 12 11 Frio S 30 1,000 5700 31 1.24 165 Prim 30 JS Prom FW Kinder Morgan Yates Tex. Pecos 3/04 26,000 606 123 San Andres Dolo. 17 175 1,400 30 6 82 GI 75 54 HF 26,295 4,000 Succ. Yes FW Hydrocarbon miscible BP Alaska Prudhoe Bay Alas. 12/82–2/87 55,000 287 149 Sadlerochit S 22 400 8,800 27 0.9 210 WF 50 HF 58,000 14,000 Succ. FWBP Alaska Eileen West End Alas. 12/02 4,000 40 16 Sadlerochit S 19 130 8,800 26 1 235 WF 45 JS 12,000 5,000 Succ. FWBP Alaska Aurora Alas. 12/03 10,000 19 11 Kuparuk River S 20 50 6,700 24 2 150 WF 80 JS 7,000 1,000 Succ. FWBP Alaska Borealis Alas. 2004 9,000 30 19 Kuparuk River S 20 100 6,600 24–28 2 160 WF 80 JS 10,000 5,000 Succ. FWBP Alaska Orion Alas. 2006 11,000 12 35 Schrader Bluff S 25 150 4,500 15–23 7–140 85 WF 65 JS 7,800 1,000 TETT FWBP Alaska Polaris Alas. 2004 5,000 9 16 Schrader Bluff S 25 150 4,900 15–23 7–140 100 WF 65 NS 4,600 200 TETT FWBP Alaska Pt. McIntyre Alas. 2001 6,240 55 15 Kuparuk River S 23 200 8,800 27 0.9 182 WF 70 HF 20,000 10,000 Succ. FW ExxonMobil South Pass Block 89 OCS 12/83 204 9 5 X and Y Series S 26 1,000–1,500 10,000 38 0.40–0.60 180 Prim. HF 2,100 2,100 Succ. Yes RW
PRODUCING CO2, OTHER GAS, AND CHEMICAL EOR IN US (CONTINUED) TABLE C No. No. Poros–Type and Start Area, wells wells Forma– ity,operator Field State County date acres prod. inj. Pay zone tion %
TECHNOLOGY
Kinder Morgan SACROC Tex. Scurry 1/72 49,900 390 503 Canyon LS 4 19 6,700 39 1 135 Prim./WF 78 39 HF 29,580 26,530 Succ. Yes LWKinder Morgan Katz Tex. 1/1/11 5,000 156 101 Strawn LS 17 75 4,950 38 2 117 Prim./WF 70 40 JS Succ. Yes FWKinder Morgan Goldsmith–Landreth Tex. 21,205 637 389 San Andres Carbonate 12 32 4,100 35 1 95 Prim./WF 80 35 HF Succ. Yes FW Merit Energy Lost Soldier Wyo. Sweetwater 5/89 1,345 33 39 Tensleep S 9.9 31 5,000 35 1 178 WF NC 4,672 4,545 Succ. Yes Exp. LMerit Energy Lost Soldier Wyo. Sweetwater 5/89 790 16 17 Darwin–Madison S/LS–Dolo. 10.3 4 5,400 35 1 181 WF NC 2,232 1,661 Succ. Yes Exp. LMerit Energy Lost Soldier Wyo. Sweetwater 6/96 120 11 7 Cambrian S 7 10 7,000 35 WF JS 1,740 1,015 Succ. Yes Merit Energy Wertz Wyo. Carbon, Sweetwtr. 10/86 1,400 12 22 Tensleep S 10 20 6,000 35 1 163 WF NC 3,912 2,986 Succ. Yes FWMerit Energy Wertz Wyo. Carbon, Sweetwtr. 9/00 810 12 18 Darwin–Madison S/LS–Dolo. 10 5 6,400 35 1 170 WF NC 1,685 1,033 Succ. Yes Merit Energy Northeast Purdy Okla. Garvin 9/82 3,400 85 49 Springer S 13 44 9,400 38 1 148 WF HF 1,800 1,800 Succ. Merit Energy Bradley Unit Okla. Garvin/Gardy 2/97 700 29 12 Springer S 14 50 9,400 38 1 150 WF JS 800 600 Prom. Orla Petco East Ford Tex. Reeves 7/95 1,953 8 4 Delaware, Ramsey S 23 30 2,680 40 1 82 Prim. 49 36 HF 128 128 Disc. No FW Occidental Anton Irish Tex. Hale 4/97 4,437 157 93 Clearfork Dolo. 7 4 5,800 30 3.0 109 Prim./WF 50 30 HF 5,000 4,000 Succ. Yes Exp. LOccidental Cedar Lake Tex. Gaines 8/94 2,870 230 96 San Andres Dolo. 14 5 4,800 32 2.3 102 WF 50 35 HF 3,900 3,000 Succ. Yes LWOccidental Cogdell Tex. Scurry/Kent 10/01 2,684 109 90 Canyon Reef LS 13 6 6,800 40 0.7 130 WF 46 15 HF 5,700 5,650 Succ. Yes Exp. LOccidental El Mar Tex. Loving 4/94 7,100 16 20 Delaware S 16 20 4,500 41 1.1 97 Prim./WF 40 NC 102 94 Disc. Yes Exp. ULOccidental GMK South Tex. Gaines 1982 1,143 29 26 San Andres Dolo. 10 3 5,400 30 3.0 101 Prim. 55 28 HF 480 215 Succ. Yes LWOccidental Levelland (Levelland) Tex. Hockley 9/04 1,179 137 110 San Andres Dolo. 12 2 4,900 34 1.4 108 WF 45 26 JS 3,071 2,198 Succ. Yes Exp. LOccidental Devonian Unit (Mid Cross) Tex. Crane, Upton, Crockett 7/97 1,326 11 6 Devonian Tripol. 18 2 5,400 42 0.4 104 Prim./GI 60 20 HF 297 294 Disc. Yes FWOccidental Devonian Unit (North Cross) Tex. Crane, Upton 4/72 1,155 26 16 Devonian Tripol. 22 5 5,300 44 0.4 104 Prim./GI 49 21 NC 1,283 1,283 Succ. Yes FWOccidental North Cowden Tex. Ector 2/95 465 30 15 Grayburg Dolo. 10 41,675 4,200 34 1.5 91 WF 40 25 Term. 5,090 64 Disc. No Exp. ULOccidental North Dollarhide Devonian Tex. Andrews 11/97 1,280 30 20 Devonian Tripol. 22 5 7,500 40 0.5 123 WF 38 23 HF 1,020 407 Succ. Yes FWOccidental North Hobbs NM Lea 3/03 3,300 134 83 San Andres Dolo. 15 15 4,200 35 0.9 102 WF 35 24 HF 6,615 5,315 Succ. Yes Exp. LOccidental Devonian Unit (South Cross) Tex. Crockett 6/88 2,090 74 43 Devonian Tripol. 21 4 5,200 43 0.6 104 Prim./GI 43 24 HF 4,572 4,440 Succ. Yes FWOccidental Salt Creek Tex. Kent 10/93 12,000 168 145 Canyon LS 20 12 6,300 39 1.0 125 WF 89 15 HF 7,344 6,950 Succ. Yes LWOccidental Sharon Ridge Tex. Scrurry 2/1 1,400 45 43 Canyon Reef LS 10 70 6,600 43 0.4 125 WF 39 26 HF 1,500 1,350 Succ. Yes Exp. LOccidental Slaughter (Alex Slaughter Estate) Tex. Hockley 8/00 246 18 18 San Andres Dolo./LS 10 5 4,950 31 1.8 105 WF 40 25 HF 200 183 Succ. Yes FWOccidental Slaughter (Central Mallet Unit) Tex. Hockley 1984 6,412 167 116 San Andres Dolo. 10 2 4,900 31 1.8 105 WF 48 25 HF 2,300 2,100 Succ. Yes FWOccidental Slaughter (Frazier Unit) Tex. Hockley 12/84 1,600 66 52 San Andres Dolo./LS 12 8 4,950 31 1.8 105 WF 38 23 NC 800 700 Succ. Yes FWOccidental Slaughter (H.T. Boyd) Tex. Cochran 8/01 1,240 39 22 San Andres Dolo. 10 4 5,000 31 1.6 108 WF 47 36 HF 950 850 Succ. Yes LWOccidental Slaughter (Igoe Smith) Tex. Cochran 9/05 1,235 46 34 San Andres Dolo. 11 4 5,040 34 1.5 105 WF 47 36 HF 850 650 Succ. Yes Exp. ULOccidental Slaughter (North West Mallet) Tex. Cochran, Hockley 2008 1,048 96 30 San Andres Dolo. 10 2 4,950 32 2.0 105 WF 47 31 JS 1,085 180 Prom. Yes Exp. LOccidental Slaughter (Slaughter Estate Unit) Tex. Hockley 12/1/84 5,700 182 143 San Andres Dolo./LS 12 5 4,950 31 1.8 105 WF 40 23 HF 3,300 2,900 Succ. Yes FWOccidental Slaughter (Smith Igoe) Tex. Cochran 8/5/14 177 6 3 San Andres Dolo. 10 4 5,000 31 1.6 108 WF 47 36 HF 180 100 Succ. Yes Exp. LOccidental Slaughter (West RKM Unit) Tex. Hockley 2006 1,561 71 48 San Andres Dolo. 9 4 4,900 32 2.0 105 WF 42 29 JS 1,740 450 Succ. Yes Exp. LOccidental South Wasson Clearfork Tex. Yoakum 10/84 4,720 86 68 Clearfork Dolo. 7 2 8,200 33 1.2 120 WF 70 Term. 1,007 0 Disc. No Exp. ULOccidental South Welch Tex. Dawson 9/93 1,160 120 72 San Andres Dolo. 11 4 4,900 34 2.3 98 WF 50 35 NC 800 600 Succ. Yes Exp. LOccidental T–Star (Slaughter Consolidated) Tex. Hockley 7/99 1,700 52 29 Abo Dolo. 7 2 7,850 28 1.9 134 Prim./WF 75 45 HF 1,950 1,000 Succ. Yes LWOccidental Wasson (BRU) Tex. Yoakum 6/95 2,154 207 168 San Andres Dolo. 11 8 5,250 34 1.2 105 WF 55 37 HF 4,900 4,300 Succ. Yes Exp. LOccidental Wasson (Denver Unit) Tex. Yoakum, Gaines 4/83 27,848 1,073 594 San Andres Dolo. 12 8 5,200 33 1.2 105 WF 51 31 HF 24,834 24,441 Succ. Yes FWOccidental Wasson (ODC Unit) Tex. Yoakum 11/84 7,800 329 321 San Andres Dolo./LS 10 5 5,100 34 1.3 110 WF 49 34 HF 8,023 7,617 Succ. Yes FWOccidental Wasson (Willard Unit) Tex. Yoakum 1/86 8,020 327 237 San Andres Dolo. 9 2 5,100 32 1.2 105 WF 56 41 HF 6,907 6,567 Succ. Yes Exp. LOccidental West Welch Tex. Gaines 10/97 240 San Andres Dolo. 10 3 4,900 34 2.3 98 WF 50 15 Term. Disc. No POccidental Levelland (South East Levelland) Tex. Hockley 04/11/14 1,184 187 38 San Andres Dolo. 10 2 4,850 32 1.4 108 WF 30 15 JS 550 250 Succ. Yes Exp. LOccidental West Seminole San Andres Unit Tex. Gaines 7/1/13 360 16 9 San Andres Dolo 12 10 5,000 34 0.9 102 WF 65 30 JS 150 TETT No Exp L Resolute Natural Resources Aneth Unit Utah San Juan 10/98 11,000 126 118 Desert Creek LS 12 5 5,700 42 0.6 129 WF 80 37 HF 1,200 400 Prom. Yes LWResolute Natural Resources McElmo Unit Utah 1/1/1985 13,000 138 107 Desert Creek LS 14 5 5,600 41 0.6 125 WF 80 37 NC Succ. Yes LW Stanberry Oil Hansford Marmaton Tex. Hansford 6/80 2,010 5 6 Marmaton S 18.1 48 6,500 44 2 142 Prim. 43 NC 102 102 Succ. Yes Exp. UL Tabula Rasa East Seminole Tex. 10/1/13 160 12 4 Dolomite 10 6 5,400 33 2 108 Prim./WF 80 43.9 JS Prom. TETT Exp. L Trinity Wellman Tex. 7/1/83 1,400 14 9 Wolfcamp LS 9.2 100 9,800 43.5 1 151 WF 35 10 HF 1,930 1,930 Succ. Yes FW Whiting Petroleum North Ward Estes Tex. Ward/Winkler 5/07 16,300 816 816 Yates SS 16 37 2,600 36 1.6 83 Prim./WF 26.5 21 JS 7,800 4,700 Prom. Yes Exp. L XTO Energy Inc. Goldsmith Tex. Ector 12/96 330 16 9 San Andres Dolo. 11.6 32 4,200 35 105 WF JS TETT Exp. ULXTO Energy Inc. Cordona Lake Tex. Crane 12/85 2,084 44 23 Devonian Tripol. 22 4 5,500 40 1 101 WF HF 1,050 350 Prom. Yes Exp. LXTO Energy Inc. Wasson (Cornell Unit) Tex. Yoakum 7/85 1,923 96 64 San Andres Dolo. 8.6 2 4,500 33 1 106 WF HF 1,700 875 Succ. Yes LWXTO Energy Inc. Wasson (Mahoney) Tex. Yoakum 10/85 640 49 27 San Andres Dolo. 13 6 5,100 33 1 110 WF 54.4 39.2 HF 1,600 1,350 Succ. Yes Exp. L CO2 immiscible Anadarko Salt Creek Wyo. Natrona 10/05 5 4 1 Wall Creek 1 (Frontier) S 17 30 1,150 35 0.6 99 Prim./WF 32 24 C Prom. P Denbury Resources Eucutta Miss. Wayne 3/06 2,100 55 49 Eutaw S 27 250 5,050 22 152 Prim./WF 42 NC 3,700 3,700 Succ. FWDenbury Resources Martinville Miss. Simpson 9/06 180 3 1 Wash–Fred 8500 S 27 107 8,500 11 198 Prim. 86 HF 300 300 Succ. Exp. LDenbury Resources Tinsley Miss. Yazoo 01/07 10,104 122 47 Woodruff S 23 500 5,000 34 164 Prim./WF 30 HF 9,000 9,000 Succ. Exp. LDenbury Resources Heidelberg, West Miss. Jasper 12/08 2,500 122 47 Eutaw S 28 300 4,800 22 152 WF 37 NC 3,500 3,500 Prom. FWDenbury Resources East Heidelberg Miss. Jasper 6/1/11 857 48 17 Eutaw S 0.28 10–700 5,050 22.8 17.4 152 Prim./WF JS Succ. Denbury Resources East Heidelberg Miss. Jasper 5/12 480 21 9 Christmas S 26–29 160–1,800 5,000 22.8 17.4 152 Prim, WF JS Succ Denbury Resources West Hastings Tex. Brazoria 12/10 4,420 12 11 Frio S 30 1,000 5700 31 1.24 165 Prim 30 JS Prom FW Kinder Morgan Yates Tex. Pecos 3/04 26,000 606 123 San Andres Dolo. 17 175 1,400 30 6 82 GI 75 54 HF 26,295 4,000 Succ. Yes FW Hydrocarbon miscible BP Alaska Prudhoe Bay Alas. 12/82–2/87 55,000 287 149 Sadlerochit S 22 400 8,800 27 0.9 210 WF 50 HF 58,000 14,000 Succ. FWBP Alaska Eileen West End Alas. 12/02 4,000 40 16 Sadlerochit S 19 130 8,800 26 1 235 WF 45 JS 12,000 5,000 Succ. FWBP Alaska Aurora Alas. 12/03 10,000 19 11 Kuparuk River S 20 50 6,700 24 2 150 WF 80 JS 7,000 1,000 Succ. FWBP Alaska Borealis Alas. 2004 9,000 30 19 Kuparuk River S 20 100 6,600 24–28 2 160 WF 80 JS 10,000 5,000 Succ. FWBP Alaska Orion Alas. 2006 11,000 12 35 Schrader Bluff S 25 150 4,500 15–23 7–140 85 WF 65 JS 7,800 1,000 TETT FWBP Alaska Polaris Alas. 2004 5,000 9 16 Schrader Bluff S 25 150 4,900 15–23 7–140 100 WF 65 NS 4,600 200 TETT FWBP Alaska Pt. McIntyre Alas. 2001 6,240 55 15 Kuparuk River S 23 200 8,800 27 0.9 182 WF 70 HF 20,000 10,000 Succ. FW ExxonMobil South Pass Block 89 OCS 12/83 204 9 5 X and Y Series S 26 1,000–1,500 10,000 38 0.40–0.60 180 Prim. HF 2,100 2,100 Succ. Yes RW
PRODUCING CO2, OTHER GAS, AND CHEMICAL EOR IN US (CONTINUED) TABLE C Tot. Enh. Perme– Depth, Gravity, Oil, Prev. Satur. Satur. Proj. prod., prod., Proj. Project ability, md ft °API Oil, cp °F. prod. % start % end matur. b/d b/d eval. Profit scope
PRODUCING EOR PROJECTS OUTSIDE US AND CANADA TABLE E No. No. Poros–Country Type Start Area, wells wells Forma– ity,and area Operator project Field date acres prod. inj. Pay zone tion %
PRODUCING CANADIAN EOR PROJECTS (CONTINUED) TABLE D No. No. Poros– Perme–Type and Start Area, wells wells Forma– ity, ability,operator Field Province date acres prod. inj. Pay zone tion % md
Shell Canada Peace River Alta. 1979 4,900 97 109 Bluesky S 26.5 2,000-4,000 1,800 8 40,000 - 400,000 63 SF, SD, SS 0.8 0.54 HF 13,000 13,000 Succ. Marginal P, Exp. LShell Canada Peace River Alta. 10/86 3,000 48 48 Cretaceous-Bullhead S 28.5 100-2,000 1,800 8 100,000 62 80 JS 5,000 5,000 Succ. Exp. L Nitrogen Talisman Turner Valley Sask. 2001 Polymer CNRL Pelican Lake Alta. 2006 187,000 1,000 200 Wabiskaw S 29 1,000-4,000 1,500 13 1,000-4,000 60 Prim. 70 40 TBD 40,000 20,000 Succ. Yes TBDCenovus Pelican Lake Alta. 2004 397,000 445 280 Wabiskaw S 30 500-5,000 1,000-1,300 13.5-16.5 1,000-5,000+ 63 WF 70-80 20-30 HF 20,105 5,000 Succ. RW
Brazil Bahia Petrobras CO2 immiscible Buracica 1991 1,670 7 Sergi S 22 1,970 35 10.5 120 Prim./WF NC Succ. Yes RWBahia Petrobras CO2 miscible Rio Pojuca 1999 1 Agua Grande S 5,900 36 2 183 Prim. HF TETT PBahia Petrobras CO2 miscible Miranga 12/09 27 10 Catu–1 S 20 112 4,000 39.4 1.2 156 WF JS TETT PBrazil Petrobras Microbial Carmopolis 6/02 45 10 Carmopolis S/Congl. 17 200 1,970 23 28 122 WF NC Prom. PBrazil Petrobras Steam Estreito 12/09 176 48 Acu S 25 4,000 1,150 15 1,700 100 Prim. JS 5700 TETT FWEspirito Santo Petrobras Steam Fazenda Alegre 2001 1,255 59 Urucutuca S 27 500–2,000 2,300 13 825 124 Prim. 76 HF 9,500 9,500 Succ. Yes FWRio Grande do Norte (RN) Petrobras Steam Estreito 1984 700 Acu S 25 4,000 1,150 15 1,700 100 Prim. NC 5,700 5,700 Succ. Yes FWRio Grande do Norte (RN) Petrobras Steam Alto do Rodrigues 1984 500 Acu S 25 3,000 1,480 15 2500 100 Prim. NC 2,500 2,500 Succ. Yes FWSergipe Petrobras Steam Carmopolis 1978 200 Barra Itiuba/ Carmopolis S/Congl. 22 200 2,460 21 500 122 NC 3,860 3,860 Succ. Yes FW Egypt Cairo Scimitar Cyclic steam Issaran 2004 175 50 10 ft in sandstone, Dolo./ 20 md 100–300 ft Limestone/ 20–25 matrix, 2 700–2,000 ft 10 72 110 Prim. 75–80 JS 2,500 2,500 Succ. Prof. LW sandstone darcy fracture Germany Lower Saxony, Grafschaft Bentheim Wintershall Holding AG Steam Emlichheim, Block 1 7/07 55 8 1 Valanginian US 30 300–15,000 2,500–2,700 25 175 100 HW 10–90 10–90 JS 500 500 Prom. Good FWLower Saxony, Grafschaft Bentheim Wintershall Holding AG Steam Emlichheim, Block 2 6/05 22 4 1 Valanginian US 30 300–15,000 2,500–2,700 25 175 100 WF 10–90 10–90 HF 390 390 Succ. Good FWLower Saxony, Grafschaft Bentheim Wintershall Holding AG Steam Emlichheim, Block 3 8/01 50 7 1 Valanginian US 30 300–15,000 2,500–2,700 25 175 100 HW 10–90 10–90 HF 350 345 Succ. Good FWLower Saxony, Grafschaft Bentheim Wintershall Holding AG Steam Emlichheim, Block 4 Northeast 2/02 22 3 1 Valanginian US 30 300–15,000 2,500–2,700 25 175 100 HW 10–90 10–90 HF 70 70 Succ. Good FWLower Saxony, Grafschaft Bentheim Wintershall Holding AG Steam Emlichheim, Block 5/ 7 North 2/99 58 9 1 Valanginian US 30 300–15,000 2,500–2,700 25 175 100 WF 10–90 10–90 HF 450 450 Succ. Good FWLower Saxony, Grafschaft Bentheim Wintershall Holding AG Steam Emlichheim, Block 8/ 9 North 7/08 37 5 1 Valanginian S 30 300–15,001 2,600 25 175 100 10–90 10–90 JS 530 530 TETT Good FWLower Saxony, Grafschaft Bentheim Wintershall Holding AG Steam Emlichheim,Block 4 5/11 295 20 3 Valanginian S 30 300–15,000 2,600 25 175 100 10–90 10–90 JS 450 450 Prom. Good FWLower Saxony, Grafschaft Bentheim Wintershall Holding AG Steam Emlichheim,Block 11/14 12/11 150 12 2 Valanginian S 30 300–15,000 2,600 25 175 100 10–90 10–90 JS Lower Saxony, Diepholz Wintershall Holding AG Polymer Bockstedt 12/20/12 15 3 1 Valanginian S 24 2,000 3,600–4,300 24.7 29 129 WF 45 JS 47 14 Prom. P Indonesia Pekanbaru PT Caltex Steam Duri 1/85 30,878 2,702 1,068 Pertama–Kedua US 34 1,600 550 22 350 100 Prim. 62 15 NC 190,000 190,000 Succ. Yes FWPekanbaru PT Caltex Steam Duri 7/94 27,000 1,093 532 Rindu US 38 1,600 350 22 350 100 Prim. 60 15 NC Succ. Yes FW Netherlands Drenthe Nederlandse Aardolie Maatschappij (NAM) Steam Schoonebeek 10/10 1,700 2,625 25 Norway North Sea, Rogaland BP Hydrocarbon miscible Ula 10/1/86 5,659 10 5 Ula Sand S 16.4 11,319 41 0.3 250 455 0.5 46 HF 15,000 14,950 Succ. Good FW United Kingdom Shetlands Islands BP Hydrocarbon miscible Magnus 10/02 10,700 16 4 150 S 20 420 9,500 39 0.3 240 WF 25 8 HF 16,500 6,000 Succ. Exp. L Trinidad Parrylands New Horizon Steam Block E 7/01 744 6 Forest Sands S 36 750 850–1,200 16–18 5,000 97 Prim. 80 JS 100 TETT LWForest Reserve Petrotrin CO2 immiscible Area 2102 6/76 58 6 2 Forest Sands S 32 175 3,000 19 16 120 Prim. 56 HF 43 43 Succ. Yes Exp. LForest Reserve Petrotrin CO2 immiscible Area 2121 1/74 29 2 2 Forest Sands S 30 150 2,600 17 32 120 Prim 60 HF Prom. Exp. LForest Reserve Petrotrin CO2 immiscible Area 2124 1/86 184 3 1 Forest Sands S 31 300 4,200 25 6 130 WF 44 TS 78 78 Prom. Exp. LForest Reserve Petrotrin CO2 immiscible EOR 34–Cyclic 84 NA 11 Forest/MLE S 29 150 2,025 17 11–145 120 Prim. HF 160 160 Prom. Yes Oropouche Petrotrin CO2 immiscible Oropouche 6/90 175 4 3 Retrench S 30 36 2,400 29 5 120 Prim. 53 48 HF 32 32 Prom. PGuapo Petrotrin Steam Guapo 8/76 400 80 12 Cruse E & F S 25 300 2,400 11 5,500 100 Cyclic 75 HF 792 792 Succ. Yes RWPoint Fortin Petrotrin Steam Cruse E 2/86 66 17 7 Cruse E S 31 95 1,400 17 175 110 Prim. 58 18 HF 325 325 Prom. PPoint Fortin Petrotrin Steam Parrylands 7/81 86 25 6 Forest S 30 500 1,100 11 5,500 104 Prim. 75 20 HF 89 89 Succ. Yes RWPoint Fortin Petrotrin Steam Cruse E 10/95 300 72 27 Cruse E S 29 265 2,100 17 200 110 Prim. 75 JS 141 141 Prom. RWForest Reserve Petrotrin Steam Phase I Cyclic 8/76 58 8 Forest Sands S 31 205 1,200 19 32 105 Prim. 57 15 NC 69 69 Disc. No RW
TECHNOLOGY
PRODUCING EOR PROJECTS OUTSIDE US AND CANADA TABLE E Tot. Enh. Perme– Depth, Gravity, Oil, Prev. Satur. Satur. Proj. prod., prod., Proj. Project ability, md ft °API Oil, cp °F. prod. % start % end matur. b/d b/d eval. Profit scope
PRODUCING CANADIAN EOR PROJECTS (CONTINUED) TABLE D Tot. Enh. Depth, Gravity, Oil, Prev. Satur. Satur. Proj. prod., prod., Proj. Project ft °API Oil, cp °F. prod. % start % end matur. b/d b/d eval. Profit scope
Shell Canada Peace River Alta. 1979 4,900 97 109 Bluesky S 26.5 2,000-4,000 1,800 8 40,000 - 400,000 63 SF, SD, SS 0.8 0.54 HF 13,000 13,000 Succ. Marginal P, Exp. LShell Canada Peace River Alta. 10/86 3,000 48 48 Cretaceous-Bullhead S 28.5 100-2,000 1,800 8 100,000 62 80 JS 5,000 5,000 Succ. Exp. L Nitrogen Talisman Turner Valley Sask. 2001 Polymer CNRL Pelican Lake Alta. 2006 187,000 1,000 200 Wabiskaw S 29 1,000-4,000 1,500 13 1,000-4,000 60 Prim. 70 40 TBD 40,000 20,000 Succ. Yes TBDCenovus Pelican Lake Alta. 2004 397,000 445 280 Wabiskaw S 30 500-5,000 1,000-1,300 13.5-16.5 1,000-5,000+ 63 WF 70-80 20-30 HF 20,105 5,000 Succ. RW
Brazil Bahia Petrobras CO2 immiscible Buracica 1991 1,670 7 Sergi S 22 1,970 35 10.5 120 Prim./WF NC Succ. Yes RWBahia Petrobras CO2 miscible Rio Pojuca 1999 1 Agua Grande S 5,900 36 2 183 Prim. HF TETT PBahia Petrobras CO2 miscible Miranga 12/09 27 10 Catu–1 S 20 112 4,000 39.4 1.2 156 WF JS TETT PBrazil Petrobras Microbial Carmopolis 6/02 45 10 Carmopolis S/Congl. 17 200 1,970 23 28 122 WF NC Prom. PBrazil Petrobras Steam Estreito 12/09 176 48 Acu S 25 4,000 1,150 15 1,700 100 Prim. JS 5700 TETT FWEspirito Santo Petrobras Steam Fazenda Alegre 2001 1,255 59 Urucutuca S 27 500–2,000 2,300 13 825 124 Prim. 76 HF 9,500 9,500 Succ. Yes FWRio Grande do Norte (RN) Petrobras Steam Estreito 1984 700 Acu S 25 4,000 1,150 15 1,700 100 Prim. NC 5,700 5,700 Succ. Yes FWRio Grande do Norte (RN) Petrobras Steam Alto do Rodrigues 1984 500 Acu S 25 3,000 1,480 15 2500 100 Prim. NC 2,500 2,500 Succ. Yes FWSergipe Petrobras Steam Carmopolis 1978 200 Barra Itiuba/ Carmopolis S/Congl. 22 200 2,460 21 500 122 NC 3,860 3,860 Succ. Yes FW Egypt Cairo Scimitar Cyclic steam Issaran 2004 175 50 10 ft in sandstone, Dolo./ 20 md 100–300 ft Limestone/ 20–25 matrix, 2 700–2,000 ft 10 72 110 Prim. 75–80 JS 2,500 2,500 Succ. Prof. LW sandstone darcy fracture Germany Lower Saxony, Grafschaft Bentheim Wintershall Holding AG Steam Emlichheim, Block 1 7/07 55 8 1 Valanginian US 30 300–15,000 2,500–2,700 25 175 100 HW 10–90 10–90 JS 500 500 Prom. Good FWLower Saxony, Grafschaft Bentheim Wintershall Holding AG Steam Emlichheim, Block 2 6/05 22 4 1 Valanginian US 30 300–15,000 2,500–2,700 25 175 100 WF 10–90 10–90 HF 390 390 Succ. Good FWLower Saxony, Grafschaft Bentheim Wintershall Holding AG Steam Emlichheim, Block 3 8/01 50 7 1 Valanginian US 30 300–15,000 2,500–2,700 25 175 100 HW 10–90 10–90 HF 350 345 Succ. Good FWLower Saxony, Grafschaft Bentheim Wintershall Holding AG Steam Emlichheim, Block 4 Northeast 2/02 22 3 1 Valanginian US 30 300–15,000 2,500–2,700 25 175 100 HW 10–90 10–90 HF 70 70 Succ. Good FWLower Saxony, Grafschaft Bentheim Wintershall Holding AG Steam Emlichheim, Block 5/ 7 North 2/99 58 9 1 Valanginian US 30 300–15,000 2,500–2,700 25 175 100 WF 10–90 10–90 HF 450 450 Succ. Good FWLower Saxony, Grafschaft Bentheim Wintershall Holding AG Steam Emlichheim, Block 8/ 9 North 7/08 37 5 1 Valanginian S 30 300–15,001 2,600 25 175 100 10–90 10–90 JS 530 530 TETT Good FWLower Saxony, Grafschaft Bentheim Wintershall Holding AG Steam Emlichheim,Block 4 5/11 295 20 3 Valanginian S 30 300–15,000 2,600 25 175 100 10–90 10–90 JS 450 450 Prom. Good FWLower Saxony, Grafschaft Bentheim Wintershall Holding AG Steam Emlichheim,Block 11/14 12/11 150 12 2 Valanginian S 30 300–15,000 2,600 25 175 100 10–90 10–90 JS Lower Saxony, Diepholz Wintershall Holding AG Polymer Bockstedt 12/20/12 15 3 1 Valanginian S 24 2,000 3,600–4,300 24.7 29 129 WF 45 JS 47 14 Prom. P Indonesia Pekanbaru PT Caltex Steam Duri 1/85 30,878 2,702 1,068 Pertama–Kedua US 34 1,600 550 22 350 100 Prim. 62 15 NC 190,000 190,000 Succ. Yes FWPekanbaru PT Caltex Steam Duri 7/94 27,000 1,093 532 Rindu US 38 1,600 350 22 350 100 Prim. 60 15 NC Succ. Yes FW Netherlands Drenthe Nederlandse Aardolie Maatschappij (NAM) Steam Schoonebeek 10/10 1,700 2,625 25 Norway North Sea, Rogaland BP Hydrocarbon miscible Ula 10/1/86 5,659 10 5 Ula Sand S 16.4 11,319 41 0.3 250 455 0.5 46 HF 15,000 14,950 Succ. Good FW United Kingdom Shetlands Islands BP Hydrocarbon miscible Magnus 10/02 10,700 16 4 150 S 20 420 9,500 39 0.3 240 WF 25 8 HF 16,500 6,000 Succ. Exp. L Trinidad Parrylands New Horizon Steam Block E 7/01 744 6 Forest Sands S 36 750 850–1,200 16–18 5,000 97 Prim. 80 JS 100 TETT LWForest Reserve Petrotrin CO2 immiscible Area 2102 6/76 58 6 2 Forest Sands S 32 175 3,000 19 16 120 Prim. 56 HF 43 43 Succ. Yes Exp. LForest Reserve Petrotrin CO2 immiscible Area 2121 1/74 29 2 2 Forest Sands S 30 150 2,600 17 32 120 Prim 60 HF Prom. Exp. LForest Reserve Petrotrin CO2 immiscible Area 2124 1/86 184 3 1 Forest Sands S 31 300 4,200 25 6 130 WF 44 TS 78 78 Prom. Exp. LForest Reserve Petrotrin CO2 immiscible EOR 34–Cyclic 84 NA 11 Forest/MLE S 29 150 2,025 17 11–145 120 Prim. HF 160 160 Prom. Yes Oropouche Petrotrin CO2 immiscible Oropouche 6/90 175 4 3 Retrench S 30 36 2,400 29 5 120 Prim. 53 48 HF 32 32 Prom. PGuapo Petrotrin Steam Guapo 8/76 400 80 12 Cruse E & F S 25 300 2,400 11 5,500 100 Cyclic 75 HF 792 792 Succ. Yes RWPoint Fortin Petrotrin Steam Cruse E 2/86 66 17 7 Cruse E S 31 95 1,400 17 175 110 Prim. 58 18 HF 325 325 Prom. PPoint Fortin Petrotrin Steam Parrylands 7/81 86 25 6 Forest S 30 500 1,100 11 5,500 104 Prim. 75 20 HF 89 89 Succ. Yes RWPoint Fortin Petrotrin Steam Cruse E 10/95 300 72 27 Cruse E S 29 265 2,100 17 200 110 Prim. 75 JS 141 141 Prom. RWForest Reserve Petrotrin Steam Phase I Cyclic 8/76 58 8 Forest Sands S 31 205 1,200 19 32 105 Prim. 57 15 NC 69 69 Disc. No RW
TECHNOLOGY
PRODUCING EOR PROJECTS OUTSIDE US AND CANADA (CONTINUED) TABLE E No. No. Poros–Country Type Start Area, wells wells Forma– ity,and area Operator project Field date acres prod. inj. Pay zone tion %


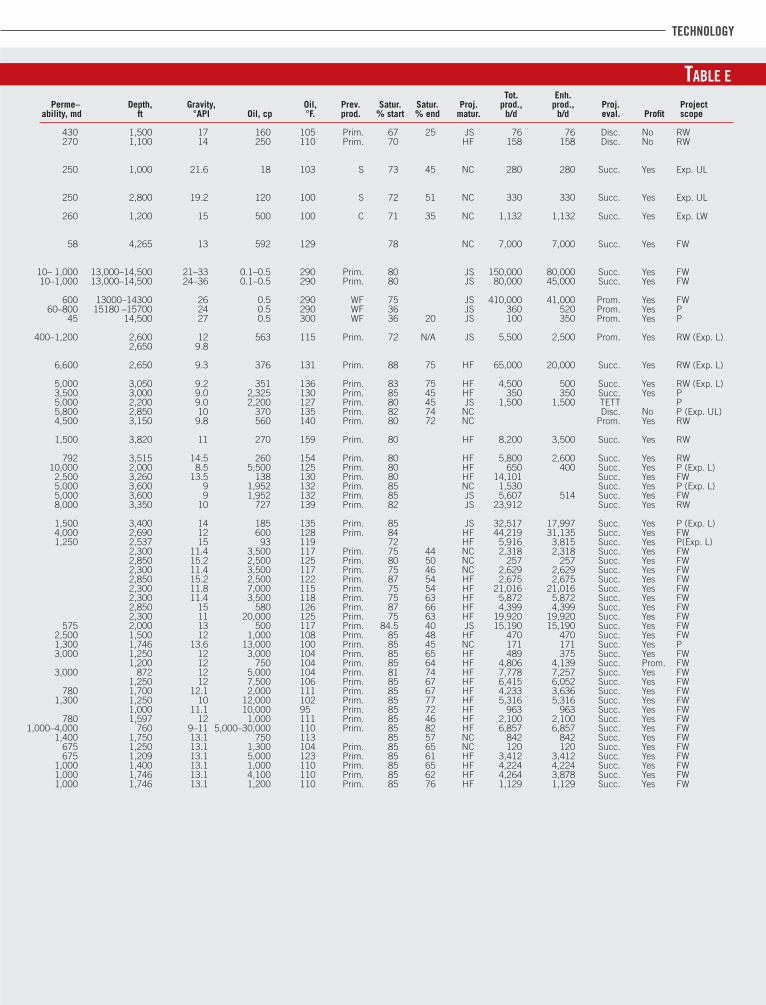


![BGD001B Retro Digital 100M-WR (Black & Pink) 12 EOR - Mist ... · Mist Digital 100M-WR [Nude & Rosegold] 222 EOR - - BG002A Diva Bronze 190 EOR - BG002B Diva Silver 133 EOR - BG003C](https://static.documents.pub/doc/80x56/5e7cf3eec367ea52344b7489/bgd001b-retro-digital-100m-wr-black-pink-12-eor-mist-mist-digital.jpg)