49
produced by co-generation implementation in the Mediterranean islands and coastal areas European Commission Dg Tren Handbook with the support of Centre for Renewable Energy Sources
produced by
co-generationimplementation in the Mediterranean islands and coastal areas
European CommissionDg Tren
Handbook
with the support of
Centre for Renewable Energy Sources
European Commission Dg Tren
Handbook
WWaatteerr aanndd PPoowweerr ccoo--ggeenneerraattiioonn iimmpplleemmeennttaattiioonn iinn tthhee MMeeddiitteerrrraanneeaann iissllaannddss aanndd ccooaassttaall aarreeaass
produced by
FAST – Federation of Scientific and Technical Associations
with the support of
CRES – Centre for Renewable Energy Sources
CO-OPET Contract No: NNE5/48/2002
Support initiative for the Organisations for Promotion of Energy and Transport Technologies
CO-OPET Work Package No. 7
Water and Power co-generation implementation in the Mediterranean islands and coastal areas
Work package leader
FAST – Federation of Scientific and Technical Associations Piazzale R. Morandi 2, 20121 Milano (Italy)
tel. +39 02 77790.300, fax +39 02 782485, www.fast.mi.it
Partner
CRES – Centre for Renewable Energy Sources 19th km Marahonos Ave, 19009 Pikermi Attiki (Greece)
tel. +30 210 6603300, fax +30 210 6603301/302, www.cres.gr
Legal notice Neither the European Commission, nor any person acting on behalf of the Commission, is responsible for the use which might be made of the information contained in this publication. The views expressed in this publication have not been adopted or in any way approved by the Commission and should not be relied upon as a statement of the Commission’s views. Reproduction is authorised provided the source is acknowledged. Printed in Italy April 2004
CO-OPET – WP No. 7: Water and Power co-generation implementation in the Mediterranean islands and coastal areas
3
Content
1. Introduction ..................................................... 5
Background..................................................................................... 5 Application field.............................................................................. 6 Water supply costs on islands ...................................................... 7
Electricity costs on islands ........................................................... 9
2. Desalination as an alternative solution ....... 11 General .......................................................................................... 12 Desalination technologies ........................................................... 13
General classification............................................................................... 13
Thermal distillation processes.................................................................. 13
Membrane processes .............................................................................. 14
Advantages/disadvantages...................................................................... 14
Common facilities..................................................................................... 17
Market share and trends .............................................................. 19
3. Cogeneration ................................................. 21 Conventional cogeneration – CHP.............................................. 21 Cogeneration of Power and Water .............................................. 23
4. Performance evaluation................................ 25 General criteria ............................................................................. 25
Product water quality and quantity ........................................................... 25
Feed-water temperature .......................................................................... 25
Availability of cheap energy ..................................................................... 26
Waste brine disposal................................................................................ 26

CO-OPET – WP No. 7: Water and Power co-generation implementation in the Mediterranean islands and coastal areas
4
Location ................................................................................................... 26
Process economics.................................................................................. 26
Thermal versus membrane processes ....................................... 27 Energy consumption ................................................................................ 27
Scale economy ........................................................................................ 28
Maintenance ............................................................................................ 28
Feed-water pre-treatment requirements .................................................. 29
Rejected brine.......................................................................................... 29
Post-treatment requirements.................................................................... 29
Feed sea-water salinity ............................................................................ 30
Lifetime expectancy ................................................................................. 30
5. Cost comparison ........................................... 31 Investment cost ............................................................................ 32 Cost of produced water................................................................ 33
Multistage flash distillation: MSF + COGEN............................................. 34
Multiple effect distillation: MED + COGEN............................................... 36
Seawater reverse Osmosis (SWRO) ....................................................... 38
Overall cost comparison.............................................................. 40
4. Conclusions................................................... 43
CO-OPET – WP No. 7: Water and Power co-generation implementation in the Mediterranean islands and coastal areas
5
1. Introduction
Background
This handbook is the result of the EC-funded OPET Program “CO-OPET:
Support Initiative for the Organisation for Promotion of Energy
Technologies”. Its objective is to present opportunities of commercial
desalination technologies exploiting waste heat from power plants and to
assess the possibility of their implementation on small islands with limited
fresh water resources.
Human communities living in hot and arid areas, or on islands in the sea,
usually are in bad need for both water and power (electricity). Especially in
hot climates, both these needs follow a similar demand curve, daily as well
as seasonally. Both cooling and water demand reach their respective
peaks during midday and during the hot summer season.
Conventional Cogeneration, namely Combined Heat and Power (CHP) is
usually not very convenient in hot climates since there is no sufficient
demand for the available waste heat. - So why not produce instead water
and power by exploiting the otherwise wasted exhaust heat (or waste
heat) from thermal power plants to drive thermal seawater desalination
systems?
In large scale applications, such as in Saudi Arabia and in the Arab Gulf
Emirates, this technology is already a common and well proven practice.
Also large ships adopt similar seawater desalination systems exploiting the
waste heat from the ship’s main propulsion systems. So why aren’t such
technologies used for small scale stationary applications on islands or
serving isolated communities on arid coasts?
CO-OPET – WP No. 7: Water and Power co-generation implementation in the Mediterranean islands and coastal areas
6
The aim of this handbook is to assist decision makers on islands by
providing an appropriate (and rapid) economic evaluation tool for possible
seawater desalination applications, based on the present energy/water
supply situation, and taking into account the specific constraints arising
from the limited size of the examined “island systems”.
For more details on the presented technology options, please refer to the
report “Study on technical and economic constraints and opportunities”
prepared under the same project.
Application field
The present investigation focuses on the large majority of smaller islands
in the Mediterranean sea, with resident (stable) inhabitants between
100 - 20.000 inhabitants, and which do not have an electrical under-sea
cable connection to the continent, and rely therefore on local thermal
power plants (usually diesel gensets) for their electricity supply, and which
represent therefore the energy source potentially exploitable “for free”.
Accordingly the following approximate power and water needs may be
assumed for such islands:
CO-OPET – WP No. 7: Water and Power co-generation implementation in the Mediterranean islands and coastal areas
7
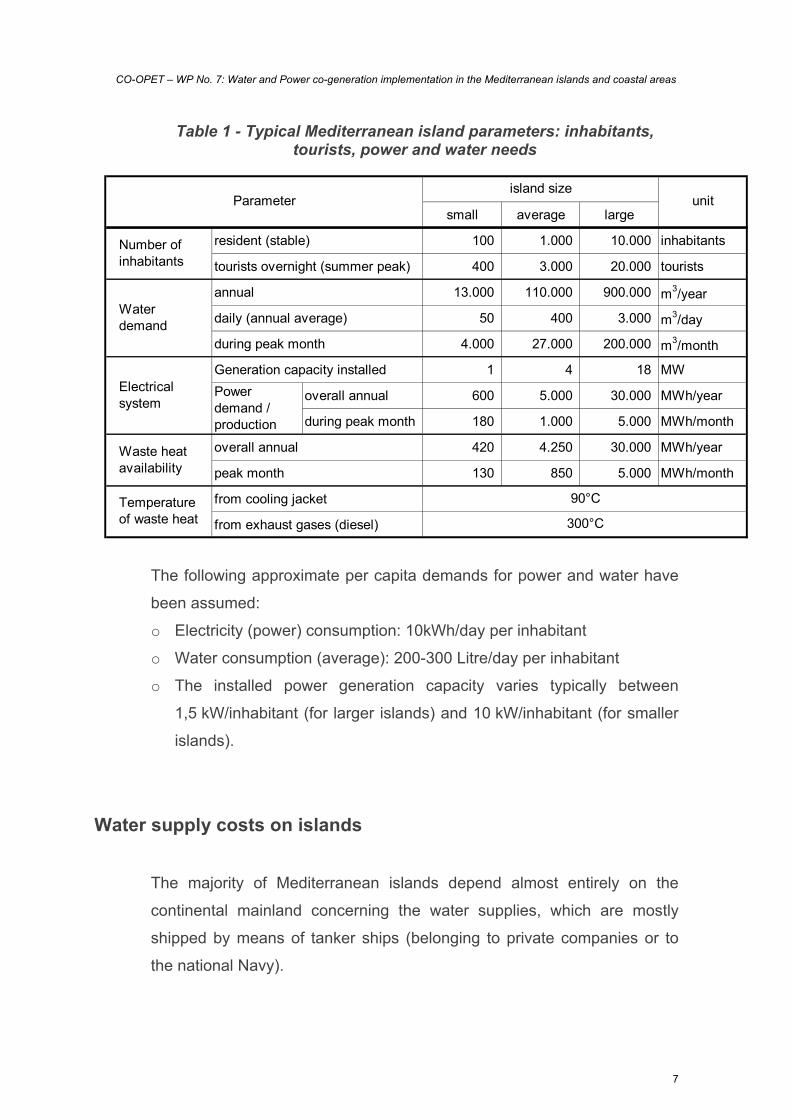
Table 1 - Typical Mediterranean island parameters: inhabitants, tourists, power and water needs
small average large
resident (stable) 100 1.000 10.000 inhabitants
tourists overnight (summer peak) 400 3.000 20.000 tourists
annual 13.000 110.000 900.000 m3/year
daily (annual average) 50 400 3.000 m3/day
during peak month 4.000 27.000 200.000 m3/month
Generation capacity installed 1 4 18 MW
overall annual 600 5.000 30.000 MWh/year
during peak month 180 1.000 5.000 MWh/month
overall annual 420 4.250 30.000 MWh/year
peak month 130 850 5.000 MWh/month
from cooling jacket
from exhaust gases (diesel)
unit
Number of inhabitants
Power demand / production
90°C
300°CTemperature of waste heat
island size
Waste heat availability
Water demand
Electrical system
Parameter
The following approximate per capita demands for power and water have
been assumed:
o Electricity (power) consumption: 10kWh/day per inhabitant
o Water consumption (average): 200-300 Litre/day per inhabitant
o The installed power generation capacity varies typically between
1,5 kW/inhabitant (for larger islands) and 10 kW/inhabitant (for smaller
islands).
Water supply costs on islands
The majority of Mediterranean islands depend almost entirely on the
continental mainland concerning the water supplies, which are mostly
shipped by means of tanker ships (belonging to private companies or to
the national Navy).
CO-OPET – WP No. 7: Water and Power co-generation implementation in the Mediterranean islands and coastal areas
8
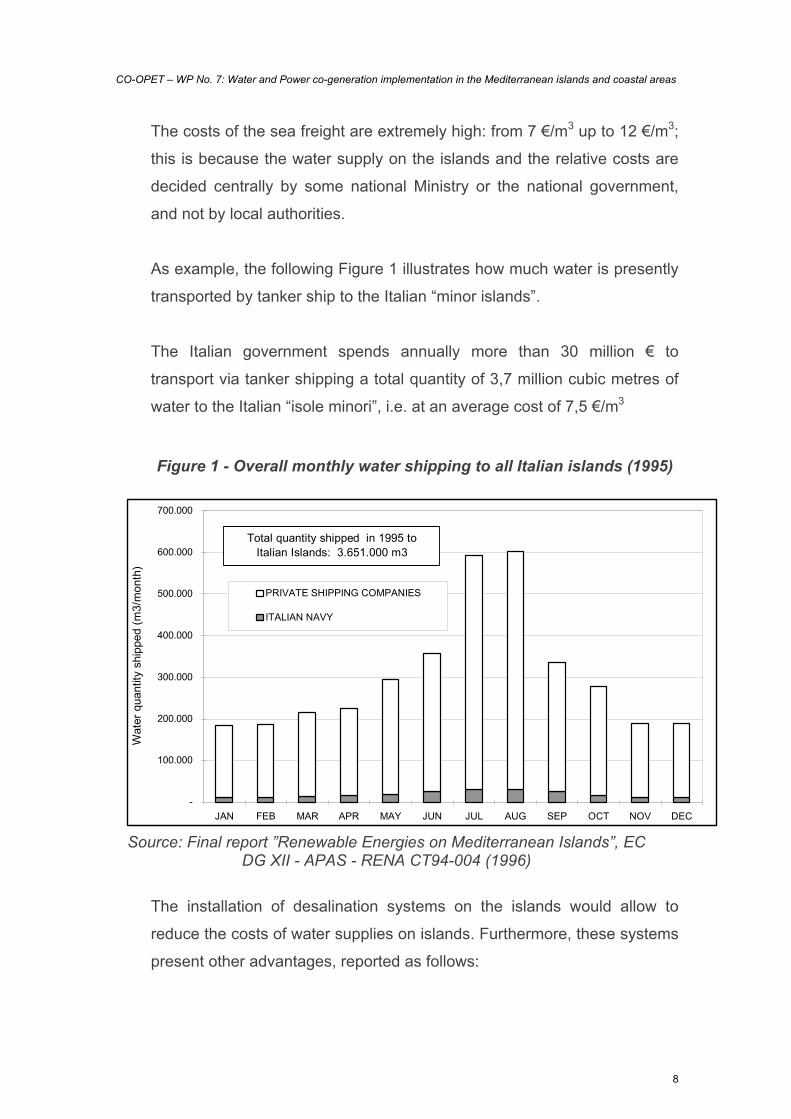
The costs of the sea freight are extremely high: from 7 €/m3 up to 12 €/m3;
this is because the water supply on the islands and the relative costs are
decided centrally by some national Ministry or the national government,
and not by local authorities.
As example, the following Figure 1 illustrates how much water is presently
transported by tanker ship to the Italian “minor islands”.
The Italian government spends annually more than 30 million € to
transport via tanker shipping a total quantity of 3,7 million cubic metres of
water to the Italian “isole minori”, i.e. at an average cost of 7,5 €/m3
Figure 1 - Overall monthly water shipping to all Italian islands (1995)
-
100.000
200.000
300.000
400.000
500.000
600.000
700.000
JAN FEB MAR APR MAY JUN JUL AUG SEP OCT NOV DEC
Wat
er q
uant
ity s
hipp
ed (m
3/m
onth
)
PRIVATE SHIPPING COMPANIES
ITALIAN NAVY
Total quantity shipped in 1995 to Italian Islands: 3.651.000 m3
Source: Final report ”Renewable Energies on Mediterranean Islands”, EC
DG XII - APAS - RENA CT94-004 (1996)
The installation of desalination systems on the islands would allow to
reduce the costs of water supplies on islands. Furthermore, these systems
present other advantages, reported as follows:
CO-OPET – WP No. 7: Water and Power co-generation implementation in the Mediterranean islands and coastal areas
9
• Independence from water supplies from the continent, allowing to
ensure water availability to both tourists and the island inhabitants, and
independent from meteorological conditions.
• Excellent water quality; in fact in this way the contamination by germs
due to shipping is avoided
• Economic opportunities in terms of technical competences, qualified
jobs, representing a model for sustainable tourism and development.
In the case of desalination plants using thermal processes of distillation,
the best solution is to combine these plants with the power plants, in order
to use the waste heat of the power plant to drive the desalination plant.
Electricity costs on islands
Usually, on the smaller islands in the Mediterranean Sea, the price paid by
consumers for electricity does not reflect the real costs of their electricity
supply.
The high cost of conventional (diesel) power on islands is in most cases
hidden by subsidised consumer tariffs intended to alleviate the hardships
of life of island populations. The gap between tariffs paid by consumers
and the actual costs of energy (and of water) on islands is covered either
by government subsidies (for example by the “Cassa Conguagli” in Italy)
or else by the national utility (like PPC in Greece). In any case it is always
the national (mainland) community as a whole to cover these costs.
Subsidised consumer tariffs produce a market distortion giving new
technologies, such as seawater desalination or renewable energy sources,
no chance to win competition with conventional (subsidised) power and
water supplies. If these new technologies would be permitted to compete
under fair (equal) conditions, on the islands, they would frequently win.
CO-OPET – WP No. 7: Water and Power co-generation implementation in the Mediterranean islands and coastal areas
10
Subsidised tariffs induce islanders not to save, but to boost consumptions,
making the water and power supplies larger and more expensive.
Furthermore they freeze the existing (conventional) water and power
supply system on islands, since there is no economic interest to improve
the system and to introduce innovations.
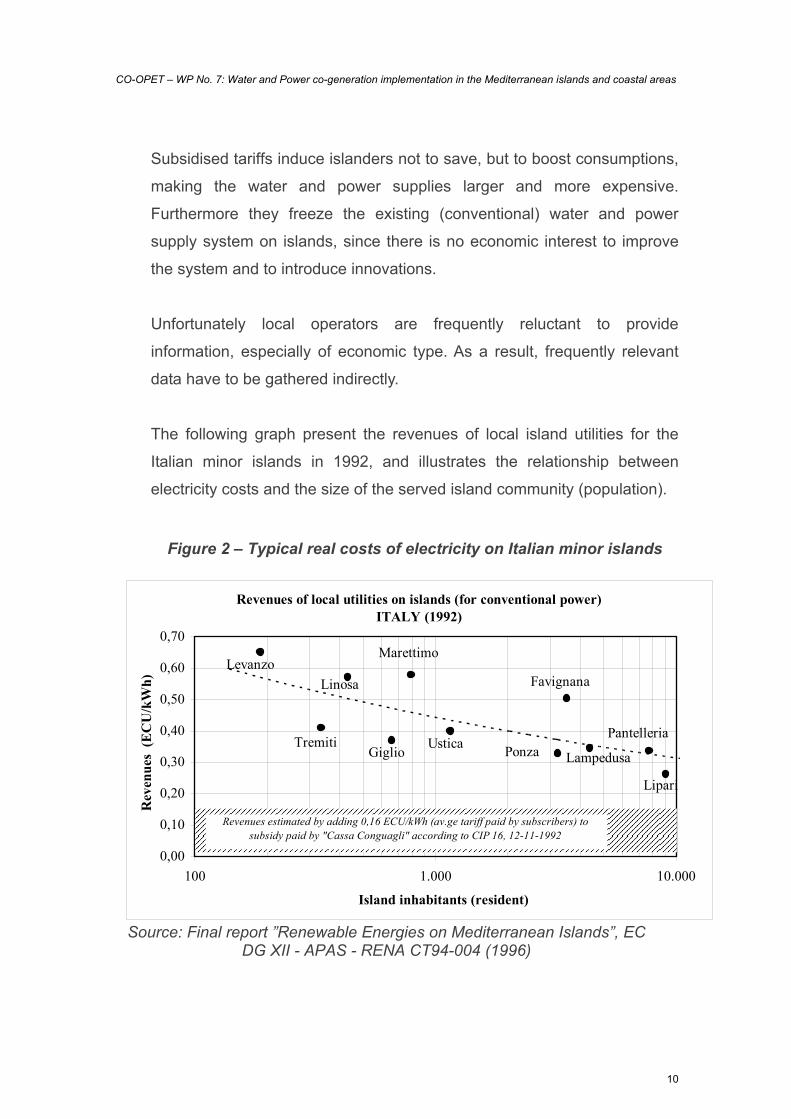
Unfortunately local operators are frequently reluctant to provide
information, especially of economic type. As a result, frequently relevant
data have to be gathered indirectly.
The following graph present the revenues of local island utilities for the
Italian minor islands in 1992, and illustrates the relationship between
electricity costs and the size of the served island community (population).
Figure 2 – Typical real costs of electricity on Italian minor islands
Revenues of local utilities on islands (for conventional power) ITALY (1992)
0,00
0,10
0,20
0,30
0,40
0,50
0,60
0,70
100 1.000 10.000
Island inhabitants (resident)
Rev
enue
s (E
CU
/kW
h)
Levanzo
Giglio
Lipari
Pantelleria
LampedusaPonza
Marettimo
Tremiti
Linosa Favignana
Revenues estimated by adding 0,16 ECU/kWh (av.ge tariff paid by subscribers) to subsidy paid by "Cassa Conguagli" according to CIP 16, 12-11-1992
Ustica
Source: Final report ”Renewable Energies on Mediterranean Islands”, EC
DG XII - APAS - RENA CT94-004 (1996)
CO-OPET – WP No. 7: Water and Power co-generation implementation in the Mediterranean islands and coastal areas
11
2. Desalination as an alternative solution
Desalination is the process of removing salt from saline water and
producing fresh potable water. It provides an alternative option for drinking
quality water and fosters development in arid or coastal regions with
limited groundwater resources or located far from conventional water
resources. Even if desalination technology is used solely for the production
of non-drinking quality water, it helps preserve existing resources from
over-exploitation and mismanagement.
Desalination technology has evolved considerably over the past 50 years
and has proved its technical feasibility. The average price of desalinated
seawater today is estimated to be only one-tenth of what it was twenty
years ago, making it a viable solution for the supply of water to islands.
A large number of desalination plants have been installed throughout the
world, the majority of which can be found in the Middle East and the
Caribbean islands. Despite still being overall more expensive than
conventional applications due to its intensive use of energy, desalination
has proved in various cases to be more reliable and economic solution. In
the case of transportation of water by marine vessels, desalination has
emerged as a less expensive alternative.
The total worldwide desalination capacity in 1971 was reported to be
around 1,5 million m3/day. In 1996 this had risen to 20,3 million m3/day,
with approximately 11.000 installations spread in 120 countries all over the
world (Source: Raphael Semiat). It is estimated that today, there are
approximately 13,600 desalination units, which currently produce 26
million m3/day of fresh water each day. Desalination capacity according to
the U.S. Department of the Interior, Bureau of Reclamation, increases
12 % annually.

CO-OPET – WP No. 7: Water and Power co-generation implementation in the Mediterranean islands and coastal areas
12
The Middle East region has approximately 50 % of the desalination
capacity, with the Kingdom of Saudi Arabia accounting for 30 % of the
total world percentage and hosting the largest plant capable of delivering
close to one million m3/day using the MSF technique. There are
approximately 1,000 units installed in the United States, mostly based on
the RO technology, which account for 15 % of the world’s production.
The integration of desalination technologies into power plants makes
possible the utilisation of waste heat usually discharged to the atmosphere
for the production of potable water. Accordingly the combined production
of power (electricity) and water reduces both the production costs of
electricity and of water. Examples of such desalination co-generation
plants can be found all over the world, and particularly in the Middle East.
General
Desalination, also called desalinization or desalting, refers to a water
treatment process that removes salts from water. Desalination can be
done in different ways, but the result is always the same: fresh water is
produced from brackish (up to 10g/L) or sea water (up to 50g/L). Desalting
devices essentially separate saline water into two streams: one with a low
concentration of dissolved salts (the fresh water stream) and the other
containing the remaining dissolved salts (the concentrate or brine stream)
– (Buros, 1999).
Conceivably the most important characteristic with regard to the
desalination process is the water salinity. Salinity refers to the
concentration of dissolved minerals in water and it is often described as
total dissolved solids (TDS). It is either expressed in ppm (parts per
million) or in mg/Litre. The concentration of salts in natural water typically
ranges between 1,000 and 30-35,000 ppm. The following table presents
the salinity levels for various natural waters classified by their TDS
concentration:
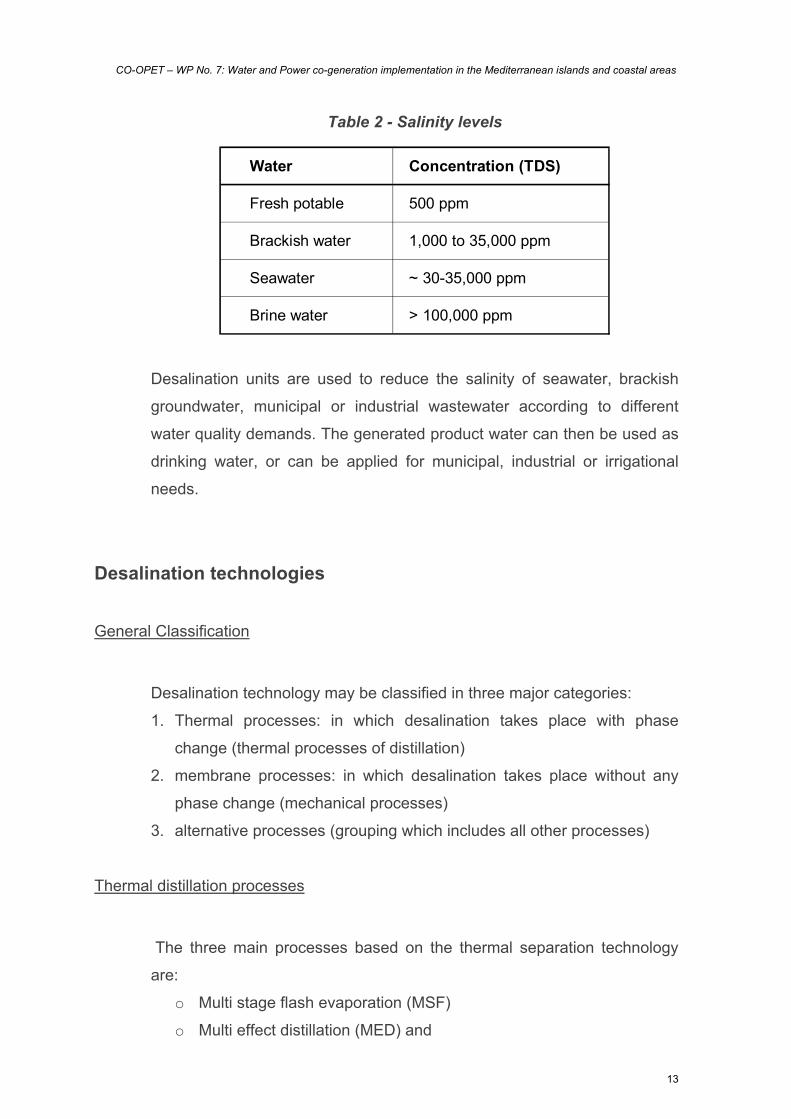
CO-OPET – WP No. 7: Water and Power co-generation implementation in the Mediterranean islands and coastal areas
13
Table 2 - Salinity levels
Water Concentration (TDS)
Fresh potable 500 ppm
Brackish water 1,000 to 35,000 ppm
Seawater ~ 30-35,000 ppm
Brine water > 100,000 ppm
Desalination units are used to reduce the salinity of seawater, brackish
groundwater, municipal or industrial wastewater according to different
water quality demands. The generated product water can then be used as
drinking water, or can be applied for municipal, industrial or irrigational
needs.
Desalination technologies
General Classification
Desalination technology may be classified in three major categories:
1. Thermal processes: in which desalination takes place with phase
change (thermal processes of distillation)
2. membrane processes: in which desalination takes place without any
phase change (mechanical processes)
3. alternative processes (grouping which includes all other processes)
Thermal distillation processes
The three main processes based on the thermal separation technology
are:
o Multi stage flash evaporation (MSF)
o Multi effect distillation (MED) and

CO-OPET – WP No. 7: Water and Power co-generation implementation in the Mediterranean islands and coastal areas
14
o Vapour compression (VC) systems (either MVC or MED-TVC)
Membrane processes
The two main processes based on the membrane technology, consisting
in the mechanical separation of total dissolved solids (TDS) from the pure
water, are:
o Electro dialysis
o Reverse Osmosis
Compared to thermal separation techniques, no phase change is required
making them less energy intensive. Membrane processes have emerged
in the scene during the last four decades. Owing to the latest
developments and the reduced costs in membrane technology, membrane
separation processes are becoming increasingly popular and competitive
and account for one third of the total world desalination capacity.
Advantages/disadvantages
Each of the most important processes for desalination has advantages
and limitations, summarizing as follows.
Advantages of thermal distillation processes: o Suitable to treat sea waters, because salts' content in the water to be
desalinated doesn't meaningfully engrave on the process
o High reliability
o minimal pre-treatment requirements for feed sea-water
o Capability to exploit low enthalpy waste heat from power plants.
o Economical if a cheap heat source is available.
Disadvantages of thermal distillation : o Amount of water production depends on operating temperature.
o Tube scaling, which occurs at high temperatures by CaSO4. This
introduces a limit to the top brine temperature (of 120°C), and
consequently to the efficiency.
CO-OPET – WP No. 7: Water and Power co-generation implementation in the Mediterranean islands and coastal areas
15
o The energy consumption of these processes is quite high and depends
mainly on the temperature and GOR.
Advantages of Reverse Osmosis:
o Relatively low energy consumption (but only in terms of final energy
use).
o Smaller and more compact.
o lower investment
Disadvantages of Reverse Osmosis: o thermal stability limit of the membrane
o the sensitivity of membranes to fouling (erroneous operation can
reduce the life of a membrane to less than one year)
o lower water quality as compared to thermal distillation
o need for expensive pre-treatment (feed water must pass through very
narrow passages, suspended solids must be removed)
o Needs expensive electricity as main drive power
o High maintenance requirements
o High operating costs
The following table provides an overview of the available technologies and
the form of energy required to drive the process.
Table 3 - Various desalination technologies
Form of Energy used
Multi Stage flash Evaporation (MSF)
Multi Effect Distillation (MED)
Vapour compression (VC) Heat or mechanical energy
Reverse Osmosis (RO)
Electrodialysis (ED)
Heat
Mechanical or Electrical Energy
Ion exchange (IX), Freeze, Solar, nuclear, submarine desalination
Solar, nuclear, mechanical, thermal energy
Membrane
Alternative
Desalination Technology
Thermal
CO-OPET – WP No. 7: Water and Power co-generation implementation in the Mediterranean islands and coastal areas
16
For more details on the presented technologies, please refer to the report
“Study on technical and economic constraints and opportunities” prepared
under the same project.
The following table presents a summary of the available desalination
processes and related typical process parameters.
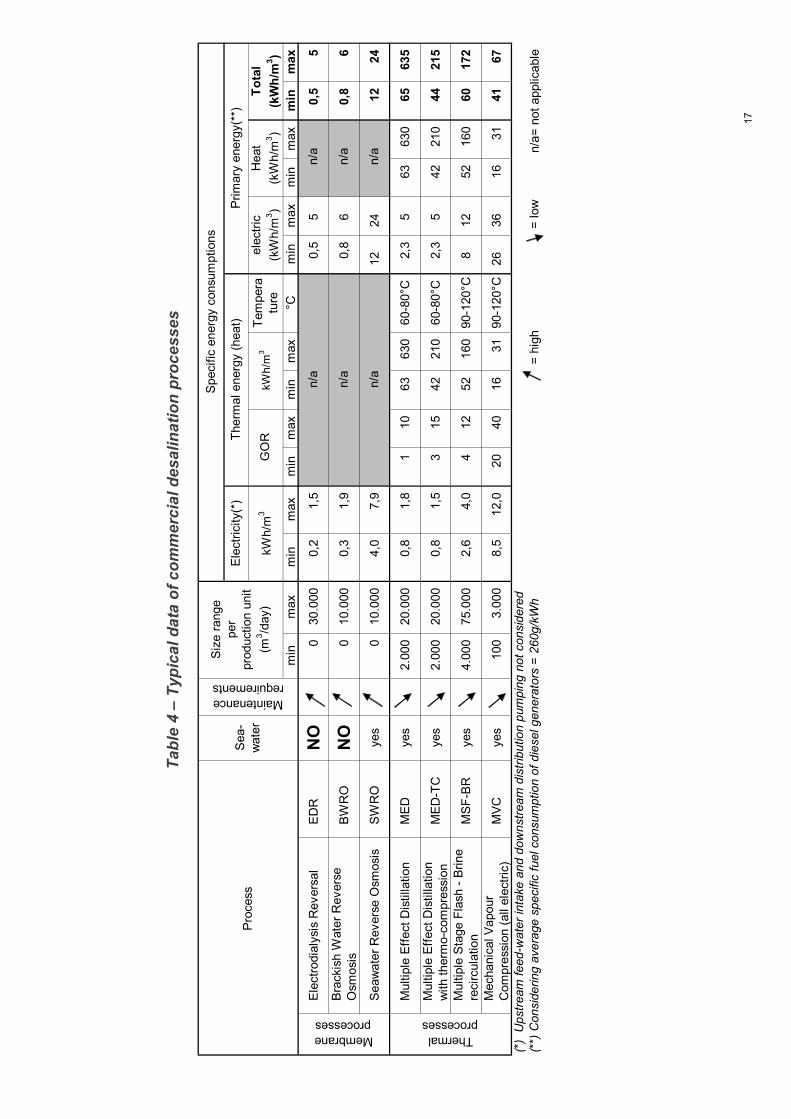
17
Tabl
e 4
– Ty
pica
l dat
a of
com
mer
cial
des
alin
atio
n pr
oces
ses Tem
pera
ture
min
max
min
max
min
max
min
max
°Cm
inm
axm
inm
axm
inm
ax
Elec
trodi
alys
is R
ever
sal
EDR
N
O0
30
.000
0,
2
1,
5
0,
5
5
0,5
5
Brac
kish
Wat
er R
ever
se
Osm
osis
BW
RO
N
O0
10
.000
0,
3
1,
9
0,
8
6
0,8
6
Seaw
ater
Rev
erse
Osm
osis
SWR
O
yes
0
10.0
00
4,0
7,9
12 24
12
24
Mul
tiple
Effe
ct D
istil
latio
nM
ED
yes
2.00
0
20.0
00
0,8
1,8
1
10
63
63
0
60-8
0°C
2,3
5
63
630
65
635
Mul
tiple
Effe
ct D
istil
latio
n w
ith th
erm
o-co
mpr
essi
onM
ED-T
C
yes
2.00
0
20.0
00
0,8
1,5
3
15
42
21
0
60-8
0°C
2,3
5
42
210
44
215
Mul
tiple
Sta
ge F
lash
- Br
ine
reci
rcul
atio
nM
SF-B
R
yes
4.00
0
75.0
00
2,6
4,0
4
12
52
16
0
90-1
20°C
8
12 52
160
60
172
Mec
hani
cal V
apou
r C
ompr
essi
on (a
ll el
ectri
c)M
VC
yes
100
3.00
0
8,5
12,0
20
40
16
31
90-1
20°C
26 36
16
31
41
67
(*)
Ups
tream
feed
-wat
er in
take
and
dow
nstre
am d
istri
butio
n pu
mpi
ng n
ot c
onsi
dere
d (*
*) C
onsi
derin
g av
erag
e sp
ecifi
c fu
el c
onsu
mpt
ion
of d
iese
l gen
erat
ors
= 26
0g/k
Wh
= hi
gh=
low
n/a=
not
app
licab
le
Sea-
wat
erTh
erm
al e
nerg
y (h
eat)
kWh/
m3
elec
tric
(kW
h/m
3 )
Maintenance requirements
Hea
t (k
Wh/
m3 )
Tota
l (k
Wh/
m3 )
kWh/
m3
Size
rang
e pe
r pr
oduc
tion
unit
(m3 /d
ay)
n/a
n/a
n/a
Spec
ific
ener
gy c
onsu
mpt
ions
n/a
n/a
n/a
Prim
ary
ener
gy(*
*)
Elec
trici
ty(*
)
GO
R
Thermal processes
Membrane processes
Proc
ess
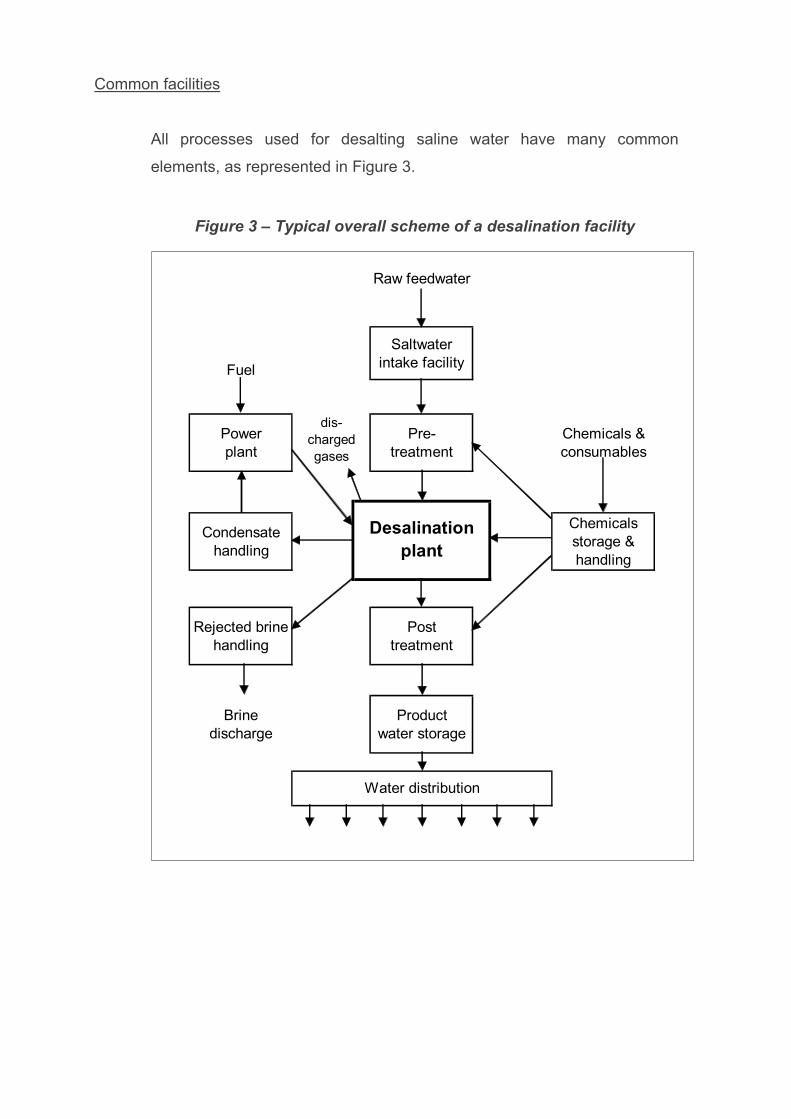
Common facilities
All processes used for desalting saline water have many common
elements, as represented in Figure 3.
Figure 3 – Typical overall scheme of a desalination facility
Fuel
Saltwater intake facility
Power plant
Pre-treatment
Chemicals & consumables
Condensate handling
Chemicals storage & handling
Rejected brine handling
Post treatment
Brine discharge
Product water storage
Raw feedwater
dis-charged gases
Desalination plant
Water distribution
CO-OPET – WP No. 7: Water and Power co-generation implementation in the Mediterranean islands and coastal areas
19
As illustrated, the water needs some treatment before being sent to the
desalination plant, where product water is produced; it depends on the
feedwater composition, on the type of process and on downstream
equipment.
Along with product water are produced few more streams, as concentrated
reject brine but also gases and condensate.
Desalinated product water is usually not suitable for consumption without
some form of treatment, during which chemicals are added to make it
potable and not corrosive for distribution pipes. At the end, treated water is
pumped to storage tanks or sent directly into the distribution system.
Market share and trends
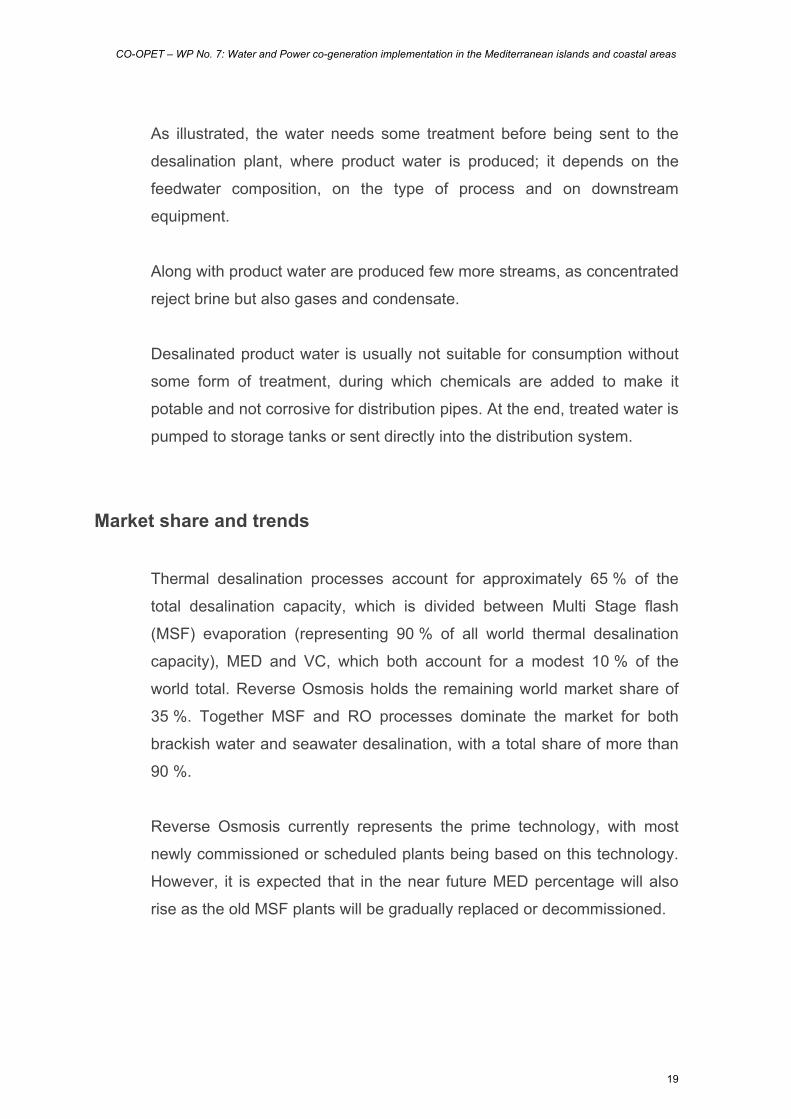
Thermal desalination processes account for approximately 65 % of the
total desalination capacity, which is divided between Multi Stage flash
(MSF) evaporation (representing 90 % of all world thermal desalination
capacity), MED and VC, which both account for a modest 10 % of the
world total. Reverse Osmosis holds the remaining world market share of
35 %. Together MSF and RO processes dominate the market for both
brackish water and seawater desalination, with a total share of more than
90 %.
Reverse Osmosis currently represents the prime technology, with most
newly commissioned or scheduled plants being based on this technology.
However, it is expected that in the near future MED percentage will also
rise as the old MSF plants will be gradually replaced or decommissioned.
CO-OPET – WP No. 7: Water and Power co-generation implementation in the Mediterranean islands and coastal areas
20
Figure 4 –World market shares of desalination technologies
35%
59%
6%
RO MFS VC & MED

CO-OPET – WP No. 7: Water and Power co-generation implementation in the Mediterranean islands and coastal areas
21
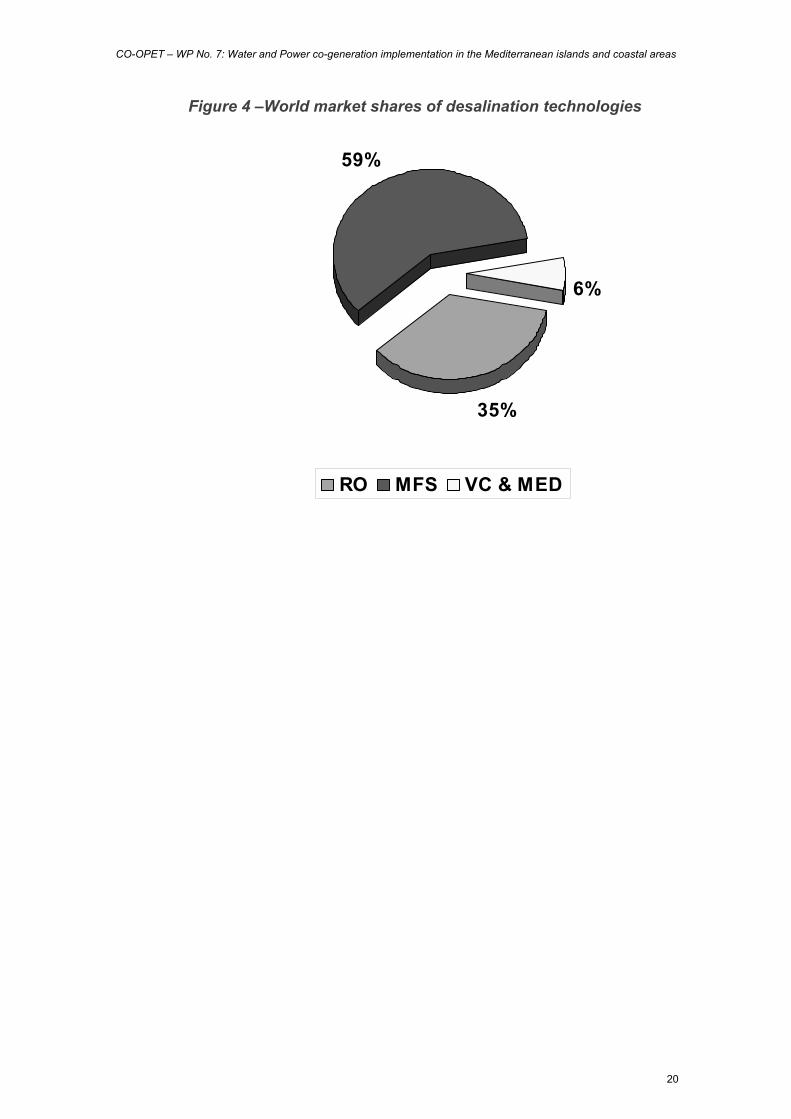
3. Cogeneration Conventional Cogeneration - Combined Heat and Power (CHP)
Cogeneration, so-called combined heat and power (CHP) generation
allows to obtain significant reductions in the consumptions of primary
energy source and in emissions of gases responsible for climate change
(CO2).
Generally electricity and heat are produced separately in different
locations: Centralised thermal power plants usually consume fuel is to
produce electricity by, while heat is produced in homes and elsewhere by
means of domestic boilers. Co-generation, the combined production of
Heat and Power (CHP) is instead able to produce both electricity and heat
consuming fuel only once; in this way, compared to separate generation,
co-generation allows to save approximate 30-40% of the otherwise
required primary energy source.
As illustrated by Figure 5 in comparison to the separate generation of heat
and electricity, co-generation allows to achieve substantial environmental
and energy saving benefits; however, just because these advantages
arise from a combined production, it’s necessary to use the produced
thermal energy.
Moreover, since the load profiles (over daytime and seasonally) differ
between electricity demand and heat demand, co-generation is convenient
only if the electricity demand and the heat demand follow a similar profile.
CO-OPET – WP No. 7: Water and Power co-generation implementation in the Mediterranean islands and coastal areas
22
Figure 5 – Comparison in terms of primary energy source consumption (supplying same end use energy to consumer)
between: a) CHP
34 %
7%
19 %
38 %
2%
b) separate heat and power production
7% 2%
38%
19%
66 %

CO-OPET – WP No. 7: Water and Power co-generation implementation in the Mediterranean islands and coastal areas
23
Cogeneration of Power and Water
The heat made available by a CHP plant may be exploited to thermally
distillate sea-water and to produce fresh-water for civil consumption.
Actually, the best solution to desalinate great quantities of sea water
consists in combining a desalination plant with another industrial plant or a
thermal power plant generating waste heat which otherwise would be lost
to the environment.
For the envisaged target application range on small islands in the
Mediterranean sea, the local thermal power generation facility will usually
be a diesel power plant. Accordingly the following considerations focus
primarily on diesel systems to be exploited as waste heat source.
The typical electrical efficiency of a diesel engine ranges between 35-
40 %. Theoretically the remaining 60-65 % of losses and waste heat
provides a magnitude of the thermal energy potentially available since
rejected from different systems in the diesel engine (exhaust gases,
cylinder cooling jacket, oil cooler, turbocharger air cooler etc).
Nevertheless, only a portion of this heat can be recovered at temperatures
which can be effectively exploited to drive a desalination process.
Substantial quantities of heat are available in the exhaust gas from the
engines. Nevertheless there are some limitations on the amount of heat
which can be recovered from this source. In case that the consumed fuel
contains sulphur, sulphur dioxide may be present in the exhaust. If the
temperature of the exhaust gas is reduced to the dew point, sulphur
dioxide will react with water vapour to form sulphuric acid which will result
in corrosion in the exhaust system and stack. For this reason the exit
temperature should be maintained above 180°C. This and other
restrictions limits the amount of heat which can be effectively recovered
from a diesel engine to about half of the theoretically available waste heat.

CO-OPET – WP No. 7: Water and Power co-generation implementation in the Mediterranean islands and coastal areas
24
Accordingly, nearly the same amount of thermal energy (heat expressed in
kWh) as the electric energy generated by a diesel power plant may be
made available to drive a desalination system. Since no additional fuel is
consumed for this purpose, de-facto this thermal energy (heat) is available
at no additional cost, i.e. it is “for free”.
For the design of a desalination plant driven by the waste heat generated
by a diesel engine, the heat output from the diesel power plant will come
primarily from two specific heat sources:
1. Steam from the waste heat recovery boiler exploiting the hot exhaust
gases of the diesel engine
2. Heat recovered from the cooling water jacket of the diesel engine and
from the turbocharger air cooler.

4. Performance evaluation General criteria
Desalination is a relatively sophisticated and expensive way to obtain fresh
water. Related processes are quite complex and the degree of complexity
is directly related to the size of the system. In order to evaluate, case by
case, the most appropriate process for seawater desalination, the
following factors should be taken into account.
Product water quality and quantity
Based on an initial estimate of the amount of water required, some
processes may not be considered. For example, if we are considering
desalinated sea-water to be supplied to an arid Middle East city, with no
alternatively freshwater sources, the quantity of water required is massive
and the only processes to consider are seawater distillation and seawater
RO. The end use determines the product water quality; feed water
contains many impurities, some of these may be removed during pre-
treatment and other during the desalting process itself. The final product
may still contain certain undesirable constituent and for this reason
sometimes post-treatment is required. The type and extent of post-
treatment required is determined by the product concentration desired.
Feedwater temperature
Feedwater temperature may affect process selection or the design of a
particular process. It affects the heat economy of distillation processes,
because at higher temperatures the overall temperature drop in the plant
is reduced. In ED process, higher temperatures are beneficial, because,
for a given current density, power consumption is decreased. Instead
higher temperatures may have a negative effect on RO membranes.

CO-OPET – WP No. 7: Water and Power co-generation implementation in the Mediterranean islands and coastal areas
26
Availability of cheap energy
Availability of cheap energy should be evaluated from all angles (type,
source, availability, quality and cost). Higher efficiency plants are more
complex in design and operation but they save fuel. If intermittent
operation is required, a system with low capital and high operation cost is
favoured. Where constant desalted water supply is required, the rate of
energy consumption is of great importance. If both electricity and water are
required the desalination and power plant may be integrated into a dual
purpose plant, in fact, due to savings in fuel and common facilities, the
economics may change appreciably.
Waste brine disposal
Provisions have to be made to dispose reject brine without causing
adverse environmental impacts.
For plants located near the sea, reject lines can be channelled directly into
the sea, but for inland desalination plants it is usually difficult to find areas
where brine may safely disposed of. In general, disposal into the sea is
cheaper and less hazardous compared to inland site disposal. Anyway,
the solution of these problems adds to the product costs.
Location
The plant should be sited as close as possible to the feedwater source, in
order to avoid excessive pumping and pipeline constrains. Moreover, the
location should preferably be near both the energy source and the
demand areas.
Process economics
The cost of desalting water needs to be accurately evaluated. Cost may be
subdivided in two major components:

CO-OPET – WP No. 7: Water and Power co-generation implementation in the Mediterranean islands and coastal areas
27
o Capital costs: include site development, desalting equipment, brine
disposal, water treatment, steam supply, power supply, project
management, etc
o Operating costs: include operating manpower, maintenance
materials, chemicals, steam/fuel, electric power, etc.
Usually, these two cost factors behave inversely, i.e. the lower the capital
cost, the higher will be the operating costs, and vice versa.
If the required drive energy (fuel and electricity) is expensive, a high
performance ratio will be required to reduce energy requirements, and as
a result the investment costs will have to be higher.
Instead, if the drive energy is cheap, the required performance ratio may
be lower, and this in turns allows to reduce the investment cost.
Thermal versus membrane processes
The main differences between the two main desalination process classes,
namely thermal distillation and membrane processes may be summarised
as follows:
Energy consumption
Thermal distillation technologies are apparently an order of magnitude
more energy intensive than membrane processes (in terms of energy
quantity - kWh). This is the reason why, erroneously, thermal distillation
processes are frequently considered less energy efficient.
Distillation processes do not need high exergy energy such as electricity,
but only low enthalpy (low temperature => low exergy) heat of low value
which is, from an energy efficiency point of view, not at all comparable to
the highly valuable expensive electricity (or mechanical power) required to
power membrane processes.
CO-OPET – WP No. 7: Water and Power co-generation implementation in the Mediterranean islands and coastal areas
28
In fact, membrane systems cannot benefit from the utilisation of waste
heat as an integrated unit within the power plant since they require
mechanical or electrical energy to operate.
Distillation technologies can instead be powered by waste heat, which is
frequently available “for free”, reducing thereby the energy costs and
making water production much more competitive.
The fact that they use a much larger amount of energy is thereby of
secondary importance and more than compensated by their ability to
exploit waste heat “for free”, which otherwise would be discharged to the
environment.
Scale economy
Distillation plants benefit much from scale economy. As a result, thermal
plants generally tend to be larger and bulkier than membrane plants. For
the same desalting capacity, thermal technologies require larger desalting
surfaces which make them more expensive.
Thermal desalination systems have larger requirements for desalting
surfaces. The cost of desalination unit are much more expensive since
they are proportional to the heat exchange area.
Maintenance
Membrane technology has made significant progress and now can offer
more efficient and cheaper membranes. Membrane lifetime spans usually
from 3 to 5 years after which they must be replaced, a considerable cost
parameter in the operation and the feasibility of a plant.
Membrane fouling after a few thousand hours of operation should be
expected and requires membranes to be regularly cleaned and washed.
Distillation plants require maintenance mainly because of scaling and of
corrosion as a result of too high temperatures.

CO-OPET – WP No. 7: Water and Power co-generation implementation in the Mediterranean islands and coastal areas
29
Thermal distillation systems need expensive materials and plating in order
to avoid corrosion.
Due to possible bacterial contamination, membrane-based plants need to
shut down more often for routine cleaning and maintenance.
Feed-water pre-treatment requirements
Membrane-based units require extensive feed water pre-treatment.
Despite the development of more efficient membranes, pre-treatment is
necessary to avoid membrane fouling, which incurs a high cost in
chemicals. Although new membranes have fewer pre-treatment
requirements, the overall cost still remains significant.
The concentration of dissolved solids essentially determines the process
cost in membrane-based technologies. Desalting seawater may cost about
2 to 5 times more than that of brackish water for the same plant capacity.
Thermal distillation processes present low pre-treatment requirements.
Rejected brine
Due to lower recovery rates, distillation plants produce much higher brine
volumes that need to be disposed of.
On the other hand, the salt concentration of the rejected brine is lower and
therefore less polluting.
Thermal systems require more complex brine disposal systems since
higher temperature brine water needs to be cooled down before disposal.
Post-treatment requirements
Well designed distillation plants manage to remove all organic and
inorganic impurities,
CO-OPET – WP No. 7: Water and Power co-generation implementation in the Mediterranean islands and coastal areas
30
Membrane technologies may require further post-treatment, especially due
to the presence of bacteria. Due to possible bacterial contamination,
membrane-based plants need to shut down more often for routine
cleaning and maintenance.
Feed sea-water salinity
Salinity will determine the distillation cost only for membrane processes.
Thermal distillation is not affected by this parameter.
Distillation processes can process feed water of lower quality than that of
reverse osmosis plant facilities.
Membrane plants have higher recovery level than distillation plants but
reduced salt removal capacity. As a result, water quality purified with RO
or ED may not be of the highest quality.
Lifetime expectancy
Membrane life expectancy should be expected to be 3 to 5 years for
saltwater environment or 5 to 7 years for brackish water, after which it
should be changed. Membrane fouling after a few thousand hours of
operation should be expected and requires them to be regularly cleaned
and washed.
Thermal distillation plants present a typical lifetime of 20-30 years
CO-OPET – WP No. 7: Water and Power co-generation implementation in the Mediterranean islands and coastal areas
31
5. Cost comparison
The following paragraphs and graphs give an approximate picture of the
typical cost structure of the required investments, and ultimately of the
produced water for the desalination technologies of major interest, namely
for:
1. processes driven by waste heat coming from a nearby power plant:
a) Multistage flash distillation (MSF)
b) Multiple Effect Distillation (MED)
2. Seawater Reverse Osmosis (SWRO) as principle alternative solution
typically adopted for same smaller applications, which however uses
expensive electricity and cannot exploit waste heat
In all following graphs the X-axis is logarithmic in order to embrace the
very wide size range from some few cubic metres of water daily, sufficient
to satisfy the water needs of 10-20 families, up to 50.000 m3/day, the
presently largest commercially available desalination technology,
corresponding to the water needs of a European city of approximately
200.000 inhabitants.
Furthermore this type of presentation allows to present the scale economy
effect by means of nearly linear curves, and to take related effects into
account for comparison.
CO-OPET – WP No. 7: Water and Power co-generation implementation in the Mediterranean islands and coastal areas
32
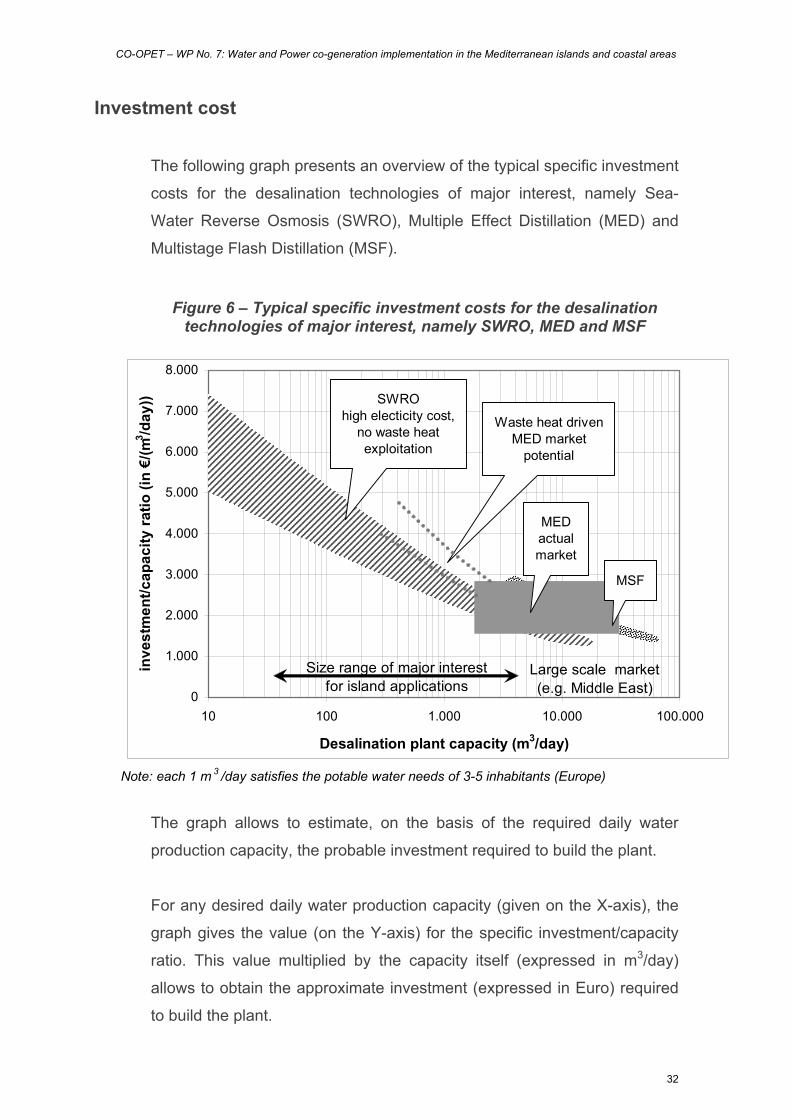
Investment cost
The following graph presents an overview of the typical specific investment
costs for the desalination technologies of major interest, namely Sea-
Water Reverse Osmosis (SWRO), Multiple Effect Distillation (MED) and
Multistage Flash Distillation (MSF).
Figure 6 – Typical specific investment costs for the desalination technologies of major interest, namely SWRO, MED and MSF
Note: each 1 m 3 /day satisfies the potable water needs of 3-5 inhabitants (Europe)
0
1.000
2.000
3.000
4.000
5.000
6.000
7.000
8.000
10 100 1.000 10.000 100.000
Desalination plant capacity (m3/day)
inve
stm
ent/c
apac
ity ra
tio (i
n €/
(m3 /d
ay))
Size range of major interest for island applications
MEDactualmarket
MSF
SWROhigh electicity cost,
no waste heat exploitation
Waste heat driven MED market
potential
Large scale market(e.g. Middle East)
The graph allows to estimate, on the basis of the required daily water
production capacity, the probable investment required to build the plant.
For any desired daily water production capacity (given on the X-axis), the
graph gives the value (on the Y-axis) for the specific investment/capacity
ratio. This value multiplied by the capacity itself (expressed in m3/day)
allows to obtain the approximate investment (expressed in Euro) required
to build the plant.
CO-OPET – WP No. 7: Water and Power co-generation implementation in the Mediterranean islands and coastal areas
33
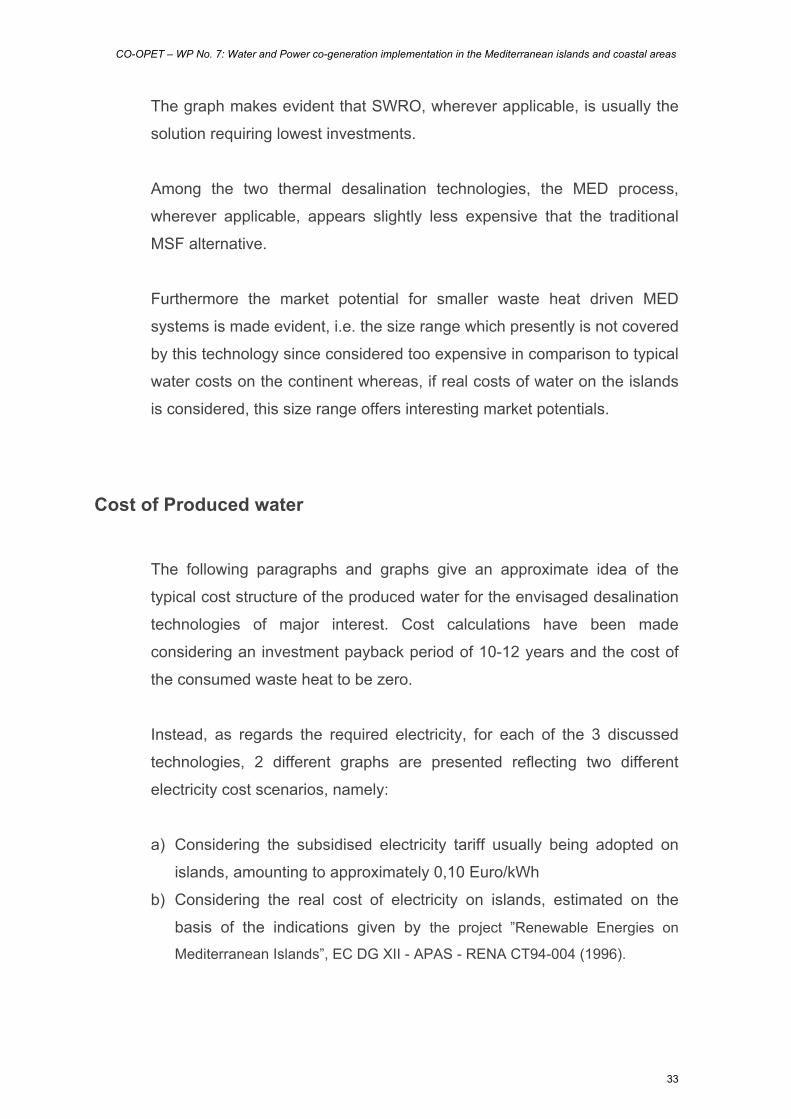
The graph makes evident that SWRO, wherever applicable, is usually the
solution requiring lowest investments.
Among the two thermal desalination technologies, the MED process,
wherever applicable, appears slightly less expensive that the traditional
MSF alternative.
Furthermore the market potential for smaller waste heat driven MED
systems is made evident, i.e. the size range which presently is not covered
by this technology since considered too expensive in comparison to typical
water costs on the continent whereas, if real costs of water on the islands
is considered, this size range offers interesting market potentials.
Cost of Produced water
The following paragraphs and graphs give an approximate idea of the
typical cost structure of the produced water for the envisaged desalination
technologies of major interest. Cost calculations have been made
considering an investment payback period of 10-12 years and the cost of
the consumed waste heat to be zero.
Instead, as regards the required electricity, for each of the 3 discussed
technologies, 2 different graphs are presented reflecting two different
electricity cost scenarios, namely:
a) Considering the subsidised electricity tariff usually being adopted on
islands, amounting to approximately 0,10 Euro/kWh
b) Considering the real cost of electricity on islands, estimated on the
basis of the indications given by the project ”Renewable Energies on
Mediterranean Islands”, EC DG XII - APAS - RENA CT94-004 (1996).
CO-OPET – WP No. 7: Water and Power co-generation implementation in the Mediterranean islands and coastal areas
34
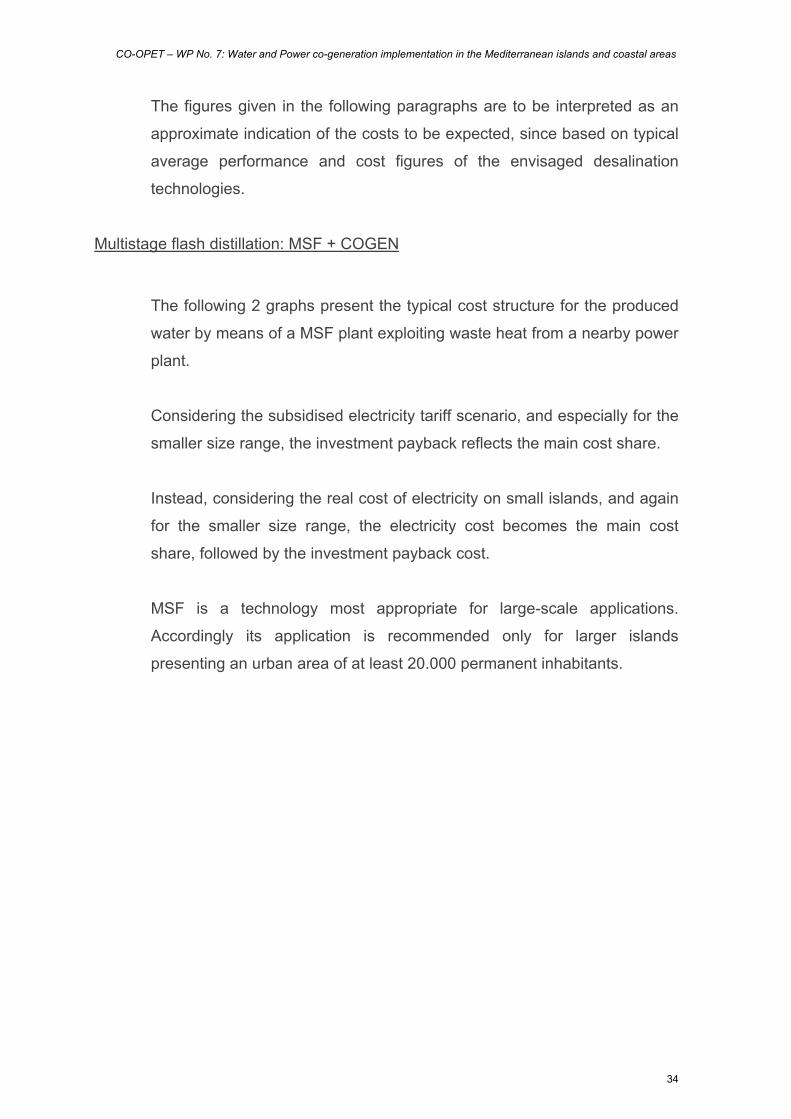
The figures given in the following paragraphs are to be interpreted as an
approximate indication of the costs to be expected, since based on typical
average performance and cost figures of the envisaged desalination
technologies.
Multistage flash distillation: MSF + COGEN
The following 2 graphs present the typical cost structure for the produced
water by means of a MSF plant exploiting waste heat from a nearby power
plant.
Considering the subsidised electricity tariff scenario, and especially for the
smaller size range, the investment payback reflects the main cost share.
Instead, considering the real cost of electricity on small islands, and again
for the smaller size range, the electricity cost becomes the main cost
share, followed by the investment payback cost.
MSF is a technology most appropriate for large-scale applications.
Accordingly its application is recommended only for larger islands
presenting an urban area of at least 20.000 permanent inhabitants.
CO-OPET – WP No. 7: Water and Power co-generation implementation in the Mediterranean islands and coastal areas
35
Figure 7 – MSF + COGEN – Waste heat driven MSF - Typical cost structure of produced water considering a subsidised electricity tariff
of 0,10Euro/kWh
Figure 8 – MSF + COGEN – Waste heat driven MSF - Typical cost structure of produced water considering the real cost of electricity on
small islands
0
1
2
1.000 10.000 100.000
capacity (m3/day)
Wat
er c
ost (
Euro
/m3 )
+ maintenance= total
+ consumables
+ electricity
+ personnel
investmentpayback
Subsidisedelectriticy rate(Euro/kWh)
0
1
2
3
1.000 10.000 100.000
capacity (m3/day)
Wat
er c
ost (
Euro
/m3 )
+ maintenance= total
+ consumables
+ electricity
+ personnel
investmentpayback
Real electricityrate (Euro/kWh)
CO-OPET – WP No. 7: Water and Power co-generation implementation in the Mediterranean islands and coastal areas
36
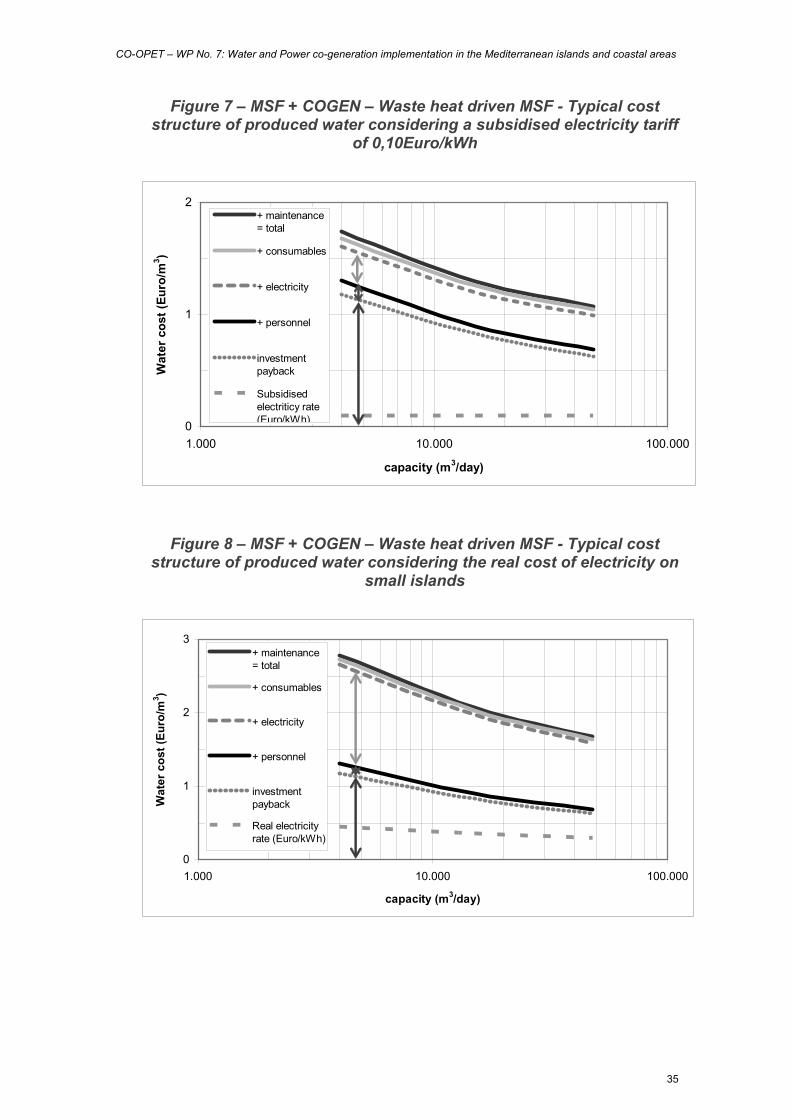
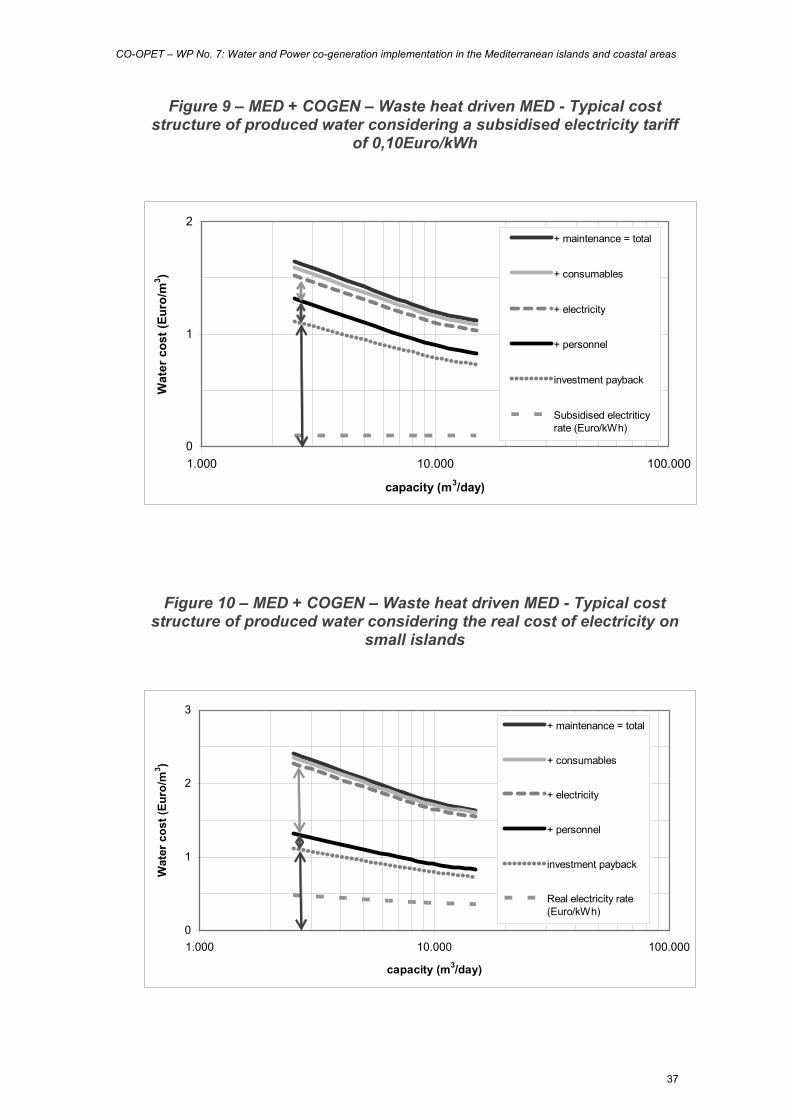
Multiple Effect Distillation: MED + COGEN
The following 2 graphs present the typical cost structure for the produced
water by means of a MED plant exploiting waste heat from a nearby power
plant.
Considering the subsidised electricity tariff scenario, and especially for the
smaller size range, the investment payback represents the main cost
share, and the electricity cost is of minor importance.
Considering instead the real cost of electricity on small islands, the
electricity cost becomes much more important, but the largest cost share
still remains to be the investment payback cost.
MED is a technology most appropriate for medium-scale applications.
Accordingly presently market available technologies allow applications on
medium to large islands presenting an urban area of at least 10.000
permanent inhabitants.
Nevertheless the outcomes of this investigation indicate a market potential
also for smaller applications serving an island population of at least 2000
permanent inhabitants.
CO-OPET – WP No. 7: Water and Power co-generation implementation in the Mediterranean islands and coastal areas
37
Figure 9 – MED + COGEN – Waste heat driven MED - Typical cost structure of produced water considering a subsidised electricity tariff
of 0,10Euro/kWh
Figure 10 – MED + COGEN – Waste heat driven MED - Typical cost structure of produced water considering the real cost of electricity on
small islands
0
1
2
1.000 10.000 100.000
capacity (m3/day)
Wat
er c
ost (
Euro
/m3 )
+ maintenance = total
+ consumables
+ electricity
+ personnel
investment payback
Subsidised electriticyrate (Euro/kWh)
0
1
2
3
1.000 10.000 100.000
capacity (m3/day)
Wat
er c
ost (
Euro
/m3 )
+ maintenance = total
+ consumables
+ electricity
+ personnel
investment payback
Real electricity rate(Euro/kWh)
CO-OPET – WP No. 7: Water and Power co-generation implementation in the Mediterranean islands and coastal areas
38
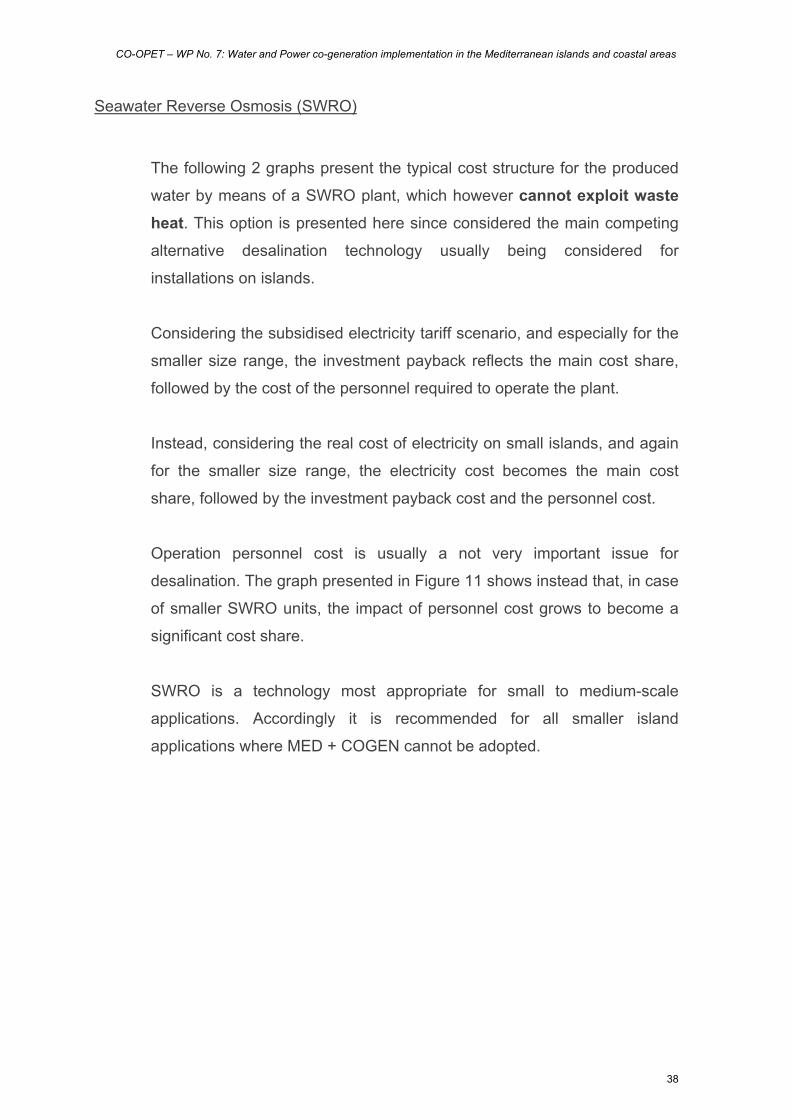
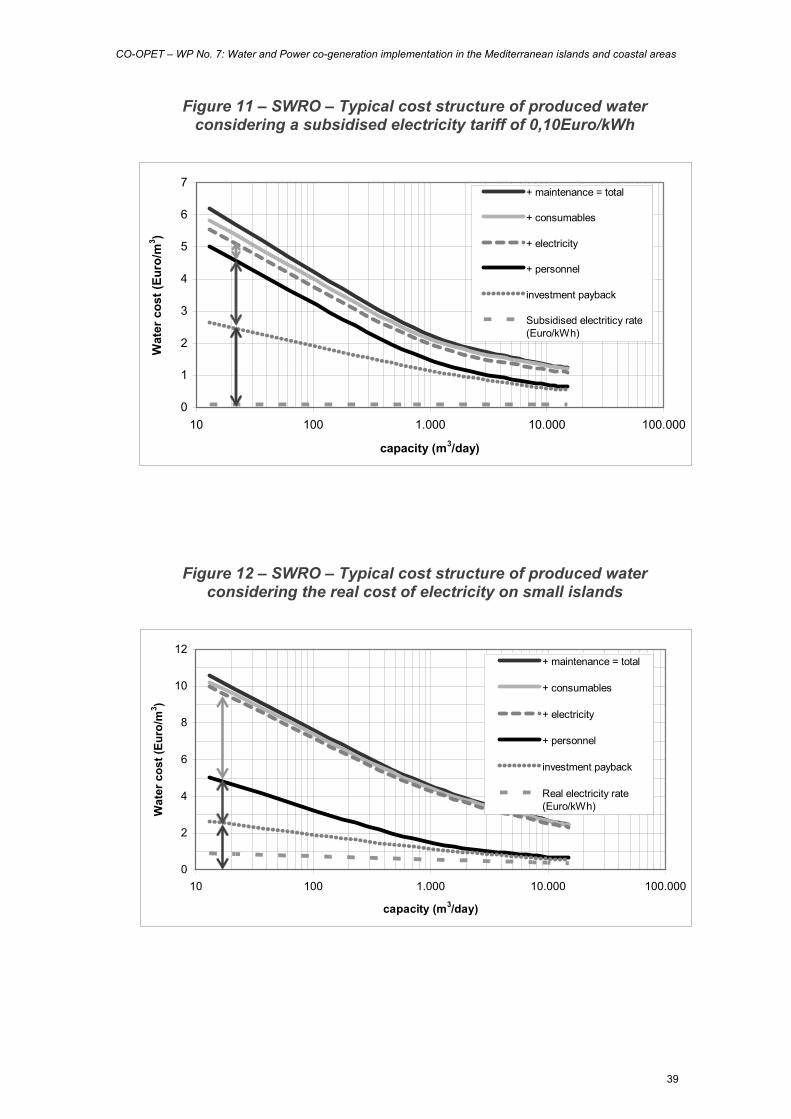
Seawater Reverse Osmosis (SWRO)
The following 2 graphs present the typical cost structure for the produced
water by means of a SWRO plant, which however cannot exploit waste heat. This option is presented here since considered the main competing
alternative desalination technology usually being considered for
installations on islands.
Considering the subsidised electricity tariff scenario, and especially for the
smaller size range, the investment payback reflects the main cost share,
followed by the cost of the personnel required to operate the plant.
Instead, considering the real cost of electricity on small islands, and again
for the smaller size range, the electricity cost becomes the main cost
share, followed by the investment payback cost and the personnel cost.
Operation personnel cost is usually a not very important issue for
desalination. The graph presented in Figure 11 shows instead that, in case
of smaller SWRO units, the impact of personnel cost grows to become a
significant cost share.
SWRO is a technology most appropriate for small to medium-scale
applications. Accordingly it is recommended for all smaller island
applications where MED + COGEN cannot be adopted.
CO-OPET – WP No. 7: Water and Power co-generation implementation in the Mediterranean islands and coastal areas
39
Figure 11 – SWRO – Typical cost structure of produced water considering a subsidised electricity tariff of 0,10Euro/kWh
Figure 12 – SWRO – Typical cost structure of produced water considering the real cost of electricity on small islands
0
1
2
3
4
5
6
7
10 100 1.000 10.000 100.000
capacity (m3/day)
Wat
er c
ost (
Euro
/m3 )
+ maintenance = total
+ consumables
+ electricity
+ personnel
investment payback
Subsidised electriticy rate(Euro/kWh)
0
2
4
6
8
10
12
10 100 1.000 10.000 100.000
capacity (m3/day)
Wat
er c
ost (
Euro
/m3 )
+ maintenance = total
+ consumables
+ electricity
+ personnel
investment payback
Real electricity rate(Euro/kWh)
CO-OPET – WP No. 7: Water and Power co-generation implementation in the Mediterranean islands and coastal areas
40
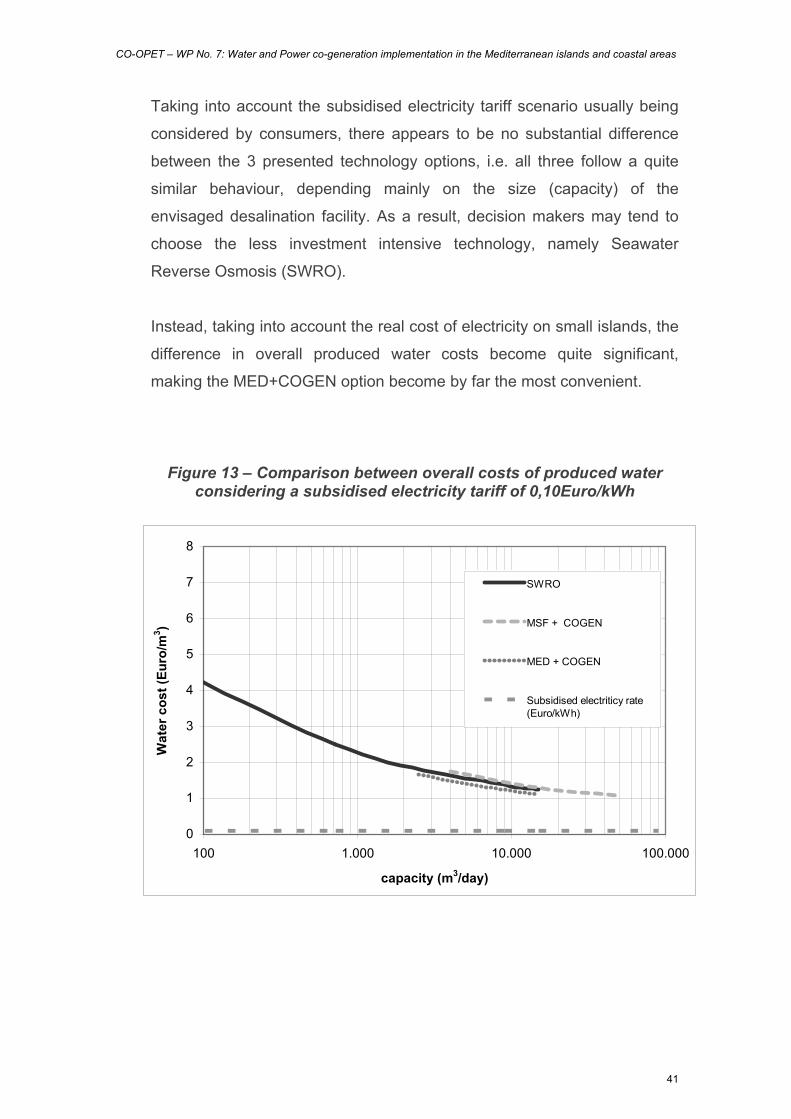
Overall cost comparison
The following 2 graphs present the results of the cost comparison between
the overall cost of water produced by a SWRO plant without waste heat
exploitation, and the two thermal distillation processes allowing to exploit
the waste heat from a nearby power plant, namely MSF+COGEN and
MED+COGEN.
The SWRO option is presented here since representing the main
competing alternative desalination technology usually being considered for
smaller installations and also on islands.
CO-OPET – WP No. 7: Water and Power co-generation implementation in the Mediterranean islands and coastal areas
41
Taking into account the subsidised electricity tariff scenario usually being
considered by consumers, there appears to be no substantial difference
between the 3 presented technology options, i.e. all three follow a quite
similar behaviour, depending mainly on the size (capacity) of the
envisaged desalination facility. As a result, decision makers may tend to
choose the less investment intensive technology, namely Seawater
Reverse Osmosis (SWRO).
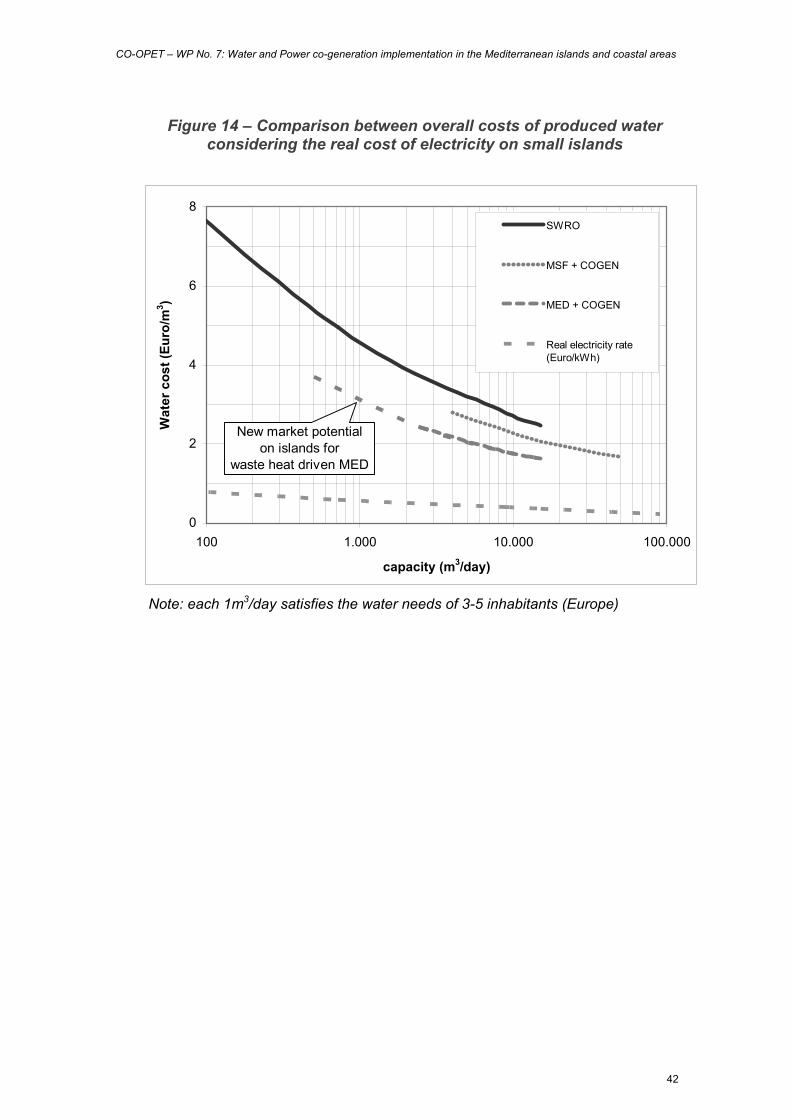
Instead, taking into account the real cost of electricity on small islands, the
difference in overall produced water costs become quite significant,
making the MED+COGEN option become by far the most convenient.
Figure 13 – Comparison between overall costs of produced water considering a subsidised electricity tariff of 0,10Euro/kWh
0
1
2
3
4
5
6
7
8
100 1.000 10.000 100.000
capacity (m3/day)
Wat
er c
ost (
Euro
/m3 )
SWRO
MSF + COGEN
MED + COGEN
Subsidised electriticy rate(Euro/kWh)
CO-OPET – WP No. 7: Water and Power co-generation implementation in the Mediterranean islands and coastal areas
42
Figure 14 – Comparison between overall costs of produced water considering the real cost of electricity on small islands
0
2
4
6
8
100 1.000 10.000 100.000
capacity (m3/day)
Wat
er c
ost (
Euro
/m3 )
SWRO
MSF + COGEN
MED + COGEN
Real electricity rate(Euro/kWh)
New market potentialon islands for
waste heat driven MED
Note: each 1m3/day satisfies the water needs of 3-5 inhabitants (Europe)
CO-OPET – WP No. 7: Water and Power co-generation implementation in the Mediterranean islands and coastal areas
43
6. Conclusions
Since based on typical average performance and cost figures, the cost
graphs presented in the previous paragraph are to be considered only as
a first approximate indication useful for rough estimates. Nevertheless
costs calculation results allow to come to the following general
considerations.
If real costs of power (electricity) and of water supplies by shipping from
the continental mainland were considered, on many of the islands in the
Mediterranean Sea, desalination would represent a viable solution and
would be recognised as economically advantageous.
In most cases the high cost of isolated electricity production and of
shipping of water to islands is hidden by national funding and by subsidised tariffs intended to alleviate the hardships of life of island
populations. However, same subsidised consumer tariffs produce market
distortions which end-up to freeze the present situation, giving efficiency
improvements, new technologies and desalination frequently no chance to
win competition against the status-quo situation, namely expensive
shipping of water supplies from the continental mainland or from other
nearby islands.
This handbook presents basic information on available technologies for
desalination and specifically on those desalination processes able to
exploit, practically for free, the waste heat generated by conventional
diesel power plants. Specifically it describes market available technologies
and the economic potentials of Co-generation of water and power on
islands. Outcomes are tailored for use by regional decision makers,
municipal authorities and island water & energy system planners.
CO-OPET – WP No. 7: Water and Power co-generation implementation in the Mediterranean islands and coastal areas
44
Most evaluations and comparisons between conventional water supplies
by shipping and desalination solutions neglect to consider the beneficiary
effects of desalination on the local economy of islands, such as:
o Independence from external water supplies by shipping
o Improved water quality: desalination produces water of excellent
quality, while today’s shipping by tankers provokes germ contamination
of the island aqueduct systems.
o Improved employment and training possibilities for islanders, allowing
them to become qualified up-to-date water processing and desalination
technicians (electronics, electrical engineering, desalination
technologists, etc.).
If real costs of electricity production on islands is taken into account, on
many Mediterranean islands, thermal desalination exploiting the waste
heat from the local diesel power plant would be economically
advantageous. The gap between tariffs paid by electricity and water
consumers and the actual costs of relevant supplies on islands is covered
by governmental subsidies, or by the national utility. In all cases it is
always the national (mainland) community to cover these costs.
Subsidised consumer tariffs produce a market distortion giving innovation
and desalination no chance to win competition with subsidised electricity
and with water supplies by shipping. If desalination would be permitted to
compete under fair (equal) conditions, on the islands, even smaller
desalination systems would frequently win.

CO-OPET – WP No. 7: Water and Power co-generation implementation in the Mediterranean islands and coastal areas
45
Thermal desalinations systems exploiting waste heat from a power plant
are commonly adopted for large scale applications in the middle east. On
islands instead there are only few inefficient MVC desalination systems
using electricity, or else, like in Greece, only Reverse Osmosis (RO)
systems. No thermal desalination systems using waste heat exist on
islands, and this although the use of waste heat for seawater desalination
produces marked advantages in terms of energy efficiency and economic
savings. So why is this mature, commercial and more economic
technology not applied on islands?
The answers lies in the difference between macro-economy and micro-
economy.
Subsidised consumer tariffs produce market distortions giving innovation
and desalination no chance to win competition against subsidised
electricity and water supplies by shipping. If desalination would be
permitted to compete under fair (equal) conditions, on the islands, even
smaller desalination systems would frequently win.
Another important question for the social acceptance on islands is, who
gains economic advantages, or suffers economic damage from the
introduction of a new technology, whether it be desalination or other. In
case of subsidised tariffs, it is the national economy and the subsidising
institution to benefit economically from such change, and not the islanders
and the local economy, since tariffs remain unchanged for consumers,
while the local people working for the status-quo power and water supply
system feel not prepared to deal with such change and fear that their
income source might be endangered.
CO-OPET – WP No. 7: Water and Power co-generation implementation in the Mediterranean islands and coastal areas
46
This handbook provides a guidance and answers technical and economic
questions on how to solve the problems of water supplies on islands in the
Mediterranean Sea. It shows that the introduction of combined water and
power production by means of thermal desalination systems exploiting the
waste heat of diesel power plants results in substantial economic savings
for the national economy, since they allow to reduce the overall amount of
money already being spent for subsidised conventional power and water
supplies.
CO-OPET – WP No. 7: Water and Power co-generation implementation in the Mediterranean islands and coastal areas
47
The OPET network
The Organisations for the Promotion of Energy Technologies (OPET) Network has embarked upon a new and challenging series of activities, aimed at promoting public awareness of current energy research results.
The activities are intended to further the deployment of innovative technologies and increase the pace of market uptake in respect of research that supports European Energy Policy priorities. By identifying key actors and disseminating information about new developments in the European Research Area, they provide an integrated and comprehensive view of on-going research in the following areas of work:
1. Buildings 2. Renewable energy sources 3. Co-generation and District Heating and Cooling 4. Clean Fossil Fuels 5. EMINENT 6. CO-OPET
Each of these activities are oriented towards providing solutions that are aimed at present market needs and that will assist in the promotion of new technologies, thereby stimulating knowledge flow between key market actors and related research bodies. In this way, the OPET Network further enables the smooth integration of EU policy priorities, new technological research, and market sustainability and competitiveness.
The OPET Network is an initiative of the European Commission that began its life in the late 1980s. Its aim is to promote the benefits of tomorrow's innovative energy technologies (with the exception of Nuclear energy).
The current initiative marks a new and challenging chapter in its history as it continues to disseminate knowledge and stimulate technology implementation, establishing itself as a cornerstone in the building of a European Energy Policy Research Area.
The Organisations for Promotion of Energy Technologies (OPET) Network aims to promote European energy technologies across the EU and global markets and thereby to reduce global warming.
In order to fulfil its mission, the OPET Network seeks to provide an efficient flow of knowledge between energy research an the European energy markets.
1. Transferring the results of European and member state energy RTD that supports European Policy priorities into successful technology deployment within the market, for the benefit of all European citizens
2. Translating European energy policy priorities into concrete actions at local, regional and European level
3. Accelerating the pace of innovation
The OPET Network currently incorporates 115 partner organisations extending accross 48 countries from within the European Union, candidate countries of Central and Eastern Europe, Cyprus and Associate States, Latin America, China, India, Southern Africa, ASEAN, Blacksea region and former CIS (Community of Independent States) countries
For further information, www.opet-network.net.


