University of Kentucky University of Kentucky UKnowledge UKnowledge Theses and Dissertations--Education Sciences College of Education 2021 CO-TEACHING PRACTICES OF GENERAL AND SPECIAL CO-TEACHING PRACTICES OF GENERAL AND SPECIAL EDUCATORS IN SECONDARY SCIENCE CLASSROOMS EDUCATORS IN SECONDARY SCIENCE CLASSROOMS Samantha Jolene Ringl University of Kentucky, [email protected]Author ORCID Identifier: https://orcid.org/0000-0002-7547-4206 Digital Object Identifier: https://doi.org/10.13023/etd.2021.267 Right click to open a feedback form in a new tab to let us know how this document benefits you. Right click to open a feedback form in a new tab to let us know how this document benefits you. Recommended Citation Recommended Citation Ringl, Samantha Jolene, "CO-TEACHING PRACTICES OF GENERAL AND SPECIAL EDUCATORS IN SECONDARY SCIENCE CLASSROOMS" (2021). Theses and Dissertations--Education Sciences. 92. https://uknowledge.uky.edu/edsc_etds/92 This Doctoral Dissertation is brought to you for free and open access by the College of Education at UKnowledge. It has been accepted for inclusion in Theses and Dissertations--Education Sciences by an authorized administrator of UKnowledge. For more information, please contact [email protected].
Transcript
University of Kentucky University of Kentucky
UKnowledge UKnowledge
Theses and Dissertations--Education Sciences College of Education
2021
CO-TEACHING PRACTICES OF GENERAL AND SPECIAL CO-TEACHING PRACTICES OF GENERAL AND SPECIAL
EDUCATORS IN SECONDARY SCIENCE CLASSROOMS EDUCATORS IN SECONDARY SCIENCE CLASSROOMS
Samantha Jolene Ringl University of Kentucky, [email protected] Author ORCID Identifier:
https://orcid.org/0000-0002-7547-4206 Digital Object Identifier: https://doi.org/10.13023/etd.2021.267
Right click to open a feedback form in a new tab to let us know how this document benefits you. Right click to open a feedback form in a new tab to let us know how this document benefits you.
Recommended Citation Recommended Citation Ringl, Samantha Jolene, "CO-TEACHING PRACTICES OF GENERAL AND SPECIAL EDUCATORS IN SECONDARY SCIENCE CLASSROOMS" (2021). Theses and Dissertations--Education Sciences. 92. https://uknowledge.uky.edu/edsc_etds/92
This Doctoral Dissertation is brought to you for free and open access by the College of Education at UKnowledge. It has been accepted for inclusion in Theses and Dissertations--Education Sciences by an authorized administrator of UKnowledge. For more information, please contact [email protected].
CO-TEACHING PRACTICES OF GENERAL AND SPECIAL EDUCATORS IN SECONDARY SCIENCE CLASSROOMS
The purpose of this study was to establish current levels of co-teaching implementation and to explore teachers’ perceptions of co-teaching and co-teacher relationships. This study also examined whether there is a relationship between teachers’ perception of their co-teaching relationship and their perception of co-teaching implementation in their classrooms. Analysis revealed that teachers generally have positive perceptions of their co-teaching partners and relationships, and these perceptions did not significantly differ between science teachers and special educators. However, this study found that teachers are not regularly planning lessons together, sharing the workload in the classroom, or choosing co-teaching models together. This study did not find a significant relationship between teacher perception of their co-teaching relationships and their perception of co-teaching implementation.
CO-TEACHING PRACTICES OF GENERAL AND SPECIAL EDUCATORS IN SECONDARY SCIENCE CLASSROOMS
By Samantha Jolene Ringl
Dr. Jennifer Wilhelm Director of Dissertation
Dr. Molly Fisher
Director of Graduate Studies
06/24/2021 Date
DEDICATION
I dedicate this dissertation to my Granny June who was always an excellent role model and inspiration.
iii
ACKNOWLEDGMENTS
The following dissertation, while an individual work, benefited from the insights
and direction of several people. First, my Dissertation Chair, Dr. Jennifer Wilhelm, truly
taught me how to be a scholar and a faculty member. Next, I wish to thank the complete
Dissertation Committee, and outside reader, respectively: Dr. Rebecca Krall, Dr. Molly
Fisher, Dr. Kera Ackerman, and Dr. Stephanie Stockburger. Without their constant
guidance, feedback, and support this project would have never been completed.
I would like to sincerely thank my husband, Jonas Ringl, for his love, support,
and sacrifices throughout this journey. I am thankful for his partnership and that he
encouraged me to work toward this degree. I would also like to thank my parents,
Woodrow and Rebecca Mullins, for teaching me what it means to work hard, and for
their unwavering support. I would also like to thank my mother and father-in-law,
Thomas and Janet Ringl, for always treating me like their daughter and supporting our
family in so many ways.
Finally, I wish to thank the respondents of the survey and the interview
participants (who remain anonymous for confidentiality purposes).
iv
TABLE OF CONTENTS
ACKNOWLEDGMENTS .................................................................................................................................... iii
LIST OF TABLES .............................................................................................................................................. vii
LIST OF FIGURES ........................................................................................................................................... viii
1.2 Background ....................................................................................................................................... 3 1.2.1 Students with Special Needs in Secondary Science ................................................................. 6
1.3 Statement of the Problem ................................................................................................................. 9
1.4 Research Questions ........................................................................................................................... 9
CHAPTER 2. LITERATURE REVIEW .............................................................................................................. 15
2.1 Theoretical Framework ................................................................................................................... 15 2.1.1 Communities of Practice ....................................................................................................... 16 2.1.2 Supporting Literature ............................................................................................................ 17 2.1.3 Applied to This Study ............................................................................................................. 18
2.2 The Case for Inclusion ..................................................................................................................... 19
2.3 Differentiating Curriculum .............................................................................................................. 20 2.3.1 Best Practices for Differentiating Science Instruction for Students with Disabilities ............ 22
2.3.1.1 Universal Design for Learning .............................................................. 23 2.3.1.2 High Leverage Practices ....................................................................... 24 2.3.1.3 Evidence Based Practices ..................................................................... 26
2.3.1.3.1 Mnemonics .............................................................................................................. 29 2.3.1.3.2 Graphic Organizers and Study Aids ......................................................................... 31 2.3.1.3.3 Inquiry-Based Instruction and Explicit Instruction .................................................. 32 2.3.1.3.4 Peer Tutoring ........................................................................................................... 33 2.3.1.3.5 Limitations of EBPs .................................................................................................. 33
2.3.2 Co-Teaching to Increase Differentiation ................................................................................ 34
2.4 Co-Teaching .................................................................................................................................... 35 2.4.1 Implementation and Recommendations ............................................................................... 38
2.4.1.2 Planning Time ....................................................................................... 39 2.4.2 Co-Teaching in Science .......................................................................................................... 40 2.4.3 Barriers to Implementation in Science .................................................................................. 41 2.4.4 Gaps Within the Literature and Study Significance ............................................................... 42
2.5 Instruments ..................................................................................................................................... 46 2.5.1 The Co-Teacher Relationship Scale ........................................................................................ 46 2.5.2 Are We Really Co-Teachers Rating Scale ............................................................................... 48
5.2.1.1 Relationships ......................................................................................... 81 5.2.1.2 Roles ..................................................................................................... 83 5.2.1.3 Comfort with Abilities .......................................................................... 85 5.2.1.4 Learning From Each Other ................................................................... 87 5.2.1.5 Impact on Students ................................................................................ 89
5.6 Implications for Practice ................................................................................................................ 102 5.6.1 Recommendations for Improvement .................................................................................. 102
Appendix A .............................................................................................................................................. 105
Appendix B .............................................................................................................................................. 106
Appendix C .............................................................................................................................................. 108
Appendix D .............................................................................................................................................. 114
Appendix E .............................................................................................................................................. 115
Appendix F .............................................................................................................................................. 122
Appendix H .............................................................................................................................................. 137
Appendix I ............................................................................................................................................... 147
Appendix K .............................................................................................................................................. 153
VITA ............................................................................................................................................................. 160
vii
LIST OF TABLES
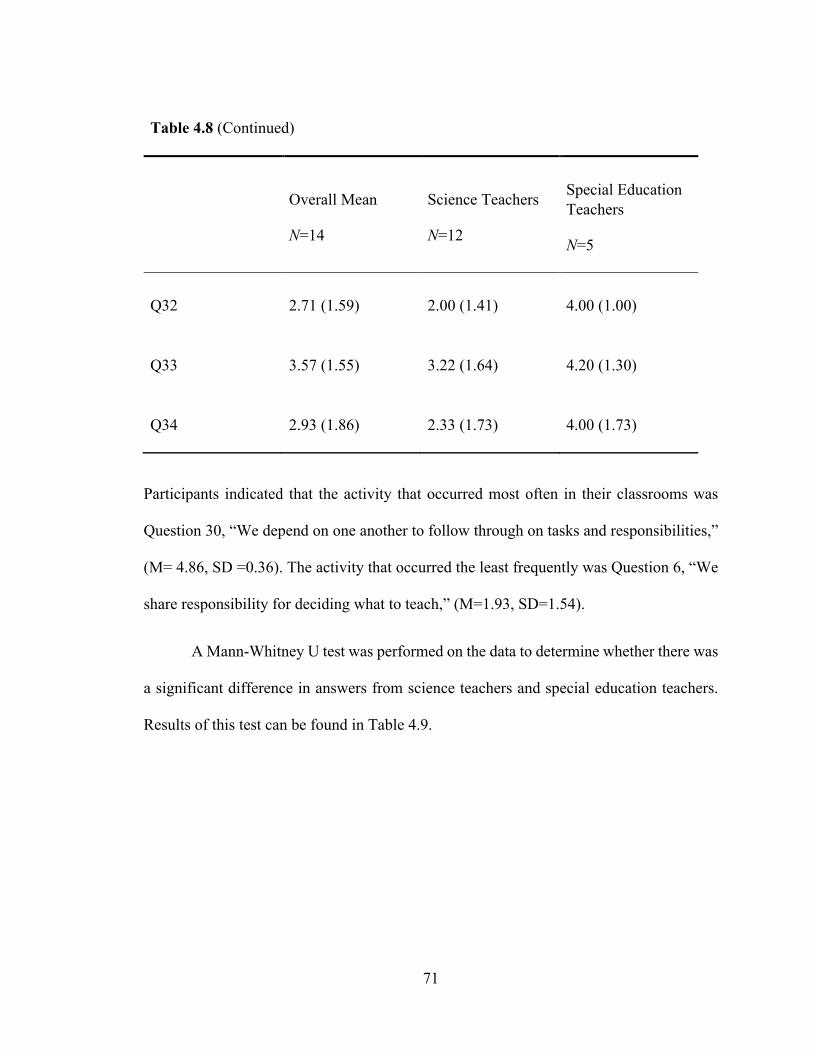
Table 1.1 Average scale score comparison between students identified as having disabilities, including those with a 504 Plan, and students not identified as having disabilities based on 2015 NAEP data for grade 8 science ................................................. 4 Table 1.2 Percentage of students in Kentucky scoring at each level on the statewide secondary science assessment for school year 2018-2019 ................................................. 5 Table 2.1 Key aspects of differentiated instruction (Tomlinson and Imbeau, 2010) ....... 21 Table 2.2 High Leverage Practices specific to science instruction ................................... 25 Table 2.3 Research study quality indicators as described by the Council for Exceptional Children (2014) ................................................................................................................. 27 Table 2.4 Selected evidence-based strategies to use in inclusive secondary science classrooms ......................................................................................................................... 29 Table 3.1 Overview of the Data Sources for the Research Questions .............................. 52 Table 4.1 Number of Participants from Each Educational Cooperative ........................... 59 Table 4.2 Participant Demographics ................................................................................. 60 Table 4.3 Interview Participant Demographics and Scores .............................................. 61 Table 4.4 K-PREP Scores from the 2018-2019 School Year in Interview Participants’ Schools Comparing Scores from Students with an IEP (SWD) to Scores from Students with No Identified Disabilities (SND) .............................................................................. 61 Table 4.5 Means and Standard Deviations for Answers on the Co-Teacher Relationship Scale .................................................................................................................................. 63 Table 4.6 Mann-Whitney U Test Results Comparing Science and Special Education Teachers’ Responses on the Co-Teacher Relationship Scale ........................................... 65 Table 4.7 Interview Response Themes for Research Question 1 ..................................... 66 Table 4.8 Means and Standard Deviations for Teachers’ Answers on the Are We Really Co-Teaching Rating Scale ................................................................................................ 68 Table 4.9 Mann-Whitney U test results for the Are We Really Co-Teachers Rating Scale........................................................................................................................................... 72 Table 4.10 Significant Kruskal-Wallis H Test Results for the AWRCT. ......................... 73 Table 4.11 Interview Response Themes for Research Question 2 ................................... 74 Table 4.12 Regression results used to determine whether CRS score significantly impacted AWRCT score ................................................................................................... 76 Table 4.13 Interview Response Themes Related to Reflection and Ideas for Improving Co-Teaching ...................................................................................................................... 77
viii
LIST OF FIGURES
Figure 2.1 Illustrations of Cook and Friend's (1995) five co-teaching models ................ 36
1
CHAPTER 1. INTRODUCTION
1.1 Introduction
I taught secondary science courses at three different Kentucky high schools and my
experiences co-teaching in these schools brought me to this study. Only one of the schools
offered any sort of training for co-teaching and it was in the form of a two separate day
long professional developments. My partner and I sat through a few hours of lecture and
activities, and then we were allowed to attempt to plan a lesson together. Other than those
two days, we were not given any dedicated time outside the classroom to plan together. I
was lucky in that my partner at this school was very motivated to teach the course with me.
She, rightfully, did not see herself as my assistant, but as an equal in my classroom and
both I and the students saw her that way. We planned between classes and via email, but
we could have been an excellent team if we had been allowed time to figured out how best
to co-teach. At the two other schools, co-teaching teams were not so lucky. Scheduling
conflicts always had special education teachers splitting class periods which means they
were only allowed to be in the science class for up to half of the class time. At the last
school I worked at before beginning the journey toward this dissertation, my co-teacher
believed his role was to check on the students on his case load at the beginning of class,
then leave to take care of other things. The situation was similar for the science co-teaching
team in the first school I worked in.
Out of three experiences with co-teaching, only one school was making an active
effort to support co-teaching teams, and this still did not feel like enough support at the
time. These experiences made me very curious as to whether other science teachers were
facing similar problems. I also wanted to gain the perspective of special education teachers
2
as I felt that I understood problems facing science teachers but did not have enough
knowledge of the time constraints, responsibilities, and skills of special educators to speak
on their role in the co-taught classroom. It is important to note that I am biased toward the
views and roles of a science teacher, but I highly value the skills and knowledge that the
special educator can bring to a co-teaching partnership.
The Individuals with Disabilities Education Act (IDEA, 2004) mandates that
students with disabilities be educated in their least restrictive environments. For students
in special education, this means that they are in a regular classroom with their peers in
general education as much as possible. Research has shown that including students with
special needs in classrooms with their general education peers benefits students with
teachers as part of co-teaching teams in eight different districts in Virginia. Based on data
from the interview portion of the mixed methods study, the teachers reported benefits of
inclusion for students in special education such as increased self-confidence, increased
self-esteem, improved social skills, and improved academic performance. Teachers also
reported that student independence increased because of the teachers’ efforts to prevent
students in special education from feeling singled out. This was accomplished by checking
on or helping non-identified students first before moving on to help the identified students
(Walther-Thomas, 1997). Phelan (2018) conducted interviews with ten middle school
general education science teachers and five special education teachers in Missouri and
found that in the opinion of the teachers, students in special education benefit not only
academically but also in a social capacity from increased interactions with their peers in
general education.
3
To accommodate students with disabilities in general education classrooms, teams
consisting of the parents, special education professionals, educators, administrators, and
the student will come together to form an individualized education program (IEP). The IEP
consists of learning goals and accommodations that will help the student to succeed in
classes and on standardized testing. Students in special education are provided
accommodations and goals in their IEPs and placed with their general education peers for
science courses at the secondary level which adheres to the guidelines set forth in IDEA.
This poses unique challenges to science content teachers as they must learn to differentiate
their curriculum to meet the needs of students with a wide range of ability levels. As
students benefit so greatly from inclusion, it is imperative that science educators meet those
challenges. A solution called for on many students’ IEPs is co-teaching in which students
have access to both the science teacher and a special educator within the same classroom.
1.2 Background
The achievement gap between students identified as having special needs and
students in general education is significant. Special education teachers and districts in the
United States have been mandated to close the gap through national programs such as No
Child Left Behind (NCLB) and Every Student Succeeds Acts (ESSA) of 2015. Research
has shown that this gap has remained, even though schools are threatened with a loss of
funding and intense pressure is placed upon special education teachers to drive their
students toward higher test scores (Schulte & Stevens, 2015; Minthrop & Zane, 2017).
Despite the national push for more inclusive classrooms and research showing that
students benefit academically and socially from inclusion, an achievement gap remains
between students identified as having disabilities and students not identified as having
4
disabilities. Table 1 contains data from the National Assessment of Educational Progress
assessment of grade eight science and illustrates this gap (National Center for Education
Statistics, 2015).
Table 1.1 Average scale score comparison between students identified as having disabilities, including those with a 504 Plan, and students not identified as having disabilities based on 2015 NAEP data for grade 8 science
Student Classification
Average
Scale
Score
Difference within
Groups Significance
National Public
Schools
Students Identified as
Having Disabilities 123
29 <0.001 Students Not Identified
as Having Disabilities 152
Kentucky
Public Schools
Students Identified as
Having Disabilities 137
23 <0.001 Students Not Identified
as Having Disabilities 160
Within national public schools across the United States, students identified as
having disabilities scored twenty-nine points lower than their peers on the science
assessment. Within Kentucky, students identified as having disabilities scored twenty-three
points lower than their peers. These differences were shown to be significant (p<0.001)
(National Center for Education Statistics, 2015).
5
In Kentucky, the achievement gap remains evident in secondary science classes.
Table 2 contains data from the 2018-2019 Kentucky Performance Rating for Educational
Progress (K-PREP) science assessment. This standardized test is administered to 11th
grade science students each year (Kentucky Department of Education, 2020).
Table 1.2 Percentage of students in Kentucky scoring at each level on the statewide secondary science assessment for school year 2018-2019 N A P D P + D
Students with an IEP
(N=4,322) 46.9 44.8 7.9 0.4 8.3
Students with an IEP Tested on Regular
Standards (N=3742) 50.5 44.2 5.2 0.1 5.3
Students with an IEP Tested on Alternate
Standards (N=580) 23.6 49.0 25.0 2.4 27.4
Students with no identified disabilities
(N=41,916) 18.2 49.7 29.8 2.3 32.1
State Total
(N=46,238) 20.9 49.2 27.8 2.1 29.9
Note. N = Novice, A = Apprentice, P = Proficient, D = Distinguished, and P + D = Proficient and
Distinguished.
Nearly half (46.9%) of students with an IEP scored at the novice level and only
8.3% of students scored proficient or distinguished. In comparison, 32.1% of students with
no identified disabilities (no IEP) scored proficient or distinguished (Kentucky Department
6
of Education, 2019). Measures of significance were not reported for this data, but it is
obvious that students with disabilities are not performing at the same level as their peers
without disabilities in science.
1.2.1 Students with Special Needs in Secondary Science
Science can be challenging for students with special needs. Often, courses such as
secondary biology require students to read complex texts, use mathematics skills, and
construct arguments based on evidence from a scientific investigation. Many students with
special needs already struggle in those areas, particularly reading and math, and struggle
further when asked to apply these skills in their science courses.
It can be difficult to adequately meet the needs of a diverse group of learners and
science teachers may have insufficient knowledge of the various learning disabilities they
will encounter. In a survey of 1,088 K-12 science teachers, responses indicated that
teachers did not feel adequately prepared to teach students with disabilities and only 7.7%
of respondents had taken a science methods course or a specific training related to teaching
science to students with special needs (Kahn & Lewis, 2014). Similarly, Mumba et al.
(2015) surveyed sixty-one secondary chemistry teachers across the United States and found
that all of the surveyed teachers either agreed or strongly agreed that a lack of training in
special education made it more difficult to teach an inquiry-based unit in a classroom
containing students of all ability levels. In a study of six general education teachers, Rice
(2017) found that teachers believe that co-teaching and professional development on
working with students with disabilities were essential to successfully teaching a classroom
with varied ability levels. Van Garderen et al. (2012) found that general education teachers
may be unprepared to address the needs of the variety of learners and disabilities they may
7
encounter in their classrooms. They proposed a new professional development model (PD)
that combines practices from both content teachers and special education teachers into one
PD to help teach science through inquiry in an inclusive way (Van Garderen et al., 2012).
Riedell (2018) conducted case studies of three eighth grade science teachers and
found that the science teachers were differentiating curriculum in their classrooms, but they
were more focused on strategies for whole group instruction. They sought ways to make
their instruction more engaging and hands-on for their students, but they did not attempt to
individualize instruction for each student (Riedell, 2018). In a study of seven secondary
science teachers, Maeng and Bell (2015) found that science teachers were attempting to
differentiate their curriculum but most of the strategies used were simple and required little
planning or personalization such as graphic organizers. It was also noted that it was rare
to observe more than one type of differentiation in a single lesson. The authors recommend
professional development focused on differentiation as training seems inadequate. Science
teachers will inevitably have the opportunity to teach students with special needs, but the
cited studies on differentiation in secondary science suggest teachers need more training to
be comfortable or effective at teaching students with special needs.
A possible solution to these challenges is collaboration with a special education
teacher to increase access to differentiation strategies and knowledge of teaching students
with disabilities. Mnemonic devices, inquiry-based learning, and other differentiation
strategies have been shown to positively impact the ability to remember science facts and
vocabulary by students in special education (Therrien et at., 2011). Co-teaching with a
special education teacher could help science teachers implement these differentiation
strategies in their instruction. Watt, Therrien, Kaldenberg, and Taylor (2013) also found
8
that the co-teaching setting was a good environment for inquiry-based science education
because co-teaching pairs could provide an increased range of student supports. Co-
teaching, particularly co-teaching that is done before a lesson to provide a student with
learning disabilities an opportunity to learn key vocabulary and facts before a lesson, has
been shown to increase student success during a lesson in the general education setting
(Thornton et al., 2015).
Students’ IEPs may call for a set number of co-teaching minutes per week in
science courses which means that a special education teacher is required to be in the
classroom with the science teacher for a set amount of time. However, the required
minimum times may be inadequate for building the kind of relationships that make
collaborative teaching successful. Simon (2018) found that for coteaching to be successful,
teaching teams needed common planning time, adequate training, and a positive attitude
toward coteaching. The researcher states that simply putting two teachers into a classroom
is ineffective (Simon, 2018). Linz, Heater, and Howard (2008) made the important point
that personalities and experiences should be considered when administrators choose
collaborative teams. Department heads, teachers, and principals should work together to
assess both general and special education teachers’ personality traits to assign the best
teams. If the two teachers do not have the skills to work together, then student outcomes
will suffer (Linz et al., 2008).
Cook and Friend (1995) described the different models of collaboration and in some
school districts, these models are used as the basis for professional development. Research
has shown that the most effective model is team teaching in which both teachers lead the
classroom as equals. However, the most commonly seen model in practice is one-teach,
9
one-assist in which the content teacher acts as the leader and the special education teacher
acts as an assistant (Dieker & Rodriguez, 2013). It is important to note that practices outside
the classroom, such as planning together, are also important for collaboration to be
successful (Simon, 2018).
1.3 Statement of the Problem
Research has shown that co-teaching is not being effectively implemented in
science classrooms (Dieker & Rodriguez, 2013; King-Sears et al., 2014). Without proper
interventions such as co-teaching to increase differentiation in classrooms, the achievement
gap between students in special education and students in general education will remain
significant (Schulte & Stevens, 2015). It is important to understand the reasons behind this
lack of proper implementation. By gaining the teachers’ perspectives on co-teaching, it is
hoped that sound arguments for needed supports can be made to district leadership. This
dissertation seeks to determine the extent to which secondary science teachers are
practicing co-teaching with a special education teacher in their classrooms. It also seeks to
understand the challenges that co-teaching pairs face when it comes to successful
implementation. Co-teaching has the potential to increase positive student learning
outcomes and decrease the achievement gap between students in special education and
students in general education. The purpose of this study is to establish the current levels of
co-teaching implementation so that student outcomes in classrooms with successful co-
teaching may be studied in the future.
1.4 Research Questions
The following research questions were developed to guide the study:
10
1. How to teachers perceive the co-teaching relationships and implementation of
co-teaching in their classrooms? How do general and special educators’ perceptions
of co-teaching differ?
2. To what extent are secondary science teachers practicing co-teaching with a
special education teacher in their classrooms?
3. How do teachers’ perceptions of their co-teaching relationships affect the
Implementation of co-teaching?
To examine these questions, a mixed methods study using questionnaires and one-on-one
interviews will be implemented. Participants will be secondary science co-teachers, both
general and special educators, from across Kentucky.
1.5 Theoretical Framework
Situated Learning Theory (SLT) states that learning is contextualized by the setting,
activity, and culture in which it occurs. Learning must be situated in the context in which
the knowledge is to be applied (Lave & Wenger, 1991). Situated learning is not always
intentional as participants will gradually learn skills from interacting with and observing
more skilled community members (Lave & Wenger, 1991). Co-teaching pairs will not
likely come together to teach each other the science content, differentiation skills, or the
varied types of learning disabilities in the classroom. Instead, each partner will gradually
pick up skills and knowledge from their daily interactions and observations until they are
both skilled in the other’s domain. The partners will, however, ideally form a community
of practice (Wenger, 1998) in which they work together to plan lessons, differentiate
instruction, and create an inclusive environment for all students.
11
1.6 Study Significance
Much of the identified literature focuses on best practices related to co-teaching and
methods for working successfully as a collaborative teaching pair (Dieker & Rodriguez,
2013; Gately & Gately, Jr., 2001; Ploessl et al., 2010; Linz et al., 2008). However, the
identified literature is rarely accompanied by data to support claims. Few empirical studies
related to the level at which secondary science teachers and special educators are
collaborating were located. This study seeks to establish current trends in collaborative
teaching practices in secondary science as well as the challenges to implementation as
identified by co-teaching pairs. Participants in this study will be given the opportunity to
share possible solutions to challenges they are facing in their classrooms related to co-
teaching which will provide ideas for further research. By establishing the baseline of
current practices, future research can focus on methods of increasing implementation of
successful collaborative teaching and then on student learning outcomes from classes with
successful co-teaching.
1.7 Instruments
Instruments used in this study include two surveys and an interview protocol. The
two surveys, The Co-Teacher Relationship Scale (CRS) (Noonan et al., 2003), and the Are
We Really Co-Teachers Rating Scale (AWRCT) (Villa et al., 2013) will be combined to
send participants one link from Qualtrics. Both surveys have been converted to five-point
Likert scales by other researchers (Cramer & Nevin, 2006; Ricci et al., 2019) and this
format will be used in this study. The scale for the CRS ranges from 1 (very different) to 5
(very similar) and asks participants to select the best choice for how similar they feel to
their co-teacher for each of the 19 items on the survey (Cramer & Nevin, 2006). The scale
12
for the AWRCT ranges from 1 (Once a Week or Less) to 5 (daily actions) and asks
participants to indicate how often they implement co-teaching practices for the 35 items on
the survey (Ricci et al., 2019). The protocol in this study was developed by the researcher
and is intended to be used to gain more information about survey responses and teachers’
ideas about co-teaching practices.
1.8 Definition of Key Terms
A number of key terms must be defined as they relate to this study.
General Education Teacher: The general education teachers in this study will be the
secondary science content teachers. They are licensed, professional teachers.
Special Education: The education of exceptional children which includes students with
disabilities as well as students identified as gifted and/or talented (Heward et al., 2017).
Special Education Teacher: The special educators in this study are licensed teachers with
degrees in special education. Interpreters, scribes, readers, and paraprofessionals are
excluded from this study.
Co-teaching: Co-teaching may be defined as occurring when two professional educators
work together to provide quality instruction to a classroom of students with diverse abilities
and needs (Cook & Friend, 1995). Co-teaching partners in this study will be general
education secondary science teachers and licensed special educators.
Students with Disabilities: Students identified as having one or more learning,
developmental, or behavioral disabilities that require extra supports to be successful in the
classroom (Heward et al., 2017).
13
Differentiation: Differentiation may be defined as the process by which teachers alter their
instruction, curricula, classroom environments, and assessments in order to meet the
needs of all students (Tomlinson & Imbeau, 2010).
1.9 Summary
This introduction provides the background information necessary to understand the
importance of co-teaching and the inclusion of children with disabilities in the science
classroom. Collaborating and co-teaching with special educators can help secondary
science teachers better differentiate their instruction for a variety of student needs. Having
two teachers in the classroom opens new opportunities for teaching strategies such as
station teaching and parallel teaching which can effectively lower the teacher to student
ratio in a classroom.
The purpose of the study, as discussed in this introduction, is to understand
the level of co-teaching that occurs in secondary science classrooms in Kentucky. Much of
the literature surrounding science and co-teaching focuses on best practices and
suggestions for how to implement co-teaching. Therefore, a new baseline must be
established to determine if teachers are implementing these best practices. Teachers will
also be asked to evaluate their own co-teaching practices and to suggest solutions for
challenges.
Co-teaching in inclusive secondary science classrooms has the potential to greatly
benefit all students, not just students with disabilities. Students of all ability levels would
benefit from a lower teacher to student ratio and better differentiated curriculum. Most
importantly, co-teaching has the potential to decrease the achievement gap between
students in general education and students in special education. This study seeks to
14
determine whether co-teaching is being implemented in Kentucky schools and future
research will seek to determine how to improve co-teaching practices in schools so that
student outcomes may be measure
CHAPTER 2. LITERATURE REVIEW
2.1 Theoretical Framework
The theoretical framework this study relies upon originated in Situated Learning:
Legitimate Peripheral Participation (Lave & Wenger, 1991) and was expanded upon in
Communities of Practice: Learning, Meaning, and Identity (Wenger, 1998). Situated
Learning Theory (SLT) states that learning must be situated in the context in which the
knowledge is to be applied, meaning it is contextualized by the setting, activity, and culture
in which it occurs. (Lave & Wenger, 1991). Situated learning is not always intentional as
participants will gradually learn skills from interacting with and observing more skilled
community members which is the foundation of legitimate peripheral participation (Lave
& Wenger, 1991).
One must understand the meaning of Legitimate Peripheral Participation (LPP) to
fully understand Situated Learning Theory (SLT). LPP is a method of participation or
learning in which the participant gradually increases their knowledge or expertise by first
observing experts then gradually increasing participation in the community until they too
are viewed as experts. (Lave & Wenger, 1991). When one is an apprentice to a master, the
master does not immediately let the apprentice fully participate in the skilled activity.
Gradually, as the apprentice becomes more knowledgeable by watching and interacting
with the master, they become a more skilled worker. Applied to teaching, this concept can
be seen in the practice of student teaching experiences in which control is gradually given
to the student-teacher as they learn more about teaching from the lead teacher.
16
2.1.1 Communities of Practice
An important aspect of SLT and LPP is the presence of a community of practice. A
community of practice can be defined as a group of people who share a common practice
and become better at that practice through regularly interacting with one another (Wenger,
1998). As such, communities of practice promote social learning and innovation within the
practice. For a community of practice to be legitimate, it needs to have three defining
features: a domain, a community, and a shared practice. The domain is a shared competence
or skillset such as a skilled trade (e.g. plumbing) or teaching. The community of practice
must have some shared skillset that distinguishes it from the rest of the population (Wenger,
1998). The community must have members that are seeking to engage in a joint interest.
The members have discussions, participate in activities, share information, and help each
other improve (Wenger, 1998). Finally, a community of practice must have a practice or a
shared activity with shared resources, stories, experiences, tools, and methods of problem-
solving (Wenger, 1998). As long as these conditions are met, members of the community
of practice benefit from their interactions and truly better their practices by learning from
each other.
Applied to coteaching, the community of practice would form between the general
education teacher and the special education teacher. The domain is science teaching within
diverse classrooms, the community forms between the co-teachers, and the practice is co-
teaching. As the pair of teachers work together and have conversations around the practice
of coteaching, it stands to reason that they would improve their co-teaching skills. The
secondary science teacher can gain knowledge of teaching students in special education
such as appropriate differentiation strategies and strategies for mitigating behavioral
17
problems. The special educator stands to gain content knowledge and teaching strategies
for delivering the content knowledge. When these two professionals work together on a
successful team, instruction should be enhanced by the shared body of knowledge.
2.1.2 Supporting Literature
Several articles and studies related to co-teaching, particularly as a method for
teacher education, have relied upon SLT as their theoretical framework (Eick et al., 2003;
Guise et al., 2017; Korthagen, 2010). In a study of 10 secondary science methods students
in the field component of their methods course, Eick et al. (2003) stated that the students
were legitimate peripheral participants in their placement classrooms. The researchers
found that by having the students first observe the cooperative teachers’ lessons plan during
first period, then having the students teach the lesson plan in the next period, the students
became much more confident and comfortable in the classroom. Korthagen (2010)
proposes that for teacher practice to be impacted by teacher education, all learning must be
situated and contain real-world examples. The author argues that traditional approaches to
teacher education such as presenting educational theories is ineffective if not grounded by
examples and opportunities to practice or apply the theories. Presenting theory alone is in
conflict with principles of SLT but theory can be an important part of teacher education as
students become comfortable with teaching practices (Korthagen, 2010).
While science teachers may have learned about accommodations or modifications
for students with disabilities in methods courses or conversations with colleagues, SLT
supports the idea that science teachers need to see these practices in science lesson specific
contexts. As stated by Eick et al. (2003), “much of the knowledge for teaching cannot be
learned out of context and later applied in classrooms.” (p.75). This notion also applies to
18
special educators in that they may not have seen many of their strategies and skills applied
to science lessons. Co-teaching can help both teachers learn new skills situated in the
context in which they will be used. Eick et al. (2003) support this idea by stating,
“Coteaching allowed students to observe and test out new strategies, management
procedures, and styles used by their classroom teacher.” (p.82).
According to Guise et al. (2017), “successful implementation of co-teaching
involves mutual engagement, joint enterprise, and shared repertoire, three aspects of a
community of practice.” (p.372). The researchers conducted a study of eight secondary
level co-teaching pairs consisting of a pre-service teacher and a cooperating mentor
teacher. Four of the pairs were in secondary science classrooms and the other four pairs
were in secondary English classrooms. The participants had all undergone training on co-
teaching prior to the study. The researchers expected to see a community of practice form
between the pre-service teacher and mentor teacher as they worked together to co-teach the
class. However, in the science classrooms, three of the four pairs were observed to
implement traditional student teaching in which the pre-service teacher helps or observes
with few opportunities to lead the class. In these instances, the pre-service teachers reported
feeling intimidated and undervalued by their cooperating teacher. A community of practice
did not form because the cooperating teachers did not value the input of the pre-service
teachers and did not often invite them to lead activities or lectures.
2.1.3 Applied to This Study
As co-teachers are meant to work together and learn from each other, the theoretical
framework for this study will be a combination of Situated Learning Theory (Lave &
Wenger, 1991) and Communities of Practice (Wenger, 1998). This framework was chosen
19
because a true co-teaching relationship will have the science teacher and the special
education teacher on equal footing as both masters and apprentices. Often, science teachers
are not trained for teaching students with disabilities (Mumba et al.,2015) and special
education teachers are not always comfortable with science content or pedagogy.
As partners work together, they should experience legitimate peripheral participation (Lave
& Wenger, 1991). That is, they should learn skills from their co-teaching partner such as
differentiation strategies, behavior management strategies, content knowledge, or
knowledge of student disabilities and accommodations. Co-teaching pairs will not likely
come together to teach each other the science content, differentiation skills, or the varied
types of learning disabilities in the classroom. Instead, each partner will gradually pick up
skills and knowledge from their daily interactions until they are both skilled in the other’s
domain. As the survey and observation instruments indicate, co-teachers should ideally
share similar views on teaching, should have the common goal of providing the best
learning environment for all students, and should demonstrate effective communication to
maintain best practices or improve instruction.
2.2 The Case for Inclusion
Students should not be excluded from a secondary science classroom because of mild
to moderate disabilities. With the right accommodations and a supportive environment,
students in special education should be allowed to master the science standards so that they
are as well prepared as their general education peers to process scientific information and
think critically about the world around them.
Thirteen percent of school-aged children are identified as having disabilities and of
those students, forty percent are identified as having two or more disabilities (Heward et
20
al., 2017). Students of color and students of low socioeconomic status are
disproportionately identified as needing special education services (Skiba et al., 2008;
Heward et al., 2017). Science teachers must ensure that these students have access to the
same quality science education as their general education peers. Much has been written on
the benefits of placing all students in their least restrictive environments such as the
development of social skills and empathy in students in special education after interreacting
with their peers in general education (Dymond et al., 2006; Phelan, 2018; Walther-Thomas,
1997). Dymond et al. (2006) conducted a case study on a team of school personnel as they
redesigned a secondary science course to focus on inclusion. The school faculty used the
principles within Universal Design for Learning (UDL) as UDL promotes a flexible
curriculum that allows for better inclusion. The researchers found that course redesign to
promote inclusion was possible but, to be successful, faculty must properly support the
students by providing access to scaffolding and structure for redesigned activities (Dymond
et al., 2006).
2.3 Differentiating Curriculum
Students in special education are often held to the same standards as their general
education peers. As one might imagine, general education science teachers face many
challenges when attempting to provide quality instruction to all students in a mixed-ability
classroom. Differentiation is the key to a truly inclusive education environment. A detailed
definition of differentiation was found in Tomlinson and Imbeau’s book, Leading and
Managing a Differentiated Classroom (2010).
21
Table 2.1 Key aspects of differentiated instruction (Tomlinson and Imbeau, 2010)
Content Process Products Learning
Environment
Varying the material
the students need to
learn or the ways in
which students
access the materials
(varying reading
levels, varying
teaching style)
Varying the types of
activities students
will do to learn the
material (length of
time, access to
manipulatives,
offering challenges)
Giving students
options for how they
will demonstrate
their learning
(varying types of
assessments)
Ensuring students have
the environment they
need to succeed (quiet
areas vs areas for
collaboration,
materials from other
cultures/languages,
allowing students to
move as needed,
structured setting with
clear rules)
Differentiation may then be defined as the process by which science teachers ensure that
the curriculum, learning process, assessments, and learning environment have enough
variation to accommodate a wide range of learners. Science teachers must learn to
differentiate their curriculum and use a variety of strategies to meet the needs of all learners
in their classrooms.
The purpose of differentiation is to provide equitable supports for students to ensure
that all students succeed. However, despite the push for differentiation, an achievement
gap exists between students identified as having disabilities and students not identified as
22
having disabilities. Schulte and Stevens (2015) completed a longitudinal study in which
they looked at mathematics achievement data from a cohort of 92,045 students in one state
from the third grade through the seventh grade. Students were divided into two groups,
students with disabilities, and students without disabilities. The researchers found that no
matter how they approached statewide math achievement data, either longitudinally or via
cross-section, an achievement gap remained between students with disabilities and students
in general education. The authors also used a multilevel growth model to determine that
students with disabilities experienced growth more slowly than students in general
education, thus the achievement gap increased from the third grade through the seventh
grade. However, they found that when students were tracked as they moved from special
education into general education rather than only considering students currently in special
education, the achievement gap was reduced, though still significant (Schulte & Stevens,
2015). These findings suggest that without further intervention, such as better or increased
training for differentiation, the achievement gap will remain.
2.3.1 Best Practices for Differentiating Science Instruction for Students with Disabilities
Section 504 of the Rehabilitation Act of 1973 guarantees the right to a free and
appropriate education for all students, regardless of disability status (U.S. Department of
Education, 2010). All students deserve a science education and students with disabilities
should not be excluded from the general education science classroom. Although teachers
may find it challenging to design an inclusive classroom and curriculum, several strategies
and guidelines can be found in the literature including Universal Design for Learning, High
Leverage Practices, evidence-based practices, and co-teaching with a special education
teacher.
23
2.3.1.1 Universal Design for Learning
Price et al. (2012) proposed several potential barriers to science learning in students
with disabilities such as the overwhelming nature of open inquiry, difficult scientific
vocabulary, following detailed directions, and difficulty interpreting and communicating
numerical data. To overcome these barriers, teachers can use the Universal Design for
Learning (UDL) framework to design more inclusive instruction. The Center for Applied
Special Technology (CAST) describes three main principles behind UDL: multiple means
of engaging students, multiple means of comprehension or representation, and multiple
means of expression or assessment (CAST, 2018).
Multiple means of engagement in science should include strategies that lead to
student collaborations, self-monitoring, and active interest (Baurhoo & Asghar, 2014;
CAST, 2018). This could include providing links to the community within the content,
having students monitor their own learning goals, and having students work together to
solve problems. Multiple means of expression includes providing different options for how
students access and interact with materials. For example, instead of simply providing daily
readings which create barriers for students with reading disabilities, teachers should also
provide audio or video representations of the information in the text. Giving students
options that will help access the material is key. Allowing multiple means of expression or
assessment will enable students to express their learning in the way that works best for
them. Teachers could have students complete a project, a traditional test, a graphic
organizer, an oral presentation or performance, or whatever form of assessment a student
is comfortable with as long as it allows the teacher to assess the student’s learning.
24
UDL is an excellent framework for ensuring that a class is inclusive of all students.
Giving students multiple options for engagement, learning, and expression will allow more
students to be successful. Teacher flexibility is important in UDL because teachers have to
understand and be willing to work with students’ diverse needs. Science courses have the
potential to work particularly well for UDL in that teachers can design most course to
follow a structured inquiry or project-based format in which the teacher provides a real-
world problem, phenomenon, or driving question that the students are allowed to use the
methods that work best for them to go about completing the unit.
2.3.1.2 High Leverage Practices
High Leverage Practices (HLP) are a series of effective strategies shown to
positively impact student learning, student social development, and student emotional
development. According to TeachingWorks (2020), there are 19 HLPs for general
education teachers that are considered essential skills for every teacher. The HLP Writing
Team (2017) determined that there are 22 HLPs for special educators but they state that
these HLPs build off the HLPs for general educators though they are more detailed and
contain practices specific to special education. HLPs for general educators include leading
a group discussion, modeling content, interpreting student thinking, and providing
feedback to students. (TeachingWorks, 2020). HLPs for special educators include
collaborating with other professionals, using assessments to understand student strengths
and needs, and providing feedback to guide student behavior and learning (The HLP
Writing Team, 2017). HLPs are the foundation of good teaching for all disciplines.
Secondary science educators should become familiar with HLPs and begin implementing
practices, especially differentiation and modeling. To aid in this endeavor, Windschitl et
25
al. (2012) developed a set of four ambitious teaching practices specific to science based on
HLPs.
Table 2.2 High Leverage Practices specific to science instruction Ambitious Practices from
Windschitl et al. (2012, p.
899)
Explanation Corresponding HLP
(TeachingWorks, 2020)
Selecting big ideas and
treating them as models
The teacher should select a
specific phenomenon
which could be an event or
a process so that students
can try to make sense of it
over time.
HLP 2. Explaining and
modeling content, practices,
and strategies.
Eliciting students’ ideas
and using them to adapt
instruction
The teacher poses
questions to students,
listens to student talk,
interprets student talk, and
uses their interpretations to
adapt instruction.
HLP 3. Eliciting and
interpreting individual
students’ thinking.
26
Table 2.2 (Continued)
Ambitious Practices from
Windschitl et al. (2012, p.
899) Explanation
Corresponding HLP
(TeachingWorks, 2020)
Choosing activity and
framing intellectual work
The teacher showcases
potential models and
background knowledge as
the basis for a lesson or a
sequence of lessons.
HLP 14. Designing single
lessons and sequences of
lessons.
Pressing for explanation
The teacher expects
students to be able to use
evidence from inquiry or
models to produce an
explanation
HLP 15. Checking student
understanding during and at
the conclusion of lessons.
While these four practices are important, all 19 HLPs should be considered worthy of
implementation by science teachers.
2.3.1.3 Evidence Based Practices
To ensure that one is effectively teaching students with learning disabilities in
science, one must become familiar with the research. When reviewing the literature,
teachers should seek evidence-based practices (EBPs), which are practices that are backed
27
by a substantial amount of quality research. Cook and Cook (2011) define evidence-based
practices as, “practices that are supported by multiple, high-quality studies that utilize
research designs from which causality can be inferred and that demonstrate meaningful
effects on student outcomes,” (p. 73). The Council for Exceptional Children (CEC) (2014)
published a guide to evaluating research that included eight quality indicators for
researchers to use when evaluating a body of literature around a practice as can be seen in
Table 2.3.
Table 2.3 Research study quality indicators as described by the Council for Exceptional Children (2014) Description
1. The study in question must provide specific details about the setting in which the
study was conducted such as the grade level, type of school, type of classroom,
and curriculum used.
2. The population of the study must be clear. The study should provide descriptive
information about the participants such as the type of disability, gender, age, and
socioeconomic status. The study must also be clear on how the participants were
identified as members of the target population.
3. The study must fully describe the person or technology responsible for delivering
the intervention.
4. The study must fully describe the practice and any relevant materials and
procedures.
5. Implementation fidelity must be reported.
28
Table 2.3 (Continued)
Description
6. The study must exhibit sufficient internal validity. Study design and methods
must be clear and of high quality.
7. Outcome measures must be clearly described and must hold some significance to
current practice (e.g. improved learning outcomes for students).
8. The researchers performed an appropriate analysis of data and reported the
required statistical measures.
To be classified as high quality, a study must meet all eight of the CEC’s quality
indicators. Often, teachers may find reviews that examine multiple studies on one practice
to determine the effect size of that practice and whether there is substantial evidence that
it positively influences student outcomes. When determining whether a practice is
evidence-based, researchers are encouraged to only include high quality studies in their
reviews (CEC, 2014).
It is important to note that although a practice may have a significant body of
supporting literature, a single practice cannot be expected to meet the needs of all learners
at once. Cook and Cook (2011) strongly encourage educators to continuously monitor
students when implementing evidence-based practices to identify students who are not
responding to the practice. A number of EBPs for teaching science to students with
disabilities were found in the literature as shown in Table 2.4.
29
Table 2.4 Selected evidence-based strategies to use in inclusive secondary science classrooms Practice Citing Literature
Explicit Instruction Scruggs et al., 2010
Mnemonics
Mastropieri & Scruggs, 2010; Scruggs &
Mastropieri, 2000; Therrien et al., 2011;
Wolgemuth, Cobb, & Alwell, 2008
Graphic Organizers and Study Aids Dexter & Hughes, 2011; Scruggs et al.,
2010
Inquiry-Based Instruction Brigham et al., 2011; Therrien et al., 2011
Peer Tutoring
McDuffie, Mastropieri, & Scruggs, 2009;
Scruggs et al., 2010; Stenhoff &
Lignugaris/Kraft, 2007
2.3.1.3.1 MNEMONICS
One of the most common practices found in the literature was supplemental
These articles advocate for strategies such as co-planning, team teaching, and station
teaching. However, research to measure the extent to which science co-teaching teams are
implementing these recommendations has not yet been completed. This study seeks to
establish a baseline for how well and to what extent science co-teaching teams are
implementing the recommended strategies for co-teaching. After understanding co-
teaching implementation in science classrooms, studies can then be completed to explore
how proper co-teaching impacts student learning outcomes.
2.5 Instruments
2.5.1 The Co-Teacher Relationship Scale
The Co-Teacher Relationship Scale (CRS) (Noonan et al., 2003) was designed to
generate measures of quality related to co-teacher relationships (See Appendix A). The
authors compiled a list of thirty-nine traits and characteristics from the literature that
described successful co-teaching partnerships including items such as personality traits,
teacher characteristics, and approaches to teaching. After conducting a factor analysis on
pilot study data, only one substantial factor with nineteen items was found and retained for
the study. The 20 items related to personality traits of participants were eliminated from
the instrument. The final CRS contains two sections. The first section contains 10 items
that focus on teacher beliefs and approaches to teaching. The second section, consisting of
9 questions, focuses on the extent to which one partner believes they are similar to their
co-teaching partners. The researchers conducted a study on the reliability and validity of
47
the tool with twenty co-teachers in early childhood education in Hawaii. Internal reliability
(Cronbach’s alpha) was found to be 0.90 (Noonan et al., 2003).
Cramer and Nevin (2006) tested the CRS within Miami-Dade Public Schools in
Florida with 46 co-teachers from five high schools, one middle school, two alternative
schools, and fourteen elementary schools. Although the researchers mention math and
science co-teachers, exact numbers of teams in each content area were not listed. Results
of this study indicated that the highest rated items were “interest in learning new things”
(mean = 4.46), “dedication to teaching” (mean = 4.44), and “ability to be supportive to
colleagues and other staff” (mean = 4.25). The researchers collected demographic
information such as the number of years of teaching experience and conducted an analysis
of variance (ANOVA) statistical test. They found that there was a significant difference
(p<0.05) between years of experience and teacher confidence in that teachers that reported
more years of experience also reported higher co-teaching confidence. The researchers
concluded that the CRS had been validated since their sample was culturally and
linguistically diverse from the sample in the original study. They stated that the CRS was
likely generalizable to other populations, though they encouraged further research (Cramer
& Nevin, 2006).
To build on the two previous studies and test the CRS in Arizona, Malian and McRae
(2010) conducted a study to determine if there was a relationship between the responses of
special educators and general educators on the CRS. The survey participants included 290
co-teachers from 9 junior high schools, 160 elementary schools, 70 middle schools, and 50
high schools across Arizona. Unlike Cramer and Nevin (2006), the researchers did not
observe any statistically significant differences in the responses of special educators and
48
general educators on any of the items or overall. They propose that this may be due to “a
positive mutual attitudinal shift towards collaboration between general and special
educators,” (Malian & McRae, 2010, p.13).
2.5.2 Are We Really Co-Teachers Rating Scale
The Are We Really Co-Teachers? Rating Scale (AWRCT) developed by Villa et al.
(2004) was formed based on existing co-teaching literature. The original scale format
contains thirty-four questions about whether the teacher is implementing a co-teaching
practice which are answered by simply checking yes or no (See Appendix B). The authors
intended for co-teachers to use the scale as a reflection tool so that they could identify
strengths and weaknesses and set goals for improvement. Examples of items include “We
share ideas, information, and materials”, and “We share responsibility for deciding who
teaches which part of a lesson” (Villa et al., 2013, pp. 380-382). Lava (2012) used the
survey in its original form in a small case study of one new (less than a year of experience
in co-teaching) fourth grade co-teaching team. The two participants reported agreement on
31/34 items. The researcher states that the most noticeable disagreement was on the item
that dealt with including other professionals when their expertise is needed. The general
education teacher believed they should reach out to the science instructional coach more
often, but the special education teacher believed they were already adequately including
other professionals. In this study, the AWRCT was used to measure the health of the
participants’ partnership. The researcher report that with the high level of agreement
between the two teachers, the partnership was healthy (Lava, 2012).
Instead of using the scale in its original yes or no format, other studies have used the
instrument as a five-point Likert scale (Cramer & Nevin, 2006; Haimowitz, 2018; Ricci et
49
al., 2019). Haimowitz (2018) used the scale 1 (never) to 5 (always) with the survey items,
while the two other studies used the scale 1 (less than once a week) to 5 (daily actions of
co-teachers).
Haimowitz’ (2018) study used two surveys and interviews to determine whether
teacher attitudes toward the practice of co-teaching affected the implementation of co-
teaching. Participants for the surveys included 41 general education teachers and 10 special
education teachers from across K-12 grade levels in one school district. The AWRCT was
used to measure the amount of co-teaching occurring in the participants’ classrooms. To
get an implementation score, the sum of scores from each item was found. The researchers
found that the average implementation score of teachers with more than ten years of
experience was 117.67 out of a possible 155, while the average score for teachers with less
than ten years of experience was 115.92. There was no significant difference between the
two groups. The researchers stated that “there was a cause and effect relationship between
the attitudes and implementation for teachers with 10 or more years of experience”
(Haimowitz, 2018, p. 100). No other significant relationships were reported.
Cramer and Nevin (2006) used the survey in addition to the CRS and found that when
used together, the CRS and the AWRCT “may have some merit in explaining co-teacher
relationships and actions. The validation from interviews and observations strengthens the
believability of the assessment scales in differentiating co-teacher beliefs, attitudes, and
actions” (Cramer & Nevin, 2006, p. 270). The highest rated items on the AWRCT were
related to giving each other feedback (mean = 4.40) and being flexible during lessons
(mean = 4.41). Like Haimowitz (2018), the researchers reported no statistically significant
relationships between years of teaching and the survey items (Cramer & Nevin, 2006).
50
Unlike these two studies, this proposed study aims to examine relationships based on years
co-teaching with the same co-teacher instead of overall teaching experience or overall co-
teaching experience.
The survey has also been used to evaluate co-teaching in other contexts. Ricci et al.
(2019) use the AWRCT scale to evaluate the implementation of co-teaching between pre-
service secondary math and science teachers and their in-service mentor teachers. The
program under study was part of a year long urban teacher residency program with 20
general education pre-service teachers. The researcher calculated Cronbach’s alpha as 0.97
in this study. Results indicated that the most common behavior was both teachers being
viewed by the students as their teacher. The teachers believed this happened on average
more than four times per week. Similar to results from Cramer and Nevin (2006), the other
most common behavior was being flexible during lessons with over half of the participants
reporting that this happened daily. The authors state that these findings suggest this is a
viable method of training future general educators to co-teach with a special educator in
their own classrooms (Ricci et al., 2019).
While useful for teachers’ personal reflection in its original format, other
researchers have adapted the questionnaire into a Likert scale format for a more detailed
quantitative analysis (Cramer & Nevin, 2006; Haimowitz, 2018; Ricci et al., 2019). As it
was the only study to report internal reliability, the scale used in Ricci et al. (2019) will be
in this study. Responses will range from 1 (less than once a week) to 5 (daily actions). This
survey has thirty-four questions related to actions of co-teaching pairs and asks participants
to indicate how often they engage in each action.
CHAPTER 3. METHODOLOGY
3.1 Introduction and Research Questions
The purpose of this study is to understand the extent to which secondary science
co-teachers are implementing co-teaching techniques and strategies for successful co-
teaching. This study will provide an understanding of co-teachers’ implementation of co-
teaching in science, implementation levels of recommended co-teaching techniques, the
perceived barriers to proper implementation of co-teaching, and teacher generated
solutions to problems with co-teaching in science. Using the baseline for implementation
of co-teaching established in this study, future research projects may explore topics such
as professional development programs to train co-teachers and the effect of co-teaching on
student achievement in classrooms with effective co-teaching practices.
The following research questions were developed to guide the study:
1. How do teachers perceive the co-teaching relationships and implementation
of co-teaching in their classrooms? How do general and special educators’
perceptions of co-teaching differ?
2. To what extent are secondary science teachers practicing co-teaching with a
special education teacher in their classrooms?
3. How do teachers’ perceptions of their co-teaching relationships affect the
implementation of co-teaching?
To examine these questions, a mixed methods study using surveys and one-on-one
interviews was implemented.
52
Table 3.1 Overview of the Data Sources for the Research Questions
Research Questions Data Sources
How do teachers perceive the co-teaching
relationships and implementation of co-
teaching in their classrooms? How do
general and special educators’ perceptions of
co-teaching differ?
The Co-Teacher Relationship Scale
(Noonan et al., 2003); Are We Really Co-
Teaching Rating Scale (Villa et al., 2013);
Interviews
To what extent are secondary science
teachers practicing co-teaching with a
special education teacher in their
classrooms?
Are We Really Co-Teaching Rating Scale
(Villa et al., 2013); Interviews
How do teachers’ perceptions of their co-
teaching relationships affect the
implementation of co-teaching?
The Co-Teacher Relationship Scale
(Noonan et al., 2003); Are We Really Co-
Teaching Rating Scale (Villa et al., 2013);
Interviews
53
3.2 Rationale
An explanatory sequential design (Creswell, 2012) was chosen for this study because
the qualitative interview data will further explain the quantitative data collected in Phase 1
of the study. The explanatory sequential design is a form of mixed methods research that
employs an initial round of quantitative data collection and analysis followed by a round
of qualitative data collection that is used to explain quantitative results (Creswell, 2012).
Phase 1 of this study consisted of two surveys that will measure co-teaching attitudes,
relationships, and implementation of co-teaching practices (Noonan et al.,2003; Villa et
al., 2013). Quantitative data will be analyzed for trends in current co-teaching practices
and any abnormally high or low scores on the instruments will be noted. After the
quantitative data has been collected and analyzed, the interview protocol will be refined,
and one-on-one interviews will be conducted with teachers. The qualitative data from these
interviews will be used to explain or understand the quantitative data.
3.3 Participants and Sampling
To sample the entire state of Kentucky, similar sampling procedures as outlined in
Ackerman (2017) were followed. Kentucky contains nine educational cooperatives
comprised of 172 school districts (Kentucky Department of Education, 2020). Lists of
school districts were obtained from their respective cooperatives. From this list, each high
school in each district was added to a spreadsheet. To obtain a simple random sample, a
random number generator was used to select half of the high schools in each cooperative.
These schools formed the sampling frame (N=106). Email addresses for secondary science
general education teachers and special education teachers were obtained via publicly
54
available school directories. If teacher email addresses were not readily available,
principals were emailed (N=52) and asked to forward the invitation email to their science
teachers and special education teachers.
The teachers were contacted via email (N=449) to be recruited for the surveys. The
email informed teachers that by responding to the survey, they would be entered into a
drawing to win one of four $25 Visa gift cards. The initial recruiting emails were sent
during the third week of March 2021. Approximately two weeks after the original email, a
reminder email was sent to non-responding teachers and all principals. Approximately two
weeks later, a final reminder email was sent to all non-responding teachers. Although the
recruitment email was sent to all secondary science and special education teachers, only
teachers who identified themselves as science co-teachers were able to complete the
survey. Question 1 of the survey asks, “Do you consider yourself a co-teacher in a
secondary level science classroom?” If the participant selected no, they were taken to the
end of the survey instead of answering the survey questions. The final questions asked
participants if they were willing to further participate in classroom observations and
interviews. The survey was closed, and principals and superintendents were sent emails to
ask for permission to interview teachers that had opted in to participating in interviews
during the last week of April 2021. Interviews were scheduled and completed during the
first and second weeks of June 2021. Demographic information such as the number of years
teaching science, number of years co-teaching, and number of years co-teaching with their
current partner were obtained and reported using descriptive statistics.
55
3.4 Instruments
To save time for the participants and to make data collection manageable, the
following two surveys were combined (See Appendix C) so that teachers would only be
given one Qualtrics link.
3.4.1 The Co-Teacher Relationship Scale
As the previous study by Cramer and Nevin (2006) treated the data and scale from
this instrument as interval data, this study will also analyze the scale data as interval data.
This means that the distance between each number on the scale is equal, otherwise it would
have to be treated as an ordinal scale. The software SPSS will be used to calculate
descriptive statistics including the mean and standard deviation for each of the 19 items.
An overall score will also be calculated by finding the sum of ratings on all 19 nineteen
items, with a maximum score of 95. Data will be treated as non-parametric in all cases, as
it has been cautioned small sample sizes often lead to non-normal distributions as they are
not good estimates of a larger population (Krithikadatta, 2014). It has also been noted that
it is difficult to achieve a significant Shapiro-Wilk result for small sample sizes when
testing for normality as deviations from a normal distribution must be very large (Mann-
Whitney Tests in SPSS, n.d.). The Mann-Whitney U Test will be performed on the data to
examine whether there is a difference in scores between general educators and special
educators.
To examine whether the years spent teaching together as part of a co-teaching team
influence relationship scores, responses to demographics will be broken down into groups
such as new teams (0-1 year together), familiar teams (2-4 years together), and experienced
56
teams (5 or more years together). As there will be more than two groups, analysis will
consist of a Kruskal Wallis H test to determine if there are significant differences between
the experience groups and a post hoc test with pairwise comparisons will determine which
groups significantly differ (Lewis-Beck & Lewis-Beck, 2015).
3.4.2 Are We Really Co-Teachers Rating Scale
While useful for teachers’ personal reflection in its original format, other
researchers have adapted the questionnaire into a Likert scale format for a more detailed
quantitative analysis (Cramer & Nevin, 2006; Haimowitz, 2018; Ricci et al., 2019). As it
was the only study to report internal reliability, the scale used in Ricci et al. (2019) will be
used in this study. This survey has thirty-four questions related to actions of co-teaching
pairs and asks participants to indicate how often they engage in each action. Responses will
range from 1 (less than once a week) to 5 (daily actions).
The mean for each question and the average overall score on the instrument will
determine the extent to which science educators are practicing co-teaching. Statistical
differences between science teachers’ and special education teachers’ mean responses will
also be examined using a Mann-Whitney U test. Like the analysis of the CRS data, this
survey will be analyzed by running an Kruskal-Wallis H test with a pairwise post-hoc test
to determine if there are differences based on years of experience co-teaching with the
same partner.
3.4.3 Implementation Scores and Co-Teaching Relationships
To examine the third research question, linear regression (Lewis-Beck & Lewis-
Beck, 2015) will be used to test the hypothesis that there is a relationship between
57
implementation scores from the AWRCT survey and relationship scores from the CRS.
Previous research has demonstrated that the two surveys are able to work together to
explain co-teacher relationships and actions (Cramer & Nevin, 2006).
The model will be run as follows:
The model will be used to test the null hypothesis “Teacher perception of their relationship
with their co-teacher as reported on the CRS has no effect on teacher perception of
implementation of co-teaching as reported on the AWRCT.” Appropriate correlation
statistics such as Pearson’s R and r2 will be reported and used to determine significance.
3.5 Interviews
Seidman (2006) recommends a three-interview structure so that participants have
time to reflect upon their answers and experiences. However, time constraints and
participants’ schedules did not allow for three separate interviews. Seidman (2006)
provides an example of conducting all three interviews in one day which was the format
chosen for this study. Questions were divided into three themes or sets. Question set one
focuses on the teaching history and demographics of each participant. Questions include
topics such as what brought the teacher to this school, years of experience in co-teaching,
and their content area. Set two focuses on the participants’ current and prior co-teaching
practices. The final set focuses on having the participants reflect on their practices. This
section of the interview asks teachers about challenges in implementation and possible
solutions to these challenges. The interviews followed a semi-structured format in that a
protocol was developed (See Appendix D) , but the interview was fluid, and questions were
58
adapted to the participant (Merriam, 1998). Interview questions were added or refined to
help explain the quantitative data collected from the questionnaires and observations.
The final set of questions on the survey asked participants if they were willing to
participate in a one-on-one interview with the researcher. If the participant selected yes,
permission was obtained from either their principal or superintendent before the interview
was scheduled. The interviews were completed via the Zoom online meeting platform and
were recorded so that they could be transcribed for analysis of major themes. Interviews
took approximately thirty minutes each. An inductive approach to coding was taken in this
study. Following the procedures outlined in Bogdan and Biklen (2007), interview
responses were analyzed to determine patterns and to come up with a coding scheme. After
interviews were transcribed, they were carefully read to pull out major themes in the
responses. Themes that added meaning to survey responses and themes that appeared in all
interview transcripts were adopted as codes. While coding, the idea of asides and
commentary from Emerson et. al (2011) was used to make notes on the participant's
demeanor and to add context to responses.
As the quantitative data obtained from the questionnaires did not fully capture or
explain the extent to which co-teaching is practiced in secondary science classrooms, the
qualitative interviews were used to clarify and explain the quantitative results. For
example, questionnaire results may have indicated that teachers are not implementing co-
planning and interviews would have been used to understand why. The data was expected
to work together to fully explain how co-teaching is implemented in secondary science
classes.
59
CHAPTER 4. RESULTS
4.1 Participants
The response rate for the survey was approximately 10.9% (N=49) when calculated
using the emails that were sent directly to the teachers. It is unknown how many teachers
were contacted by principals. Of those responses, 23 were screened out by Question 1, 5
more participants quit before beginning the survey, 2 more stopped before completing the
first portion of the survey, 1 response was a duplicate, and 1 participant finished the survey
but indicated that they were not actually a co-teacher. In total, 17 usable responses were
collected (3.79% of the 449 teachers who were contacted).
Table 4.1 Number of Participants from Each Educational Cooperative
Educational Cooperative Number of Participants (N)
Green River Regional Educational Cooperative 10
Ohio Valley Educational Cooperative 2
Southeast/Southcentral Education Cooperative 2
Central Kentucky Educational Cooperative 2
Kentucky Educational Development Corporation 1
Participants represented five of the nine educational cooperatives, with the majority of
participants working in the Green River Regional Educational Cooperative. No teachers
from the Jefferson County Exceptional Child Education Services, Kentucky Valley,
60
Northern Kentucky, or West Kentucky education cooperatives elected to participate in this
study.
Table 4.2 Participant Demographics
Year of Teaching Experience
Years of Co-Teaching Experience
Years with Current Co-Teacher
Teacher Type 0-1 2-4 5 or
more 0-1 2-4 5 or more 0-1 2-4 5 or
more
Science
(N=12) 1 0 11 1 3 8 6 5 1
Special Education
(N=5)
0 0 5 0 2 3 1 3 1
Twelve participants were science teachers, and five participants were special education
teachers. Three of the science teachers only completed the Co-Teacher Relationship Scale
(they exited the survey before completing the Are We Really Co-Teaching Rating Scale),
while all special education teachers completed both portions of the survey.
61
Table 4.3 Interview Participant Demographics and Scores
Specialty HS
Years of Experience
Years of Co-
Teaching Total Score
CRS Total Score
AWRCT
Denise Science/Biology Tulip 5+ 6 88 104
Martin Science/
Chemistry and Physics
Poppy 5+ 10 74 106
Gordon SPED/ Science and Math Daisy 5+ 14 68 92
All interview participants were from the Green River Educational Cooperative.
Table 4.4 K-PREP Scores from the 2018-2019 School Year in Interview Participants’ Schools Comparing Scores from Students with an IEP (SWD) to Scores from Students with No Identified Disabilities (SND)
N A P D P+D
Tulip High School
SWD (N=12) 33.3 58.3 0.0 8.3 8.3
SND (N=118) 11.9 49.2 37.3 1.7 39.0
Poppy High School
SWD (N=32) 18.8 81.3 0.0 0.0 0.0
SND (N=233) 12.4 54.1 31.8 1.7 33.5
Daisy High School
SWD (N=4) Data Unavailable SND
(N=68)
All Students (Daisy) (N=72)
11.1 45.8 38.9 4.2 43.1
Note. N = Novice, A = Apprentice, P = Proficient, D = Distinguished, and P + D = Proficient and Distinguished.
None of the students at Daisy High School were tested on alternate standards. Most of the
data from this high school was suppressed either due to FERPA or due to having less than
62
10 students. One student at Tulip High School and two students at Poppy High School were
tested on alternate standards but the data for these students was suppressed (Kentucky
Department of Education, 2019).
4.2 Research Question 1
The Co-Teacher Relationship Scale and interviews were used to explore research question
1:
How do teachers perceive the co-teaching relationships and implementation of
co-teaching in their classrooms? How do general and special educators’
perceptions of co-teaching differ?
The following sections will be used to organize and present the data from these sources.
4.2.1 Co-Teacher Relationship Scale
The participants’ responses to the CRS provide evidence for their perception of
their co-teaching relationships within their science classrooms. Table 4.5 shows the means
and standard deviations for the teachers’ answers on each question of the CRS. The CRS
asks teachers to “Indicate the extent to which you believe you and your co-teacher are the
same or different in your beliefs and approaches to teaching, and personal/professional
characteristics and style,” with the scale ranging from 1 (very different) to 5 (very similar)
(Noonan et al., 2003). A copy of the CRS with full text of the questions may be found in
Appendix A.
63
Table 4.5 Means and Standard Deviations for Answers on the Co-Teacher Relationship Scale. The Scale Ranges From 1 (Very Different) to 5 (Very Similar).
Overall Mean
N=17
Science Teachers
N=12
Special Education Teachers
N=5
Total CRS Score 78.76 (11.20) 79.75 (12.11) 76.40 (9.40)
Q1 4.18 (0.73) 4.17 (0.83) 4.20 (0.45)
Q2 3.88 (0.86) 4.00 (0.85) 3.60 (0.89)
Q3 3.71 (0.77) 3.75 (0.75) 3.60 (0.89)
Q4 4.12 (0.78) 4.25 (0.87) 3.80 (0.45)
Q5 3.82 (1.13) 3.92 (1.16) 3.60 (1.14)
Q6 4.47 (0.72) 4.67 (0.65) 4.00 (0.71)
Q7 4.06 (1.09) 4.17 (1.03) 3.80 (1.30)
Q8 3.94 (1.25) 4.08 (1.16) 3.60 (1.52)
Q9 4.12 (1.17) 4.25 (1.22) 3.80 (1.10)
Q10 4.47 (0.87) 4.58 (0.90) 4.20 (0.84)
64
Table 4.5 (Continued)
Overall Mean
N=17
Science Teachers
N=12
Special Education Teachers
N=5
Q11 4.35 (0.86) 4.50 (0.90) 4.00 (0.71)
Q12 4.19 (0.91) 4.27 (1.01) 4.00 (0.71)
Q13 3.82 (0.95) 3.67 (1.07) 4.20 (0.45)
Q14 3.76 (1.20) 3.58 (1.38) 4.20 (0.45)
Q15 4.18 (1.07) 4.08 (1.24) 4.40 (0.55)
Q16 4.29 (0.92) 4.33 (0.98) 4.20 (0.84)
Q17 4.65 (0.61) 4.75 (0.45) 4.40 (0.89)
Q18 4.29 (0.99) 4.33 (1.07) 4.20 (0.84)
Q19 4.71 (0.47) 4.75 (0.45) 4.60 (0.55)
Question 3, “Views regarding how to structure students' activities,” had the lowest average
score of all items (All participants: M=3.71, SD=0.77; Science Teachers: M=3.75,
SD=0.75; Special Education Teachers: M=3.60, SD=0.89). The question with the highest
65
average score was question 19, “Dedication to teaching,”(All participants: M=4.71 ,
SD=0.47; Science teachers: M=4.75, SD=0.45; Special education teachers: M=4.60,
SD=0.55). A Mann-Whitney U test was run on the overall CRS score and each question
to determine whether there were significant differences between science teachers’ answers
and special education teachers’ answers. The results of this test can be found in Table 4.6.
Table 4.6 Mann-Whitney U Test Results Comparing Science and Special Education Teachers’ Responses on the Co-Teacher Relationship Scale
Teacher Type Mean Rank Sum of Ranks
Mann-Whitney U Sig.
Sum of Answers on the Co-Teacher Relationship Scale
Science Teachers (N=12)
9.71 116.50
21.500 0.368 Special Education Teachers (N=5)
7.30 36.50
Science teachers and special education teachers did not significantly differ on the CRS
overall or on any of the individual questions. Full test results for each question can be found
in Appendix E. A Kruskal-Wallis H test was also performed on the data to determine if
there were any significant differences between co-teachers who had been with their co-
teaching partner for 0-1 year, 2-4 years, or 5 or more years. No significant differences were
found between groups for the overall CRS or any individual question (see Appendix F for
table).
66
4.2.2 Interview Responses
Several themes emerged in the interview responses related to Research Question 1.
These themes include relationships, roles, comfort with abilities, learning from each other,
and impact on students. Table 4.7 contains definitions and examples for each theme. The
interview responses will be presented in detail in the discussion.
Table 4.7 Interview Response Themes for Research Question 1 Code/Theme Definition Example
Relationships
Responses in this category dealt with the participants’ descriptions of how they viewed their relationship with
their co-teaching partner.
Martin (Science Teacher): My relationship with [my co-teacher] is really well. Like I said, we both coach football together. We've known each other for 10 plus years.
Roles
These responses dealt with participants beliefs or statements
about the roles of their co-teachers or themselves in the classroom.
Denise (Science Teacher): There doesn't seem to be an expectation, for them to be like actively teaching. They're more focused on their one on one interactions with their specific students that I have in the room.
Comfort with Abilities
Responses were placed in this category if the participant mentioned their level of comfort with their own
abilities or the abilities of their partner related to content knowledge or
teaching students with special needs.
Martin: Again, I don't think they fully understand the chemistry, or they haven't had enough chemistry exposure, so they don't always understand the end game.
Learning From Each Other
These responses included participants’ descriptions of concepts, practices, and/or knowledge they learned by interacting with their co-teacher.
Gordon (Special Education Teacher): We've both learned, I mean. And content wise, obviously I mean you know I’ll go in there, and you know, always pick up on something that, you know I may have forgotten, you know from many, many years ago.
67
Table 4.7 (Continued)
Code/Theme Definition Example
Impact on Students Response in this category focused on participants’ descriptions of how co-
teaching impacts their students.
Denise: Always beneficial. Even the least partnership co-teaching experience I’ve had, I still feel the students are benefiting for sure.
Even just as far as having like another set of eyes last year with the co-teacher who's now retired she was really observant and so she would see like little things that were occurring.
4.3 Research Question 2
Data from interviews and the AWRCT was used to provide evidence for research question
2:
To what extent are secondary science teachers practicing co-teaching with a
special education teacher in their classrooms?
4.3.1 Are We Really Co-Teachers Rating Scale
The participants’ responses on the AWRCT provided evidence for their perception
of co-teaching implementation in their science classrooms. The survey asked teachers to
“indicate the average frequency at which you and your co-teacher implement the following
practices,” with a scale ranging from 1 (once a week or less) to 5 (daily actions). Means
and standard deviations for teachers’ answers on the AWRCT can be found in Table 4.8.
68
Table 4.8 Means and Standard Deviations for Teachers’ Answers on the Are We Really Co-Teaching Rating Scale. The Scale Ranges from 1 (Once a Week or Less) to 5 (Daily Actions)
Overall Mean
N=14
Science Teachers
N=12
Special Education Teachers
N=5
Total AWRCT Score 112.43 (23.92) 110.11 (25.12) 116.60 (23.76)
Q1 2.43 (1.70) 1.89 (1.54) 3.40 (1.67)
Q2 3.07 (1.64) 3.11 (1.90) 3.00 (1.22)
Q3 2.57 (1.65) 2.67 (1.87) 2.40 (1.34)
Q4 3.00 (1.96) 3.33 (2.00) 2.40 (1.95)
Q5 4.21 (1.25) 4.22 (1.30) 4.20 (1.30)
Q6 1.93 (1.54) 1.67 (1.32) 2.40 (1.95)
Q7 3.29 (1.86) 3.00 (1.94) 3.80 (1.79)
Q8 2.29 (1.49) 2.00 (1.32) 2.80 (1.79)
Q9 2.14 (1.66) 2.00 (1.58) 2.40 (1.95)
Q10 4.71 (0.61) 4.89 (0.33) 4.40 (0.89)
69
Table 4.8 (Continued)
Overall Mean
N=14
Science Teachers
N=12
Special Education Teachers
N=5
Q11 4.71 (0.61) 4.67 (0.71) 4.80 (0.45)
Q12 3.86 (1.35) 4.33 (1.00) 3.00 (1.58)
Q13 3.50 (1.74) 3.44 (1.88) 3.60 (1.67)
Q14 3.07 (1.69) 3.00 (1.80) 3.20 (1.64)
Q15 4.07 (1.38) 4.22 (1.30) 3.80 (1.64)
Q16 3.71 (1.64) 4.11 (1.45) 3.00 (1.87)
Q17 3.43 (1.65) 3.78 (1.72) 2.80 (1.48)
Q18 4.21 (1.19) 4.78 (0.44) 3.20 (1.48)
Q19 4.50 (0.94) 4.67 (1.00) 4.20 (0.84)
Q20 3.43 (1.74) 3.00 (2.00) 4.20 (0.84)
70
Table 4.8 (Continued)
Overall Mean
N=14
Science Teachers
N=12
Special Education Teachers
N=5
Q21 3.64 (1.50) 3.89 (1.54) 3.20 (1.48)
Q22 4.57 (0.85) 4.56 (1.01) 4.60 (0.55)
Q23 2.21 (1.72) 2.00 (1.73) 2.60 (1.82)
Q24 3.07 (1.73) 2.89 (1.90) 3.40 (1.52)
Q25 4.50 (0.94) 4.56 (1.01) 4.40 (0.89)
Q26 2.64 (1.69) 2.33 (1.50) 3.20 (2.05)
Q27 4.64 (0.63) 4.67 (0.71) 4.60 (0.55)
Q28 4.50 (1.16) 4.33 (1.41) 4.80 (0.45)
Q29 3.21 (1.81) 2.56 (1.88) 4.40 (0.89)
Q30 4.86 (0.36) 4.89 (0.33) 4.80 (0.45)
Q31 2.71 (1.68) 2.11 (1.45) 3.80 (1.64)
71
Table 4.8 (Continued)
Overall Mean
N=14
Science Teachers
N=12
Special Education Teachers
N=5
Q32 2.71 (1.59) 2.00 (1.41) 4.00 (1.00)
Q33 3.57 (1.55) 3.22 (1.64) 4.20 (1.30)
Q34 2.93 (1.86) 2.33 (1.73) 4.00 (1.73)
Participants indicated that the activity that occurred most often in their classrooms was
Question 30, “We depend on one another to follow through on tasks and responsibilities,”
(M= 4.86, SD =0.36). The activity that occurred the least frequently was Question 6, “We
share responsibility for deciding what to teach,” (M=1.93, SD=1.54).
A Mann-Whitney U test was performed on the data to determine whether there was
a significant difference in answers from science teachers and special education teachers.
Results of this test can be found in Table 4.9.
72
Table 4.9 Mann-Whitney U test results for the Are We Really Co-Teachers Rating Scale
Teacher Type Mean Rank Sum of Ranks
Mann-Whitney U Sig.
Sum of Answers on the Are We Really Co-Teachers Rating Scale
Science Teachers (N=9) 7.22 65.00
20.000 0.739 Special Education Teachers (N=5)
8.00 40.00
Question 18. We make improvements in our lessons based on what happens in the classroom.
Science Teachers (N=9) 9.28 83.50
6.500 0.017 Special Education Teachers (N=5)
4.30 21.50
Question 32. We are mentors to others who want to co-teach.
Science Teachers (N=9) 5.67 51.00
6.000 0.022 Special Education Teachers (N=5)
10.80 54.00
Answers significantly differed between groups on questions 18 (p=0.017) and 32
(p=0.022). On average, science teachers reported that they made “improvements in our
lessons based on what happens in the classroom,” nearly every day (M=4.78, SD=0.44),
while special education teachers reported that they did this an average of approximately
three times per week (M=3.20, SD=1.48). Special education teachers reported that they
73
were “mentors to others who want to co-teach,” an average of four times a week (M=4.00,
SD=1.00), while science teachers reported that they did this for an average of two times
per week (M=2.00, SD=1.41). The results of the Mann-Whitney U test for all AWRCT
questions can be found in Appendix G.
A Kruskal-Wallis H test was also run on AWRCT data to determine whether there
were significant differences between co-teaching experience groups. A Kruskal-Wallis H
test with post-hoc pairwise comparisons revealed a statistically significant difference (p=
0.017) between participants with 0-1 years of co-teaching with the same partner and
participants with 2-4 years of co-teaching with the same partner on question 6 of the
AWRCT. Participants with 0-1 years together (mean = 1.00) believed they only shared
responsibility for deciding what to teach on average once a week while pairs with 2-4 years
of experience (mean= 2.86) reported that they did this at least twice a week. Only two
teachers (29% of participants) in the 2-4 years of experience group reported that they shared
responsibility for deciding what to teach once a week.
Table 4.10 Significant Kruskal-Wallis H Test Results for the AWRCT.
Years with Current Partner Mean Rank Kruskal-Wallis H df Sig.
Q6
0-1 (N=5) 5.00
6.832 2 0.033 2-4 (N=7) 10.00
5 or More (N=2) 5.00
74
No other significant differences between experience groups were found for the AWRCT.
Full results from the Kruskal-Wallis H test can be found in Appendix H.
4.3.2 Interview Responses
Several themes emerged in the interview responses related to Research Question 2.
These themes include expectations, attendance, planning, workload, and student
perception. Table 4.11 contains definitions and examples for each theme. The interview
responses will be presented in detail in the discussion.
Table 4.11 Interview Response Themes for Research Question 2 Code/Theme Definition Example
Expectations Responses in this category focused on
guidelines or a lack thereof for co-teaching set by schools or districts.
Denise (Science Teacher): I don't know if what he's doing is exactly what he's supposed to be doing or if I should be asking for more, reaching out more, I have no idea. So I’m just kind of like, okay, this is what we're doing but there's been no communication on how we're supposed to be co teaching together.
Attendance These responses focused on the
presence of the special education teacher in the science classroom.
Martin (Science Teacher): He's present every day in the classroom. I’ve had some issues before in the past with some co teachers, that would just disappear for a week or weeks on end and then just say, well, I have a bunch of paperwork, I had a bunch of ARC meetings. They really wouldn't communicate that very well.
75
Table 4.11 (Continued)
Code/Theme Definition Example
Planning Responses in this category dealt with planning practices of co-teaching teams.
Martin: Our co teaching collaboration will go on from about three o'clock to about three oh five just kind of debriefing on the day and then talking about what comes next. We'll usually email or text each other some stuff if we have some ideas.
Workload These responses deal with the division of the workload within the co-taught
science classroom.
SR: Talking about the division of workload in the science class, do you feel like you take on the brunt of the responsibility for like modifying or differentiating for students?
Gordon (Special Education Teacher): And no, actually not and sometimes it's, again it's our teachers know our students well enough.
Student Perception
Responses in this category focused on how students viewed the participants
and their co-teachers in terms of roles in the classroom.
Denise: Yeah they view me as the teacher for sure, and I think there, I think that his specific particular students that are on his caseload view him also as a teacher, but the other students in the class do not
4.4 Research Question 3
Data from both the CRS and the AWRCT was used to explore research question 3:
How do teachers’ perceptions of their co-teaching relationships affect the
implementation of co-teaching?
76
To run this analysis, the data was first matched. Only data from teachers that had completed
both the AWRCT and the CRS was retained (N=14). Data from teachers that only
completed the CRS but not the AWRCT was not used in this portion of the analysis (N=3).
Results from the regression analysis can be found in Table 4.12.
Table 4.12 Regression results used to determine whether CRS score significantly impacted AWRCT score
B SE B β Sig.
CRS 0.481 0.815 0.168 0.566
Notes. R = 0.168, R2= 0.028, F=0.349, p= 0.566
This study revealed no significant relationship (p=0.556) between scores on the CRS and
scores on the AWRCT. At this time, the null hypothesis that teachers’ perception of their
co-teaching relationship does not impact the implementation of co-teaching in their
classrooms must be retained.
4.5 Participant Reflection and Ideas for Improvement
During the interviews, participants were asked to reflect on their co-teaching
practices to identify areas that they believe needed improvement. Once these areas were
identified, the participants were asked to provide examples of things they could do, or
things their districts could do, to improve or better support their co-teaching practices.
Major themes from these discussions can be found in Table 4.13.
77
Table 4.13 Interview Response Themes Related to Reflection and Ideas for Improving Co-Teaching
Code/Theme Definition Example
Training
Responses in this category dealt with the participants
desire for training related to co-teaching.
Martin (Science Teacher): I think annual training, or every other year training should definitely be a priority, if not, I’d actually prefer annual training, just to kind of give us that, even if it’s not PD training just an annual event at the beginning of the year, where we get more time.to work on best practices. I mean it's like anything in education and anything in science, things are always changing.
PLC Time
These responses detailed participants’ experiences
with including co-teachers in their Professional
Learning Communities within their schools.
Martin: We do have PLC time together but PLC time doesn't always allow us to collaborate as directly as we would like again because we're taking care of other business.
Planning
Responses in this category related to participants’
experiences lesson planning with their co-teaching
partner. Responses may also deal with participant
recommendations for district supported planning time for co-teaching teams.
Denise (Science Teacher): I think if we had some designated time to plan together, I think that would be a huge help if we could just like, even if it was me like 15-20 minutes, bringing up like hey here's the lesson that are like the lessons I have planned, or this is where we're going. What right now, do you think we should do for our kids in question and just having some actual time in the day designated to discuss our group and what needs to happen.
Choosing Co-Teachers Responses focus on why the participants were chosen to
co-teach.
Gordon (Special Education Teacher): A lot of times it's just on my schedule, you know, and it never bothers me, but you know my having an Ag background I guess you know. I know it's not the same curriculum, don't, I’m not equating that but, at the same time I’ve got a pretty good knowledge of science, and you know everything that we would deal with in there.
78
The response themes for the interviews have been combined into one table within
Appendix I.
79
CHAPTER 5. DISCUSSION
5.1 Participants
An interesting pattern emerged when looking at participant demographics. A large
percentage of teachers (41%) had only been with their current co-teaching partner for one
year. Only two teachers (12%) reported that they co-taught with the same partner for five
or more years even though the majority of teachers (65%) reported that they had been co-
teaching science courses for five or more years. This may suggest that schools do not
prioritize keeping teams together when scheduling courses so that co-teachers can build a
better partnership, although it should be noted that the data in this study does not support
a relationship between perception of co-teacher relationships and co-teaching
implementation.
One interview participant, Martin, stated that in his 10 years of experience, he had
had six different co-teachers. When asked why he thought that was the case, he said that
he believed it was because none of his co-teachers were comfortable enough with the
content and did not understand the course progression. He said that the special education
teachers seemed to want to leave science and stick with social studies or English courses
because they were more comfortable with the content. He reiterated he had never had a co-
teacher stick with him for more than two years before they asked to move to social studies
or English. Another participant, Gordon, stated that he had co-taught in science for 14
years, but at his school, he would get placed in the courses with the highest need. Gordon
had been a special education teacher for over 20 years and stated that in the years he was
not co-teaching in science, he would be co-teaching in English or Math because there
80
would always be a co-teacher in those courses. This suggests that his district places higher
value in co-teaching in literacy and math courses.
5.2 Research Question 1
Research question 1 sought to understand how teachers perceive their co-teaching
relationships and the implementation of co-teaching in their classrooms. When looking at
the average scores for the CRS in Table 4.5, the majority of scores were above 4.0,
indicating that the survey participants believed they were similar to their co-teachers in
terms of beliefs about teaching and approaches to teaching. Similar to results found in
Cramer and Nevin’s (2006) study, the most highly rated items in this study were Q6 Beliefs
communicate freely our concerns,” (M: 4.50; SD: 0.94), Q22 “We have fun with the
students and with each other when we co-teach,” (M: 4.57; SD: 0.85), Q25 “We can
effectively co-teach even when we don’t have time to plan,” (M: 4.50; SD: 0.94), Q27 “We
model collaboration and teamwork for our students,” (M: 4.64; SD: 0.63), Q28 “We are
both viewed by our students as their teacher,” (M: 4.50; SD: 1.16), and Q30 “We depend
on one another to follow through on tasks and responsibilities,” (M: 4.86; SD: 0.36).
Items on the AWRCT that received the lowest scores indicated that these practices
occurred less than two days per week. These items include Q1 “We decide which co-
93
teaching model we are going to use in a lesson based on the benefits to the students and the
co-teachers,” (M: 2.43; SD: 1.70), Q6 “We share responsibility for deciding what to teach,”
(M: 1.96; SD: 1.54), Q8 “We share responsibility for deciding how to teach,” (M: 2.29; SD
1.49), Q9 “We share responsibility for deciding who teaches which part of a lesson,” (M:
2.14; SD: 1.66), and Q23 “We have regularly scheduled times to meet and discuss our
work,” (M: 2.21; SD: 1.72). These responses seem to indicate that there is a power
imbalance such that one of the teachers in co-teaching pairs seems to take control of lesson
planning and pacing. Responses also provide evidence that co-teaching teams are not given
enough opportunities to plan together. Based on results of the Kruskal-Wallis H Test (Table
4.10), there is evidence that teams that are able to co-teach together for 2 or more years are
more likely to share responsibility for deciding what to teach (Q6).
5.3.1 Relevant Interview Responses
Several themes from interview responses were related to research question 2 and
implementation of co-teaching. These themes include expectations, attendance, planning,
workload, and student perception. Also noteworthy, Denise reported the lowest amount of
co-teaching implementation in her classroom and when looking at Table 4.4, one can see
that a larger proportion of students in her school scored at the novice level than students at
Martin or Gordon’s schools.
5.3.1.1 Expectations
Interview participants spoke about expectations set forth by their districts related to
co-teaching and training for co-teaching. Two participants, Martin and Gordon, stated that
their districts provided training or professional development for co-teaching, while Denise
94
stated that her district had never provided training or any sort of expectations for what co-
teaching should look like in her classroom.
Denise: I don't know if what he's doing is exactly what he's supposed to be doing
or if I should be asking for more, reaching out more, I have no idea. So I’m just
kind of like, okay, this is what we're doing but there's been no communication on
how we're supposed to be co teaching together.
Denise: there doesn't seem to be an expectation, for them to be like actively teaching
they're more focused on their one-on-one interactions with their specific students
that I have in the room. That just seems to be the way it's done, and so I think that's
the expectations that they have so I haven't I’ve never actually questioned it or
brought it up.
Martin stated that his district would go through cycles in which they would focus on co-
teaching and then would drop it for a few years before cycling back to it in a few years.
Martin: there's a lot of support there's a lot of like we would like to see you all do
this, we'd like to see this documented, we'd like to see evidence of this. It's just that
seems to be where it stops is, we would like to see you do this stuff we prefer you
all do these things, but we don't see a ton of support in terms of actual practical
resources or training. I keep mentioning four or five years ago, because I know that
was a time where we had a two-day co teaching a workshop at the very beginning
of the school year.
95
Gordon said that his district did offer training on co-teaching, and he planned to participate
in a professional development program in the summer, but as far as expectations, he said
that the district did not put forth guidelines for co-teaching.
Gordon: If a teacher is having an observation done and I’m in that classroom, you
know, I will be acknowledged in that co-teaching assignment for that teacher
because, you know, you're not going to see me sitting on my hands, I mean that's,
one that's not in my character, so. But that's really about it there's no saying this is
okay, this is what we expect to see.
These findings suggest that teachers would like to be able to more effectively co-teach but
are not provided adequate support or professional development opportunities from their
districts. The teachers seem to believe they are doing the best they can with their limited
resources.
5.3.1.2 Attendance
The two science teachers that participated in the interviews, Denise and Martin,
made sure to bring attention to the fact that their co-teachers were present in every class
period and that they appreciated their presence.
Martin: He's present every day in the classroom. I’ve had some issues before in the
past with some co teachers, that would just disappear for a week or weeks on end
and then just say, well, I have a bunch of paperwork, I had a bunch of Arc meetings.
They really wouldn't communicate that very well.
96
Denise: They were there, their attendance is awesome. Like I have heard other co-
teachers in my building are kind of iffy on whether or not they will show up and be
there, but mine have always been very present.
These findings suggest that the science teachers value the presence and input of their
special education co-teacher and resent when the co-teacher has to attend to other
responsibilities that take them out of the classroom.
5.3.1.3 Planning
Planning emerged as an important theme in the interview responses. All three
interview participants expressed a desire to have more time to plan lessons with their co-
teacher.
Martin: Our co teaching collaboration will go on from about three o'clock to about
three oh five just kind of debriefing on the day and then talking about what comes
next. We'll usually email or text each other some stuff if we have some ideas.
Denise: Yeah just more of a partnership in general, would be fantastic.
SR: Can you think of any ways that you might be able to achieve that in the future
with this current partner?
Denise: I think if we had some designated time to plan together, I think that would
be a huge help if we could just like, even if it was only like 15-20 minutes, bringing
up like, hey here's the lessons I have planned or this is where we're going, what
right now do you think we should do for our kids in question and just having some
actual time in the day designated to discuss our group and what needs to happen.
97
These findings may be partially responsible for some of the lower scoring items on the
AWRCT as teachers cannot decide how to split responsibility in deciding what and how to
teach if they are not given time to plan together.
5.3.1.4 Workload
When asked about the workload division in their classrooms, the three participants
had varied answers. Denise only stated that she did a lot more than her co-teacher as he
only came in during her class periods to help specific students. Martin and Gordon had a
more positive view of the division of work.
SR: Talking about the division of workload in the science class, do you feel like
you take on the brunt of the responsibility for like modifying or differentiating for
students?
Gordon: And no, actually not and sometimes it's, again it's our teachers know our
students well enough.
Gordon noted that the science teachers had good enough relationships with the students
that they were able to make necessary modifications to course materials to meet student
needs on their own.
Martin: So I’m probably the pilot of you know, the direction the class goes, and
you know I control the direction and the pacing and things like that. In terms of
modifications that's more equally split up. Like I said a minute ago, he's more
proactive and seeing things coming on the horizon and kind of making
modifications or thinking about modifications that we can work on together to
better fit our kids’ needs.
98
Martin made sure to note that their partnership still was not perfect because his partner was
still new and learning the basics of teaching. He also noted that the modifications his
partner did suggest were usually suggested via email or text since they did not have time
to plan together.
These findings still suggest that the science teacher is taking on the most
responsibility in the co-taught courses. Interview responses indicate that science teachers
are doing most of the course planning and, as science teachers are becoming more confident
in their abilities to modify course materials, they are relying less on the co-teacher.
5.3.1.5 Student Perception
Survey responses indicated that teachers believe their students view them both as
the teacher in the classroom. With the exception of Denise, interview responses support
these findings.
Denise: Yeah they view me as the teacher for sure, and I think there, I think that his
specific particular students that are on his caseload view him also as a teacher, but
the other students in the class do not.
Denise never mentioned her co-teacher doing anything other than interacting with the
students with special needs so it would make sense that the general education students
would not view him as their teacher. The other two participants indicated that their students
viewed both teachers as their teacher, although Gordon stated that the students were
definitely aware of which teacher was the science teacher and which teacher was the special
education teacher.
99
Martin: I think this year they saw it as equal footing because I noticed that they
would ask, they asked [my co-teacher] a lot of questions. They would ask him a
lot of things about their assignments, or what we were doing that day. I think they
still ultimately see me as the as the head teacher just because my name is on the
door and they know they're in my classroom but students, IEP or not, were very
willing to work with [my co-teacher].
5.3.2 Summary
Based on the survey data and interview responses, teachers in this study are not practicing
co-teaching as effectively as they could be. Data shows that teachers are not planning for
the course together, nor are they equally sharing the workload in the class. The interview
participants expressed a sincere desire to receive training or planning time so that they
could fully implement co-teaching in their classrooms because they believe that co-
teaching is beneficial for all students in their classrooms. The data for Q1 of the AWRCT
and interview responses also indicate that teachers are not choosing different co-teaching
models to implement and are relying on the one-teach, one-assist model in their classrooms.
5.4 Research Question 3
Research question 3 sought to understand if there was a relationship between
relationship scores on the CRS and implementation scores on the AWRCT. To explore this
question, a linear regression analysis was performed on the dataset. A significant
relationship was not found and the null hypothesis that relationship score had no effect on
implementation score was retained.
100
In support of the lack of a relationship between scores on the CRS and scores on
the AWRCT, while Martin had the highest AWRCT score, he had a much lower score than
Denise on the CRS. Martin was much more comfortable with his co-teacher and seemed to
believe that they were doing a good job at co-teaching which is counterintuitive to a
relatively low CRS score. Denise had the highest CRS score of the three interview
participants, but her interview responses indicated that she was practicing co-teaching the
least, with her co-teacher only coming into the classroom to provide support for the
students with disabilities. These findings are in contrast to the previous study by Haimowitz
(2018) which found a significant relationship between attitudes and implementation of co-
teaching. However, Haimowitz (2018) did not use the CRS to measure relationships or
attitudes.
5.5 Limitations
The biggest limitation of this study is the sample size. As the sample size is so
small, it is impossible to say the results are generalizable to the larger population of co-
teachers in secondary science courses. The results of this study are, however, useful in
providing evidence for how co-teaching is currently practiced in Kentucky public high
schools, especially in the Green River Regional Educational Cooperative as most of the
participants worked in that region. It should be noted that although the response rate for
the survey seems to be extremely low, it is very likely that the number of science co-
teachers in relation to the number of science teachers and special education teachers
contacted is also very low. In my personal experience, a school may have six science
teachers but only two of those science teachers have the opportunity to co-teach with a
special education teacher. Those two science teachers probably share the same special
101
education teacher as well since many schools seem to assign one special educator to any
courses within one content area. It is also unknown how many districts in Kentucky are
actually practicing co-teaching in science. Multiple teachers and principals emailed the
researcher to indicate that their schools only practiced co-teaching in literacy and
mathematics courses. Research is needed to establish the number of secondary schools that
practice co-teaching in science and to understand why some districts do not value co-
teaching in science courses. Another limitation is that the data did not come from matched
pairs of science and special educators. No co-teaching pairs responded to the surveys at all.
It is believed that the global pandemic impacted teachers’ practice to the extent that
teachers became unwilling to discuss co-teaching due to their perception of their own
implementation as poor, as evidenced by interview responses in this study. Ideally, this
research may be attempted again when schools return to normal operation to see if more
teachers are willing to participate.
Final limitations lie in the instruments. Particularly related to Research Question 3,
the instruments may not have been measuring the exact information needed to fully answer
the research question. For example, the CRS asks teachers to indicate the extent to which
they believe they are similar to or different than their co-teacher partner. However,
questions arise when pondering whether this instrument is truly measuring the teachers’
perception of their relationship and how that might relate to implementation. While the
instrument focuses on whether teachers believe they have similar views on teaching and
values as their partners, it does not ask questions about whether the co-teachers feel valued,
respected, or liked by their partners which may also be important relationship measures.
102
5.6 Implications for Practice
Similar to findings from previous studies (King-Sears et al., 2014; Scruggs et al.,
2007), survey and interview responses indicate that teachers have positive feelings toward
the practice of co-teaching but feel like school and district support is lacking. Interview
participants were asked to elaborate on the level of support districts gave them for co-
teaching and about their ideas for district improvement related to co-teaching. Themes in
their responses include training, PLC time, planning time, and choosing co-teachers.
5.6.1 Recommendations for Improvement
Participants indicated that districts should make the following improvements to
support co-teaching practices.
1. Training – the participants believe that districts should offer annual training or
professional development so that teachers could understand the district’s
expectations of them related to co-teaching. Gordon mentioned that he had
never been evaluated on co-teaching but would like to see some sort of
expectations for what he should be doing in the classroom.
2. PLC Time – Participants indicated that districts should implement time for
special education teachers to participate in the science professional learning
communities at their schools and that PLC time should include time to co-plan
lessons with co-teachers.
3. Planning – Participants stated that districts should instate common planning
time for co-teachers to effective plan for courses, choose co-teaching models,
103
and make necessary modifications in course materials for students with special
needs.
Another theme that emerged was how districts and schools chose people to co-
teach. Teachers were simply chosen because of their backgrounds or because of the courses
they taught. It may prove beneficial for districts or schools to think about the qualities and
dispositions each teacher would bring to a co-teaching team before making teaching
assignments.
Within this study, teachers have expressed a sincere desire to be able to co-teach
effectively because they believe it would have a positive impact on the students. It is hoped
that districts will listen to these teachers’ voices and provide the time and training supports
necessary for their co-teaching teams to thrive.
5.7 Conclusion
Teachers have positive views of their co-teaching relationships. They seem to
believe that they and their partners are doing their best with the resources they’ve been
given. The data, including interview responses suggests that co-teaching teams do not feel
as if they are implementing co-teaching as well as they could be. Based on CRS data, this
could be due to differences in beliefs and dispositions related to planning and roles. This
perception did not significantly differ between experience groups or teacher types.
Teaching teams are not fully implementing co-teaching. As evidenced by the lowest
scoring items on the AWRCT, teams are not planning together, they are not sharing the
workload, and they are not choosing different co-teaching models together. Teachers with
2-4 years of experience with the same partner were more likely to report sharing
104
responsibility for deciding what to teach, but this still occurred infrequently. Perception of
co-teaching relationship appears to have no effect on implementation of co-teaching. Most
teachers had a positive perception of the co-teacher even when they self-reported a lack of
true co-teaching.
This study adds to the literature in that most articles reviewed did not accompany
their claims about co-teaching in science with quantitative data. This study demonstrates
that secondary science co-teaching pairs are not adequately implementing co-teaching but
are willing to improve their co-teaching practices because they believe co-teaching is
beneficial for the students. They feel that their districts and schools are not providing
adequate resources and training to support them.
APPENDICES
Appendix A
The Co-Teacher Relationship Scale (Noonan et al., 2003, p. 115). This questionnaire will be presented to teachers via Qualtrics. Response for each item will range from 1 (very different) to 5 (very similar).
106
Appendix B
The Are We Really Co-Teaching Rating Scale as found in Villa et al., 2013, pp. 380-382.
107
108
Appendix C
The combined survey that was sent to teachers.
109
110
111
112
113
114
Appendix D
Interview Protocol
Teaching History
1. How long have you been a teacher? 2. What is your area of specialty (science or special education)? 3. How long have you taught within that specialty? 4. Why do you think you were chosen to co-teach science? 5. What unique experiences or dispositions do you bring to your role as a co-
teacher?
Current Practices
6. Describe your relationship and the level of comfort with your co-teacher. 7. Describe your level of comfort with the content and working with the students in
the classroom. 8. What would the ideal co-teaching practice look like in your classroom? How do
your current practices compare? 9. How do you and your partner prepare for class together? 10. How would you describe the division of the workload in the class between you
and your co-teacher? 11. How do you think the students view you and view your partner in the classroom? 12. (If content teacher) Describe your level of comfort with your partner’s knowledge
of the content. 13. (If special educator) Describe your level of comfort with your partner’s
knowledge of working with students in special education. 14. Have you ever learned anything from your co-teacher?
Reflection
15. How do you think coteaching impacts your students? 16. Provide a specific example of how co-teaching has helped or hindered student
learning in your classroom. 17. How is co-teaching impacting your teaching practices? 18. Which areas of your current practice do you think need the most improvement? 19. How would you improve those practices? 20. Describe the level of support you receive for your coteaching practices. 21. Which aspects of coteaching do you feel are adequately supported? 22. Which aspects of coteaching do you feel need further support? 23. What supports do you recommend that schools/districts provide for teachers
engaged in coteaching? What would help you the most if you had access to it?
115
Appendix E
Appendix Table 1 Mann-Whitney U test results for the total score and individual question scores from the Co-Teacher Relationship Scale.
Teacher Type Mean Rank Sum of
Ranks Mann-Whitney U Sig.
Sum of Answers on the Co-Teacher Relationship Scale
Science Teachers (N=12)
9.71 116.50
21.500 0.368 Special Education Teachers (N=5)
7.30 36.50
Q1. Views regarding the physical arrangement of the classroom.
Science Teachers (N=12)
9.04 108.50
29.500 0.954 Special Education Teachers (N=5)
8.90 44.50
Q2. Views regarding classroom scheduling.
Science Teachers (N=12)
9.50 114.00
24.000 0.498 Special Education Teachers (N=5)
7.80 39.00
116
Appendix Table 1 (Continued)
Teacher Type Mean Rank Sum of
Ranks Mann-Whitney U Sig.
Q3. Views regarding how to structure students' activities.
Science Teachers (N=12)
9.13 109.50
28.500 0.844 Special Education Teachers (N=5)
8.70 43.50
Q4. Beliefs about what the curriculum for our students should be.
Science Teachers (N=12)
10.08 121.00
17.000 0.119 Special Education Teachers (N=5)
6.40 32.00
Q5. Beliefs about how students learn.
Science Teachers (N=12)
9.50 114.00
24.000 0.505 Special Education Teachers (N=5)
7.80 39.00
117
Appendix Table 1 (Continued)
Teacher Type Mean Rank Sum of
Ranks Mann-Whitney U Sig.
Q6. Beliefs about inclusion.
Science Teachers (N=12)
10.33 124.00
14.000 0.055 Special Education Teachers (N=5)
5.80 29.00
Q7. Views about how to adapt and individualize activities.
Science Teachers (N=12)
9.42 113.00
25.000 0.574 Special Education Teachers (N=5)
8.00 40.00
Q8. Views about how to manage inappropriate behavior.
Science Teachers (N=12)
9.63 115.50
22.500 0.401 Special Education Teachers (N=5)
7.50 37.50
118
Appendix Table 1 (Continued)
Teacher Type Mean Rank Sum of
Ranks Mann-Whitney U Sig.
Q9. Beliefs about teacher roles and responsibilities.
Science Teachers (N=12)
9.83 118.00
20.000 0.254 Special Education Teachers (N=5)
7.00 35.00
Q10. Views regarding parent involvement.
Science Teachers (N=12)
9.83 118.00
20.000 0.214 Special Education Teachers (N=5)
7.00 35.00
Q11. Desire to try new things.
Science Teachers (N=12)
10.13 121.50
16.500 0.114 Special Education Teachers (N=5)
6.30 31.50
119
Appendix Table 1 (Continued)
Teacher Type Mean Rank Sum of
Ranks Mann-Whitney U Sig.
Q12. Confidence as an educator.
Science Teachers (N=12)
9.18 101.00
20.000 0.361 Special Education Teachers (N=5)
7.00 35.00
Q13. Ways of dealing with colleagues, supervisors, parents, and other professionals.
Science Teachers (N=12)
8.17 98.00
20.000 0.269 Special Education Teachers (N=5)
11.00 55.00
Q14. Approaches to educational planning.
Science Teachers (N=12)
8.50 102.00
24.000 0.506 Special Education Teachers (N=5)
10.20 51.00
120
Appendix Table 1 (Continued)
Teacher Type
Mean Rank
Sum of Ranks
Mann-Whitney U Sig.
Q15. Flexibility in dealing with unforeseen events.
Science Teachers (N=12)
8.96 107.50
29.500 0.954 Special Education Teachers (N=5)
9.10 45.50
Q16. Sense of humor.
Science Teachers (N=12)
9.38 112.50
25.500 0.602 Special Education Teachers (N=5)
8.10 40.50
Q17. Ability to be supportive to colleagues and other staff.
Science Teachers (N=12)
9.50 114.00
24.000 0.428 Special Education Teachers (N=5)
7.80 39.00
121
Appendix Table 1 (Continued)
Teacher Type
Mean Rank
Sum of Ranks
Mann-Whitney U Sig.
Q18. Interest in learning new things.
Science Teachers (N=12)
9.42 113.00
25.000 0.553 Special Education Teachers (N=5)
8.00 40.00
Q19. Dedication to teaching.
Science Teachers (N=12)
9.38 112.50
25.500 0.549 Special Education Teachers (N=5)
8.10 40.50
122
Appendix F
Appendix Table 2 Kruskal-Wallis H Test Results for the CRS
Years with Current Partner Mean Rank Kruskal-
Wallis H df Sig.
Overall CRS Score
0-1 (N=7) 9.93
0.625 2 0.714 2-4 (N=8) 7.94
5 or More (N=2) 10.00
Q1
0-1 (N=7) 8.71
0.419 2 0.811 2-4 (N=8) 8.75
5 or More (N=2) 11.00
Q2
0-1 (N=7) 8.29
1.284 2 0.526 2-4 (N=8) 8.75
5 or More (N=2) 12.50
Q3
0-1 (N=7) 8.50
0.182 2 0.913 2-4 (N=8) 9.38
5 or More (N=2) 9.25
123
Appendix Table 2 (Continued)
Years with Current Partner
Mean Rank Kruskal-Wallis H df Sig.
Years with Current Partner
Q4
0-1 (N=7) 9.79
1.367 2 0.505 2-4 (N=8) 7.75
5 or More (N=2) 11.25
Q5
0-1 (N=7) 8.86
0.028 2 0.986 2-4 (N=8) 9.00
5 or More (N=2) 9.50
Q6
0-1 (N=7) 9.29
0.050 2 0.975 2-4 (N=8) 8.81
5 or More (N=2) 8.75
124
Appendix Table 2 (Continued)
Years with Current Partner Mean Rank Kruskal-
Wallis H df Sig.
Q7
0-1 (N=7) 8.71
0.366 2 0.833 2-4 (N=8) 9.63
5 or More (N=2) 7.50
Q8
0-1 (N=7) 6.50
3.287 2 0.193 2-4 (N=8) 10.75
5 or More (N=2) 10.75
Q9
0-1 (N=7) 9.71
0.343 2 0.842 2-4 (N=8) 8.69
5 or More (N=2) 7.75
Q10
0-1 (N=7) 9.00
0.077 2 0.962 2-4 (N=8) 9.19
5 or More (N=2) 8.25
125
Appendix Table 2 (Continued)
Years with Current Partner Mean Rank Kruskal-
Wallis H df Sig.
Q11
0-1 (N=7) 8.64
0.073 2 0.964 2-4 (N=8) 9.25
5 or More (N=2) 9.25
Q12
0-1 (N=7) 9.08
0.493 2 0.781 2-4 (N=8) 7.75
5 or More (N=2) 9.75
Q13
0-1 (N=7) 10.07
2.540 2 0.281 2-4 (N=8) 7.19
5 or More (N=2) 12.50
126
Appendix Table 2 (Continued)
Years with Current Partner Mean Rank Kruskal-
Wallis H df Sig.
Q14
0-1 (N=7) 9.79
1.685 2 0.431 2-4 (N=8) 7.56
5 or More (N=2) 12.00
Q15
0-1 (N=7) 10.00
0.803 2 0.669 2-4 (N=8) 7.94
5 or More (N=2) 9.75
Q16
0-1 (N=7) 9.50
0.227 2 0.893 2-4 (N=8) 8.44
5 or More (N=2) 9.50
Q17
0-1 (N=7) 9.21
1.074 2 0.585 2-4 (N=8) 9.50
5 or More (N=2) 6.25
127
Appendix Table 2 (Continued)
Years with Current Partner Mean Rank Kruskal-
Wallis H df Sig.
Q18
0-1 (N=7) 9.79
0.445 2 0.800 2-4 (N=8) 8.25
5 or More (N=2) 9.25
Q19
0-1 (N=7) 10.29
1.348 2 0.510 2-4 (N=8) 8.31
5 or More (N=2) 7.25
128
Appendix G
Appendix Table 3 Mann-Whitney U Test Results for the Total Score and Individual Question Scores From the Are We Really Co-Teachers Rating Scale
Teacher Type
Mean Rank
Sum of Ranks
Mann-Whitney U Sig.
Sum of Answers on the Are We Really Co-Teachers Rating Scale
Science Teachers
(N=9) 7.22 65.00
20.000 0.739 Special Education Teachers
(N=5)
8.00 40.00
Q1. We decide which co-
teaching model we are going to use in a lesson based on the
benefits to the students and the
co-teachers.
Science Teachers
(N=9) 6.22 56.00
11.000 0.099 Special Education Teachers
(N=5)
9.80 49.00
Q2. We share ideas,
information, and materials.
Science Teachers
(N=9) 7.44 67.00
22.000 0.945 Special Education Teachers
(N=5)
7.60 38.00
Q3. We identify the resources and talents of
the co-teachers.
Science Teachers
(N=9) 7.67 69.00
21.000 0.834 Special Education Teachers
(N=5)
7.20 36.00
129
Appendix Table 3 (Continued)
Years with
Current Partner
Mean Rank Kruskal-Wallis H df Sig.
Q4. We teach different groups
of students at the same time.
Science Teachers
(N=9) 8.33 75.00
15.000 0.277 Special Education Teachers
(N=5)
6.00 30.00
Q5. We are aware of what our co-teacher is doing even when we are
not directly in one another's
presence.
Science Teachers
(N=9) 7.44 67.00
22.000 0.940 Special Education Teachers
(N=5)
7.60 38.00
Q6. We share responsibility for deciding
what to teach.
Science Teachers
(N=9) 7.17 64.50
19.500 0.640 Special Education Teachers
(N=5)
8.10 40.50
Q7. We agree on the
curriculum standards that
will be addressed in a
lesson.
Science Teachers
(N=9) 6.94 62.50
17.500 0.470 Special Education Teachers
(N=5)
8.50 42.50
130
Appendix Table 3 (Continued)
Years with
Current Partner
Mean Rank Kruskal-Wallis H df Sig.
Q8. We share responsibility for deciding how to teach.
Science Teachers
(N=9) 6.89 62.00
17.000 0.442 Special Education Teachers
(N=5)
8.60 43.00
Q9. We share responsibility for deciding who teaches
which part of a lesson.
Science Teachers
(N=9) 7.22 65.00
20.000 0.697 Special Education Teachers
(N=5)
8.00 40.00
Q10. We are flexible and
make changes as needed
during a lesson.
Science Teachers
(N=9) 8.28 74.50
15.500 0.193 Special Education Teachers
(N=5)
6.10 30.50
Q11. We identify student strengths and
needs.
Science Teachers
(N=9) 7.39 66.50
21.500 0.853 Special Education Teachers
(N=5)
7.70 38.50
131
Appendix Table 3 (Continued)
Years with
Current Partner
Mean Rank Kruskal-Wallis H df Sig.
Q12. We share responsibility
for differentiating
instruction.
Science Teachers
(N=9) 8.83 79.50
10.500 0.084 Special Education Teachers
(N=5)
5.10 25.50
Q13. We include other people when
their expertise or experience is
needed.
Science Teachers
(N=9) 7.56 68.00
22.000 0.943 Special Education Teachers
(N=5)
7.40 37.00
Q14. We share responsibility
for how student learning is assessed.
Science Teachers
(N=9) 7.39 66.50
21.500 0.891 Special Education Teachers
(N=5)
7.70 38.50
Q15. We can show that
students are learning when we co-teach.
Science Teachers
(N=9) 8.11 73.00
17.000 0.414 Special Education Teachers
(N=5)
6.40 32.00
132
Appendix Table 3 (Continued)
Years with
Current Partner
Mean Rank Kruskal-Wallis H df Sig.
Q16. We agree on discipline
procedures and carry them out
jointly.
Science Teachers
(N=9) 8.56 77.00
13.000 0.173 Special Education Teachers
(N=5)
5.60 28.00
Q17. We give feedback to one another on what goes on in the
classroom.
Science Teachers
(N=9) 8.39 75.50
14.500 0.262 Special Education Teachers
(N=5)
5.90 29.50
Q18. We make improvements in our lessons based on what happens in the
classroom.
Science Teachers
(N=9) 9.28 83.50
6.500 0.017 Special Education Teachers
(N=5)
4.30 21.50
Q19. We communicate
freely our concerns.
Science Teachers
(N=9) 8.56 77.00
13.000 0.112 Special Education Teachers
(N=5)
5.60 28.00
133
Appendix Table 3 (Continued)
Years with
Current Partner
Mean Rank Kruskal-Wallis H df Sig.
Q20. We have a process for
resolving our disagreements
and use it when faced with
problems and conflicts.
Science Teachers
(N=9) 6.83 61.50
16.500 0.398 Special Education Teachers
(N=5)
8.70 43.50
Q21. We celebrate the
process of co-teaching and the outcomes and successes.
Science Teachers
(N=9) 8.28 74.50
15.500 0.328 Special Education Teachers
(N=5)
6.10 30.50
Q22. We have fun with the students and
with each other when we co-
teach.
Science Teachers
(N=9) 7.83 70.50
19.500 0.614 Special Education Teachers
(N=5)
6.90 34.50
Q23. We have regularly
scheduled times to meet and discuss our
work.
Science Teachers
(N=9) 6.94 62.50
17.500 0.457 Special Education Teachers
(N=5)
8.50 42.50
134
Appendix Table 3 (Continued)
Years with
Current Partner
Mean Rank Kruskal-Wallis H df Sig.
Q24. We use our meeting
time productively.
Science Teachers
(N=9) 7.22 65.00
20.000 0.729 Special Education Teachers
(N=5)
8.00 40.00
Q25. We can effectively co-teach when we don't have time
to plan.
Science Teachers
(N=9) 7.89 71.00
19.000 0.558 Special Education Teachers
(N=5)
6.80 34.00
Q26. We explain the
benefits of co-teaching to the students and
their families.
Science Teachers
(N=9) 6.83 61.50
16.500 0.402 Special Education Teachers
(N=5)
8.70 43.50
Q27. We model collaboration and teamwork
for our students.
Science Teachers
(N=9) 7.83 70.50
19.500 0.614 Special Education Teachers
(N=5)
6.90 34.50
135
Appendix Table 3 (Continued)
Years with
Current Partner
Mean Rank Kruskal-Wallis H df Sig.
Q28. We are both viewed by our students as their teacher.
Science Teachers
(N=9) 7.33 66.00
21.000 0.781 Special Education Teachers
(N=5)
7.80 39.00
Q29. We include students
in the co-teaching role.
Science Teachers
(N=9) 6.11 55.00
10.000 0.079 Special Education Teachers
(N=5)
10.00 50.00
Q30. We depend on one
another to follow through
on tasks and responsibilities.
Science Teachers
(N=9) 7.72 69.50
20.500 0.661 Special Education Teachers
(N=5)
7.10 35.50
Q31. We seek and enjoy additional training to
make our co-teaching better.
Science Teachers
(N=9) 6.06 54.50
9.500 0.068 Special Education Teachers
(N=5)
10.10 50.50
136
Appendix Table 3 (Continued)
Years with
Current Partner
Mean Rank Kruskal-Wallis H df Sig.
Q32. We are mentors to others who want to co-
teach.
Science Teachers
(N=9) 5.67 51.00
6.000 0.022 Special Education Teachers
(N=5)
10.80 54.00
Q33. We can use a variety of
co-teaching approaches
(i.e., supportive,
parallel, complementary, team teaching).
Science Teachers
(N=9) 6.61 59.50
14.500 0.265 Special Education Teachers
(N=5)
9.10 45.50
Q34. We communicate our need for
logistical support and
resources to our administrators.
Science Teachers
(N=9) 6.28 56.50
11.500 0.117 Special Education Teachers
(N=5)
9.70 48.50
137
Appendix H
Appendix Table 4 Kruskal-Wallis H Test Results for the AWRCT.
Years with Current Partner Mean Rank Kruskal-
Wallis H df Sig.
Overall AWRCT Score
0-1 (N=5) 8.00
0.118 2 0.943 2-4 (N=7) 7.29
5 or More (N=2) 7.00
Q1
0-1 (N=5) 5.80
4.835 2 0.089 2-4 (N=7) 9.71
5 or More (N=2) 4.00
Q2
0-1 (N=5) 6.60
2.916 2 0.233 2-4 (N=7) 6.86
5 or More (N=2) 12.00
Q3
0-1 (N=5) 7.20
0.099 2 0.952 2-4 (N=7) 7.50
5 or More (N=2) 8.25
138
Appendix Table 4 (Continued)
Years with Current Partner Mean Rank Kruskal-
Wallis H df Sig.
Q4
0-1 (N=5) 7.60
0.006 2 0.997 2-4 (N=7) 7.43
5 or More (N=2) 7.50
Q5
0-1 (N=5) 8.10
2.259 2 0.323 2-4 (N=7) 6.21
5 or More (N=2) 10.50
Q6
0-1 (N=5) 5.00
6.832 2 0.033 2-4 (N=7) 10.00
5 or More (N=2) 5.00
139
Appendix Table 4 (Continued)
Years with Current Partner Mean Rank Kruskal-
Wallis H df Sig.
Q7
0-1 (N=5) 8.20
0.278 2 0.870 2-4 (N=7) 7.21
5 or More (N=2) 6.75
Q8
0-1 (N=5) 7.30
2.749 2 0.253 2-4 (N=7) 8.79
5 or More (N=2) 3.50
Q9
0-1 (N=5) 6.70
2.129 2 0.345 2-4 (N=7) 8.79
5 or More (N=2) 5.00
Q10
0-1 (N=5) 7.70
0.776 2 0.678 2-4 (N=7) 6.93
5 or More (N=2) 9.00
140
Appendix Table 4 (Continued)
Years with Current Partner Mean Rank Kruskal-
Wallis H df Sig.
Q11
0-1 (N=5) 7.40
0.605 2 0.739 2-4 (N=7) 7.14
5 or More (N=2) 9.00
Q12
0-1 (N=5) 9.70
2.529 2 0.282 2-4 (N=7) 6.36
5 or More (N=2) 6.00
Q13
0-1 (N=5) 7.90
0.185 2 0.912 2-4 (N=7) 7.50
5 or More (N=2) 6.50
141
Appendix Table 4 (Continued)
Years with Current Partner Mean Rank Kruskal-
Wallis H df Sig.
Q14
0-1 (N=5) 7.80
0.047 2 0.977 2-4 (N=7) 7.29
5 or More (N=2) 7.50
Q15
0-1 (N=5) 8.90
1.2562 2 0.534 2-4 (N=7) 7.00
5 or More (N=2) 5.75
Q16
0-1 (N=5) 7.90
0.185 2 0.912 2-4 (N=7) 7.50
5 or More (N=2) 6.50
Q17
0-1 (N=5) 9.60
2.193 2 0.334 2-4 (N=7) 6.21
5 or More (N=2) 6.75
142
Appendix Table 4 (Continued)
Years with Current Partner Mean Rank Kruskal-
Wallis H df Sig.
Q18
0-1 (N=5) 10.50
4.974 2 0.081 2-4 (N=7) 5.86
5 or More (N=2) 5.75
Q19
0-1 (N=5) 9.50
5.038 2 0.081 2-4 (N=7) 5.50
5 or More (N=2) 9.50
Q20
0-1 (N=5) 7.90
3.001 2 0.223 2-4 (N=7) 6.07
5 or More (N=2) 11.50
143
Appendix Table 4 (Continued)
Years with Current Partner Mean Rank Kruskal-
Wallis H df Sig.
Q21
0-1 (N=5) 8.20
0.300 2 0.861 2-4 (N=7) 7.29
5 or More (N=2) 6.50
Q22
0-1 (N=5) 7.80
1.161 2 0.560 2-4 (N=7) 6.71
5 or More (N=2) 9.50
Q23
0-1 (N=5) 7.90
1.498 2 0.473 2-4 (N=7) 8.07
5 or More (N=2) 4.50
Q24
0-1 (N=5) 6.80
0.239 2 0.887 2-4 (N=7) 7.93
5 or More (N=2) 7.75
144
Appendix Table 4 (Continued)
Years with Current Partner Mean Rank Kruskal-
Wallis H df Sig.
Q25
0-1 (N=5) 9.50
5.038 2 0.081 2-4 (N=7) 5.50
5 or More (N=2) 9.50
Q26
0-1 (N=5) 9.70
3.610 2 0.164 2-4 (N=7) 7.07
5 or More (N=2) 3.50
Q27
0-1 (N=5) 9.50
5.091 2 0.078 2-4 (N=7) 5.50
5 or More (N=2) 9.50
145
Appendix Table 4 (Continued)
Years with Current Partner Mean Rank Kruskal-
Wallis H df Sig.
Q28
0-1 (N=5) 7.40
0.602 2 0.740 2-4 (N=7) 7.14
5 or More (N=2) 9.00
Q29
0-1 (N=5) 7.60
0.005 2 0.997 2-4 (N=7) 7.43
5 or More (N=2) 7.50
Q30
0-1 (N=5) 8.50
2.167 2 0.338 2-4 (N=7) 6.50
5 or More (N=2) 8.50
Q31
0-1 (N=5) 6.30
0.710 2 0.701 2-4 (N=7) 8.14
5 or More (N=2) 8.25
146
Appendix Table 4 (Continued)
Years with Current Partner Mean Rank Kruskal-
Wallis H df Sig.
Q32
0-1 (N=5) 5.60
4.871 2 0.088 2-4 (N=7) 7.29
5 or More (N=2) 13.00
Q33
0-1 (N=5) 7.10
2.371 2 0.306 2-4 (N=7) 6.64
5 or More (N=2) 11.50
Q34
0-1 (N=5) 6.00
3.393 2 0.183 2-4 (N=7) 7.29
5 or More (N=2) 12.00
147
Appendix I
Appendix Table 5 Full Set of Interview Response Themes Code/Theme Definition Example
Relationships
Responses in this category dealt with the participants’ descriptions of how they viewed their relationship
with their co-teaching partner.
Martin: My relationship with [my co-teacher] is really well. Like I said, we both coach football together. We've known each other for 10 plus years.
Roles
These responses dealt with participants beliefs or statements
about the roles of their co-teachers or themselves in the classroom.
Denise: There doesn't seem to be an expectation, for them to be like actively teaching. They're more focused on their one on one interactions with their specific students that I have in the room.
Comfort with Abilities
Responses were placed in this category if the participant mentioned their level of comfort with their own
abilities or the abilities of their partner related to content knowledge
or teaching students with special needs.
Martin: Again, I don't think they fully understand the chemistry, or they haven't had enough chemistry exposure, so they don't always understand the end game.
Learning From Each Other
These responses included participants’ descriptions of concepts, practices, and/or knowledge they learned by
interacting with their co-teacher.
Gordon: We've both learned, I mean. And content wise, obviously I mean you know I’ll go in there, and you know, always pick up on something that, you know I may have forgotten, you know from many, many years ago.
148
Appendix Table 5 (Continued)
Code/Theme Definition Example
Impact on Students Response in this category focused
on participants’ descriptions of how co-teaching impacts their students.
Denise: Always beneficial. Even the least partnership co-teaching experience I’ve had, I still feel the students are benefiting for sure.
Even just as far as having like another set of eyes last year with the co-teacher who's now retired she was really observant and so she would see like little things that were occurring.
Expectations
Responses in this category focused on guidelines or a lack thereof for
co-teaching set by schools or districts.
Denise: I don't know if what he's doing is exactly what he's supposed to be doing or if I should be asking for more, reaching out more, I have no idea. So I’m just kind of like, okay, this is what we're doing but there's been no communication on how we're supposed to be co teaching together.
Attendance These responses focused on the
presence of the special education teacher in the science classroom.
Martin: He's present every day in the classroom. I’ve had some issues before in the past with some co teachers, that would just disappear for a week or weeks on end and then just say, well, I have a bunch of paperwork, I had a bunch of Arc meetings. They really wouldn't communicate that very well.
149
Appendix Table 5 (Continued)
Code/Theme Definition Example
Planning Responses in this category dealt with planning practices of co-
teaching teams.
Martin: Our co teaching collaboration will go on from about three o'clock to about three oh five just kind of debriefing on the day and then talking about what comes next. We'll usually email or text each other,some stuff if we have some ideas.
Workload These responses deal with the
division of the workload within the co-taught science classroom.
SR: Talking about the division of workload in the science class, do you feel like you take on the brunt of the responsibility for like modifying or differentiating for students?
Gordon: And no, actually not and sometimes it's, again it's our teachers know our students well enough.
Student Perception
Responses in this category focused on how students viewed the
participants and their co-teachers in terms of roles in the classroom.
Denise: Yeah they view me as the teacher for sure, and I think there, I think that his specific particular students that are on his caseload view him also as a teacher, but the other students in the class do not
150
Appendix Table 5 (Continued)
Code/Theme Definition Example
Training Responses in this category dealt with the participants desire for training related to co-teaching.
Martin: I think annual training, or every other year training should definitely be a priority, if not, I’d actually prefer annual training, just to kind of give us that, even if it’s not PD training just an annual event at the beginning of the year, where we get more time.to work on best practices. I mean it's like anything in education and anything in science, things are always changing.
PLC Time
These responses detailed participants’ experiences with including co-teachers in their
Profession Learning Communities within their schools.
Martin: We do have PLC time together but PLC time doesn't always allow us to collaborate as directly as we would like again because we're taking care of other business.
Planning
Responses in this category related to participants’ experiences lesson planning with their co-teaching
partner. Responses may also deal with participant recommendations for district supported planning time
for co-teaching teams.
Denise: I think if we had some designated time to plan together, I think that would be a huge help if we could just like, even if it was me like 15-20 minutes, bringing up like hey here's the lesson that are like the lessons I have planned, or this is where we're going. What right now, do you think we should do for our kids in question and just having some actual time in the day designated to discuss our group and what needs to happen.
151
Appendix Table 5 (Continued)
Code/Theme Definition Example
Choosing Co-Teachers
Responses focus on why the participants were chosen to co-teach.
Gordon: A lot of times it's just on my schedule, you know, and it never bothers me, but you know my having an Ag background I guess you know. I know it's not the same curriculum, don't, I’m not equating that but, at the same time I’ve got a pretty good knowledge of science, and you know everything that we would deal with in there.
152
Appendix J
Permission to use the CRS.
153
Appendix K
Permission to use the AWRCT.
REFERENCES
Ackerman, K. B. (2017). Examining the efficacy of co-teaching at the secondary level: Special educators' perceptions of their productivity as co-teachers (Order No. 10628780). Available from Dissertations & Theses @ University of Kentucky; ProQuest Dissertations & Theses Global. (1922583177)
Baurhoo, N., & Asghar, A. (2014). Using universal design for learning to construct inclusive science classrooms for diverse learners. Learning Landscapes, 7(2), 59- 81.
Bogdan, R., & Biklen, S. K. (2007). Qualitative research for education: An introduction to theory and methods (5th ed.). Pearson.
Brigham, F. J., Scruggs, T. E., & Mastropieri, M. A. (2011). Science education and students with learning disabilities. Learning Disabilities Research & Practice (Wiley-Blackwell), 26(4), 223–232.
CAST. (2018). Universal Design for Learning Guidelines version 2.2. Retrieved from http://udlguidelines.cast.org
Center for Multilevel Modeling (n.d.). Mann-Whitney tests in SPSS. The British Academy.
Council for Exceptional Children. (2014). Council for Exceptional Children standards for evidence-based practice in special education. Retrieved from http://www.cec.sped.org/~/ media/Files/Standards/Evidence%20based%20Practices%20and%20Practice/CECs%20Evidence%20Based%20Practice%20Standards.pdf
Cook, B.G., & Cook, S.C. (2011). Unraveling evidence-based practices in special education. The Journal of Special Education, 47(2), 71-82. Cook, L., & Friend, M. (1995). Co-Teaching: Guidelines for creating effective practices. Focus on Exceptional Children. 28(3), 1-16.
Cramer, E., & Nevin, A. (2006). A mixed methodology analysis of co-teacher assessments. Teacher Education and Special Education, 29(4), 261-274.
Creswell, J.W. (2012). Educational research: Planning, conducting, and evaluating
quantitative and qualitative research (4th Ed.). Pearson.
Dalton, B., Morocco, C.C., Tivnan, T., & Rawson Mead, P.L. (1997). Supported inquiry science: Teaching for conceptual change in urban and suburban classrooms. Journal of Learning Disabilities, 30, 670-684.
Dexter, D.D., & Hughes, C.A. (2011). A meta-analytic review of graphic organizers
155
and science instruction for adolescents with learning disabilities: Implications for the intermediate and secondary science classroom. Learning Disabilities Research & Practice, 26(4), 204-213.
Dieker, L., & Rodriguez, J. (2013). Enhancing secondary cotaught science and mathematics classrooms through collaboration. Intervention in School and Clinic, 49(1), 46-53.
Dymond, S. K., Renzaglia, A., Rosenstein, A., Eul Jung Chun, Banks, R. A., Niswander, V., & Gibson, C. L. (2006). Using a Participatory Action Research Approach to Create a Universally Designed Inclusive High School Science Course: A Case Study. Research & Practice for Persons with Severe Disabilities, 31(4), 293–308. https://doi.org/10.1177/154079690603100403
Eick, C.J., Ware, F.N., & Williams, P.G. (2003). Coteaching in a science methods course: A situated learning model of becoming a teacher. Journal of Teacher Education, 54(1), 74-85.
Emerson, R.M., Fretz, R.I., & Shaw, L.L. (1995). Writing Ethnographic Fieldnotes. Second Edition. London, UK: The University of Chicago Press.
Fenty, N. S., McDuffie-Landrum, K., & Fisher, G. (2012). Using collaboration, co- teaching, and question answer relationships to enhance content area literacy. Teaching Exceptional Children, 44(6), 28–37.
Guise, M., Habib, M., Thiessen, K., & Robbins, A. (2017). Continuum of co-teaching
implementation: Moving from traditional student teaching to co-teaching. Teaching and Teacher Education, 66, 370-382.
Haimowitz, B. S. (2018). Self-perceived teacher attitudes about inclusion and the
implementation of co-teaching models in the elementary school classroom (Order No. 10790289). Available From ProQuest Dissertations & Theses Global. (2034429880).
Heward, W.L., Alber-Morgan, S.R., & Konrad, M. (2017). Exceptional children: An introduction to special education. Boston, MA: Pearson.
Hines, J. T. (2008). Making collaboration work in inclusive high school classrooms: Recommendations for principals. Intervention in School & Clinic, 43(5), 277– 282.
Hott, B.L., Berkeley, S.L., Raymond, L.P., & Reid, C.C. (2018). Translating intervention research for students with mild disabilities to practice: A systemic journal analysis. The Journal of Special Education, 52(2), 67-77.
Individuals with Disabilities Education Act, 20 U.S.C. § 1400 (2004).
Lava, V.F. (2012). Inquiry into co-teaching in an inclusive classroom. I.E.: Inquiry in Education, 3(2), Article 5. Retrieved from: https://digitalcommons.nl.edu/ie/vol3/iss2/5/
Lave, J. & Wenger, E. (1991). Situated Learning: Legitimate Peripheral Participation. New York, NY: Cambridge.
Lewis-Beck, C. & Lewis-Beck, M. (2015). Applied regression: An introduction. (2nd Ed). SAGE Publications.
Linz, E., Heater, M. J., & Howard, L. (2008). Team teaching high school science: Game plan for success. Teaching Exceptional Children Plus 5(2) Article 2.
Kahn, S., & Lewis, A.R. (2014). Survey on teaching science to k-12 students with disabilities: Teacher preparedness and attitudes. Journal of Science Teacher Education, 25(8), 885-910. Kentucky Department of Education. (2020, June 6). Kentucky Education Facts.
King-Sears, M.E., Brawand, A.E., Jenkins, M.C., Preston-Smith, S., (2014). Co-teaching perspectives from secondary science co-teachers and their students with disabilities. Journal of Science Teacher Education, 25. 651-680
Korthagen, F.A.J. (2010). Situated learning theory and the pedagogy of teacher education:
Towards an integrative view of teacher behavior and teacher learning. Teaching and Teacher Education, 26, 98-106.
Krithikadatta, J. (2014). Normal distribution. Journal of Conservative Dentistry, 17(1), 96-97.
Maeng, J. L., & Bell, R. L. (2015). Differentiating Science Instruction: Secondary science teachers’ practices. International Journal of Science Education, 37(13), 2065– 2090.
Malian, I., & McRae, E. (2010). Co-Teaching beliefs to support inclusive education: Survey of relationships between general and special educators in inclusive classes. Electronic Journal for Inclusive Education, 2 (6).
Mastropieri, M.A., & Scruggs, T.E. (2010). The inclusive classroom: Strategies for effective differentiated instruction (6th Ed.). Pearson.
McLeskey, J. (2017). High-leverage practices in special education. Council for Exceptional Children.
Mcduffie, K.A., Mastropieri, M.A., Scruggs, T.E. (2009). Differential effects of peer tutoring in co-taught and non-co-taught classes: Results for content learning and student-teacher interactions. Exceptional Children, 75(4), 493-510.
Merriam, S.B. (1998) Qualitative Research and Case Study Applications in Education. San Francisco, CA: Jossey-Bass.
157
Minthrop, H., & Zane, R. (2017). When the achievement gap becomes high stakes for special education teachers: Facing a dilemma with integrity. Teachers College Record, 119(9), 1–39.
Moorehead, T., & Grillo, K. (2013). Celebrating the Reality of Inclusive STEM Education. Teaching Exceptional Children, 45(4), 50–57. https://doi.org/10.1177/004005991304500406
Mumba, F., Banda, A., & Chabalengula, V.M. (2015). Chemistry teachers' perceived benefits and challenges of inquiry-based instruction in inclusive chemistry classrooms. Science Education International, 26(2), 180-194.
Murawski, W.W., & Swanson, H.L. (2001). A meta-analysis of co-teaching research. Where are the data? Remedial and Special Education, 22(5), 258-267. National Center for Education Statistics. National Assessment of Educational Progress (NAEP). Ann Arbor, MI: [distributor], 2015-01-26.
Applications for professional development. Education and Training in Developmental Disabilities, 38(1), 113-120.
Phelan, Michelle P. (2018). General education science and special education teachers’ experiences with inclusive middle school science classrooms. Dissertation Abstracts International, Vol.79(9-A(E)).
Ploessl, D., Rock, M. L., Schoenfeld, N. A., & Blanks, B. (2010). On the same page: Practical techniques for enhancing co-teaching interactions. Intervention in School and Clinic, 45(3), 158-168.
Price, J.F., Johnson, M., & Barnett, M. (2012). Universal design for learning in the science classroom. In Hall, T.E., Meyer, A., & Rose, D.H. (ED.). Universal Design for Learning in the Classroom: Practical Applications (pp. 55-70). The Guilford Press.
Ricci, L.A., Persiani, K., Williams, A.D., & Ribas, Y. (2019). Preservice general educators using co-teaching models in math and science classrooms of an urban teacher residency programme: Learning inclusive practices in teacher training. International Journal of Inclusive Education, DOI: 10.1080/13603116.2018.1563643
Rice, D. (2017). Elementary general education teachers’ knowledge of and experience teaching students with disabilities in science and social Studies. Dissertation Abstracts International Section A: Humanities and Social Sciences. ProQuest Information & Learning. Retrieved from http://search.ebscohost.com.ezproxy.uky.edu/login.aspx?direct=true&db=psyh& AN=2016-47709-143&site=ehost-live&scope=site
Riedell, K. E. (2017). Understanding curriculum, instruction and assessment within eighth grade science classrooms for special needs students. Dissertation Abstracts
International Section A: Humanities and Social Sciences. ProQuest Information & Learning. Retrieved from http://search.ebscohost.com.ezproxy.uky.edu/login.aspx?direct=true&db= psyh& AN=2017-10860-042&site=ehost-live&scope=site
Russo-Campisi, J. (2017). Evidence-based practices in special education: Current assumptions and future considerations. Child & Youth Care Forum, 46(2), 193- 205.
Schulte, A. C., & Stevens, J. J. (2015). Once, sometimes, or always in special education: Mathematics growth and achievement gaps. Exceptional Children, 81(3), 370– 387.
Scruggs, T.E., & Mastropieri, M.A. (2000). The effectiveness of mnemonic instruction for students with learning and behavior problems: An update and research synthesis. Journal of Behavioral Education, 10(2/3), 161-173. Scruggs, T.E., Matropieri, M.A., & McDuffie, K.A. (2007). Co-teaching in inclusive classrooms: A metasynthesis of qualitative research. Exceptional Children, 73(4), 392-416.
Seidman, I. (2006). Interviewing as Qualitative Research: A Guide for Researchers in Education and Social Sciences. Third Edition. New York, NY: Teachers College Press.
Simon, B. D. (2018). Successful collaboration between general education and special education teachers: A case study. Dissertation Abstracts International Section A: Humanities and Social Sciences. ProQuest Information & Learning.
Skiba, R.J., Simmons, A.B., Ritter, S., Gibb, A.C., Rausch, M.K., Cuadrado, J., & Chung, C-G. (2008). Achieving equity in special education: History, status, and current challenges. Exceptional Children (74) 4, 264-288.
Stenhoff, D.M., & Lignugaris/Kraft, B. (2007). A review of the effects of peer tutoring on students with mild disabilities in secondary settings. Exceptional Children, 74(1), 8-30.
Therrien, W. J., Taylor, J. C., Hosp, J. L., Kaldenberg, E. R., & Gorsh, J. (2011). Science Instruction for Students with Learning Disabilities: A Meta-Analysis. Learning Disabilities Research & Practice (Wiley-Blackwell), 26(4), 188–203
159
Thornton, A., McKissick, B. R., Spooner, F., Ya-yu Lo, & Anderson, A. L. (2015). Effects of collaborative preteaching on science performance of high school students with specific learning disabilities. Education & Treatment of Children, 38(3), 277–304.
Tomlinson, C.A. & Imbeau, M.B. (2010) Leading and Managing a Differentiated Classroom. Alexandria, Va: ASCD.
U.S. Department of Education, Office for Civil Rights. (2010) Free appropriate public education for students with disabilities: Requirements under Section 504 of the Rehabilitation Act of 1973. ED Pubs. Van Garderen, D., Hanuscin, D., Lee, E., & Kohn, P. (2012). QUEST: A collaborative professional development model to meet the needs of diverse learners in K‐6 Science. Psychology in the Schools, 49(5), 429–443.
Villa, R., Thousand, J., & Nevin, A. (2013). A guide to co-teaching: Practical tips for facilitating student learning. Thousand Oaks, CA: Corwin Press.
Walther-Thomas, C.S. (1997). Co-teaching experiences: The benefits and problems that teachers and principals report over time. Journal of Learning Disabilities, 30(4), 395-407. Watt, S. J., Therrien, W. J., Kaldenberg, E., & Taylor, J. (2013). Promoting inclusive practices in inquiry-based science classrooms. Teaching Exceptional Children, 45(4), 40–48.
Weiss, M.P., & Rodgers, W.J. (2020). Instruction in secondary cotaught classrooms: Three elements, two teachers, one unique approach. Psychology in the Schools, 57(6), 959-972.
Wenger, E. (1998). Communities of Practice: Learning, Meaning, and Identity. New York, NY: Cambridge.
Windschitl, M., Thompson, J., Braaten, M., & Stroupe, D. (2012). Proposing a core set of instructional practices and tools for teachers of science. Science Education, 96(5), 878-903.
Wolgemuth, J.R., Cobb, R.B., & Alwell, M. (2008). The effects of mnemonic interventions on academic outcomes for youth with disabilities: A systematic review. Learning Disabilities Research & Practice, 23(1), 1-10.
VITA
Academic Degrees and Preparation
Ph.D. Expected 2021: University of Kentucky, Education Sciences, STEM Education Strand, Advisor: Dr. Jennifer Wilhelm.
MAT (2017): University of Louisville, Secondary Science Education
B.S. (2013): Radford University, Chemistry and Biology
Professional Experience
2021–Present Alice Lloyd College Associate Professor of Education
2018-2021 University of Kentucky Graduate Assistant
2017-2018 Shelby County High School Integrated Science Teacher
2016-2017 North Oldham High School Chemistry and Biology Teacher
2015-2016 Nelson County High School Chemistry, AP Chemistry Teacher
Paper Presentations
Krall, R1., Ringl, S1., & Criswell, B2. Professional noticing as a tool for developing a shared vision of pedagogical practice in science. Presentation at the annual meeting of the Association for Science Teacher Education, ASTE, Salt Lake City, UT (January 13-16, 2021) [Conference Held Virtually].
Krall, R., Criswell, B., & Ringl, S. How do secondary science teacher candidates’ noticing skills develop in the context of their methods courses? Presentation at the annual meeting of the National Association for Research in Science Teaching, NARST, Portland, OR (March 15-18, 2020) [Conference Cancelled].
Ringl, S. Differentiation in secondary science classrooms. Presentation at the Spring Research Conference, Cincinnati, OH (March 7, 2020).
Wilhelm, J., Cole, M., Driessen, E., Yesilyurt, E., Huerta, M., Higgens, Hightower,
A., Jones, J., Gonzalez-Napoleoni, J., & Ringl, S. Spatial-Scientific
161
snapshots of middle level students’ lunar understanding. Presentation at the annual meeting of the School Science and Mathematics Association, SSMA, Salt Lake City, UT (November 7-9, 2019).
Ringl, S., & Krall, R. Effect of classroom video analysis on noticing abilities in
secondary science pre-service teachers. Presentation at the Spring Research Conference, Lexington, KY (March 2, 2019).
Submitted Scholarly Works
Criswell, B., Krall, R., & Ringl, S (2020). Video analysis and professional noticing in the wild of real science teacher education class. Manuscript submitted for publication.
Wilhelm, J., Cole, M., Driessen, E., Ringl, S., Hightower, A., Huerta, M., Gonzalez- Napolieoni, J., Jones, J., & Yesilyurt, E. (2020). Middle school students’ contextualized spatial understandings after studying moon phases: A comparison of two geographic locations. Manuscript submitted for publication.
Manuscripts in Preparation
Krall, R., Ringl, S., & Criswell, B. (2020). Effect of classroom video analysis on noticing abilities in secondary science pre-service teachers. Manuscript in preparation.
Ringl, S. (2020). Inclusive strategies for students with disabilities in secondary co-taught science classrooms. Manuscript in preparation.