Co-treatment of Domestic and O&G Wastewater with a Hybrid Sequencing Batch Reactor-Membrane Bioreactor Victoria Billings, Kathryn Newhart, Kevin Chan, John Spear, Tzahi Cath Colorado School of Mines 2015 Annual Water Resources Association Conference November 16-19, 2015
Transcript
Co-treatment of Domestic and O&G Wastewater with a Hybrid Sequencing Batch Reactor-Membrane Bioreactor
Victoria Billings, Kathryn Newhart, Kevin Chan, John Spear, Tzahi Cath Colorado School of Mines
2015 Annual Water Resources Association Conference
November 16-19, 2015
Colorado School of Mines B.S. Engineering – Environmental Specialty M.S. Civil and Environmental Engineering
Oil and gas industry Environmental engineering intern in North Dakota
Introduction
Background Drivers to water reuse Water use and wastewater generation in upstream O&G sector Wastewater composition and management options Beneficial reuse options and economics Treatment by conventional WWTPs Objectives of current research
Materials and methods Preliminary results Concluding remarks
Presentation Overview
3
Drivers to Water Reuse
Drought is becoming more severe in west and southwest
Energy development demands water that is currently in short supply
Primary challenges: Where does this water
come from? What quality of water is
needed? How do we efficiently
and safely manage the wastewater generated?
Water Use in Upstream O&G Sector
5
Water Use: 100,000 to
1 million gallons
Water Use: 2 to 5 million
gallons
Water Use: Secondary and
enhanced oil recovery
Adapted from: conocophillips.com
Drilling Fluid/Mud
Fracturing Flowback
Produced Water
Wastewater Generation in Upstream O&G Sector
6
Used to aid in the drilling process Contains chemical additives Corrosion inhibitors, biocides, lubricants
Produced during fracturing of a well 10-40% of water injected returns as this waste
stream Composition changes with time
During transition to production, flowback transitions to produced water
Contains naturally present formation water that has been trapped in the rock
Flowback and produced water High dissolved organic matter, including volatile compounds and
hydrocarbons High salt content (often > 35 g/L) Metals (e.g., iron, manganese, calcium, magnesium, barium, etc.) Dissolved gases (e.g., H2S) Naturally occurring radioactive material (NORM) High concentrations of suspended solids, oil, and grease
Major challenges: Highly variable wastewater quality (spatial and temporal) High salinity
7
Wastewater Composition
Evaporation pits
Deep well injection disposal (U.S. EPA UIC Program - Class II)
Treatment and surface water discharge
Recycling/reuse Relatively uncommon with no national estimates†
Must be economically competitive with deep well disposal for industry to adopt
†Pacific Institute, Hydraulic Fracturing and Water Resources: Separating the Frac from the Fiction, 2012. http://pacinst.org/publication/hydraulic-fracturing-and-water-resources-separating-the-frack-from-the-fiction/
Oil & Gas Exploration and Production: Potential Beneficial Reuses
Drilling Muds
Frac Flowback
Produced Water
Internal Reuse
9
Transportation costs are typically largest expense Trucking on average:
$1/barrel/hour Freshwater on site and
wastewater off site
Water Recycling & Reuse: Economics
10
Is freshwater less expensive
than treatment?
Cost dependent on
local water availability
Is disposal less expensive than
treatment?
$0.25 - 2.50/barrel to
inject, depending on
location
Water Acquisition
Wastewater Disposal
Potential solution: mobile, on-site treatment
Biological treatment is difficult for O&G wastewater High salinity Variability in composition
Pairing O&G wastewater with municipal could be a potential option for biological treatment Hydrocarbons and other O&G organics are a readily biodegradable
carbon source to stimulate biological activity Many nutrients present in municipal wastewater are also present in
O&G wastewater
Can Conventional Wastewater Treatment Plants Treat O&G Wastewater?
11
O&G wastewaters are not currently sent to WWTP Regulations Proposed: Effluent Limitations Rule
• Would ban wastewater from O&G operations • Concerns: formation of DBP’s, accumulation of hazardous constituents
in sludge, reducing efficacy of WWTP operations as a whole • Final rule: March 2016
Research Little to no research has been performed on co-treatment
applications
Co-Treatment: Regulations & Research
12
Ultrafiltration
Potential Treatment Train
13
Nanofiltration
Feed
Permeate
QE, CE
QPERM, CPERM
QRAS, CRAS
Sequencing Batch Reactor
QDUAL,
CDUAL QDUAL, C1
QSOLIDS, CSOLIDS
Organics/Hydrocarbons Divalent Ions
Microorganisms Viruses
Monovalent Ions
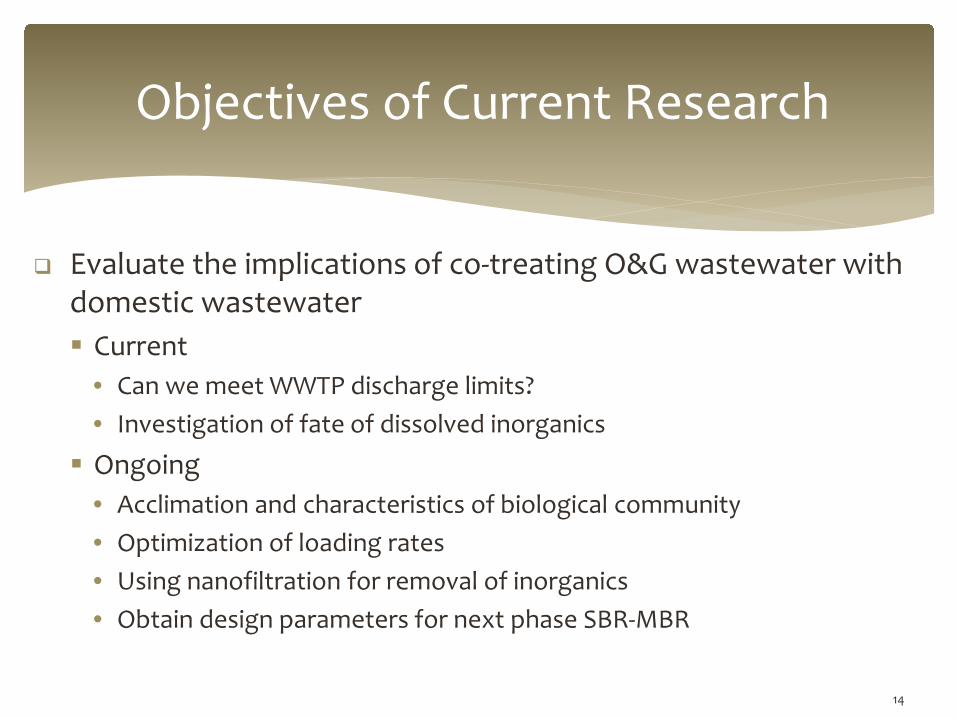
Evaluate the implications of co-treating O&G wastewater with domestic wastewater Current
• Can we meet WWTP discharge limits? • Investigation of fate of dissolved inorganics
Ongoing • Acclimation and characteristics of biological community • Optimization of loading rates • Using nanofiltration for removal of inorganics • Obtain design parameters for next phase SBR-MBR
*With average influent concentrations of 145 mg/L COD and 27mg/L NH4-N
Co-treatment Initial Start-up
22
8.4 L/hr municipal wastewater
0.6 L/hr PW Same operating
conditions as treatment of municipal wastewater
Parameter Municipal Produced
pH 7.5 6.5
Conductivity (mS/cm) 1.0 24
sCOD (mg/L) 200 1500
NH4-N (mg/L) 40 20
NH4 and COD Removal with Produced Water
23 *With average influent concentrations of 232 mg/L COD and 44 mg/L NH4-N
0102030405060708090
100
0 25 50 75 100 125 150 175 200 225 250 275 300
Perc
ent R
emov
al, %
Runtime, hrs
COD RemovalNH4 Removal
Fate of Inorganic Constituents
24
UF Permeate
Analyte Combined
Influent Stream (Avg)
24 hours 32 hours 48 hours 56 hours 72 hours
B 1.40 0.188 0.470 1.09 0.271 0.855 Ba 0.608 0.174 0.264 0.361 0.381 0.385 Ca 71.8 60.5 59.7 59.8 59.6 70.8 K 12.5 12.2 12.4 10.8 10.0 12.2 Li 0.377 BDL BDL BDL BDL BDL
Mg 15.9 14.3 14.3 13.8 13.7 14.9 Na 498 235 301 349 375 438 P 8.13 5.06 8.63 8.08 5.89 4.17 S 161 37.9 35.9 37.9 37.3 30.2 Si 6.15 5.13 6.05 7.69 6.43 5.50 Sr 2.76 0.976 1.38 1.72 1.86 2.14
Analytes predominately found in produced water
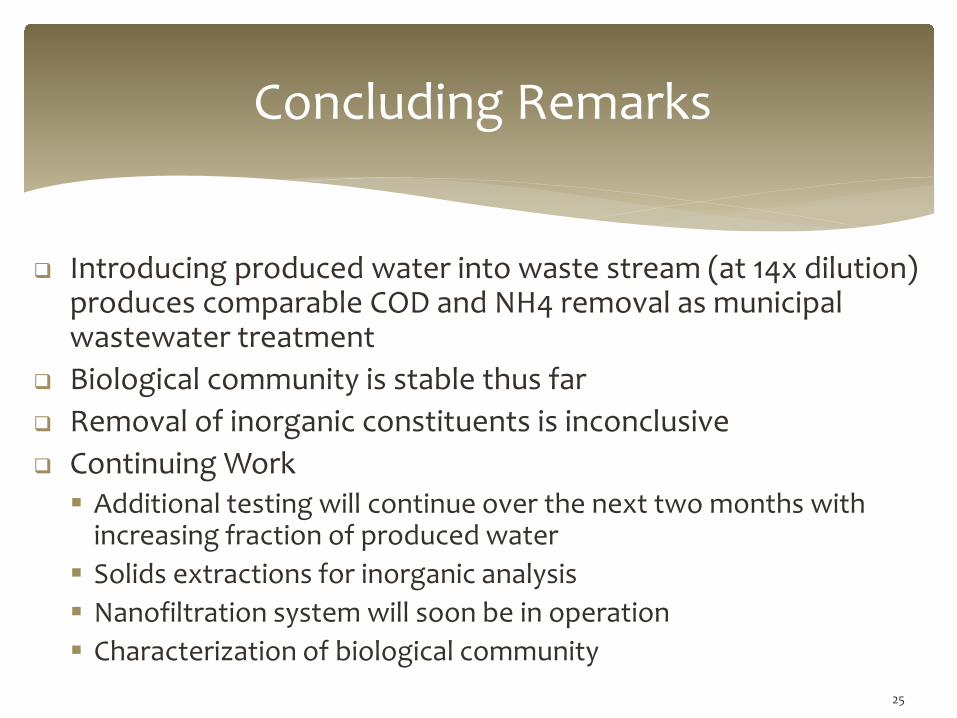
Introducing produced water into waste stream (at 14x dilution) produces comparable COD and NH4 removal as municipal wastewater treatment
Biological community is stable thus far Removal of inorganic constituents is inconclusive Continuing Work Additional testing will continue over the next two months with
increasing fraction of produced water Solids extractions for inorganic analysis Nanofiltration system will soon be in operation Characterization of biological community
Concluding Remarks
25
Cath Research Group Kate Newhart, Dotti Ramey, Ryan Holloway, Steph Riley, Mike