48
28/2016 CLIMATE CHANGE CO2 Emission Factors for Fossil Fuels

28/2016 CLIMATE CHANGE
CO2 Emission Factors for Fossil Fuels

CLIMATE CHANGE 28/2016
CO2 Emission Factors for Fossil Fuels
by
Kristina Juhrich
Emissions Situation (Section I 2.6)
German Environment Agency (UBA) June 2016
Climate Change CO2 emission factors for fossil fuels
4
Short description
Germany is obligated to report its national emissions of greenhouse gases, annually, to the European Union and the United Nations. Over 80 % of the greenhouse-gas emissions reported by Germany occur via combustion of fossil fuels. The great majority of the emissions consist of carbon dioxide. To calcu-late carbon dioxide emissions, one needs both the relevant activity data and suitable emission factors, with the latter depending on the applicable fuel quality and input quantities. In light of these elements' importance for emission factors, the German inventory uses country-specific emission factors rather than international, average factors. To determine such factors, one requires a detailed knowledge of the fuel compositions involved, especially with regard to carbon content and net calorific values.
The present publication provides an overview of the quality characteristics of the most important fuels used in Germany and of the CO2 emission factors calculated on the basis of those characteristics. Since annual greenhouse-gas emissions have to be calculated back to 1990, the study also considers fuels that are no longer used today. To that end, archival data are used. Gaps in the data are closed with the help of methods for recalculation back through the base year.

Climate Change CO2 emission factors for fossil fuels
5
Contents
List of Tables ..................................................................................................................................................... 6
1 Introduction ............................................................................................................................................ 9
2 Oxidation factors .................................................................................................................................... 9
3 Hard coal ............................................................................................................................................... 10
3.1 Grades of hard coal ............................................................................................................... 10
3.2 Net calorific values and carbon content ............................................................................... 11
3.3 Calculation of CO2 emission factors for hard coal ................................................................ 15
3.4 Coking coal, hard coal and hard-coal products of the steel industry ................................... 15
3.5 Hard coal and hard-coal briquettes in small combustion plants .......................................... 16
4 Lignite ................................................................................................................................................... 18
4.1 Raw lignite ............................................................................................................................ 18
4.2 Determination of emission factors back through 1990 ........................................................ 20
4.3 Lignite briquettes .................................................................................................................. 22
4.4 Lignite dust and fluidised bed coal ....................................................................................... 24
4.5 Lignite coke ........................................................................................................................... 24
4.6 Meta-lignite .......................................................................................................................... 24
4.7 Other lignite products ........................................................................................................... 25
4.8 Peat ....................................................................................................................................... 25
5 Petroleum ............................................................................................................................................. 27
5.1 Crude oil and naphtha .......................................................................................................... 27
5.2 Gasolines ............................................................................................................................... 27
5.3 Diesel fuel ............................................................................................................................. 34
5.4 Refinery gas........................................................................................................................... 35
5.5 LP gas .................................................................................................................................... 36
5.6 Other petroleum products and residual substances ............................................................ 36
6 Gases ..................................................................................................................................................... 38
6.1 Coke oven gas, blast furnace gas and basic oxygen furnace gas .......................................... 38
6.2 Town gas ............................................................................................................................... 38
6.3 Fuel gas ................................................................................................................................. 39
6.4 Natural gas and associated gas ............................................................................................. 40
7 Selected fuel-related CO2 emission factors .......................................................................................... 45
8 List of sources ....................................................................................................................................... 48
Climate Change CO2 emission factors for fossil fuels
6
List of Figures Figure 1: Origins of hard coal used in Germany in 1990 ................................... 10
Figure 2: Origins of hard coal used in Germany in 2014 ................................... 11
Figure 3: Calorific values & carbon content of hard coal from Germany, South Africa and Indonesia ........................................................................... 12
Figure 4: Net calorific values & carbon content levels of hard coal from Poland, Colombia and Norway ........................................................................ 13
Figure 5: Net calorific values & carbon content levels of hard coal from Russia, the U.S., Venezuela and Australia ....................................................... 13
Figure 6: Net calorific values & carbon content levels of other types of hard coal ...................................................................................................... 14
Figure 7: Net calorific values & carbon content for raw lignite from the Lusatian (Lausitz) mining district ........................................................ 18
Figure 8: Net calorific values & carbon content for raw lignite from the central German (Mitteldeutschland) mining district ...................................... 19
Figure 9: Net calorific values & carbon content for raw lignite from the Rhineland (Rheinland) mining district ................................................ 19
Figure 10: Comparison of net calorific values & carbon content in raw lignite .. 20
Figure 11: Calorific values and carbon content of waste oil ................................ 37
Figure 12: Origins of natural gas, 1990 ................................................................ 43
Figure 13: Origins of natural gas, 2014 ................................................................ 44
List of Tables
Table 1: Analysis data for hard coal ................................................................. 16
Table 2: Analysis data for lignite briquettes ..................................................... 22
Table 3: Analysis data for other lignite products ............................................. 25
Table 4: Analysis data for peat ......................................................................... 26
Table 5: Analysis data for the various grades of gasoline ................................ 28
Table 6: Comparison of CO2 emission factors .................................................. 31
Table 7: Composition of "Normal" [regular] gasoline grades .......................... 32
Table 8: Composition of "Super" [mid-grade/plus] gasoline grades ................ 32
Table 9: Composition of "Super Plus" [premium] gasoline grades .................. 33
Table 10: Composition of diesel fuels in summer .............................................. 34
Table 11: Composition of diesel fuels in winter ................................................. 34
Table 12: Composition of the different components in town gas, by origin ..... 39
Table 13: Analysis data for lignite gases used in the former GDR ...................... 40
Table 14: Analysis data for natural gas L ............................................................ 41
Climate Change CO2 emission factors for fossil fuels
7
Table 15: Analysis data for natural gas H ........................................................... 42
Table 16: CO2 emission factors – fuel-related emission factors (excerpt; last revision: 15 April 2016) ....................................................................... 45

Climate Change CO2 emission factors for fossil fuels
8
List of Abbreviations
AGEB Working Group on Energy Balances (Arbeitsgemeinschaft Energiebilanzen)
BAFA Federal Office for Economic Affairs and Export Control (Bundesamt für Wirtschaft und Ausfuhrkontrolle)
DBI German fuel institute (Deutsches Brennstoffinstitut)
DDR German Democratic Republic, GDR (Deutsche Demokratische Republik)
DEBRIV Federal German association of all lignite producing companies and their affiliated organ-isations (Deutscher Braunkohlen Industrieverein)
DEHSt German Emissions Trading Authority (Deutsche Emissionshandelsstelle)
DGMK German society for petroleum and coal science and technology (Deutsche Wissenschaft-liche Gesellschaft für Erdöl, Erdgas und Kohle e.V.)
ETS Emissions Trading System
Eurostat Statistical office of the European Union
GASAG Berlin natural gas utility (Berliner Gaswerke AG)
GUS Commonwealth of Independent States, CIS (Gemeinschaft Unabhängiger Staaten)
IPCC Intergovernmental Panel On Climate Change
MTBE Methyl tert-butyl ether
PAH Polycyclic aromatic hydrocarbons (= polycyclische aromatische Kohlenwasserstoffe (PAK))
PIONA Paraffins, Isoparaffins, Olefins, Naphthenes and Aromatics
UNFCCC United Nations Framework Convention on Climate Change
VDKI German Coal Importer Association (Verein der Kohlenimporteure)
W.E.G. German federal association for natural gas, petroleum and geoenergy (Wirtschaftsver-band Erdgas- und Erdölgewinnung (New name: Bundesverband Erdgas, Erdöl und Geoenergie e.V. (BVEG)) )
Climate Change CO2 emission factors for fossil fuels
9
1 Introduction Combustion-related CO2 emissions are calculated by multiplying the relevant fuel data, as obtained from statistics, by the applicable emission factors. The emission factors for this purpose depend pri-marily on the carbon content and net calorific value of the fuels involved. Over 80 % of all German greenhouse-gas emissions are calculated in this manner. For this reason, the quality of the factors is of central importance.
The CO2 emission factors for reporting on greenhouse gases (cf. the tables in Chapter 7) are deter-mined primarily on the basis of data, on measured fuel parameters, that are reported and anonymised in the context of emissions trading. Annual data are available on net calorific values, emission factors, fuel quantities and data quality. The data undergo thorough quality checks. For example, only factors from tier levels 3 or 4 enter into calculations. In every case, tier level 3 and 4 values are analysis values that are representative for the entire year. The two tier levels differ solely in terms of the applicable uncertainties. In the context of emissions trading, some substance streams are not uniquely named, and this leads to erroneous material allocations in connection with solid fuels. In the case of coal, such misallocations can be unambiguously identified via the net calorific value and then subsequently real-located. Lignite and hard coal can be clearly and unambiguously differentiated via their net calorific values. Annually weighted averages are calculated from the quality-checked data. To check whether the so-determined factors are truly representative, the underlying fuel quantities are compared with the corresponding figures from the Energy Balance. In addition, care is taken to ensure the greatest possible consistency between net calorific values and emission factors. Ultimately, such work also sup-ports quality assurance of emissions trading data.
Data from sources in addition to emissions trading were used as well. Furthermore, we evaluated rele-vant archive data, and we carried out measurements of our own. The recalculations back through the year 1990 were carried out with a range of widely differing procedures. In each case, the most suitable procedure for the specific situation was selected. This approach was designed to assure the con-sistency of the time series – and to provide the most realistic solutions possible. Finding well-docu-mented archive data for the year 1990 proved to be a challenge, since documents for that year were available only in paper form, and housed at a range of different institutions. In addition, it was found that data were seldom kept for longer than 20 years. What is more, the qualities of the fuels used in the former GDR tended to differ – considerably, in some cases – from the qualities of the fuels used in the old German Länder. Since some of the terminology used in this connection in the former GDR was not used at all in statistics of the former Federal Republic of Germany (West Germany), the relevant fuels had to be assigned to fuel groups used in the latter country. For example, in the Energy Balance, "lig-nite tar" was placed in the meta-lignite (Hartbraunkohle) category. In the final analysis, the task of positively identifying such exotic fuels proved possible only with the help of experts on this subject. Due to the long time period involved, however, some of the pertinent experts had already retired. The scope of the task was limited by carrying out highly detailed considerations solely for the base year 1990. For the years 1990 – 1994, all relevant statistics are available, broken down by old and new Ger-man Länder. For interim years, a number of assumptions had to be made, since even less information was available for those years than was available for 1990. In addition, a great many installations were decommissioned in the new German Länder in the early 1990s. In some years, such closures led to sudden fuel changes.
2 Oxidation factors The 1996 IPCC Guidelines, which were the valid source for the calculation methods to be used for re-porting through 2014, listed default values for oxidation factors. Those oxidation factors were calcu-lated from the carbon content remaining in ash. The currently valid 2006 IPCC Guidelines work from a basis of complete fuel oxidation and no longer include that calculation step. In each case, they apply an
Climate Change CO2 emission factors for fossil fuels
10
oxidation factor of 1. The German Greenhouse-Gas-Emissions-Trading Act (Treibhausgas-Emission-shandelsgesetz) also specifies an oxidation factor of 1. For this reason, emissions trading data do not include data on carbon content remaining in ash. Neither do any other sources provide reliable and representative data for this area. For this reason, an oxidation factor of 1 is assumed. In the German greenhouse-gas inventory, pertinent calculations have always been based on assumed complete oxida-tion, due to the uncertainties in the data.
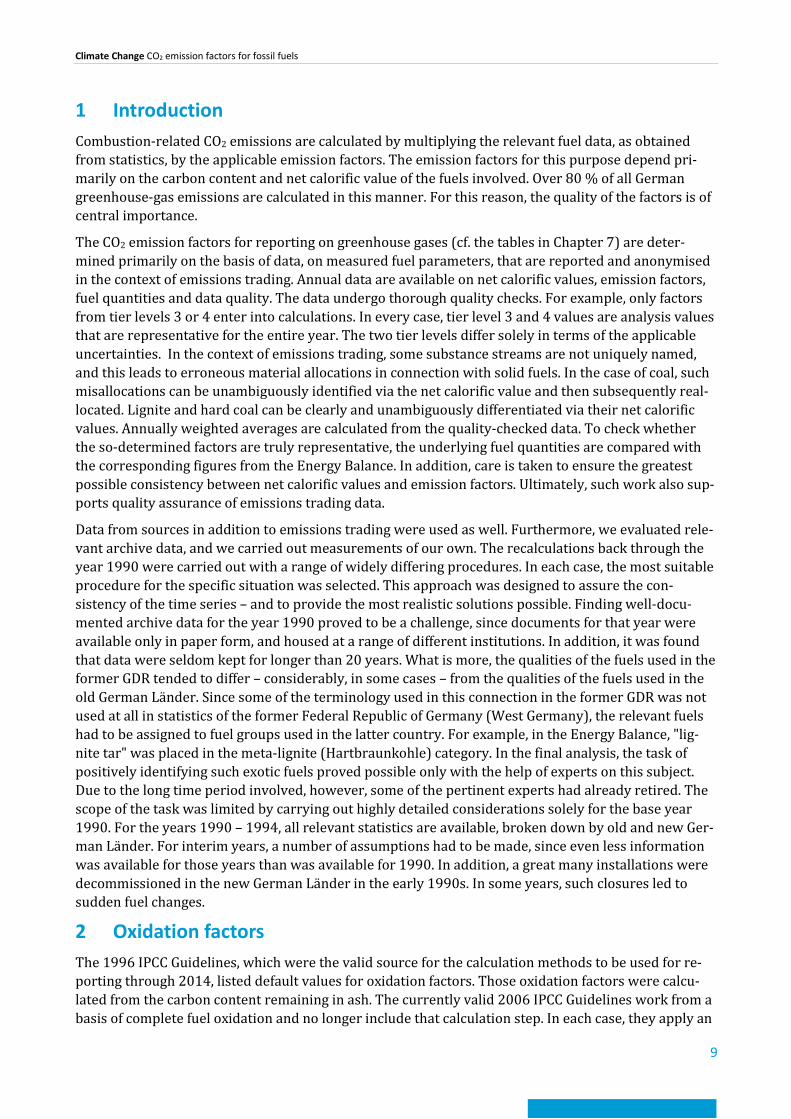
3 Hard coal 3.1 Grades of hard coal The quantities of hard coal used in Germany have been decreasing since 1990. At the same time, hard coal's share of Germany's primary energy consumption has hardly changed at all. In 2014, it amounted to about 13 %. On the other hand, the sources for Germany's hard-coal supply have changed consider-ably. Throughout the course of the time series, these changes have led to changes in average net calo-rific values and carbon content. The following figures provide an overview of the sources of Germany's hard-coal supply in 1990 and in 2014.
Figure 1: Origins of hard coal used in Germany in 1990
Source: VDKI 2015, AGEB 2016
CIS0.6%
USA1.2%
Australia2.0%
Germany (own production)
81.3%
Colombia0.2%
Other EU0.0%
South Africa7.8%
Poland4.6%
Canada0.1%
Other2.1%

Climate Change CO2 emission factors for fossil fuels
11
Figure 2: Origins of hard coal used in Germany in 2014
Source: VDKI 2015, AGEB 2016
Whereas in 1990, the great majority of the hard coal used in Germany was mined within Germany it-self, the country now imports most of its hard coal. And Germany's hard-coal mining sector will shut down completely in 2018. From that point on, Germany will use only imported hard coal.
The fraction of coal that Germany imports from South Africa and Poland has remained about the same since 1990. On the other hand, imports from Australia, the U.S., Colombia and the Commonwealth of Independent States (CIS) – primarily from Russia – have increased considerably. Imports from Canada and from other EU countries have also increased – although not to the same degree.
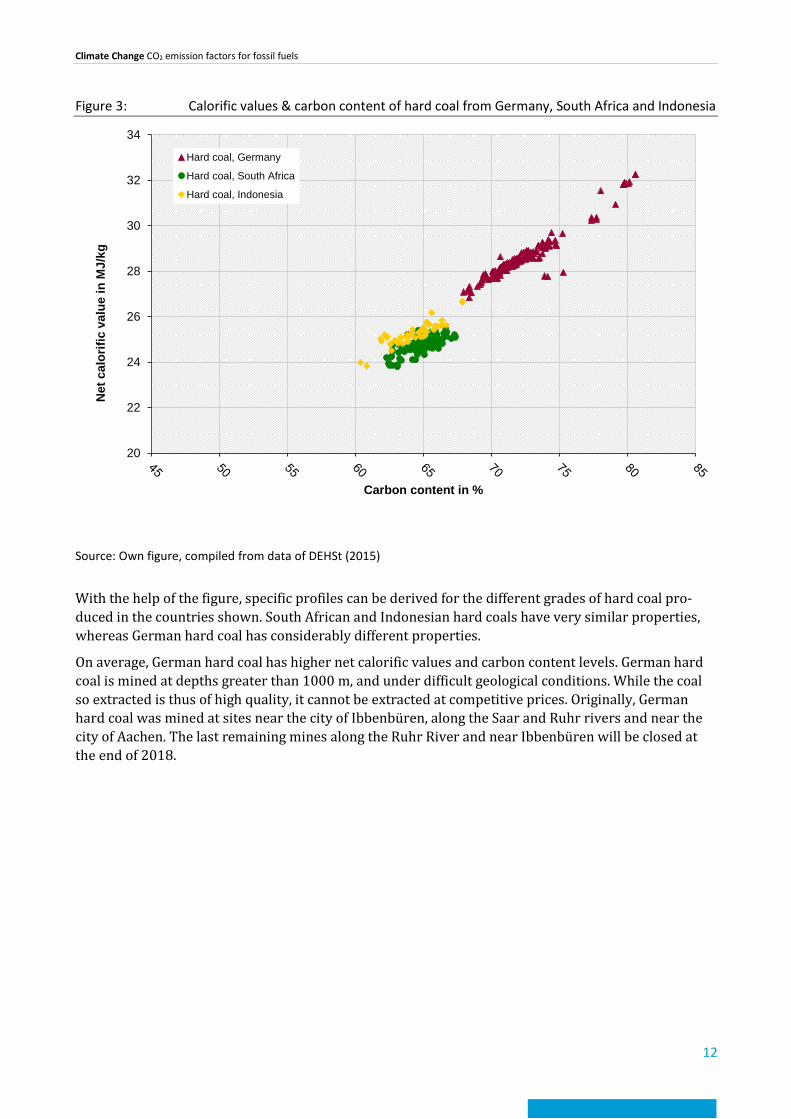
3.2 Net calorific values and carbon content Coal-quality characteristics differ from mining region to mining region. In some cases, different open-pit mines within the same region will yield different grades of coal. At the same time, quality differ-ences tend to be not as pronounced in hard coal as they are in lignite. The following figures show net calorific value / carbon ratios for various grades of hard coal. In each case, the carbon content figures and net calorific values refer to the original substance.
CIS19.2%
USA18.6%
Australia14.2%
Germany (own production)
12.5%
Colombia9.6%
Other EU7.7%
South Africa6.6%
Poland5.7%
Canada3.8%
Other2.1%
Climate Change CO2 emission factors for fossil fuels
12
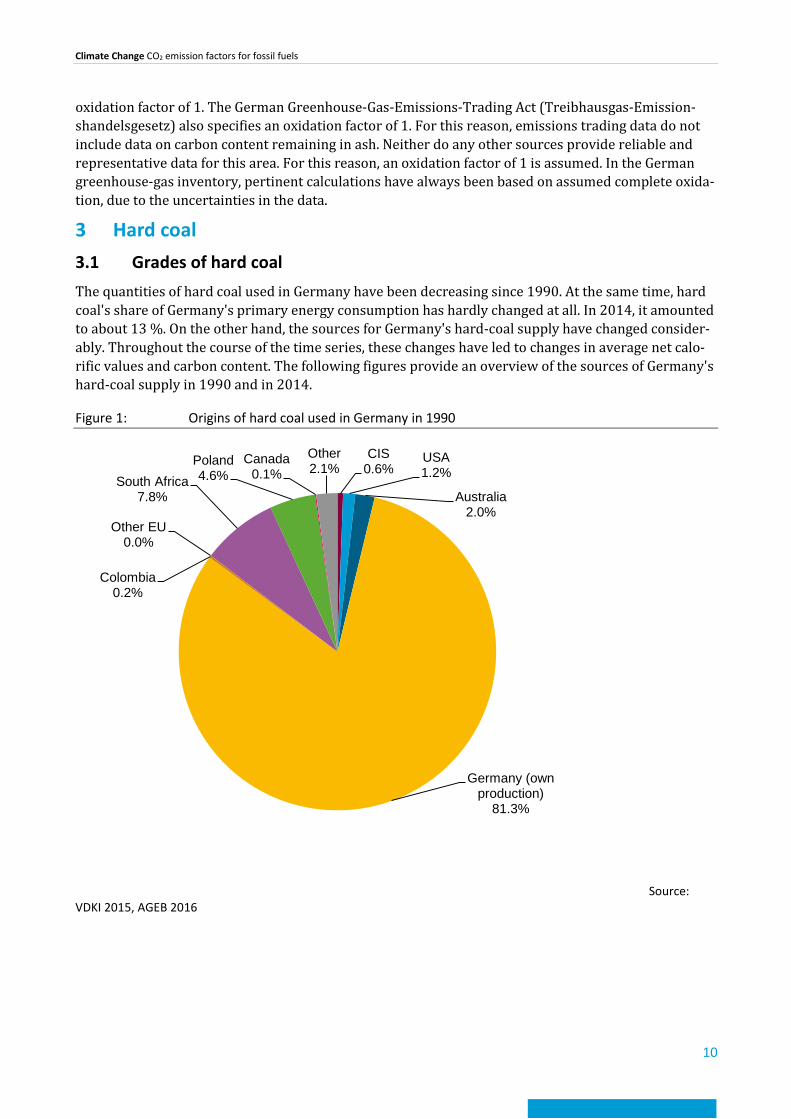
Figure 3: Calorific values & carbon content of hard coal from Germany, South Africa and Indonesia
Source: Own figure, compiled from data of DEHSt (2015)
With the help of the figure, specific profiles can be derived for the different grades of hard coal pro-duced in the countries shown. South African and Indonesian hard coals have very similar properties, whereas German hard coal has considerably different properties.
On average, German hard coal has higher net calorific values and carbon content levels. German hard coal is mined at depths greater than 1000 m, and under difficult geological conditions. While the coal so extracted is thus of high quality, it cannot be extracted at competitive prices. Originally, German hard coal was mined at sites near the city of Ibbenbüren, along the Saar and Ruhr rivers and near the city of Aachen. The last remaining mines along the Ruhr River and near Ibbenbüren will be closed at the end of 2018.
20
22
24
26
28
30
32
34
Net
cal
orifi
c va
lue
in M
J/kg
Carbon content in %
Hard coal, Germany
Hard coal, South Africa
Hard coal, Indonesia
Climate Change CO2 emission factors for fossil fuels
13
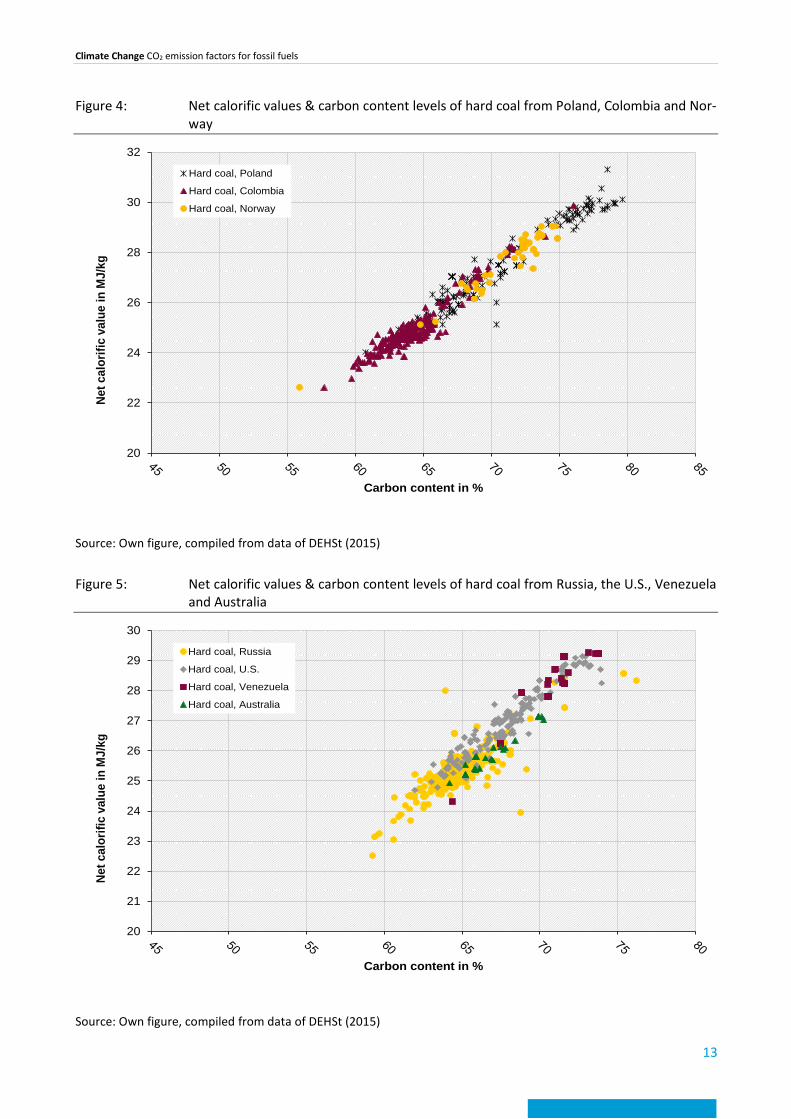
Figure 4: Net calorific values & carbon content levels of hard coal from Poland, Colombia and Nor-way
Source: Own figure, compiled from data of DEHSt (2015)
Figure 5: Net calorific values & carbon content levels of hard coal from Russia, the U.S., Venezuela and Australia
Source: Own figure, compiled from data of DEHSt (2015)
20
22
24
26
28
30
32
Net c
alor
ific
valu
e in
MJ/
kg
Carbon content in %
Hard coal, Poland
Hard coal, Colombia
Hard coal, Norway
20
21
22
23
24
25
26
27
28
29
30
Net c
alor
ific
valu
e in
MJ/
kg
Carbon content in %
Hard coal, Russia
Hard coal, U.S.
Hard coal, Venezuela
Hard coal, Australia

Climate Change CO2 emission factors for fossil fuels
14
Most varieties of hard coal have a carbon content (with respect to the original substance) between 60 and 75 %. The average content, which can vary from year to year, ranges between 65 and 66 %. Hard coal within the lower range, up to a carbon content of about 56 %, and a net calorific value of no more than 22 MJ/kg, is referred to as low-grade coal. Hard coal within the upper range is of coking-coal quality. The highest carbon content, reaching values over 30 %, is found in anthracite coal.
Hard coal is commonly classified in terms of its fractions of volatile components. Coal classifications include flame coal (Flammkohle), gas flame coal (Gasflammkohle), gas coal (Gaskohle), fat coal (Fett-kohle), forge coal (Esskohle), non-baking coal (Magerkohle) and anthracite (Anthrazit). Since hydro-gen is among the volatile components in coal, this classification scheme cannot be directly applied to the evaluation carried out in the present study. For purposes of emission calculation, the carbon con-tent and the lower heating value (net calorific value) are of central importance.
Figure 6: Net calorific values & carbon content levels of other types of hard coal
Source: Own figure, compiled from data of DEHSt (2015)
In addition to the substance streams that, on the basis of their designation, can be assigned to specific areas of origin, significant quantities of mixed coal and of coal of uncertain origin have to be consid-ered. Data relative to those quantities were also evaluated. The "other hard coal" types of coal also ex-hibit a fixed net calorific value / carbon ratio. The hard coal that cannot be assigned to specific areas of origin basically falls onto the same ratio line as that formed by hard coal from known areas of origin. This relationship is particularly pronounced in hard coal, because sulphur and hydrogen content levels do not vary as much in hard coal as they do in other fuels. A fuel's sulphur and hydrogen content influ-ences its net calorific value. Since these elements – logically enough – do not include any carbon, these parameters affect the slopes of the lines.
20
22
24
26
28
30
32
34
Net
cal
orifi
c va
lue
in M
J/kg
Carbon content in %
Climate Change CO2 emission factors for fossil fuels
15
3.3 Calculation of CO2 emission factors for hard coal CO2 emission factors and net calorific values were determined for all relevant coal fractions of known origin (Germany, South Africa, Australia, Indonesia, Colombia, Norway, Poland, Czech Republic, Russia, U.S. and Venezuela). In addition, weighted averages were calculated for the "other hard coal" fractions that cannot be assigned to specific areas of origin. Two different methods for calculating hard-coal emission factors for previous years of the time series were reviewed. In one method, a weighted aver-age for each year was calculated using data for the individual areas of origin, along with import-stream data given in hard-coal statistics. In the other method, a weighted average was formed from all of the verified emission factors reported in emissions trading. Since the pertinent values differ only very slightly in most years (with differences ranging between 0.02 and 0.35 %), as of 2006 weighted emis-sion factors for all hard coal reported in emissions trading (except that used in the iron & steel sector) can be used – regardless of the areas of origin involved. The recalculations back through 1990 are car-ried out by combining the origin-specific emission factors, as determined from emissions trading data, with the relevant import streams. This produces a consistent time series. Over the years, the weighted emission factor for hard coal increases slightly, from 93.1 t CO2/TJ in 1990 to 94.3 t CO2/TJ in 2011. As of that year, the factor then decreases slightly. All in all, the German values, on average, are slightly be-low the default value given by the 2006 IPCC Guidelines, 94.6 t CO2/TJ.
Review of the individual values used in emissions trading shows that changes in the applicable regula-tions have considerably enhanced the quality of net calorific values and emission factors, especially those used as of 2008. In addition, the quantity of hard coal that can be clearly assigned to specific ar-eas of origin has decreased considerably. For this reason, the most sensible approach is to form weighted averages that cover all hard coal, regardless of area of origin. This is the only way to ensure that the resulting emission factors are truly representative.
Inter-sectoral emission factors are calculated for hard coal. This ensures that the relevant total emis-sions are determined as precisely as possible. Apart from the fact that the calculations needed to pro-duce sector-specific emission factors would be unreasonably laborious, the emissions trading sector and official statistics (which provide the basis for the national greenhouse-gas inventory) do not al-ways agree in their emissions allocations to specific industrial sectors, and thus sector-specific calcula-tion of emission factors, as a general basis, would necessarily lead to errors. In the present case, such an approach would make it impossible to assure the correctness of the resulting total-emissions data.
3.4 Coking coal, hard coal and hard-coal products of the steel industry An exception is made for the iron and steel industry; sector-specific emission factors have been calcu-lated for it. The coking coal data used by the iron and steel industry are not calculated on an inter-sec-toral basis, since that coal can be unambiguously identified. Furthermore, few reliable net-calorific-value data are available. Although a formula for calculating net calorific values could be derived using the above figures, such a derivation would be too cumbersome in the present case. The relevant emis-sions can be calculated directly using the carbon-content data available from emissions trading and statistics on steel production, which are already available in natural units. To prevent double-counting, the pertinent coal is not included in calculation of emission factors for hard coal overall. For the iron & steel sector, the inventory gives only mass-related emission factors.
From the same data set, it was possible to calculate emission factors for hard-coal coke, hard-coal tar and benzene, all of which the Energy Balance combines under "Other hard-coal products."
For all other sectors in which hard-coal coke is used, a net-calorific-value-related CO2 emission factor of 108.1 t CO2/TJ was calculated. That value is somewhat higher than the IPCC default value of 107 t CO2/TJ. Since hard-coal coke is a compound product of defined composition, with only slight quality fluctuations, an average is used for pertinent calculations. The annual substance-value fluctuations lie

Climate Change CO2 emission factors for fossil fuels
16
within the uncertainties range. With this in mind, an average covering a 9-year period was formed. The resulting value is reviewed on an annual basis. If any significant changes occur, the factor will be suita-bly adjusted.
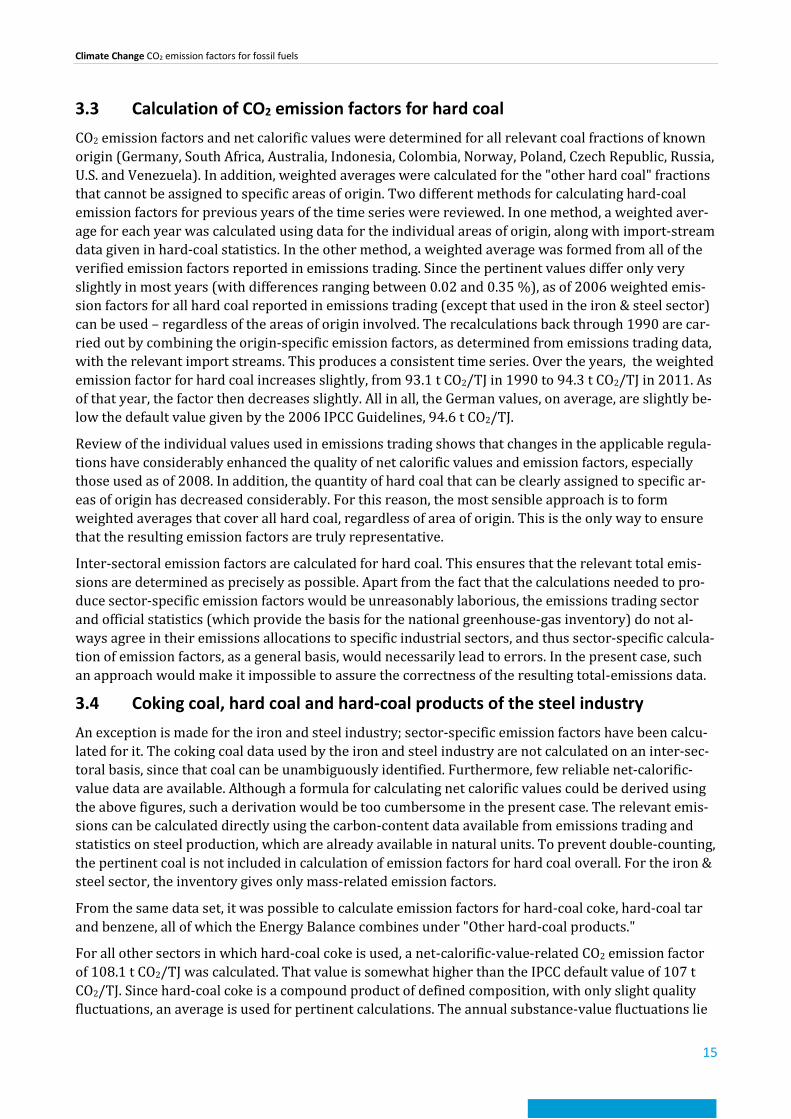
3.5 Hard coal and hard-coal briquettes in small combustion plants Since emissions trading data do not include hard-coal briquettes used in small combustion plants, Technische Universität Dresden, Faculty of Mechanical Science and Engineering, carried out analyses of its own for this area, in the framework of the project "Adjustment of methods used in German GHG-emissions inventories, to bring them into line with the revised 'UNFCCC reporting guidelines on annual inventories for Parties included in Annex I to the convention'" ("Methodische Anpassung der deutschen THG-Emissionsinventare an die überarbeiteten 'UNFCCC reporting guidelines on annual inventories for Parties included in Annex I to the convention.'") (Öko-Institut 2014), and at the Insti-tute of Power Engineering (Institut für Energietechnik). The resulting values were carried back through the year 1990, since no representative values were available for the base year. In all likeli-hood, most of the hard-coal briquettes used at that time were German hard-coal briquettes. Today, only imported briquettes are used. Since the last German hard-coal-briquette factory was closed in 2007, it was not possible to analyze this fuel (German hard coal briquettes). On the other hand, hard-coal briquettes are a defined product whose carbon content and net calorific values vary only slightly. Consequently, the error that results from the relevant assumption is also very small.
The anthracite coal burned in households and in other small combustion plants was also studied. For anthracite, data from emissions trading are available. The CO2 emission factors calculated from the emissions trading data are higher than those determined via the analyses. A mean value of 97.6 t CO2/TJ was calculated from the combination of emission trading data and analysis results. That value is closer to the default value of 98.3 t CO2/TJ given in the 2006 IPCC Guidelines.
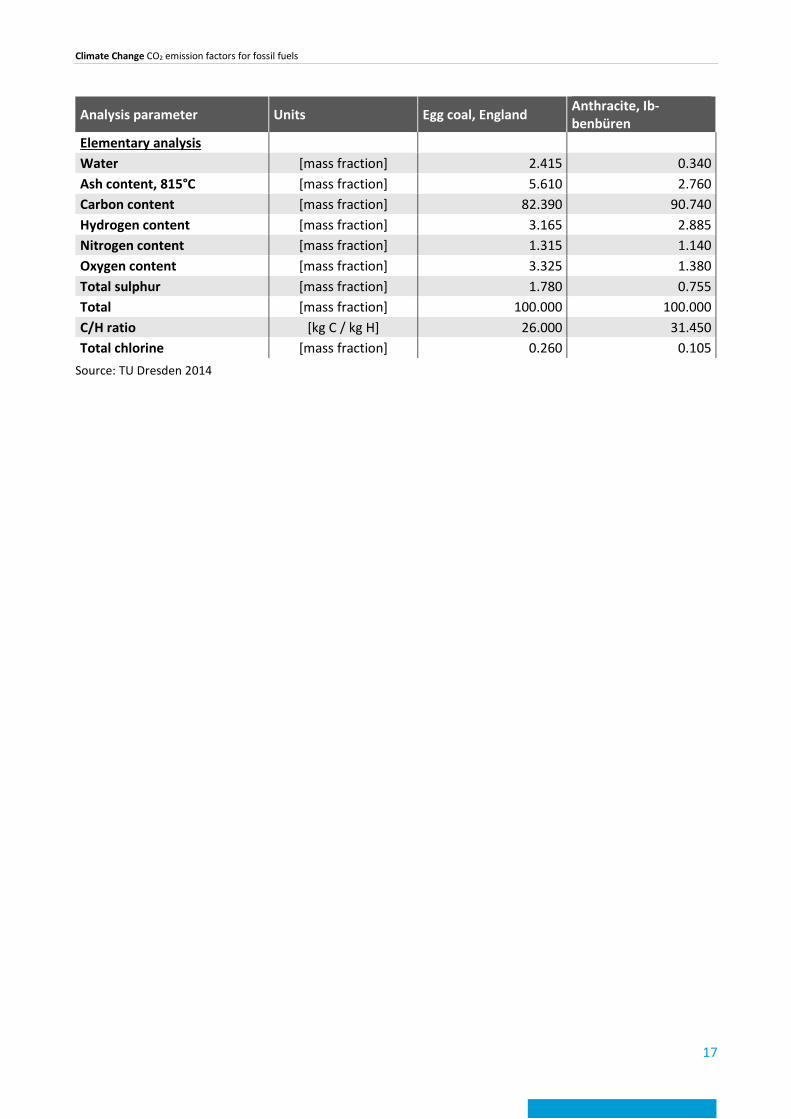
The following table presents an overview of the results from the analyses.
Table 1: Analysis data for hard coal
Analysis parameter Units Egg coal, England Anthracite, Ib-benbüren
Short analysis Water [mass fraction] 2.415 0.340 Ash content, 815°C [mass fraction] 5.610 2.760 Volatiles [mass fraction] 10.820 4.505 Fixed carbon [mass fraction] 81.155 92.395 Total [mass fraction] 100.000 100.000 Higher heating value [kJ/kg] 32,236.500 35,021.500 Net calorific value [kJ/kg] 31,496.000 34,361.500 CO2-emission factor [t CO2/TJ] 95.913 96.828
Climate Change CO2 emission factors for fossil fuels
17
Analysis parameter Units Egg coal, England Anthracite, Ib-benbüren
Elementary analysis Water [mass fraction] 2.415 0.340 Ash content, 815°C [mass fraction] 5.610 2.760 Carbon content [mass fraction] 82.390 90.740 Hydrogen content [mass fraction] 3.165 2.885 Nitrogen content [mass fraction] 1.315 1.140 Oxygen content [mass fraction] 3.325 1.380 Total sulphur [mass fraction] 1.780 0.755 Total [mass fraction] 100.000 100.000 C/H ratio [kg C / kg H] 26.000 31.450 Total chlorine [mass fraction] 0.260 0.105
Source: TU Dresden 2014
Climate Change CO2 emission factors for fossil fuels
18
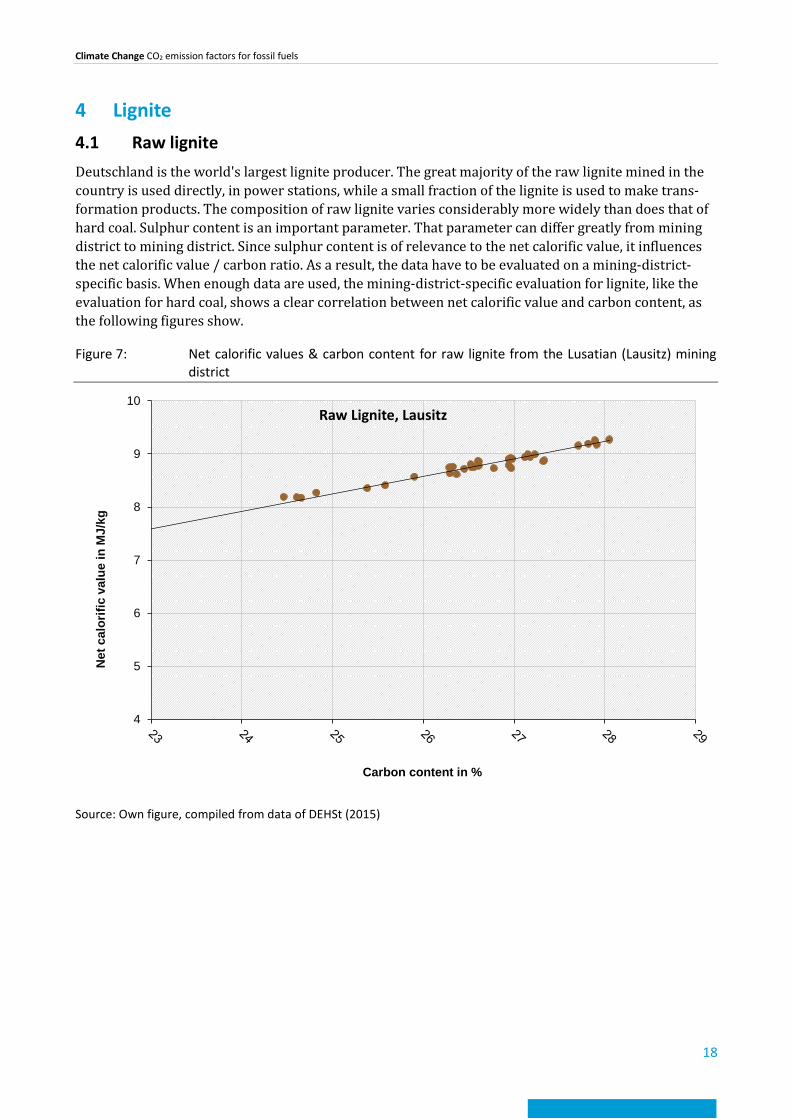
4 Lignite 4.1 Raw lignite Deutschland is the world's largest lignite producer. The great majority of the raw lignite mined in the country is used directly, in power stations, while a small fraction of the lignite is used to make trans-formation products. The composition of raw lignite varies considerably more widely than does that of hard coal. Sulphur content is an important parameter. That parameter can differ greatly from mining district to mining district. Since sulphur content is of relevance to the net calorific value, it influences the net calorific value / carbon ratio. As a result, the data have to be evaluated on a mining-district-specific basis. When enough data are used, the mining-district-specific evaluation for lignite, like the evaluation for hard coal, shows a clear correlation between net calorific value and carbon content, as the following figures show.
Figure 7: Net calorific values & carbon content for raw lignite from the Lusatian (Lausitz) mining district
Source: Own figure, compiled from data of DEHSt (2015)
4
5
6
7
8
9
10
Net
cal
orifi
c va
lue
in M
J/kg
Carbon content in %
Raw Lignite, Lausitz

Climate Change CO2 emission factors for fossil fuels
19
Figure 8: Net calorific values & carbon content for raw lignite from the central German (Mit-teldeutschland) mining district
Source: Own figure, compiled from data of DEHSt (2015)
Figure 9: Net calorific values & carbon content for raw lignite from the Rhineland (Rheinland) min-ing district
Source: Own figure, compiled from data of DEHSt (2015)
8
9
10
11
12
Net c
alor
ific
valu
e in
MJ/
kg
Carbon content in %
Raw Lignite, Mitteldeutschland
7
8
9
10
11
Net c
alor
ific
valu
e in
MJ/
kg
Carbon content in %
Raw Lignite, Rheinland
Climate Change CO2 emission factors for fossil fuels
20
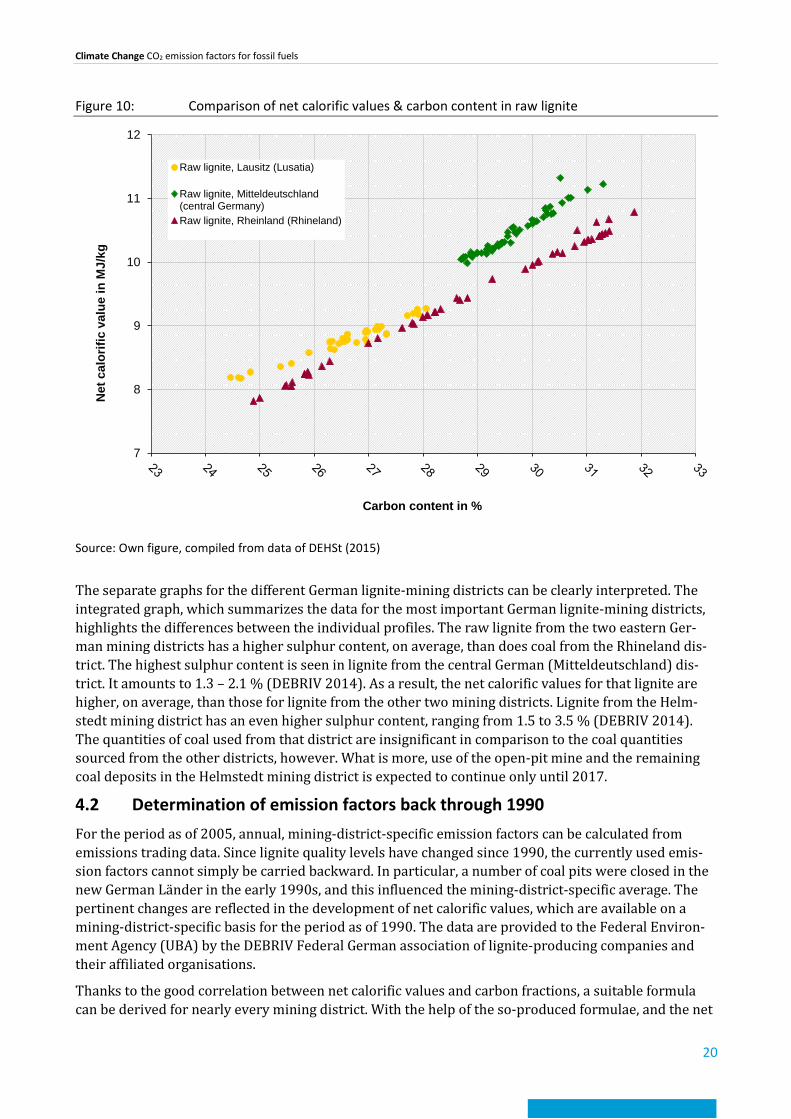
Figure 10: Comparison of net calorific values & carbon content in raw lignite
Source: Own figure, compiled from data of DEHSt (2015)
The separate graphs for the different German lignite-mining districts can be clearly interpreted. The integrated graph, which summarizes the data for the most important German lignite-mining districts, highlights the differences between the individual profiles. The raw lignite from the two eastern Ger-man mining districts has a higher sulphur content, on average, than does coal from the Rhineland dis-trict. The highest sulphur content is seen in lignite from the central German (Mitteldeutschland) dis-trict. It amounts to 1.3 – 2.1 % (DEBRIV 2014). As a result, the net calorific values for that lignite are higher, on average, than those for lignite from the other two mining districts. Lignite from the Helm-stedt mining district has an even higher sulphur content, ranging from 1.5 to 3.5 % (DEBRIV 2014). The quantities of coal used from that district are insignificant in comparison to the coal quantities sourced from the other districts, however. What is more, use of the open-pit mine and the remaining coal deposits in the Helmstedt mining district is expected to continue only until 2017.
4.2 Determination of emission factors back through 1990 For the period as of 2005, annual, mining-district-specific emission factors can be calculated from emissions trading data. Since lignite quality levels have changed since 1990, the currently used emis-sion factors cannot simply be carried backward. In particular, a number of coal pits were closed in the new German Länder in the early 1990s, and this influenced the mining-district-specific average. The pertinent changes are reflected in the development of net calorific values, which are available on a mining-district-specific basis for the period as of 1990. The data are provided to the Federal Environ-ment Agency (UBA) by the DEBRIV Federal German association of lignite-producing companies and their affiliated organisations.
Thanks to the good correlation between net calorific values and carbon fractions, a suitable formula can be derived for nearly every mining district. With the help of the so-produced formulae, and the net
7
8
9
10
11
12
Net
cal
orifi
c va
lue
in M
J/kg
Carbon content in %
Raw lignite, Lausitz (Lusatia)
Raw lignite, Mitteldeutschland(central Germany)Raw lignite, Rheinland (Rhineland)

Climate Change CO2 emission factors for fossil fuels
21
calorific values known for the relevant years, it was possible to calculate the pertinent carbon content data and, subsequently, the energy-related CO2 emission factors. This, in turn, made it possible to re-calculate the data back though 1990 and, thus, to produce a consistent time series. Certain uncertain-ties arise in that a number of small-scale mines were in operation in 1990 that produced coal with dif-ferent sulphur content levels. The pertinent data cannot now be generated after the fact, however. And enquiries submitted to local mining museums produced no new findings. In 1990, very little carbon analysis was carried out, because carbon had not yet become an important issue. Only a few individual analyses were carried out, and they are not necessarily representative. For example, for lignite from the state of Hesse, which was mined until 2003, only net-calorific-value data are available. For the rele-vant recalculations, a mean sulphur content was assumed. It lies between the content levels for lignite from the central German (Mitteldeutschland) and Rhineland mining districts. That coal plays an insig-nificant role in terms of quantity, however. The relevant emission factor changed sharply between 1991 and 1992, because two power stations in that mining district were decommissioned that had been temporarily fired with low-grade coal.
As a result, the energy-related CO2 emission factors for Rhineland raw lignite have decreased slightly since 1990. While a CO2 factor of 114.8 t CO2/TJ was calculated for 1990, the corresponding value given in the emissions trading sector for the year 2014 is 113.1 t CO2/TJ. In the intervening years, the emission factors fluctuated between 113.9 and 113.0 t CO2/TJ. For raw lignite from the central German mining district, the resulting factor for 1990 is 105.7 t CO2/TJ. In 2014, a value of 102.8 t CO2/TJ was reported. In the intervening years, the emission factors fluctuated between 104.0 and 102.8 t CO2/TJ. With regard to the Lusatian mining district, the emission factor calculated for 1990, 111.2 t CO2/TJ, happens to be identical with the value determined for 2014, from emissions trading data. Throughout the time series, the CO2 emission factors vary between 112.0 and 109.9 t CO2/TJ. The 1986 annual re-port of the former GDR's coal industry includes some analysis data for various open-pit mines in the Lusatian mining district. Those data are incomplete, however; only ash, water and sulphur content were measured. Fortunately, other sources (Mohry 1986) yielded supplementary data on levels of hy-drogen, nitrogen and oxygen, thereby making it possible to calculate carbon content. Boie's formula was used to check whether the result of the analysis-data calculation agrees with the measured net calorific value. The result indeed shows good agreement. In addition, the formula determined for raw lignite from the Lusatian mining district was used, in combination with the known net calorific value, to calculate a carbon-content level. That result also agrees well with the analysis results.
Due to the small number of measurements involved, and to the measurements' wide fluctuation, it was not possible to calculate a net calorific value / carbon ratio for raw lignite from the Helmstedt mining district. For this reason, an average was determined, from the emissions trading data for the period 2005 – 2013, and that value was carried backward through 1990. That value has been retained as a fixed value. It will not be recalculated each year, even though in future emissions trading data will cover an even larger number of years. In the final analysis, such recalculation would not yield any new findings for the year 1990. What is more, coal mining in the Helmstedt mining district is expected to be terminated in 2017. Consequently, only a small number of new values are now expected. The calcula-tions show that the CO2 emission factors have increased from 98.7 to 101.1 t CO2/TJ. Raw lignite from the Helmstedt mining district has the highest net calorific value – and, thus, the lowest energy-related CO2 emission factor.
For inputs of raw lignite in district heating stations, a weighted emission factor was calculated from lignite inputs for the public electricity supply. For the areas of industry and residential, institutional and commercial (small consumers), a weighted emission factor, reflecting the distribution of the vari-ous mining districts, was calculated from sales statistics of the DEBRIV Federal German association of lignite-producing companies and their affiliated organisations (Deutscher Braunkohlen Industrie Ver-ein). For inputs for the public electricity supply, emission factors of 110.8 – 111.7 t CO2/TJ result throughout the time series. Those values are considerably higher than the default value given in the

Climate Change CO2 emission factors for fossil fuels
22
2006 IPCC Guidelines, 101.0 t CO2/TJ. Therefore, the default value is probably not representative of the real situation. Use of the default value for the German inventory would underestimate CO2 emissions by about 15 million t CO2.
4.3 Lignite briquettes For the period as of 2005, the emission factors for lignite briquettes are determined on the basis of emissions trading data. From those data, year-specific and mining-district-specific averages were formed. Then, weighted averages were calculated from them, with the help of sales statistics (DE-BRIV). The emissions trading data cannot be used directly, since they do not completely cover the ar-eas covered by the report. The residential, institutional and commercial (small consumers) sectors do not participate in emissions trading. To ensure that the fuel grades involved are closely comparable, the analyses of ETS data were compared with our own analyses of briquettes from the residential sec-tor. The results show good agreement. The following figure provides an overview of the analysis re-sults.
Table 2: Analysis data for lignite briquettes
Analysis parameter Units "Rekord" brand bri-
quettes, Lusatian min-ing district
Briquettes, Rhineland district
Short analysis Water [mass fraction] 13.180 14.350 Ash content [mass fraction] 4.875 3.250 Volatiles [mass fraction] 45.990 43.190 Fixed carbon [mass fraction] 35.955 39.210 Total [mass fraction] 100.000 100.000 Gross calorific value [kJ/kg] 21,304.500 21,982.000 Net calorific value [kJ/kg] 20,124.000 20,811.000 CO2-emission factor [t CO2/TJ] 98.478 99.036 Elementary analysis Water [mass fraction] 13.180 14.350 Ash content [mass fraction] 4.875 3.250 Carbon content [mass fraction] 54.045 56.210 Hydrogen content [mass fraction] 3.905 3.850 Nitrogen content [mass fraction] 0.655 0.700 Oxygen content [mass fraction] 22.700 21.250 Total sulphur [mass fraction] 0.640 0.390 Total [mass fraction] 100.000 100.000 C/H ratio [kg C / kg H] 13.850 7.350 Total chlorine [mass fraction] 0.030 0.035
Source: TU Dresden 2014
While lignite briquettes are a standardised product, subject to specific quality criteria, they can still differ from mining district to mining district, depending on the carbon and sulphur content of the raw lignite they are made from. The pertinent recalculation back through the year 1990 proved to be con-siderably more complicated than the calculation for raw lignite. Only for Rhineland lignite briquettes was it possible to calculate an average CO2 emission factor, from the ETS data for 2005 – 2013, that can also be used for the years 1990 – 2004. At the beginning of the 1990s, a great many briquette factories
Climate Change CO2 emission factors for fossil fuels
23
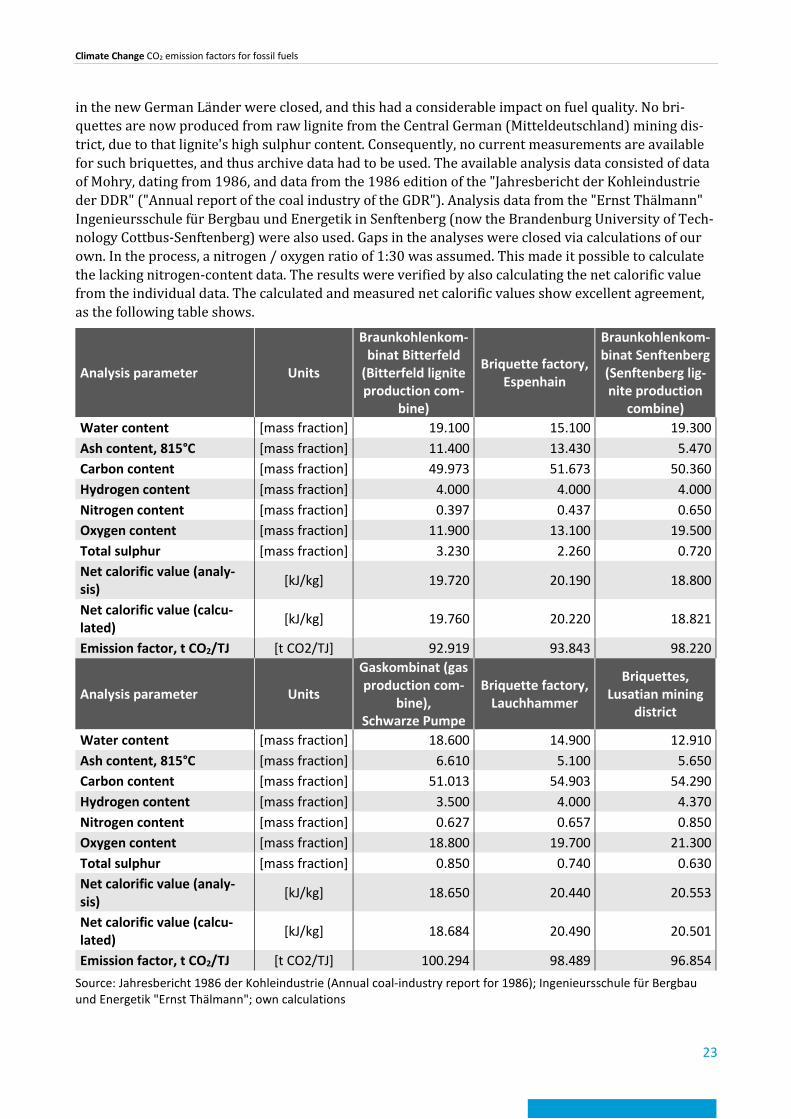
in the new German Länder were closed, and this had a considerable impact on fuel quality. No bri-quettes are now produced from raw lignite from the Central German (Mitteldeutschland) mining dis-trict, due to that lignite's high sulphur content. Consequently, no current measurements are available for such briquettes, and thus archive data had to be used. The available analysis data consisted of data of Mohry, dating from 1986, and data from the 1986 edition of the "Jahresbericht der Kohleindustrie der DDR" ("Annual report of the coal industry of the GDR"). Analysis data from the "Ernst Thälmann" Ingenieursschule für Bergbau und Energetik in Senftenberg (now the Brandenburg University of Tech-nology Cottbus-Senftenberg) were also used. Gaps in the analyses were closed via calculations of our own. In the process, a nitrogen / oxygen ratio of 1:30 was assumed. This made it possible to calculate the lacking nitrogen-content data. The results were verified by also calculating the net calorific value from the individual data. The calculated and measured net calorific values show excellent agreement, as the following table shows.
Analysis parameter Units
Braunkohlenkom-binat Bitterfeld
(Bitterfeld lignite production com-
bine)
Briquette factory, Espenhain
Braunkohlenkom-binat Senftenberg (Senftenberg lig-nite production
combine) Water content [mass fraction] 19.100 15.100 19.300 Ash content, 815°C [mass fraction] 11.400 13.430 5.470 Carbon content [mass fraction] 49.973 51.673 50.360 Hydrogen content [mass fraction] 4.000 4.000 4.000 Nitrogen content [mass fraction] 0.397 0.437 0.650 Oxygen content [mass fraction] 11.900 13.100 19.500 Total sulphur [mass fraction] 3.230 2.260 0.720 Net calorific value (analy-sis) [kJ/kg] 19.720 20.190 18.800
Net calorific value (calcu-lated) [kJ/kg] 19.760 20.220 18.821
Emission factor, t CO2/TJ [t CO2/TJ] 92.919 93.843 98.220
Analysis parameter Units
Gaskombinat (gas production com-
bine), Schwarze Pumpe
Briquette factory, Lauchhammer
Briquettes, Lusatian mining
district
Water content [mass fraction] 18.600 14.900 12.910 Ash content, 815°C [mass fraction] 6.610 5.100 5.650 Carbon content [mass fraction] 51.013 54.903 54.290 Hydrogen content [mass fraction] 3.500 4.000 4.370 Nitrogen content [mass fraction] 0.627 0.657 0.850 Oxygen content [mass fraction] 18.800 19.700 21.300 Total sulphur [mass fraction] 0.850 0.740 0.630 Net calorific value (analy-sis) [kJ/kg] 18.650 20.440 20.553
Net calorific value (calcu-lated) [kJ/kg] 18.684 20.490 20.501
Emission factor, t CO2/TJ [t CO2/TJ] 100.294 98.489 96.854 Source: Jahresbericht 1986 der Kohleindustrie (Annual coal-industry report for 1986); Ingenieursschule für Bergbau und Energetik "Ernst Thälmann"; own calculations
Climate Change CO2 emission factors for fossil fuels
24
It emerged that the previous assumption regarding the carbon content of briquettes from the Central German (Mitteldeutschland) district was much too high. As a result, the emission factor that had been used for 1990 was also too high. That value has now been downwardly corrected, by a suitable degree.
In calculation of the averages, it was ensured that the resulting emission factors agreed with the net calorific values published by DEBRIV. This made it possible to calculate an annual CO2 emission factor for each mining district. And from those factors, in turn, it was possible, with the help of the sales sta-tistics available from DEBRIV, to calculate annual, weighted CO2 emission factors. This produced a con-sistent time series for the period as of 1990.
The weighted CO2 emission factors for lignite briquettes in Germany range from 98.3 to 99.8 t CO2/TJ. The values are somewhat higher than the default value of 97.5 t CO2/TJ. Presumably, the briquette samples on which the default value was based had a higher sulphur content or lower water content. That relationship is suggested by the fuel data listed above. On average, lignite briquettes from the central German (Mitteldeutschland) district have lower energy-related CO2 emission factors.
4.4 Lignite dust and fluidised bed coal With regard to lignite dust and fluidised-bed coal, the data situation is considerably simpler, since all mining districts supply data to the emissions trading sector. On the other hand, it is not possible to de-rive a fixed net calorific value / carbon ratio from the available data. For this reason, for purposes of recalculation back through 1990, averages from 2005, and from 2008 – 2013, were used, depending on data quality. In an approach similar to that used for raw lignite and briquettes, a weighted CO2 emission factor was also calculated for lignite dust and fluidised-bed coal, with the help of sales statis-tics (DEBRIV). For the period as of 2005, the CO2 emission factors available from emissions trading were inserted directly into the calculations. Then, weighted factors were calculated in the usual man-ner, with the help of mining-district-specific sales statistics. The annual values range between 97.6 and 98.1 t CO2/TJ. They are thus close to the default value, 97.5 t CO2/TJ.
4.5 Lignite coke Lignite coke is currently produced in only one mining district. Hearth furnace coke is used primarily as a feedstock. Since the pertinent fuel quality fluctuates only very slightly, an average was formed from the ETS data for 2008 – 2013 and then used for the recalculations back through 1990. For the new German Länder, only one data source was available. That source consists of analyses carried out by the [former] "Ernst Thälmann" engineering school for mining and energy technology ("Ingenieursschule für Bergbau und Energetik 'Ernst Thälmann'"), located in Senftenberg. It seems plausible that the fuel from the new German Länder, in comparison to coke from the Rhineland district, had a considerably lower carbon content and considerably higher ash content and sulphur content. Logically enough, the emission factor calculated for the new German Länder is also lower. Unfortunately, the data do not in-dicate whether the coke involved was high-temperature lignite coke or low-temperature lignite coke. In the former GDR, both production processes were used.
The emission factor calculated for 2014, from emissions trading data, is 109.3 t CO2/TJ, which is close to the average calculated for 2005 – 2013, 109.6 t CO2/TJ. Over the years, the values of the factor fluc-tuate only slightly, between 109.3 and 109.8 t CO2/TJ. The 2006 IPCC Guidelines do not list a default value for lignite coke.
4.6 Meta-lignite For the period as of 2008, the CO2 emission factors for meta-lignite can be generated from ETS data. Only very small quantities of meta-lignite, imported from the Czech Republic, are now used in Ger-many. To make it possible to calculate the pertinent emission factors back through 1990, the applica-ble carbon / net-calorific-value ratio was determined from the available emissions trading data. It was
Climate Change CO2 emission factors for fossil fuels
25
then possible, with the help of the net calorific values known from lignite statistics (DEBRIV), to pro-duce a consistent time series.
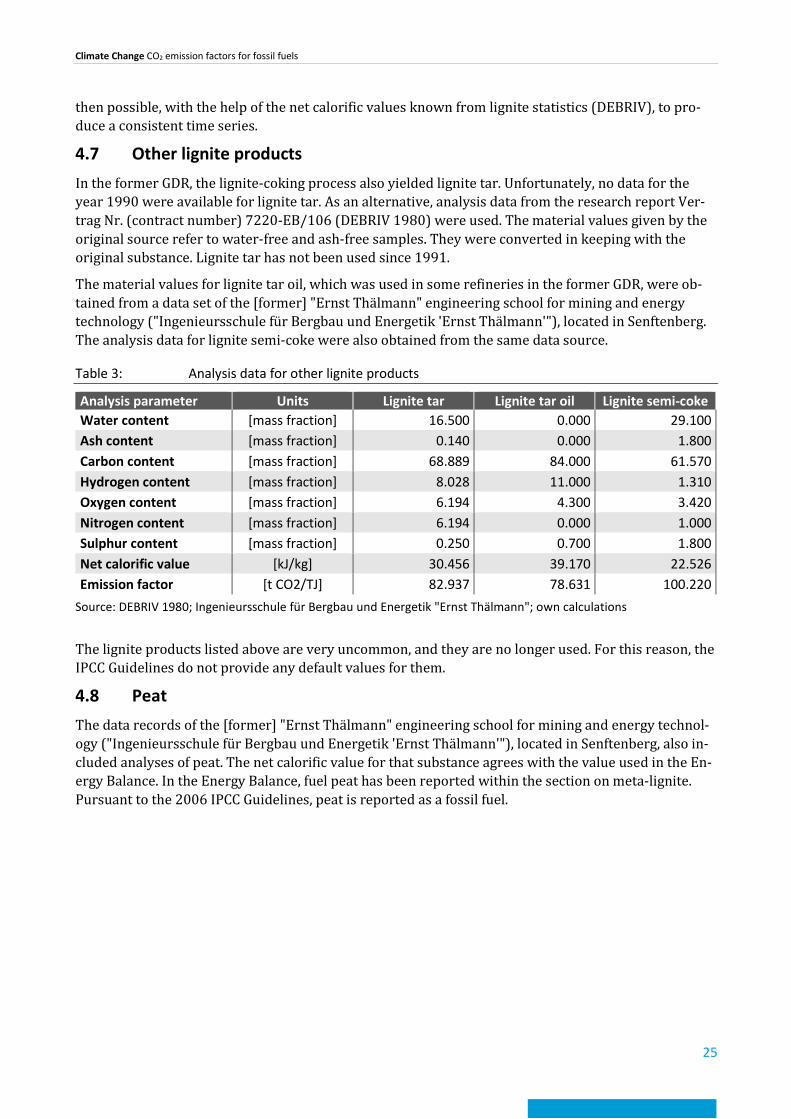
4.7 Other lignite products In the former GDR, the lignite-coking process also yielded lignite tar. Unfortunately, no data for the year 1990 were available for lignite tar. As an alternative, analysis data from the research report Ver-trag Nr. (contract number) 7220-EB/106 (DEBRIV 1980) were used. The material values given by the original source refer to water-free and ash-free samples. They were converted in keeping with the original substance. Lignite tar has not been used since 1991.
The material values for lignite tar oil, which was used in some refineries in the former GDR, were ob-tained from a data set of the [former] "Ernst Thälmann" engineering school for mining and energy technology ("Ingenieursschule für Bergbau und Energetik 'Ernst Thälmann'"), located in Senftenberg. The analysis data for lignite semi-coke were also obtained from the same data source.
Table 3: Analysis data for other lignite products
Analysis parameter Units Lignite tar Lignite tar oil Lignite semi-coke Water content [mass fraction] 16.500 0.000 29.100 Ash content [mass fraction] 0.140 0.000 1.800 Carbon content [mass fraction] 68.889 84.000 61.570 Hydrogen content [mass fraction] 8.028 11.000 1.310 Oxygen content [mass fraction] 6.194 4.300 3.420 Nitrogen content [mass fraction] 6.194 0.000 1.000 Sulphur content [mass fraction] 0.250 0.700 1.800 Net calorific value [kJ/kg] 30.456 39.170 22.526 Emission factor [t CO2/TJ] 82.937 78.631 100.220
Source: DEBRIV 1980; Ingenieursschule für Bergbau und Energetik "Ernst Thälmann"; own calculations
The lignite products listed above are very uncommon, and they are no longer used. For this reason, the IPCC Guidelines do not provide any default values for them.
4.8 Peat The data records of the [former] "Ernst Thälmann" engineering school for mining and energy technol-ogy ("Ingenieursschule für Bergbau und Energetik 'Ernst Thälmann'"), located in Senftenberg, also in-cluded analyses of peat. The net calorific value for that substance agrees with the value used in the En-ergy Balance. In the Energy Balance, fuel peat has been reported within the section on meta-lignite. Pursuant to the 2006 IPCC Guidelines, peat is reported as a fossil fuel.

Climate Change CO2 emission factors for fossil fuels
26
Table 4: Analysis data for peat
Analysis parameter Units Peat, fresh Peat, air-dried Water content [mass fraction] 85.000 25.000 Ash content [mass fraction] 0.900 4.500 Carbon content [mass fraction] 8.290 41.450 Hydrogen content [mass fraction] 0.800 4.020 Oxygen content [mass fraction] 4.710 23.550 Nitrogen content [mass fraction] 0.240 1.200 Sulphur content [mass fraction] 0.060 0.280 Net calorific value [kJ/kg] 0.986 14.930 Emission factor [t CO2/TJ] 308.133 101.797
Source: Ingenieursschule für Bergbau und Energetik "Ernst Thälmann"
Peat is no longer used in Germany as a fuel. The pertinent CO2 emission factor has been applied to the 1990 – 2007 time series. The default value given in the 2006 IPCC Guidelines, 106 t CO2/TJ, is higher than the national value. As the above table shows, the values can fluctuate widely, however – primarily as a function of the substance's water content. Since the net calorific values given in the Energy Bal-ance agree with the net calorific value resulting from the analysis, the CO2 factor may also be assumed to agree.

Climate Change CO2 emission factors for fossil fuels
27
5 Petroleum 5.1 Crude oil and naphtha In Germany, crude oil and naphtha are not used in combustion systems. Consequently, emissions trad-ing data do not include carbon-content figures for these raw materials. And no other sources provide analysis values. For this reason, we have used the default values given in the 2006 IPCC Guidelines. The factors are used solely for the Reference Approach and for obtaining the transformation balance for refineries. The possibility of determining national CO2 emission factors for crude oil was consid-ered, in various ways. While refinery operators regularly test crude-oil mixtures for quality, carbon content is not among the parameters they test for. As a result, additional analyses would have to be carried out. In a range of discussions with the Association of the German Petroleum Industry (Miner-alölwirtschaftsverband), it emerged that it would be impossible to obtain the number of samples needed to determine a representative average for a year. Many different types of crude oil are used in Germany. They are pumped through pipelines as mixtures. Different petroleum types are mixed in keeping with applicable prices and quality requirements. The number of different types of crude oil processed in the country's refineries has increased considerably in recent years. And mixtures' frac-tions of the different types differ widely from year to year. This additionally complicates the task of producing and analyzing time series.
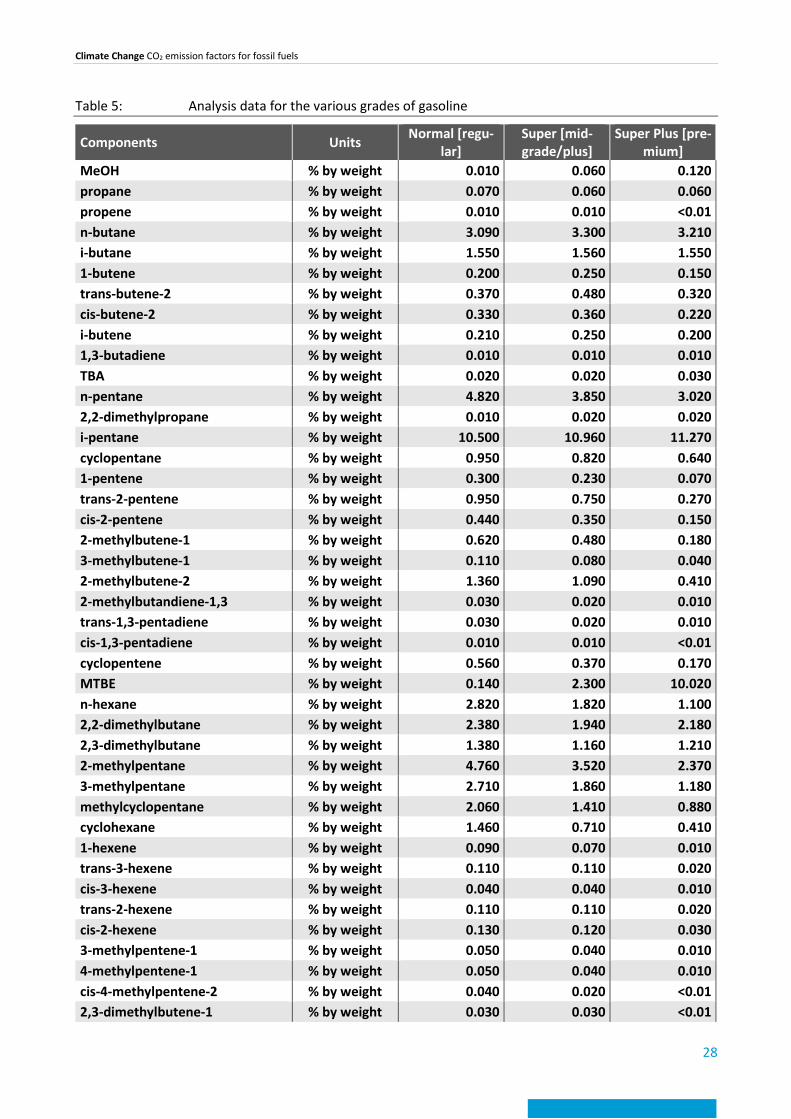
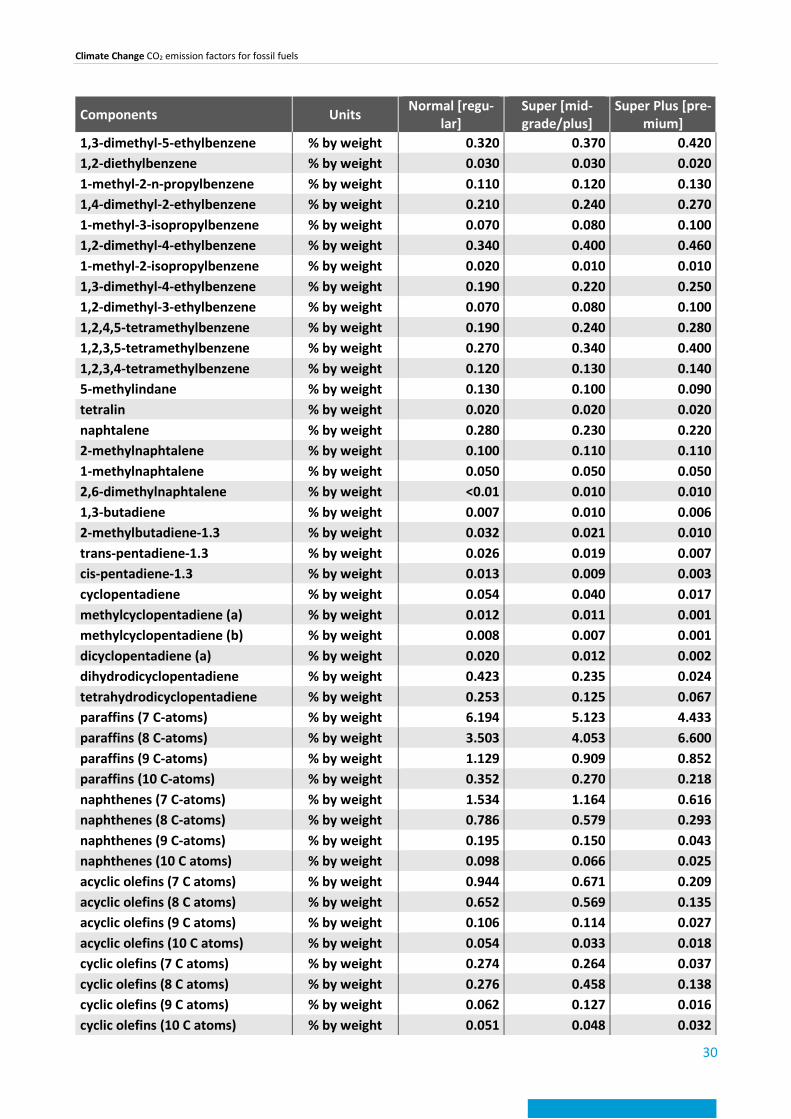
5.2 Gasolines For calculation of the CO2 emission factors for gasolines, an extensive evaluation was carried out of re-search report 502-1 of the German Society for Petroleum and Coal Science and Technology (DGMK), "Composition of gasolines from German refineries" ("Zusammensetzung von Ottokraftstoffen aus deutschen Raffinerien" (DGMK 2002)). As part of that study, samples from a total of 14 German refin-eries were analyzed. "…In the gasoline grades Normal [regular], Super [mid-grade/plus] and Super Plus [premium], the [carbon] content was determined, in the form of individual values, for hydrocar-bons with three to six carbon atoms in their molecules, for selected aromatics with up to 12 carbon at-oms and for some oxygen-containing compounds. …at the same time, in complementation of these measurements, and in keeping with draft DIN EN 14517 (PIONA), the sum totals of paraffins, naph-thenes, cyclic and acyclic olefins and aromatics were determined, in each case for all components with the same carbon number. In contrast to the approach used for the individual measurements, these measurements also covered, in addition to nonaromatic hydrocarbons with three to six carbon atoms, nonaromatic hydrocarbons with up to ten carbon atoms…." [DGMK research report 502-1 p. 7]
The carbon content was calculated using the averages of the individual measurements on hydrocar-bons with three to six carbon atoms and aromatics with up to 12 carbon atoms, for the fuel grades Normal [regular], Super [mid-grade/plus] and Super Plus [premium]. The relevant values are listed in tables 1-4 of DGMK research report 502-1. Of the polycyclic aromatic hydrocarbons, only the sub-stances fluorene, phenanthrene and anthracene were covered, because all other PAHs were present in such low concentrations that they would have no impact on the total-carbon-content calculation. Even the three PAHs mentioned, which had the highest concentrations of all the PAHs present, had virtually no impact on the calculation result. The individual measurements were supplemented with the "PIONA" measurements for hydrocarbons with more than 7 carbon atoms. This approach yielded a to-tal coverage level of 99 – 100%, depending on the fuel grade concerned. The following table provides a complete overview of the analysis results.
Climate Change CO2 emission factors for fossil fuels
28
Table 5: Analysis data for the various grades of gasoline
Components Units Normal [regu-lar]
Super [mid-grade/plus]
Super Plus [pre-mium]
MeOH % by weight 0.010 0.060 0.120 propane % by weight 0.070 0.060 0.060 propene % by weight 0.010 0.010 <0.01 n-butane % by weight 3.090 3.300 3.210 i-butane % by weight 1.550 1.560 1.550 1-butene % by weight 0.200 0.250 0.150 trans-butene-2 % by weight 0.370 0.480 0.320 cis-butene-2 % by weight 0.330 0.360 0.220 i-butene % by weight 0.210 0.250 0.200 1,3-butadiene % by weight 0.010 0.010 0.010 TBA % by weight 0.020 0.020 0.030 n-pentane % by weight 4.820 3.850 3.020 2,2-dimethylpropane % by weight 0.010 0.020 0.020 i-pentane % by weight 10.500 10.960 11.270 cyclopentane % by weight 0.950 0.820 0.640 1-pentene % by weight 0.300 0.230 0.070 trans-2-pentene % by weight 0.950 0.750 0.270 cis-2-pentene % by weight 0.440 0.350 0.150 2-methylbutene-1 % by weight 0.620 0.480 0.180 3-methylbutene-1 % by weight 0.110 0.080 0.040 2-methylbutene-2 % by weight 1.360 1.090 0.410 2-methylbutandiene-1,3 % by weight 0.030 0.020 0.010 trans-1,3-pentadiene % by weight 0.030 0.020 0.010 cis-1,3-pentadiene % by weight 0.010 0.010 <0.01 cyclopentene % by weight 0.560 0.370 0.170 MTBE % by weight 0.140 2.300 10.020 n-hexane % by weight 2.820 1.820 1.100 2,2-dimethylbutane % by weight 2.380 1.940 2.180 2,3-dimethylbutane % by weight 1.380 1.160 1.210 2-methylpentane % by weight 4.760 3.520 2.370 3-methylpentane % by weight 2.710 1.860 1.180 methylcyclopentane % by weight 2.060 1.410 0.880 cyclohexane % by weight 1.460 0.710 0.410 1-hexene % by weight 0.090 0.070 0.010 trans-3-hexene % by weight 0.110 0.110 0.020 cis-3-hexene % by weight 0.040 0.040 0.010 trans-2-hexene % by weight 0.110 0.110 0.020 cis-2-hexene % by weight 0.130 0.120 0.030 3-methylpentene-1 % by weight 0.050 0.040 0.010 4-methylpentene-1 % by weight 0.050 0.040 0.010 cis-4-methylpentene-2 % by weight 0.040 0.020 <0.01 2,3-dimethylbutene-1 % by weight 0.030 0.030 <0.01

Climate Change CO2 emission factors for fossil fuels
29
Components Units Normal [regu-lar]
Super [mid-grade/plus]
Super Plus [pre-mium]
trans-4-methylpentene-2 % by weight 0.020 0.030 0.010 2-methylpentene-1 % by weight 0.170 0.150 0.050 2-ethylbutene-1 % by weight 0.020 0.020 <0.01 2-methylpentene-2 % by weight 0.280 0.250 0.060 cis-3-methylpentene-2 % by weight 0.150 0.130 0.040 trans-3-methylpentene-2 % by weight 0.250 0.200 0.060 2,3-dimethylbutene-2 % by weight 0.070 0.050 0.010 3-methylcyclopentene % by weight 0.070 0.090 0.020 4-methylcyclopentene % by weight 0.030 0.020 0.010 cyclohexene % by weight 0.040 0.040 0.010 1-methylcyclopentene % by weight 0.270 0.240 0.070 benzene % by weight 0.880 0.860 0.660 toluene % by weight 10.820 11.960 12.520 ethylbenzene % by weight 2.230 2.790 2.330 m-xylene % by weight 4.200 5.400 5.120 p-xylene % by weight 1.820 2.330 2.270 o-xylene % by weight 2.320 3.020 3.030 styrene % by weight 0.040 0.060 0.010 i-propylbenzene % by weight 0.210 0.320 0.290 n-propylbenzene % by weight 0.680 0.880 1.030 3-phenylpropene-1 % by weight <0.01 0.010 <0.01 3-ethyltoluene % by weight 1.930 2.490 2.800 4-ethyltoluene % by weight 0.850 1.130 1.280 1,3,5-trimethylbenzene % by weight 0.830 1.130 1.270 alpha-methylstyrene % by weight 0.010 0.010 <0.01 2-ethyltoluene % by weight 0.710 0.900 1.040 cis-propylbenzene % by weight 0.010 0.010 <0.01 m-methylstyrene % by weight 0.020 0.010 0.010 o-methylstyrene % by weight 0.010 0.010 <0.01 1,2,4-trimethylbenzene % by weight 2.770 3.730 4.340 p-methylstyrene % by weight 0.010 0.010 <0.01 trans-propenylbenzene % by weight 0.040 0.020 0.010 1,2,3-trimethylbenzene % by weight 0.610 0.790 0.930 indane (benzocyclopentane) % by weight 0.590 0.470 0.410 indene (benzocyclopentadiene) % by weight 0.100 0.060 0.030 tert-butylbenzene % by weight 0.010 <0.01 <0.01 i-butylbenzene % by weight 0.040 0.040 0.050 sec-butylbenzene % by weight 0.040 0.040 0.050 n-butylbenzene % by weight 0.080 0.080 0.090 1-methyl-4-isopropylbenzene % by weight 0.020 0.030 0.080 1,3-diethylbenzene % by weight 0.140 0.140 0.160 1-methyl-3-n-propylbenzene % by weight 0.300 0.340 0.380 1,4-diethylbenzene % by weight 0.060 0.060 0.060 1-methyl-4-n-propylbenzene % by weight 0.120 0.130 0.150
Climate Change CO2 emission factors for fossil fuels
30
Components Units Normal [regu-lar]
Super [mid-grade/plus]
Super Plus [pre-mium]
1,3-dimethyl-5-ethylbenzene % by weight 0.320 0.370 0.420 1,2-diethylbenzene % by weight 0.030 0.030 0.020 1-methyl-2-n-propylbenzene % by weight 0.110 0.120 0.130 1,4-dimethyl-2-ethylbenzene % by weight 0.210 0.240 0.270 1-methyl-3-isopropylbenzene % by weight 0.070 0.080 0.100 1,2-dimethyl-4-ethylbenzene % by weight 0.340 0.400 0.460 1-methyl-2-isopropylbenzene % by weight 0.020 0.010 0.010 1,3-dimethyl-4-ethylbenzene % by weight 0.190 0.220 0.250 1,2-dimethyl-3-ethylbenzene % by weight 0.070 0.080 0.100 1,2,4,5-tetramethylbenzene % by weight 0.190 0.240 0.280 1,2,3,5-tetramethylbenzene % by weight 0.270 0.340 0.400 1,2,3,4-tetramethylbenzene % by weight 0.120 0.130 0.140 5-methylindane % by weight 0.130 0.100 0.090 tetralin % by weight 0.020 0.020 0.020 naphtalene % by weight 0.280 0.230 0.220 2-methylnaphtalene % by weight 0.100 0.110 0.110 1-methylnaphtalene % by weight 0.050 0.050 0.050 2,6-dimethylnaphtalene % by weight <0.01 0.010 0.010 1,3-butadiene % by weight 0.007 0.010 0.006 2-methylbutadiene-1.3 % by weight 0.032 0.021 0.010 trans-pentadiene-1.3 % by weight 0.026 0.019 0.007 cis-pentadiene-1.3 % by weight 0.013 0.009 0.003 cyclopentadiene % by weight 0.054 0.040 0.017 methylcyclopentadiene (a) % by weight 0.012 0.011 0.001 methylcyclopentadiene (b) % by weight 0.008 0.007 0.001 dicyclopentadiene (a) % by weight 0.020 0.012 0.002 dihydrodicyclopentadiene % by weight 0.423 0.235 0.024 tetrahydrodicyclopentadiene % by weight 0.253 0.125 0.067 paraffins (7 C-atoms) % by weight 6.194 5.123 4.433 paraffins (8 C-atoms) % by weight 3.503 4.053 6.600 paraffins (9 C-atoms) % by weight 1.129 0.909 0.852 paraffins (10 C-atoms) % by weight 0.352 0.270 0.218 naphthenes (7 C-atoms) % by weight 1.534 1.164 0.616 naphthenes (8 C-atoms) % by weight 0.786 0.579 0.293 naphthenes (9 C-atoms) % by weight 0.195 0.150 0.043 naphthenes (10 C atoms) % by weight 0.098 0.066 0.025 acyclic olefins (7 C atoms) % by weight 0.944 0.671 0.209 acyclic olefins (8 C atoms) % by weight 0.652 0.569 0.135 acyclic olefins (9 C atoms) % by weight 0.106 0.114 0.027 acyclic olefins (10 C atoms) % by weight 0.054 0.033 0.018 cyclic olefins (7 C atoms) % by weight 0.274 0.264 0.037 cyclic olefins (8 C atoms) % by weight 0.276 0.458 0.138 cyclic olefins (9 C atoms) % by weight 0.062 0.127 0.016 cyclic olefins (10 C atoms) % by weight 0.051 0.048 0.032
Climate Change CO2 emission factors for fossil fuels
31
Components Units Normal [regu-lar]
Super [mid-grade/plus]
Super Plus [pre-mium]
paraffins (> 10 C-atoms) % by weight 0.667 0.667 0.649 fluorene % by weight 0.001 0.002 0.002 phenanthrene % by weight 0.002 0.003 0.003 anthracene % by weight 0.001 0.001 0.002 sulphur % by weight 0.002 0.002 0.001 Total % by weight 99.024 99.720 99.996 Emission factor t CO2/t 3.183 3.185 3.141
Source: DGMK 2002
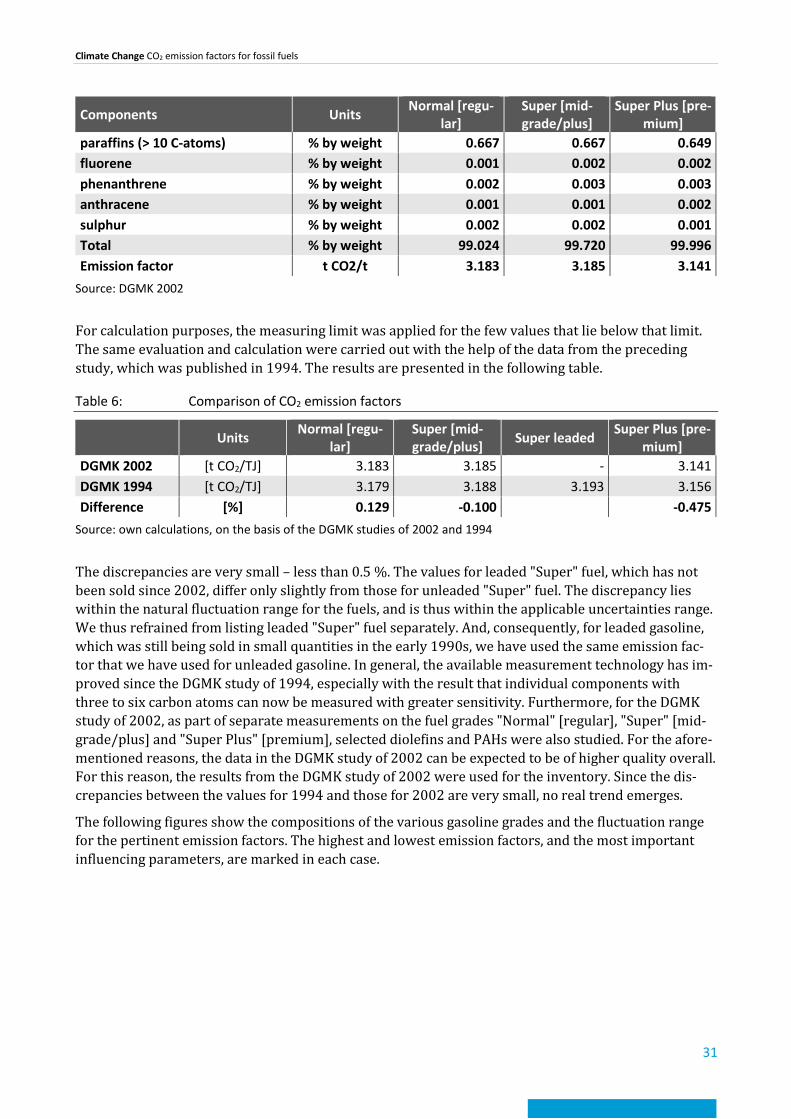
For calculation purposes, the measuring limit was applied for the few values that lie below that limit. The same evaluation and calculation were carried out with the help of the data from the preceding study, which was published in 1994. The results are presented in the following table.
Table 6: Comparison of CO2 emission factors
Units Normal [regu-lar]
Super [mid-grade/plus] Super leaded Super Plus [pre-
mium] DGMK 2002 [t CO2/TJ] 3.183 3.185 - 3.141 DGMK 1994 [t CO2/TJ] 3.179 3.188 3.193 3.156 Difference [%] 0.129 -0.100 -0.475
Source: own calculations, on the basis of the DGMK studies of 2002 and 1994
The discrepancies are very small – less than 0.5 %. The values for leaded "Super" fuel, which has not been sold since 2002, differ only slightly from those for unleaded "Super" fuel. The discrepancy lies within the natural fluctuation range for the fuels, and is thus within the applicable uncertainties range. We thus refrained from listing leaded "Super" fuel separately. And, consequently, for leaded gasoline, which was still being sold in small quantities in the early 1990s, we have used the same emission fac-tor that we have used for unleaded gasoline. In general, the available measurement technology has im-proved since the DGMK study of 1994, especially with the result that individual components with three to six carbon atoms can now be measured with greater sensitivity. Furthermore, for the DGMK study of 2002, as part of separate measurements on the fuel grades "Normal" [regular], "Super" [mid-grade/plus] and "Super Plus" [premium], selected diolefins and PAHs were also studied. For the afore-mentioned reasons, the data in the DGMK study of 2002 can be expected to be of higher quality overall. For this reason, the results from the DGMK study of 2002 were used for the inventory. Since the dis-crepancies between the values for 1994 and those for 2002 are very small, no real trend emerges.
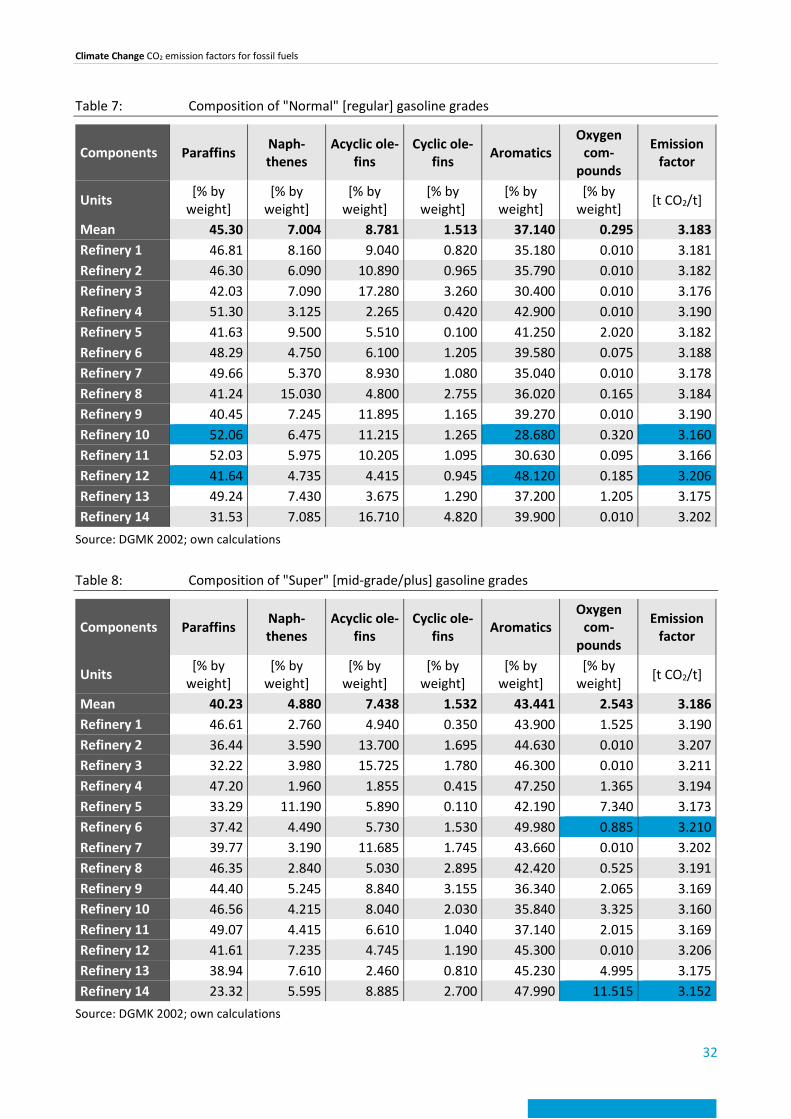
The following figures show the compositions of the various gasoline grades and the fluctuation range for the pertinent emission factors. The highest and lowest emission factors, and the most important influencing parameters, are marked in each case.
Climate Change CO2 emission factors for fossil fuels
32
Table 7: Composition of "Normal" [regular] gasoline grades
Components Paraffins Naph-thenes
Acyclic ole-fins
Cyclic ole-fins Aromatics
Oxygen com-
pounds
Emission factor
Units [% by weight]
[% by weight]
[% by weight]
[% by weight]
[% by weight]
[% by weight] [t CO2/t]
Mean 45.30 7.004 8.781 1.513 37.140 0.295 3.183 Refinery 1 46.81 8.160 9.040 0.820 35.180 0.010 3.181 Refinery 2 46.30 6.090 10.890 0.965 35.790 0.010 3.182 Refinery 3 42.03 7.090 17.280 3.260 30.400 0.010 3.176 Refinery 4 51.30 3.125 2.265 0.420 42.900 0.010 3.190 Refinery 5 41.63 9.500 5.510 0.100 41.250 2.020 3.182 Refinery 6 48.29 4.750 6.100 1.205 39.580 0.075 3.188 Refinery 7 49.66 5.370 8.930 1.080 35.040 0.010 3.178 Refinery 8 41.24 15.030 4.800 2.755 36.020 0.165 3.184 Refinery 9 40.45 7.245 11.895 1.165 39.270 0.010 3.190 Refinery 10 52.06 6.475 11.215 1.265 28.680 0.320 3.160 Refinery 11 52.03 5.975 10.205 1.095 30.630 0.095 3.166 Refinery 12 41.64 4.735 4.415 0.945 48.120 0.185 3.206 Refinery 13 49.24 7.430 3.675 1.290 37.200 1.205 3.175 Refinery 14 31.53 7.085 16.710 4.820 39.900 0.010 3.202
Source: DGMK 2002; own calculations
Table 8: Composition of "Super" [mid-grade/plus] gasoline grades
Components Paraffins Naph-thenes
Acyclic ole-fins
Cyclic ole-fins Aromatics
Oxygen com-
pounds
Emission factor
Units [% by weight]
[% by weight]
[% by weight]
[% by weight]
[% by weight]
[% by weight] [t CO2/t]
Mean 40.23 4.880 7.438 1.532 43.441 2.543 3.186 Refinery 1 46.61 2.760 4.940 0.350 43.900 1.525 3.190 Refinery 2 36.44 3.590 13.700 1.695 44.630 0.010 3.207 Refinery 3 32.22 3.980 15.725 1.780 46.300 0.010 3.211 Refinery 4 47.20 1.960 1.855 0.415 47.250 1.365 3.194 Refinery 5 33.29 11.190 5.890 0.110 42.190 7.340 3.173 Refinery 6 37.42 4.490 5.730 1.530 49.980 0.885 3.210 Refinery 7 39.77 3.190 11.685 1.745 43.660 0.010 3.202 Refinery 8 46.35 2.840 5.030 2.895 42.420 0.525 3.191 Refinery 9 44.40 5.245 8.840 3.155 36.340 2.065 3.169 Refinery 10 46.56 4.215 8.040 2.030 35.840 3.325 3.160 Refinery 11 49.07 4.415 6.610 1.040 37.140 2.015 3.169 Refinery 12 41.61 7.235 4.745 1.190 45.300 0.010 3.206 Refinery 13 38.94 7.610 2.460 0.810 45.230 4.995 3.175 Refinery 14 23.32 5.595 8.885 2.700 47.990 11.515 3.152
Source: DGMK 2002; own calculations
Climate Change CO2 emission factors for fossil fuels
33
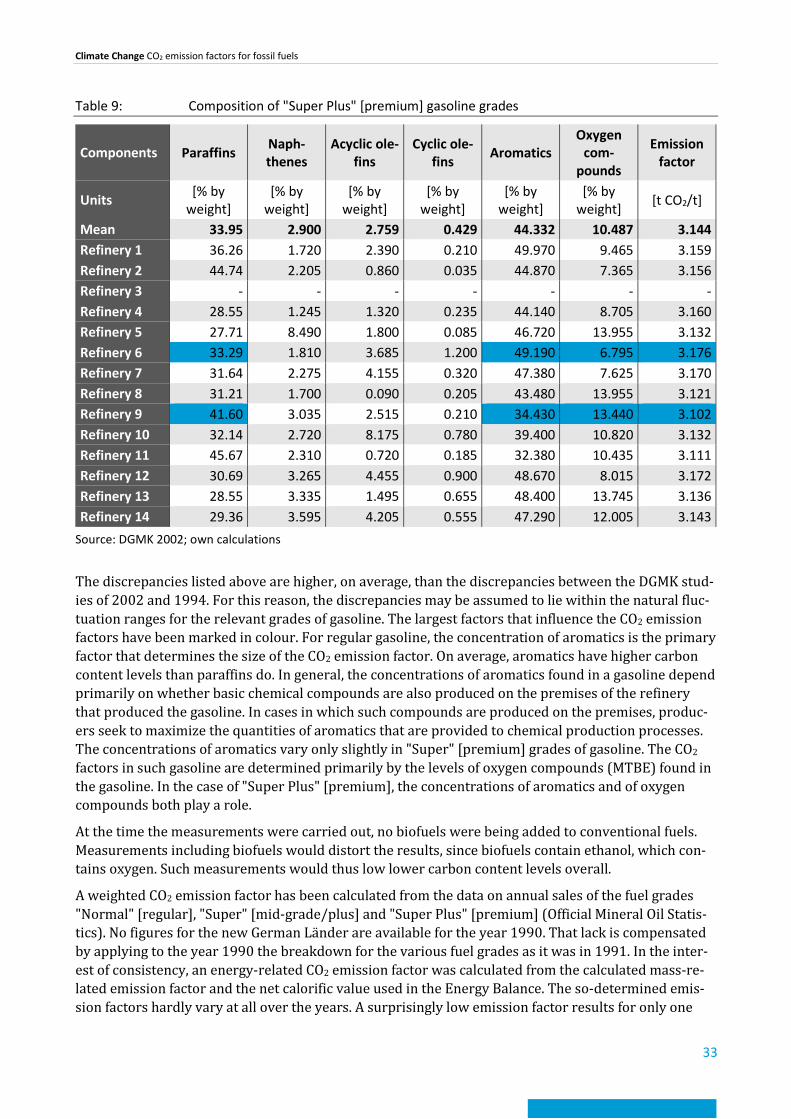
Table 9: Composition of "Super Plus" [premium] gasoline grades
Components Paraffins Naph-thenes
Acyclic ole-fins
Cyclic ole-fins Aromatics
Oxygen com-
pounds
Emission factor
Units [% by weight]
[% by weight]
[% by weight]
[% by weight]
[% by weight]
[% by weight] [t CO2/t]
Mean 33.95 2.900 2.759 0.429 44.332 10.487 3.144 Refinery 1 36.26 1.720 2.390 0.210 49.970 9.465 3.159 Refinery 2 44.74 2.205 0.860 0.035 44.870 7.365 3.156 Refinery 3 - - - - - - - Refinery 4 28.55 1.245 1.320 0.235 44.140 8.705 3.160 Refinery 5 27.71 8.490 1.800 0.085 46.720 13.955 3.132 Refinery 6 33.29 1.810 3.685 1.200 49.190 6.795 3.176 Refinery 7 31.64 2.275 4.155 0.320 47.380 7.625 3.170 Refinery 8 31.21 1.700 0.090 0.205 43.480 13.955 3.121 Refinery 9 41.60 3.035 2.515 0.210 34.430 13.440 3.102 Refinery 10 32.14 2.720 8.175 0.780 39.400 10.820 3.132 Refinery 11 45.67 2.310 0.720 0.185 32.380 10.435 3.111 Refinery 12 30.69 3.265 4.455 0.900 48.670 8.015 3.172 Refinery 13 28.55 3.335 1.495 0.655 48.400 13.745 3.136 Refinery 14 29.36 3.595 4.205 0.555 47.290 12.005 3.143
Source: DGMK 2002; own calculations
The discrepancies listed above are higher, on average, than the discrepancies between the DGMK stud-ies of 2002 and 1994. For this reason, the discrepancies may be assumed to lie within the natural fluc-tuation ranges for the relevant grades of gasoline. The largest factors that influence the CO2 emission factors have been marked in colour. For regular gasoline, the concentration of aromatics is the primary factor that determines the size of the CO2 emission factor. On average, aromatics have higher carbon content levels than paraffins do. In general, the concentrations of aromatics found in a gasoline depend primarily on whether basic chemical compounds are also produced on the premises of the refinery that produced the gasoline. In cases in which such compounds are produced on the premises, produc-ers seek to maximize the quantities of aromatics that are provided to chemical production processes. The concentrations of aromatics vary only slightly in "Super" [premium] grades of gasoline. The CO2 factors in such gasoline are determined primarily by the levels of oxygen compounds (MTBE) found in the gasoline. In the case of "Super Plus" [premium], the concentrations of aromatics and of oxygen compounds both play a role.
At the time the measurements were carried out, no biofuels were being added to conventional fuels. Measurements including biofuels would distort the results, since biofuels contain ethanol, which con-tains oxygen. Such measurements would thus low lower carbon content levels overall.
A weighted CO2 emission factor has been calculated from the data on annual sales of the fuel grades "Normal" [regular], "Super" [mid-grade/plus] and "Super Plus" [premium] (Official Mineral Oil Statis-tics). No figures for the new German Länder are available for the year 1990. That lack is compensated by applying to the year 1990 the breakdown for the various fuel grades as it was in 1991. In the inter-est of consistency, an energy-related CO2 emission factor was calculated from the calculated mass-re-lated emission factor and the net calorific value used in the Energy Balance. The so-determined emis-sion factors hardly vary at all over the years. A surprisingly low emission factor results for only one
Climate Change CO2 emission factors for fossil fuels
34
year – 2011. Following the introduction of the fuel "E10" (which included a biofuel fraction of up to 10% in "Super" [mid-grade/plus]), considerably more "Super Plus" [premium] was purchased.
The energy-related emission factor remained constant over the years, at about 73.1 t CO2/TJ. The de-fault value of 69.3 t CO2/TJ given in the 2006 IPCC Guidelines is too low. Use of the default value in the German inventory would yield a result that would be too low by about 3 million t CO2.
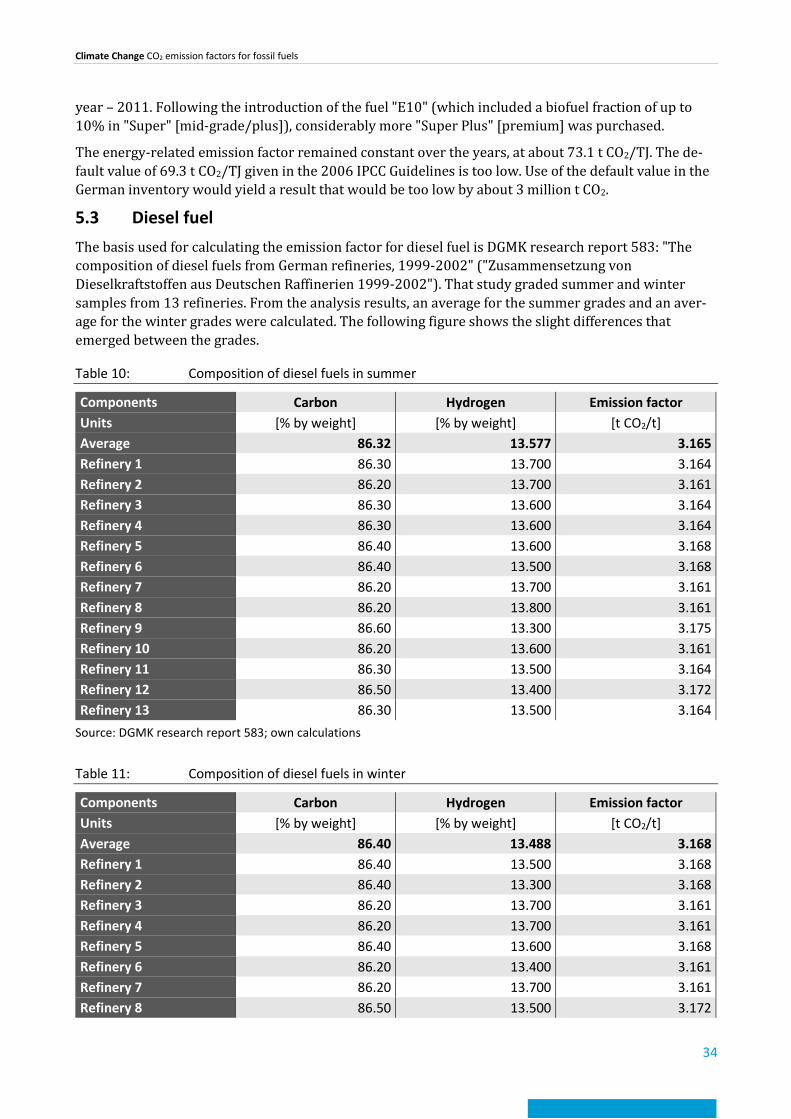
5.3 Diesel fuel The basis used for calculating the emission factor for diesel fuel is DGMK research report 583: "The composition of diesel fuels from German refineries, 1999-2002" ("Zusammensetzung von Dieselkraftstoffen aus Deutschen Raffinerien 1999-2002"). That study graded summer and winter samples from 13 refineries. From the analysis results, an average for the summer grades and an aver-age for the winter grades were calculated. The following figure shows the slight differences that emerged between the grades.
Table 10: Composition of diesel fuels in summer
Components Carbon Hydrogen Emission factor Units [% by weight] [% by weight] [t CO2/t] Average 86.32 13.577 3.165 Refinery 1 86.30 13.700 3.164 Refinery 2 86.20 13.700 3.161 Refinery 3 86.30 13.600 3.164 Refinery 4 86.30 13.600 3.164 Refinery 5 86.40 13.600 3.168 Refinery 6 86.40 13.500 3.168 Refinery 7 86.20 13.700 3.161 Refinery 8 86.20 13.800 3.161 Refinery 9 86.60 13.300 3.175 Refinery 10 86.20 13.600 3.161 Refinery 11 86.30 13.500 3.164 Refinery 12 86.50 13.400 3.172 Refinery 13 86.30 13.500 3.164
Source: DGMK research report 583; own calculations
Table 11: Composition of diesel fuels in winter
Components Carbon Hydrogen Emission factor Units [% by weight] [% by weight] [t CO2/t] Average 86.40 13.488 3.168 Refinery 1 86.40 13.500 3.168 Refinery 2 86.40 13.300 3.168 Refinery 3 86.20 13.700 3.161 Refinery 4 86.20 13.700 3.161 Refinery 5 86.40 13.600 3.168 Refinery 6 86.20 13.400 3.161 Refinery 7 86.20 13.700 3.161 Refinery 8 86.50 13.500 3.172

Climate Change CO2 emission factors for fossil fuels
35
Components Carbon Hydrogen Emission factor Refinery 9 86.30 13.600 3.164 Refinery 10 86.40 13.400 3.168 Refinery 11 86.50 13.500 3.172 Refinery 12 86.70 13.200 3.179 Refinery 13 86.30 13.500 3.164 Refinery 14 86.60 13.500 3.175 Refinery 15 86.70 13.400 3.179 Refinery 16 86.40 13.300 3.168
Source: DGMK research report 583; own calculations
The values fluctuate throughout a very narrow range overall. On the one hand, the grades of fuel pro-duced by the various different refineries differ only very slightly. On the other, the differences between summer and winter grades of diesel fuel are also slight. Nonetheless, it is possible to calculate a weighted emission factor, from these data, that takes account of both summer and winter grades of fuel. In Germany, the availability of "winter diesel" is governed by law. Petrol stations are legally re-quired to sell "winter diesel" from 15 November to 28 February. In addition, a conversion phase has to be taken into account, with the result that the usage period for "winter diesel" amounts to about 4 months. Accordingly, diesel vehicles run with "summer diesel" for a total of 8 months of the year. Ap-plying this distribution, a weighted emission factor was calculated from the analysis results relative to "summer diesel" and "winter diesel." While the study did take account of calorific values, such values were available for only a few samples. And those samples cannot be unambiguously allocated to the various elementary analyses. It was possible to calculate net calorific values from the analysis data, however. The results show excellent agreement with the measured net calorific values. In addition, the values agree well with the net calorific values given in the Energy Balance. The calculation yields an energy-related CO2 emission factor of about 74.0 t CO2/TJ. That value agrees very well with the default value given in the 2006 IPCC Guidelines, 74.1 t CO2/TJ.
5.4 Refinery gas For refinery gas, a mass-related CO2 emission factor was calculated from emissions trading data. Since the annual fluctuations are slight, a factor was used that remains constant for all of the years con-cerned. It was synthesised from the averages for the year 2005 – 2013. While the net calorific values given in the emissions trading sector exhibit only slight annual fluctuations, the net calorific values used in the Energy Balance do vary – considerably, in part. They differ from the emissions trading data. The default net calorific value given for energy statistics, at 42.4 MJ/kg of refinery gas, is considerably lower than the average calculated from emissions trading data, 47.6 MJ/kg. A plausible explanation for the annual fluctuations, and for the discrepancy with the emissions trading data, is that energy statis-tics reflect the fact that the numbers of operators using the low default net calorific value vary from year to year. In the interest of consistency, and in order to prevent underestimation of the CO2 emis-sions, the inventory is prepared using the net calorific values used in the Energy Balance. The emission factor is then suitably adjusted. As a result, the energy-related emission factor fluctuates considerably, from 54.6 to 65.4 t CO2/TJ. The default emission factor given by the 2006 IPCC Guidelines is 57.6 t CO2/TJ, although the Guidelines give a high net calorific value of 49.5 MJ/kg that would normally be expected to lead to a lower default emission factor. Overall, the national emission factors are within the 95 % confidence interval for the default values.
Climate Change CO2 emission factors for fossil fuels
36
5.5 LP gas To make it possible to calculate CO2 emission factors for LP gas, first the carbon content levels of bu-tane and propane were calculated, via molar weights. The applicable fractions for the two components are published in the annual reports of the German Liquid Petroleum Gas Association (Deutscher Ver-band Flüssiggas). That association also provided the data for the period back through 1990. Weighted, mass-related emission factors are calculated annually from the applicable fractions for the two compo-nents. Those factors are then divided by the pertinent net calorific values used in the Energy Balance. The mass-related emission factors hardly vary at all over the years. The net calorific values given in the Energy Balance fluctuate more widely from year to year. Here again, the calorific-value fluctua-tions seen in energy statistics can be plausibly attributed to inconsistencies in use of the default calo-rific values given in the statistics. Identical net calorific values are used for propane and butane in each case. Via the calculation method chosen, these fluctuations in net calorific values are transferred to the energy-related CO2 emission factor. The emission factors for LP gas that are published in the National Inventory Report apply only to energy-related consumption. The data for feedstock use differ, since the mixtures chosen for such use tend, on average, to contain more butane than propane. The mixtures chosen for energy-related use tend to contain more propane than butane. For energy-related con-sumption, which is of relevance for emissions reporting, weighted emission factors of 64.0 to 66.6 t CO2/TJ were calculated. The default value given by the 2006 IPCC Guidelines, 63.1 t CO2/TJ, is slightly lower than the averages for Germany as a whole. In all likelihood, the mixture on which the default value is based contained other substances, in addition to propane and butane, whose specific emission factors are lower than those for propane and butane.
5.6 Other petroleum products and residual substances The CO2 emission factors for light fuel oil, petroleum coke, heavy fuel oil and "other petroleum prod-ucts" are calculated from emissions trading data. The relevant averages for the years 2005 – 2013 were carried backward through 1990.
For light fuel oil, an average emission factor of 74.0 t CO2/TJ was calculated. As expected, it is the same as the emission factor for diesel fuel. In addition, it agrees with the default value, 74.1 t CO2/TJ.
Over the years concerned, the national emission factors for petroleum coke vary from 94.6 to 95.7 t CO2/TJ. Overall, the values are somewhat lower than the default value given in the 2006 IPCC Guide-lines, 97.5 t CO2/TJ. Nonetheless, the values lie within the 95 % confidence interval. The national val-ues have been calculated from quality-assured individual values. In addition, the fuel allocations have been checked for correctness.
It is somewhat difficult to differentiate between heavy fuel oil and "other petroleum products." In the Mineral Oil Statistics, "other petroleum products" are defined as residual substances from refineries, and the pertinent emission factor is calculated accordingly. And in the Energy Balance, the oils listed in the column "heavy fuel oil" include heavy fuel oils and other residual oils. The majority of heavy fuel oils are used in international shipping, and residual oils are used in chemical processing (non-energy-related consumption). Heavy fuel oil, meeting the applicable standards, continues to be used in con-ventional combustion processes in industry, on a considerably smaller scale. For that heavy fuel oil, annual, weighted emission factors of 79.0 – 81.3 t CO2/TJ were determined. In comparison to those levels, the default value given in the 2006 IPCC Guidelines, 77.4 t CO2/TJ, seems somewhat too low. The national factors for "other petroleum products" differ only slightly from the corresponding values for heavy fuel oil. They are slightly higher, on average, and range from 82.1 to 82.9 t CO2/TJ. In this light, the default value given in the 2006 IPCC Guidelines for "Other petroleum products," 73.3 t CO2/TJ, seems considerably too low. In this context, the Guidelines combine various substances, such as aromatics, tar, propylene, sulphur and fats, that differ considerably in terms of their chemical prop-erties. For example, pure sulphur has a carbon content of 0, while benzene and toluene have carbon
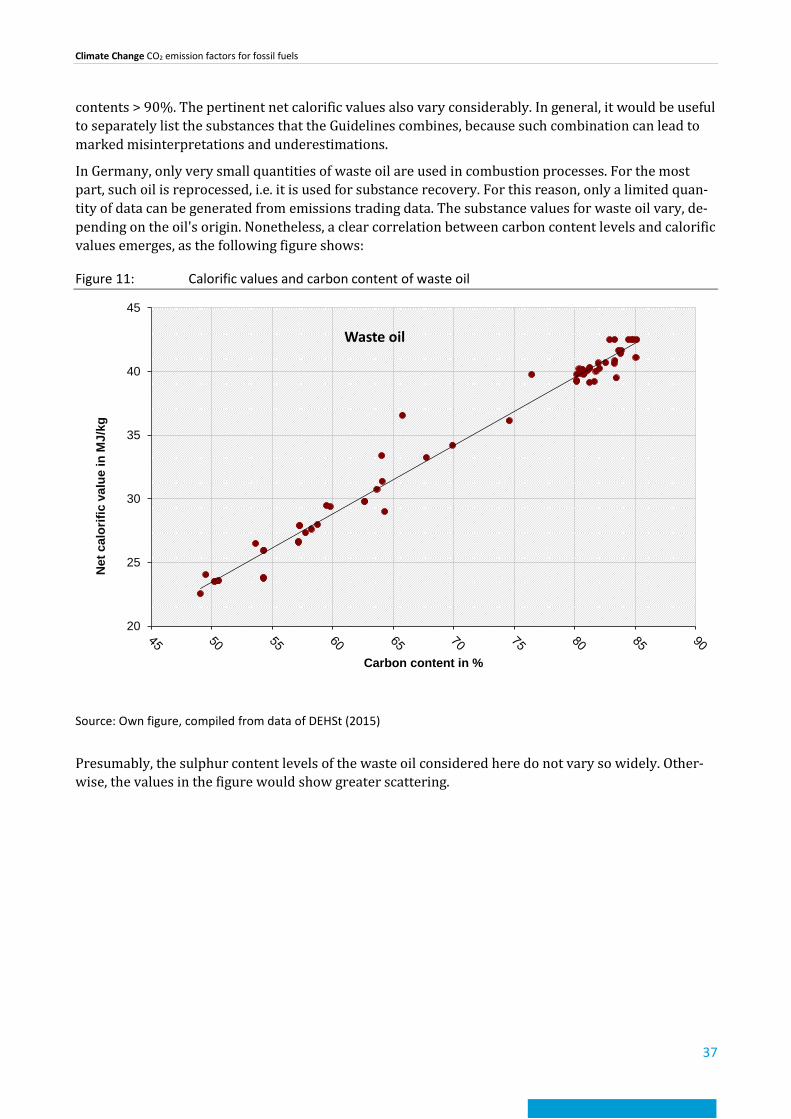
Climate Change CO2 emission factors for fossil fuels
37
contents > 90%. The pertinent net calorific values also vary considerably. In general, it would be useful to separately list the substances that the Guidelines combines, because such combination can lead to marked misinterpretations and underestimations.
In Germany, only very small quantities of waste oil are used in combustion processes. For the most part, such oil is reprocessed, i.e. it is used for substance recovery. For this reason, only a limited quan-tity of data can be generated from emissions trading data. The substance values for waste oil vary, de-pending on the oil's origin. Nonetheless, a clear correlation between carbon content levels and calorific values emerges, as the following figure shows:
Figure 11: Calorific values and carbon content of waste oil
Source: Own figure, compiled from data of DEHSt (2015)
Presumably, the sulphur content levels of the waste oil considered here do not vary so widely. Other-wise, the values in the figure would show greater scattering.
20
25
30
35
40
45
Net
cal
orifi
c va
lue
in M
J/kg
Carbon content in %
Waste oil

Climate Change CO2 emission factors for fossil fuels
38
6 Gases Some gaseous fuels are grouped with the solid fuels, in keeping with the IPCC definitions of the fuels, and with the Guidelines' emphasis on the solid-fuel origins (including production origins) of the rele-vant gaseous fuels. This applies for coke-oven and town gas, for blast furnace gas and basic oxygen fur-nace gas and for fuel gas. The other produced gases are grouped with the liquid fuels, since these gases occur primarily in chemical industry processes – in non-energy-related consumption of naphtha and other petroleum products. These classifications play a necessary role in ensuring that the Reference Approach produces meaningful results.
6.1 Coke oven gas, blast furnace gas and basic oxygen furnace gas
Germany is a leading steel producer. Its production of coke oven gas, blast furnace gas and basic oxy-gen furnace gas is thus high, as one would expect. Blast furnace gas and basic oxygen furnace gas are normally combusted as mixtures. Natural gas is sometimes added, depending on the quality of the gas. Virtually all of the blast furnace gas produced by the steel industry is used for energy generation. Only a very small fraction of this gas is flared off.
The CO2 emission factors for coke oven gas, blast furnace gas and basic oxygen furnace gas are deter-mined with the help of emissions trading data. For relevant recalculations back through 1990, aver-ages were calculated from the emissions trading data for the period 2005 – 2013. Those values were then used for the years 1990 – 2004. The emission factors calculated for coke oven gas vary only slightly – between 40.3 and 41.8 t CO2/TJ. The national values are slightly below the default value given by the 2006 IPCC Guidelines – 44.4 t CO2/TJ – but they are within that value's 95% confidence interval.
Since in energy statistics blast furnace gas and basic oxygen furnace gas are reported only as a gas mix-ture, a weighted emission factor is calculated from a) the emission factors determined individually for the two gases and b) the quantities of blast furnace gas and basic oxygen furnace gas that are pro-duced. Undoubtedly, the mixing ratios used in the various utilization areas can differ. Combustion of blast furnace gas and basic oxygen furnace gas is covered only partially by emissions trading data, and the calculation method used ensures that the total emissions are calculated correctly. For it to be pos-sible to compare the national factors with the default values in the 2006 IPCC Guidelines, blast furnace gas and basic oxygen furnace gas have to be considered separately. For blast furnace gas, the annual average emission factors (implied emission factors), calculated for the entire installations sector, vary from 254.9 to 272 t CO2/TJ. The net calorific values range from 3.3 to 3.6 MJ/m³. The default emission factor given in the 2006 IPCC Guidelines, at 260 t CO2/TJ, lies within the range covered by the national factors. In Germany, the annual implied emission factors for basic oxygen furnace gas range from 188.6 to 195.1 t CO2/TJ. The average net calorific values vary from 8.1 to 8.5 MJ/m³. The default emis-sion factor given in the 2006 IPCC Guidelines, at 182 t CO2/TJ, is lower than the German values and thus seems somewhat too low.
6.2 Town gas Town gas was used in Germany until 1996. In the Energy Balance, it is grouped with coke oven gas. The data situation is similar to that for combustion of blast furnace gas and basic oxygen furnace gas – no data are available on the fractions of coke oven gas and town gas found in the gas mixtures used. For this reason, a weighted emission factor was calculated here as well, via the figures for production of coke oven gas and town gas. The values for town gas were obtained from Berliner Gaswerke AG (GASAG – the Berlin natural gas utility) and DBI Gas- und Umwelttechnik GmbH Leipzig (DBI GUT). Detailed analyses are available for the years 1989 through 1991. The following table provides an over-view of the different grades of gas used.
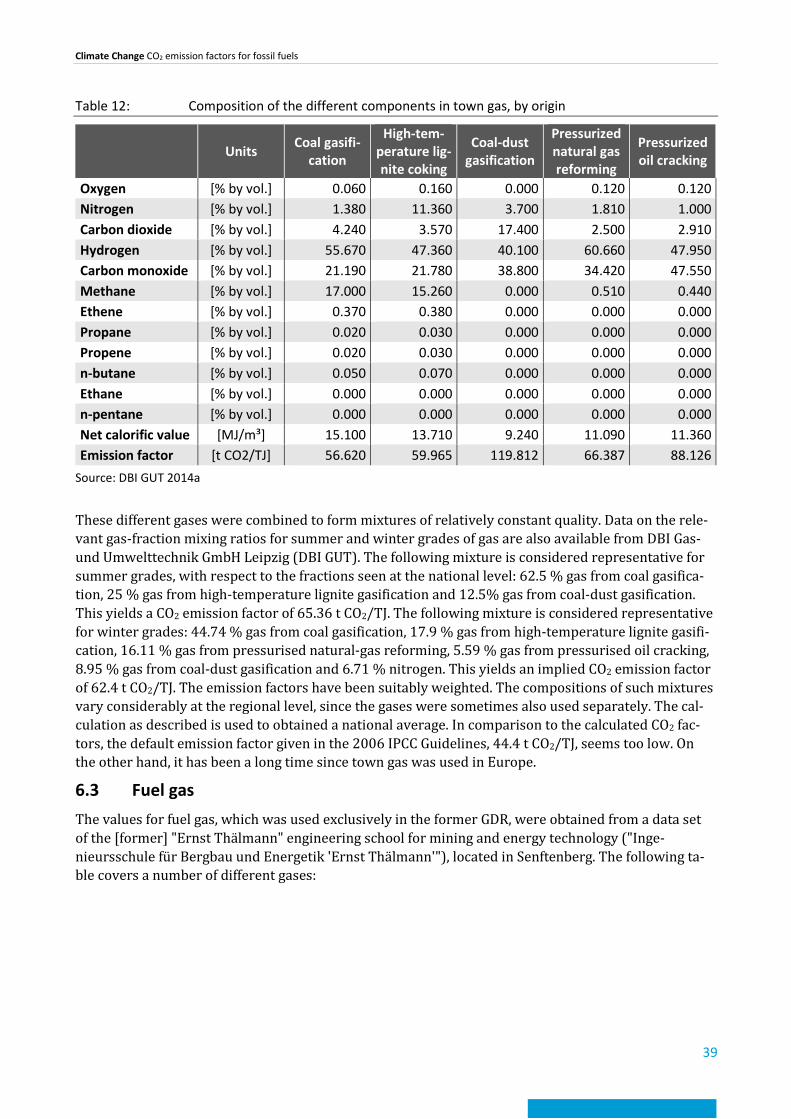
Climate Change CO2 emission factors for fossil fuels
39
Table 12: Composition of the different components in town gas, by origin
Units Coal gasifi-cation
High-tem-perature lig-nite coking
Coal-dust gasification
Pressurized natural gas reforming
Pressurized oil cracking
Oxygen [% by vol.] 0.060 0.160 0.000 0.120 0.120 Nitrogen [% by vol.] 1.380 11.360 3.700 1.810 1.000 Carbon dioxide [% by vol.] 4.240 3.570 17.400 2.500 2.910 Hydrogen [% by vol.] 55.670 47.360 40.100 60.660 47.950 Carbon monoxide [% by vol.] 21.190 21.780 38.800 34.420 47.550 Methane [% by vol.] 17.000 15.260 0.000 0.510 0.440 Ethene [% by vol.] 0.370 0.380 0.000 0.000 0.000 Propane [% by vol.] 0.020 0.030 0.000 0.000 0.000 Propene [% by vol.] 0.020 0.030 0.000 0.000 0.000 n-butane [% by vol.] 0.050 0.070 0.000 0.000 0.000 Ethane [% by vol.] 0.000 0.000 0.000 0.000 0.000 n-pentane [% by vol.] 0.000 0.000 0.000 0.000 0.000 Net calorific value [MJ/m³] 15.100 13.710 9.240 11.090 11.360 Emission factor [t CO2/TJ] 56.620 59.965 119.812 66.387 88.126
Source: DBI GUT 2014a
These different gases were combined to form mixtures of relatively constant quality. Data on the rele-vant gas-fraction mixing ratios for summer and winter grades of gas are also available from DBI Gas- und Umwelttechnik GmbH Leipzig (DBI GUT). The following mixture is considered representative for summer grades, with respect to the fractions seen at the national level: 62.5 % gas from coal gasifica-tion, 25 % gas from high-temperature lignite gasification and 12.5% gas from coal-dust gasification. This yields a CO2 emission factor of 65.36 t CO2/TJ. The following mixture is considered representative for winter grades: 44.74 % gas from coal gasification, 17.9 % gas from high-temperature lignite gasifi-cation, 16.11 % gas from pressurised natural-gas reforming, 5.59 % gas from pressurised oil cracking, 8.95 % gas from coal-dust gasification and 6.71 % nitrogen. This yields an implied CO2 emission factor of 62.4 t CO2/TJ. The emission factors have been suitably weighted. The compositions of such mixtures vary considerably at the regional level, since the gases were sometimes also used separately. The cal-culation as described is used to obtained a national average. In comparison to the calculated CO2 fac-tors, the default emission factor given in the 2006 IPCC Guidelines, 44.4 t CO2/TJ, seems too low. On the other hand, it has been a long time since town gas was used in Europe.
6.3 Fuel gas The values for fuel gas, which was used exclusively in the former GDR, were obtained from a data set of the [former] "Ernst Thälmann" engineering school for mining and energy technology ("Inge-nieursschule für Bergbau und Energetik 'Ernst Thälmann'"), located in Senftenberg. The following ta-ble covers a number of different gases:

Climate Change CO2 emission factors for fossil fuels
40
Table 13: Analysis data for lignite gases used in the former GDR
Units Lignite-based "winkler" gas
Lignite-based generator gas
Lignite-based carbonisation
gas
Lignite-based water gas
Carbon dioxide [% by vol.] 5.500 3.700 19.000 13.800 Carbon monoxide [% by vol.] 22.500 30.000 11.600 38.000 Hydrogen [% by vol.] 12.600 10.700 11.000 26.500 Nitrogen [% by vol.] 55.700 53.500 45.500 21.500 Methane [% by vol.] 0.700 2.000 11.600 0.600 Other hydrocar-bons [% by vol.] 0.000 0.000 0.800 0.000
Oxygen [% by vol.] 0.000 0.000 0.500 0.000 Net calorific value [MJ/m³] [MJ/m³] 4.459 5.665 7.277 7.879
Emission factor [t CO2/TJ] 126.701 123.990 118.439 130.972 Source: Ingenieursschule für Bergbau und Energetik "Ernst Thälmann"; own calculations
The term "fuel gas" is not clearly defined. Since this gas was used primarily in mine-mouth power plants, it may be assumed to have been a lignite-based gas. The composition of such gas can vary widely, however. Consequently, the applicable emission factors can also differ widely. They lie within the range 118.6 to 131 t CO2/TJ. In the interest of applying a conservative approach, to ensure that the base-year emissions are not overestimated, the lowest emission factor is used for inventory prepara-tion. The 1989 Energiewirtschaftlicher Jahresbericht (1989 edition of an annual report for the energy sector) gives a net calorific value of 5.3 MJ/Nm³ for "other gas," a figure that points to a higher emis-sion factor. Since in the Energy Balance coke oven gas, town gas and fuel gas are reported as a group, the net calorific values for the individual gases involved can no longer be determined.
Other residual gases are used primarily in the chemical industry. This term refers both to high-ca-loric gases, with high hydrogen fractions, and to low-caloric flare gases with high nitrogen fractions. The pertinent emission factor was calculated from emissions trading data for the chemical industry. In the process, an average for the years 2008 – 2013 was obtained. Energy statistics and emissions trad-ing use considerably different calorific-value figures, but the relevant quantities, given in cubic meters, show good agreement. For this reason, an emission factor was calculated that is based on that natural unit. In the interest of consistency, calculations for purposes of inventory preparation use the net calo-rific value given in energy statistics.
For mine gas, a methane-content figure is calculated from the quantity of methane used, as given by the Gesamtverband Steinkohle (GVSt) hard-coal-mining association, and the total quantity, expressed in cubic meters, given in the Energy Balance. A CO2 emission factor is then calculated via the relevant gas composition. Statistical differences are seen in some years. In the interest of applying a conserva-tive approach, the calculation is carried out with the lowest methane-content figure. On the whole, the methane content in the so-utilised gas can be expected to decrease somewhat. For this reason, the val-ues are reviewed annually. The 2006 IPCC Guidelines do not give a default emission factor for mine gas.
6.4 Natural gas and associated gas For petroleum gas, data were available from emissions trading. In Germany, petroleum gas is used only in connection with natural-gas production. Until 1994, petroleum gas was listed separately in the Energy Balance as a fuel. As of 1995, the Energy Balance has presented combined data on natural gas
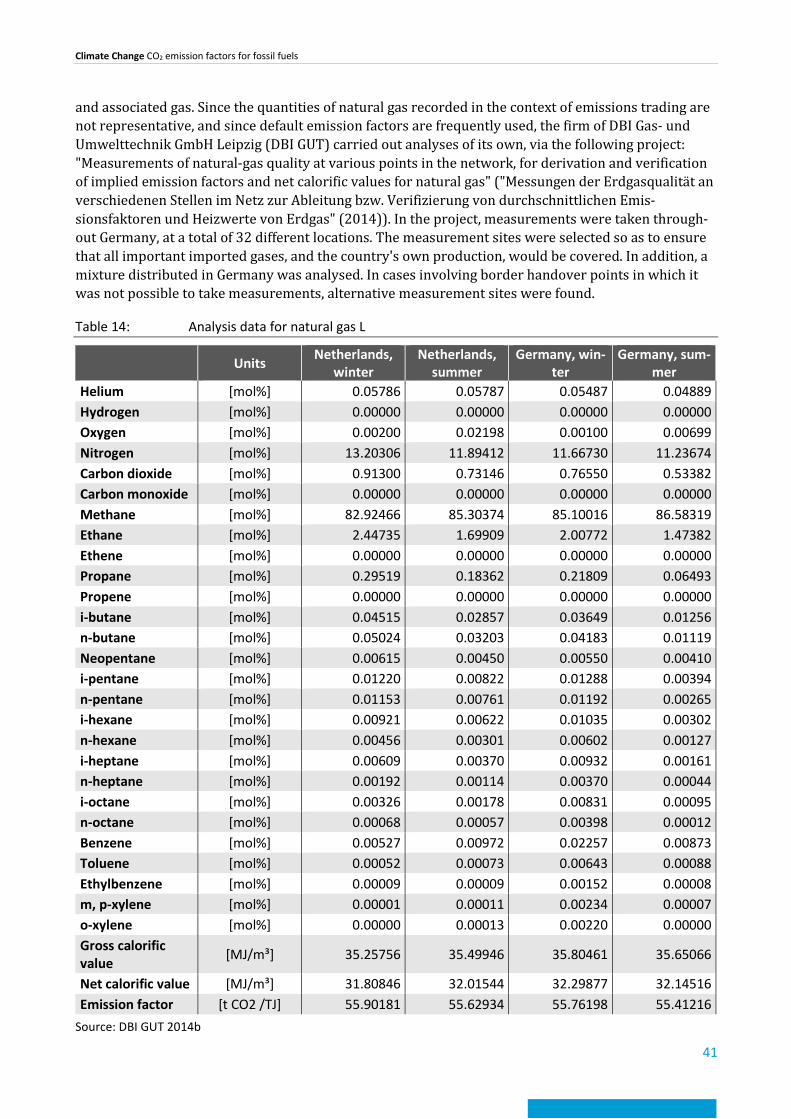
Climate Change CO2 emission factors for fossil fuels
41
and associated gas. Since the quantities of natural gas recorded in the context of emissions trading are not representative, and since default emission factors are frequently used, the firm of DBI Gas- und Umwelttechnik GmbH Leipzig (DBI GUT) carried out analyses of its own, via the following project: "Measurements of natural-gas quality at various points in the network, for derivation and verification of implied emission factors and net calorific values for natural gas" ("Messungen der Erdgasqualität an verschiedenen Stellen im Netz zur Ableitung bzw. Verifizierung von durchschnittlichen Emis-sionsfaktoren und Heizwerte von Erdgas" (2014)). In the project, measurements were taken through-out Germany, at a total of 32 different locations. The measurement sites were selected so as to ensure that all important imported gases, and the country's own production, would be covered. In addition, a mixture distributed in Germany was analysed. In cases involving border handover points in which it was not possible to take measurements, alternative measurement sites were found.
Table 14: Analysis data for natural gas L
Units Netherlands, winter
Netherlands, summer
Germany, win-ter
Germany, sum-mer
Helium [mol%] 0.05786 0.05787 0.05487 0.04889 Hydrogen [mol%] 0.00000 0.00000 0.00000 0.00000 Oxygen [mol%] 0.00200 0.02198 0.00100 0.00699 Nitrogen [mol%] 13.20306 11.89412 11.66730 11.23674 Carbon dioxide [mol%] 0.91300 0.73146 0.76550 0.53382 Carbon monoxide [mol%] 0.00000 0.00000 0.00000 0.00000 Methane [mol%] 82.92466 85.30374 85.10016 86.58319 Ethane [mol%] 2.44735 1.69909 2.00772 1.47382 Ethene [mol%] 0.00000 0.00000 0.00000 0.00000 Propane [mol%] 0.29519 0.18362 0.21809 0.06493 Propene [mol%] 0.00000 0.00000 0.00000 0.00000 i-butane [mol%] 0.04515 0.02857 0.03649 0.01256 n-butane [mol%] 0.05024 0.03203 0.04183 0.01119 Neopentane [mol%] 0.00615 0.00450 0.00550 0.00410 i-pentane [mol%] 0.01220 0.00822 0.01288 0.00394 n-pentane [mol%] 0.01153 0.00761 0.01192 0.00265 i-hexane [mol%] 0.00921 0.00622 0.01035 0.00302 n-hexane [mol%] 0.00456 0.00301 0.00602 0.00127 i-heptane [mol%] 0.00609 0.00370 0.00932 0.00161 n-heptane [mol%] 0.00192 0.00114 0.00370 0.00044 i-octane [mol%] 0.00326 0.00178 0.00831 0.00095 n-octane [mol%] 0.00068 0.00057 0.00398 0.00012 Benzene [mol%] 0.00527 0.00972 0.02257 0.00873 Toluene [mol%] 0.00052 0.00073 0.00643 0.00088 Ethylbenzene [mol%] 0.00009 0.00009 0.00152 0.00008 m, p-xylene [mol%] 0.00001 0.00011 0.00234 0.00007 o-xylene [mol%] 0.00000 0.00013 0.00220 0.00000 Gross calorific value [MJ/m³] 35.25756 35.49946 35.80461 35.65066
Net calorific value [MJ/m³] 31.80846 32.01544 32.29877 32.14516 Emission factor [t CO2 /TJ] 55.90181 55.62934 55.76198 55.41216
Source: DBI GUT 2014b
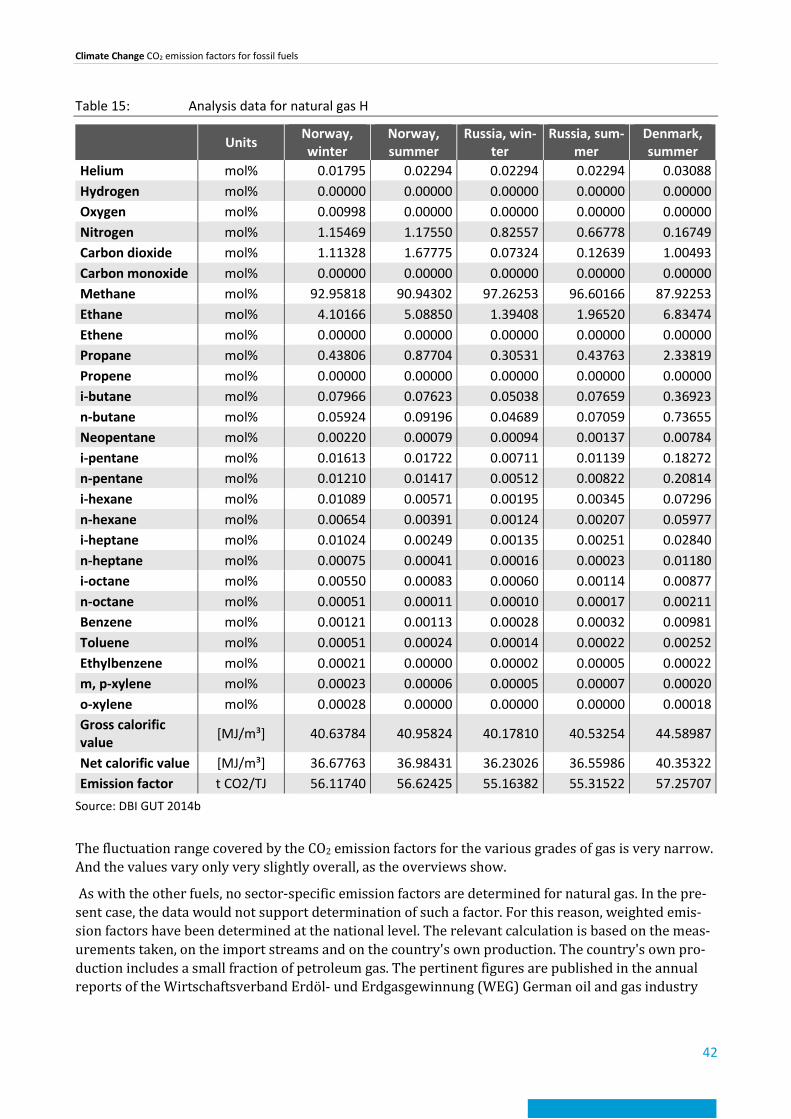
Climate Change CO2 emission factors for fossil fuels
42
Table 15: Analysis data for natural gas H
Units Norway, winter
Norway, summer
Russia, win-ter
Russia, sum-mer
Denmark, summer
Helium mol% 0.01795 0.02294 0.02294 0.02294 0.03088 Hydrogen mol% 0.00000 0.00000 0.00000 0.00000 0.00000 Oxygen mol% 0.00998 0.00000 0.00000 0.00000 0.00000 Nitrogen mol% 1.15469 1.17550 0.82557 0.66778 0.16749 Carbon dioxide mol% 1.11328 1.67775 0.07324 0.12639 1.00493 Carbon monoxide mol% 0.00000 0.00000 0.00000 0.00000 0.00000 Methane mol% 92.95818 90.94302 97.26253 96.60166 87.92253 Ethane mol% 4.10166 5.08850 1.39408 1.96520 6.83474 Ethene mol% 0.00000 0.00000 0.00000 0.00000 0.00000 Propane mol% 0.43806 0.87704 0.30531 0.43763 2.33819 Propene mol% 0.00000 0.00000 0.00000 0.00000 0.00000 i-butane mol% 0.07966 0.07623 0.05038 0.07659 0.36923 n-butane mol% 0.05924 0.09196 0.04689 0.07059 0.73655 Neopentane mol% 0.00220 0.00079 0.00094 0.00137 0.00784 i-pentane mol% 0.01613 0.01722 0.00711 0.01139 0.18272 n-pentane mol% 0.01210 0.01417 0.00512 0.00822 0.20814 i-hexane mol% 0.01089 0.00571 0.00195 0.00345 0.07296 n-hexane mol% 0.00654 0.00391 0.00124 0.00207 0.05977 i-heptane mol% 0.01024 0.00249 0.00135 0.00251 0.02840 n-heptane mol% 0.00075 0.00041 0.00016 0.00023 0.01180 i-octane mol% 0.00550 0.00083 0.00060 0.00114 0.00877 n-octane mol% 0.00051 0.00011 0.00010 0.00017 0.00211 Benzene mol% 0.00121 0.00113 0.00028 0.00032 0.00981 Toluene mol% 0.00051 0.00024 0.00014 0.00022 0.00252 Ethylbenzene mol% 0.00021 0.00000 0.00002 0.00005 0.00022 m, p-xylene mol% 0.00023 0.00006 0.00005 0.00007 0.00020 o-xylene mol% 0.00028 0.00000 0.00000 0.00000 0.00018 Gross calorific value [MJ/m³] 40.63784 40.95824 40.17810 40.53254 44.58987
Net calorific value [MJ/m³] 36.67763 36.98431 36.23026 36.55986 40.35322 Emission factor t CO2/TJ 56.11740 56.62425 55.16382 55.31522 57.25707
Source: DBI GUT 2014b
The fluctuation range covered by the CO2 emission factors for the various grades of gas is very narrow. And the values vary only very slightly overall, as the overviews show.
As with the other fuels, no sector-specific emission factors are determined for natural gas. In the pre-sent case, the data would not support determination of such a factor. For this reason, weighted emis-sion factors have been determined at the national level. The relevant calculation is based on the meas-urements taken, on the import streams and on the country's own production. The country's own pro-duction includes a small fraction of petroleum gas. The pertinent figures are published in the annual reports of the Wirtschaftsverband Erdöl- und Erdgasgewinnung (WEG) German oil and gas industry
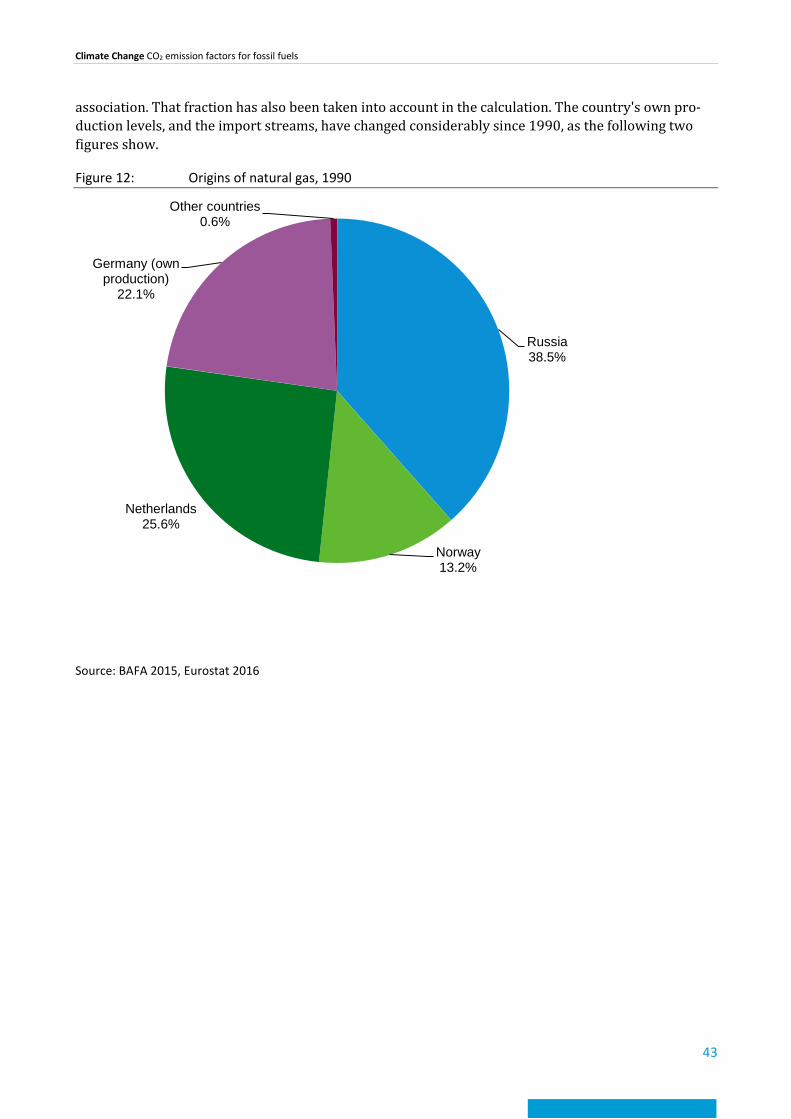
Climate Change CO2 emission factors for fossil fuels
43
association. That fraction has also been taken into account in the calculation. The country's own pro-duction levels, and the import streams, have changed considerably since 1990, as the following two figures show.
Figure 12: Origins of natural gas, 1990
Source: BAFA 2015, Eurostat 2016
Russia38.5%
Norway13.2%
Netherlands25.6%
Germany (own production)
22.1%
Other countries0.6%
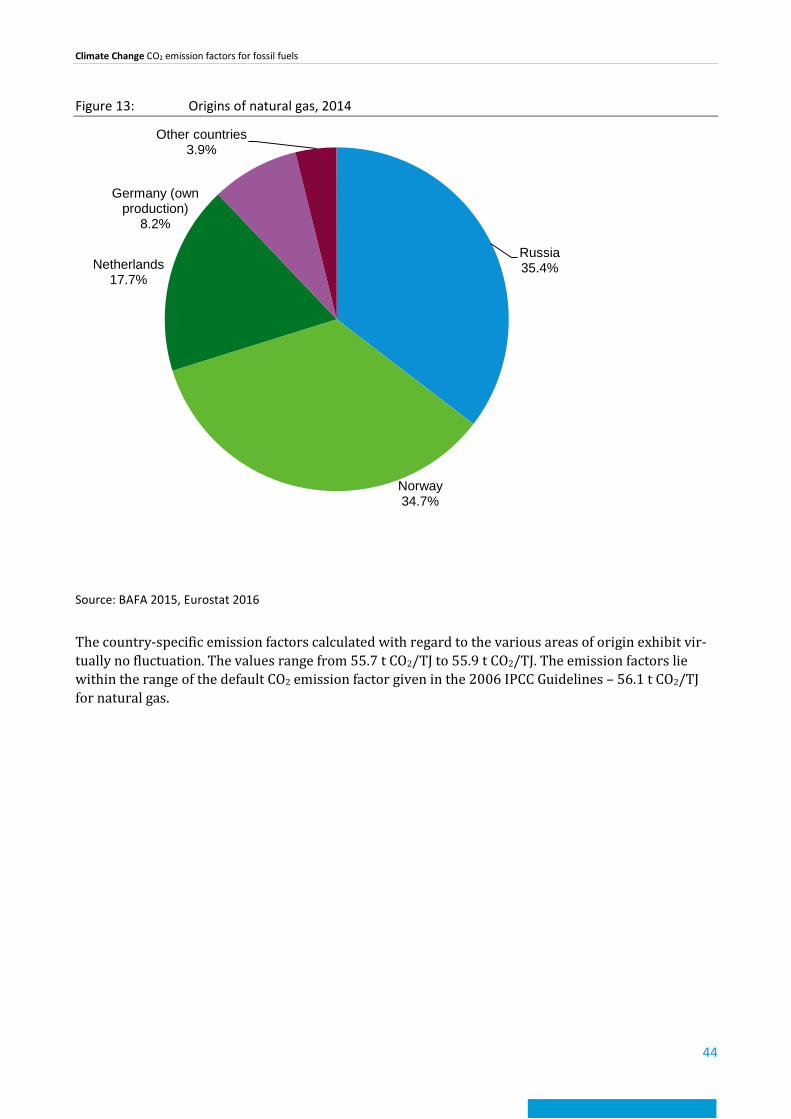
Climate Change CO2 emission factors for fossil fuels
44
Figure 13: Origins of natural gas, 2014
Source: BAFA 2015, Eurostat 2016
The country-specific emission factors calculated with regard to the various areas of origin exhibit vir-tually no fluctuation. The values range from 55.7 t CO2/TJ to 55.9 t CO2/TJ. The emission factors lie within the range of the default CO2 emission factor given in the 2006 IPCC Guidelines – 56.1 t CO2/TJ for natural gas.
Russia35.4%
Norway34.7%
Netherlands17.7%
Germany (own production)
8.2%
Other countries3.9%

Climate Change CO2 emission factors for fossil fuels
45
7 Selected fuel-related CO2 emission factors The following list is an excerpt from the List of CO2 emission factors derived for emissions reporting [cov-ering fuel-related emissions] that is published annually in the National Inventory Report (NIR) and sep-arately on our website for Topic-related greenhouse-gas emissions (Themenseite Treibhausgas-Emissio-nen) 1.
Table 16: CO2 emission factors – fuel-related emission factors (excerpt; last revision: 15 April 2016)
Units 1990 1995 2000 2005 2010 2014 Coal Hard coal (Steinkohle) Raw hard coal (power stations, indus-try) t CO2/TJ 93.1 93.1 93.5 93.9 94.0 93.6
Hard-coal briquettes t CO2/TJ 95.9 95.9 95.9 95.9 95.9 95.9 Hard-coal coke (not including iron & steel) t CO2/TJ 108.1 108.1 108.1 108.1 108.1 108.1
Hard-coal coke: iron & steel t CO2/t 3.29 3.26 3.23 3.19 3.18 3.21 Anthracite (heat market for house-holds, commerce, trade, services) t CO2/TJ 97.6 97.6 97.6 97.6 97.6 97.6
Low-grade hard coal, old German Län-der (states) t CO2/TJ 95.2
Coking coal, Germany t CO2/t 2.96 2.93 2.90 2.87 2.86 2.89 Hard coal: iron & steel t CO2/t 2.92 2.92 2.92 2.95 2.89 2.96 Other hard-coal products t CO2/t 3.30 3.30 3.30 3.30 3.29 3.32 Hard-coal tar t CO2/t 3.27 3.27 3.27 3.28 3.27 3.31 Benzene t CO2/t 3.38 3.38 3.38 3.38 3.38 3.36 Lignite (Braunkohle) Raw lignite Public district heating stations, Ger-many t CO2/TJ 111.7 110.8 111.1 110.7 110.9
Old German Länder t CO2/TJ 113.8 New German Länder t CO2/TJ 110.0 Industry, commerce, trade, services, Germany t CO2/TJ 106.0 109.8 108.2 106.3 103.8
Old German Länder t CO2/TJ 114.7 New German Länder t CO2/TJ 107.7 Public power stations; District: Rhineland t CO2/TJ 114.8 113.9 113.1 113.2 113.3 113.1 Helmstedt t CO2/TJ 98.7 98.7 98.7 98.7 96.7 101.1 Hesse t CO2/TJ 112.2 103.2 103.5 NO NO NO Lusatian mining district t CO2/TJ 111.2 111.3 111.5 111.2 110.6 111.2 Central German mining district t CO2/TJ 105.7 103.9 102.9 104.0 103.4 102.8
1 https://www.umweltbundesamt.de/themen/klima-energie/treibhausgas-emissionen (cf. the "Reports & Data" (Berichte &
Daten) section in the central column)

Climate Change CO2 emission factors for fossil fuels
46
Units 1990 1995 2000 2005 2010 2014 Lignite briquettes, Germany t CO2/TJ 98.3 99.0 99.3 99.0 99.6 Old German Länder t CO2/TJ 99.5 New German Länder t CO2/TJ 96.6 Lignite tar, new German Länder t CO2/TJ 82.9 Lignite tar oil, new German Länder 78.6 Lignite dust and fluidised bed coal, Germany t CO2/TJ 97.6 98.1 98.1 98.0 98.1
Old German Länder t CO2/TJ 98.3 New German Länder t CO2/TJ 96.1 Lignite coke, Germany t CO2/TJ 109.6 109.6 109.6 109.6 109.6 Old German Länder t CO2/TJ 109.6 New German Länder t CO2/TJ 100.2 Peat old German Länder, Germany 101.8 101.8 101.8 101.8 NO NO Meta-lignite t CO2/TJ 96.4 96.4 96.5 NO 94.9 95.6 Petroleum Crude oil *) t CO2/TJ 73.3 73.3 73.3 73.3 73.3 73.3 Petrol t CO2/TJ 73.1 73.1 73.1 73.1 73.1 73.1 Naphtha, Germany *) t CO2/TJ 73.3 73.3 73.3 73.3 73.3 Old German Länder *) t CO2/TJ 73.3 New German Länder *) t CO2/TJ 73.3 Kerosene *) t CO2/TJ 73.3 73.3 73.3 73.3 73.3 73.3 Avgas *) t CO2/TJ 70.0 70.0 70.0 70.0 70.0 70.0 Diesel fuel, Germany t CO2/TJ 74.0 74.0 74.0 74.0 74.0 Old German Länder t CO2/TJ 74.0 New German Länder t CO2/TJ 74.0 Light fuel oil, Germany t CO2/TJ 74.0 74.0 74.0 74.0 74.0 Old German Länder t CO2/TJ 74.0 New German Länder t CO2/TJ 74.0 Heavy fuel oil t CO2/TJ 79.8 79.8 79.8 79.6 79.7 81.3 Petroleum t CO2/TJ 74.0 74.0 74.0 74.0 74.0 74.0 Petroleum coke (not including coke burn-off in catalyst regeneration) t CO2/TJ 94.8 94.8 94.8 94.8 94.6 95.7
LP gas, Germany (energy-related con-sumption) t CO2/TJ 65.3 64.4 65.3 65.3 65.5
Old German Länder t CO2/TJ 65.6 New German Länder t CO2/TJ 65.6 Refinery gas, Germany t CO2/TJ 56.9 56.7 57.0 65.4 61.2 Old German Länder t CO2/TJ 54.6 New German Länder t CO2/TJ 54.6 Other petroleum products, Germany t CO2/TJ 82.1 82.1 82.1 82.5 82.7 Old German Länder t CO2/TJ 82.1 New German Länder t CO2/TJ 82.1 Used oil t CO2/t 75.7 75.7 75.7 75.7 75.7 75.7 Lubricants *) t CO2/TJ 73.3 73.3 73.3 73.3 73.3 73.3 Gases
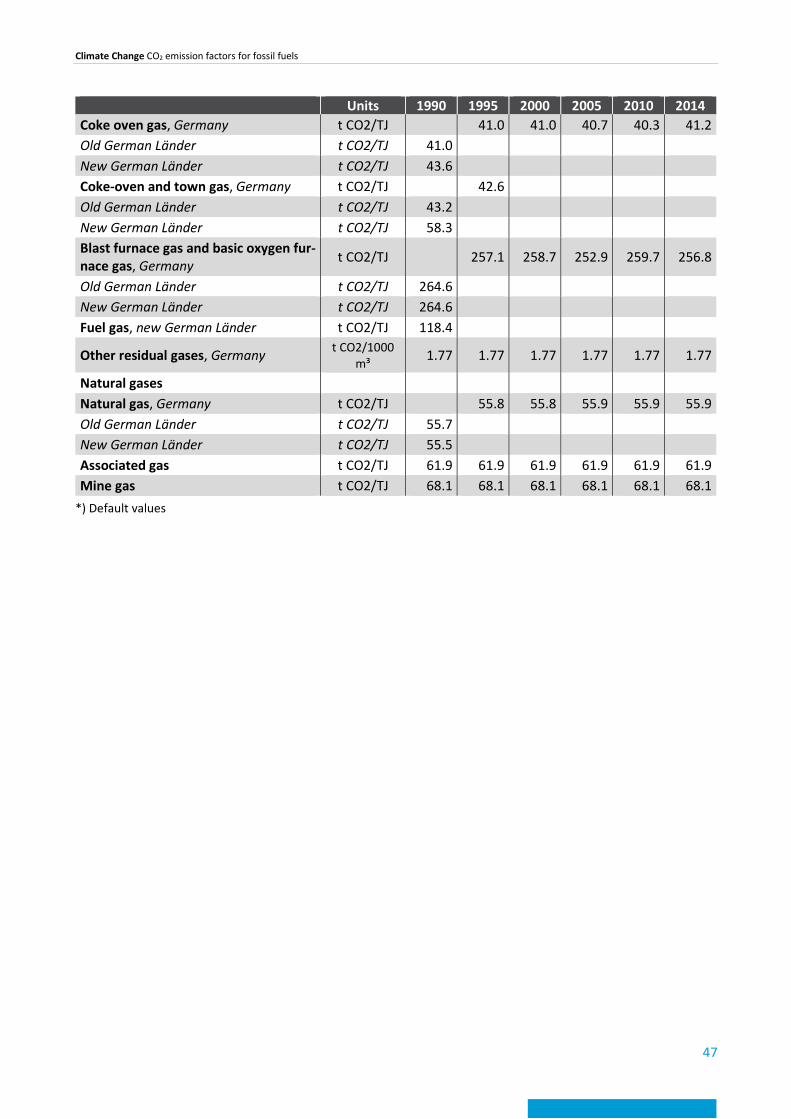
Climate Change CO2 emission factors for fossil fuels
47
Units 1990 1995 2000 2005 2010 2014 Coke oven gas, Germany t CO2/TJ 41.0 41.0 40.7 40.3 41.2 Old German Länder t CO2/TJ 41.0 New German Länder t CO2/TJ 43.6 Coke-oven and town gas, Germany t CO2/TJ 42.6 Old German Länder t CO2/TJ 43.2 New German Länder t CO2/TJ 58.3 Blast furnace gas and basic oxygen fur-nace gas, Germany t CO2/TJ 257.1 258.7 252.9 259.7 256.8
Old German Länder t CO2/TJ 264.6 New German Länder t CO2/TJ 264.6 Fuel gas, new German Länder t CO2/TJ 118.4
Other residual gases, Germany t CO2/1000 m³ 1.77 1.77 1.77 1.77 1.77 1.77
Natural gases Natural gas, Germany t CO2/TJ 55.8 55.8 55.9 55.9 55.9 Old German Länder t CO2/TJ 55.7 New German Länder t CO2/TJ 55.5 Associated gas t CO2/TJ 61.9 61.9 61.9 61.9 61.9 61.9 Mine gas t CO2/TJ 68.1 68.1 68.1 68.1 68.1 68.1
*) Default values

Climate Change CO2 emission factors for fossil fuels
48
8 List of sources AGEB 2016: Arbeitsgemeinschaft Energiebilanzen, Energiebilanz 2014, Datenstand 11.05.2016
BAFA 2015: Bundesamt für Wirtschaft und Ausfuhrkontrolle; Entwicklung des Deutschen Gasmarktes (monthly balance for 1998-2015, imports since 1960), published at www.bafa.de
DBI GUT 2014a: DBI Gas- und Umwelttechnik GmbH Leipzig, persönliche Mitteilung von Analysedaten aus der ehemaligen DDR von Udo Lubenau, Fachgebietsleiter Gaschemie/Gasmesstechnik
DBI GUT 2014b: DBI Gas- und Umwelttechnik GmbH Leipzig, Udo Lubenau, Stefan Schütz, Projektnummer 32 729, Messungen der Erdgasqualität an verschiedenen Stellen im Netz zur Ableitung bzw. Verifizierung von durchschnittlichen Emissionsfaktoren und Heizwerten von Erdgas, unpublished
DEBRIV 1980: Deutscher Braunkohlen Industrieverein e.V., Abschlussbericht zum Forschungsvorhaben Nebenproduktgewinnung in Verbindung mit der Braunkohlenkokserzeugung im Auftrag der Kommission der Europäischen Gemeinschaften, Technische For-schung Kohle, Vertrag Nr.7220 – EB 106
DEBRIV 2014: Deutscher Braunkohlen Industrieverein e.V., Braunkohle in Deutschland 2013, Daten und Fakten, Ausgewählte Koh-lenqualitätsdaten (in Betrieb befindliche und geplante Abbaubereiche)
DEHSt 2015: Deutsche Emissionshandelsstelle, Fachgebiet E 2.3, August 2015: Sonderauswertung für Kohlenstoffgehalte und Heiz-werte der Stoffströme 2005 - 2014, unpublished
DGMK 1994: Deutsche Wissenschaftliche Gesellschaft für Erdöl, Erdgas und Kohle e.V., Forschungsbericht 502, Dr. B. Dietzel et al. 1994, Zusammensetzung von Ottokraftstoffen aus deutschen Raffinerien, ISBN 3-928164-66-X
DGMK 2002: Deutsche Wissenschaftliche Gesellschaft für Erdöl, Erdgas und Kohle e.V., Forschungsbericht 502-1, Dr. Hans-Peter Schmiedel, 2003, Zusammensetzung von Ottokraftstoffen aus deutschen Raffinerien -Winterware 2001/2002, ISBN 3-936418-07-1
DGMK Forschungsbericht 583: Deutsche Wissenschaftliche Gesellschaft für Erdöl, Erdgas und Kohle e.V., Dr. J.-C. Fröhling, Jan Ludzay, 2002, Zusammensetzung von Dieselkraftstoffen aus deutschen Raffinerien, ISBN 3-936418-01-2
Eurostat 2016: Erdgasstatistik: Exports-gas-annual data, Datenstand 15.04.2016
Ingenieursschule für Bergbau und Energetik „Ernst Thälmann“: Analyseergebnisse für verschiedene Brennstoffe als Unterlagen für Fachschul-Fernstudium, Ende der 1980er Jahre, unpublished
Jahresbericht 1986 der Kohleindustrie: Ergebnisse geologischer Erkundungen Staatliche Umweltinspektion beim Rat des Bezirkes Halle, Qualitätsparameter von Rohbraunkohle und Braunkohlenbriketts, unpublished
Mohry 1986: Dr.-Ing. Herbert Mohry, Brennstoffgrößen für ostdeutsche Braunkohle, unpublished
Öko-Institut 2014: Öko-Institut e.V: „Methodische Anpassung der deutschen THG-Emissionsinventare an die überarbeiteten „UN-FCCC reporting guidelines on annual inventories for Parties included in Annex I to the convention“, FKZ 371241103-2; currently being published
TU Dresden 2014: Technische Universität Dresden Fakultät für Maschinenwesen Institut für Energietechnik, Dr. rer. nat. Kathrin Gebauer, Laboranalysen August 2014, Untersuchungsbericht Lab 14/01, unpublished
VDKI 2015: Verein der Kohleimporteure e.V.: Jahresbericht 2015


