58
INDEX 1. Company Info 2. Income Statement 3. Balance Sheet 4. Cash Flow Statement 5. Ratio Analysis 6. DCF Analysis 7. Risk Analysis
| Date post: | 01-Dec-2014 |
| Category: |
Documents |
| Upload: | akash-shah |
| View: | 178 times |
| Download: | 4 times |
INDEX1. Company Info2. Income Statement3. Balance Sheet4. Cash Flow Statement5. Ratio Analysis6. DCF Analysis7. Risk Analysis

Company Details Market DetailsCompany Name Coal India Limited BSE CodeIndustry Type Mining/Minerals NSE CodeCountry of Incorporation India Face Value (INR)Year of Incorporation 1973 Share OutstandingsCompany Type Public IPO Price Band (INR)Web-site Issue Date
Back
www.coalindia.in
Coal India Limited (CIL)
Coal India Ltd. Schedule 'A' Navratna' Publice sector under Ministry of Coal, Govt of India. The compnay is the largest coal producing company in the world based on their raw cola production. Also they are the largest reserve holder in the world based on their reserve base. The company produces non-cocking coal and coaking coal of various grades for diverse applications. Most of their coal production comes from open cast mines.
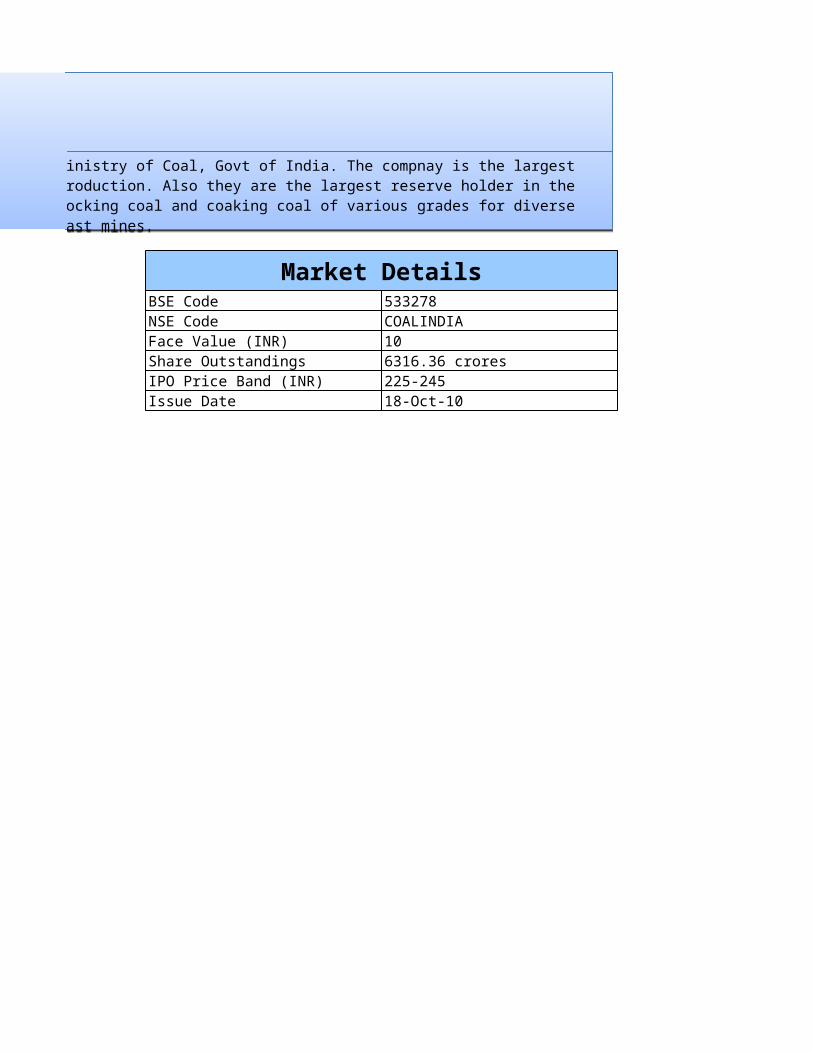
Market DetailsBSE Code 533278NSE Code COALINDIAFace Value (INR) 10Share Outstandings 6316.36 croresIPO Price Band (INR) 225-245Issue Date 18-Oct-10
Coal India Limited (CIL)
Coal India Ltd. Schedule 'A' Navratna' Publice sector under Ministry of Coal, Govt of India. The compnay is the largest coal producing company in the world based on their raw cola production. Also they are the largest reserve holder in the world based on their reserve base. The company produces non-cocking coal and coaking coal of various grades for diverse applications. Most of their coal production comes from open cast mines.
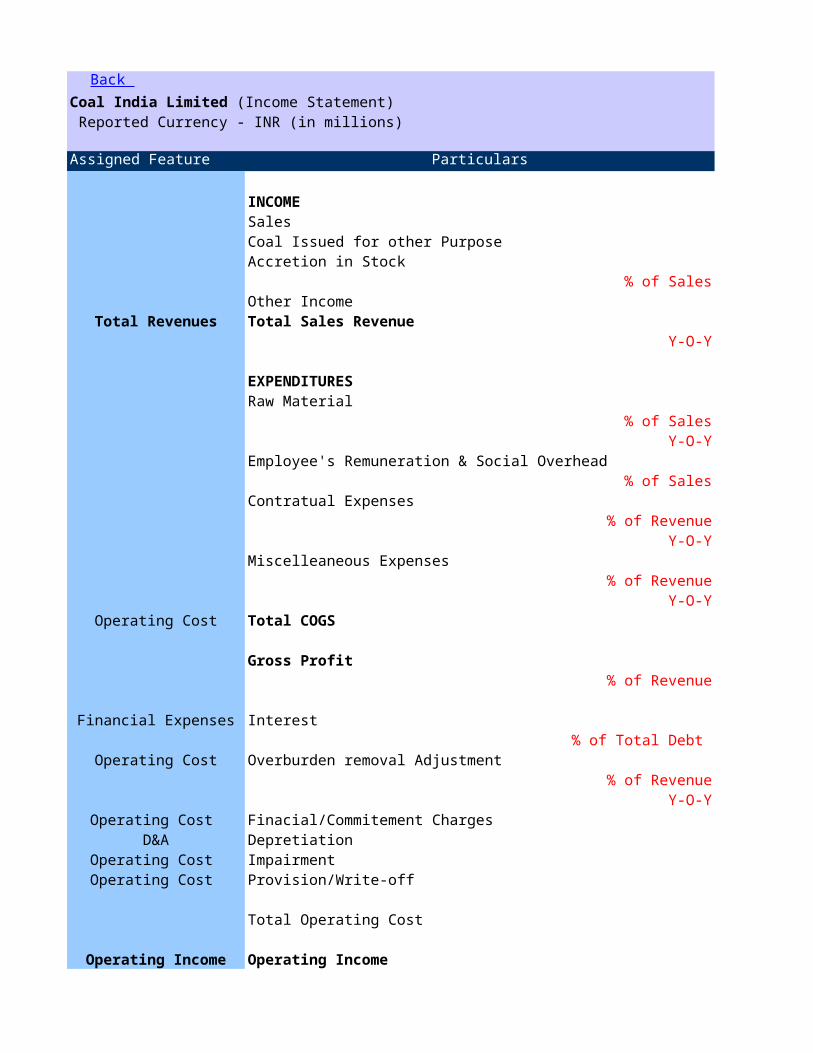
Reported Currency - INR (in millions)2006
Assigned Feature Particulars Actual
INCOMESales 287,018Coal Issued for other Purpose 20,540Accretion in Stock 4,838
% of Sales 1.7%Other Income 27,691
Total Revenues Total Sales Revenue 340,088Y-O-Y
EXPENDITURESRaw Material 81,039
% of Sales 28.2%Y-O-Y
Employee's Remuneration & Social Overhead 111,557% of Sales 38.9%
Contratual Expenses 19,745% of Revenue 5.8%
Y-O-YMiscelleaneous Expenses 13,281
% of Revenue 3.9%Y-O-Y
Operating Cost Total COGS 225,622
Gross Profit 114,465% of Revenue 33.7%
Financial Expenses Interest 909% of Total Debt
Operating Cost Overburden removal Adjustment 12,099% of Revenue 3.6%
Y-O-YOperating Cost Finacial/Commitement Charges 283
D&A Depretiation 13,154Operating Cost Impairment 319Operating Cost Provision/Write-off 445
Total Operating Cost 27,209
Operating Income Operating Income 88,165
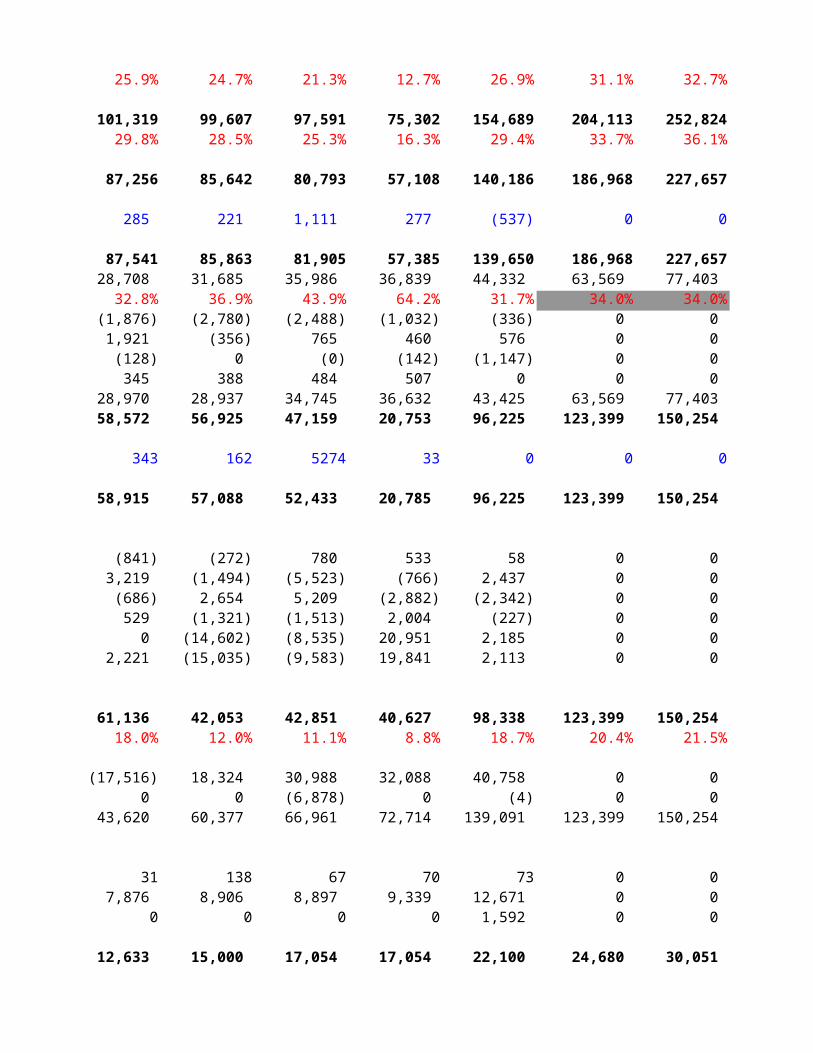
Back Coal India Limited (Income Statement)
% of Revenue 25.9%
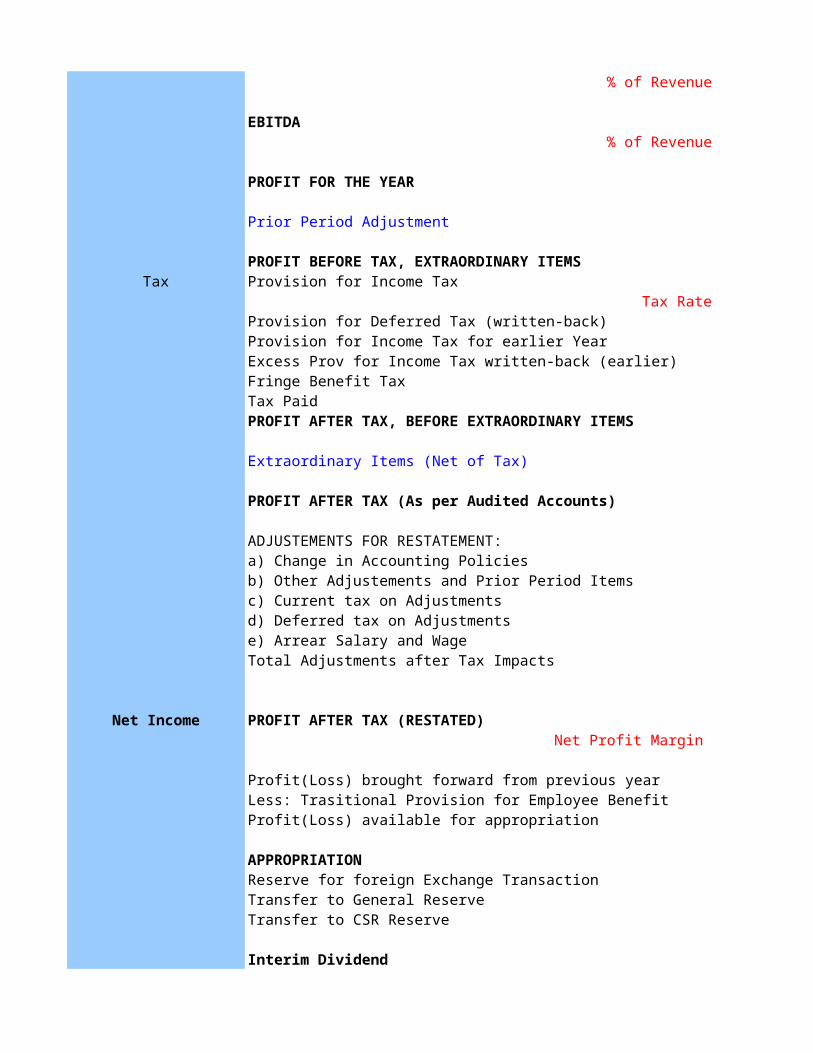
EBITDA 101,319% of Revenue 29.8%
PROFIT FOR THE YEAR 87,256
Prior Period Adjustment 285
PROFIT BEFORE TAX, EXTRAORDINARY ITEMS 87,541Tax Provision for Income Tax 28,708
Tax Rate 32.8%Provision for Deferred Tax (written-back) (1,876)Provision for Income Tax for earlier Year 1,921 Excess Prov for Income Tax written-back (earlier) (128)Fringe Benefit Tax 345 Tax Paid 28,970 PROFIT AFTER TAX, BEFORE EXTRAORDINARY ITEMS 58,572
Extraordinary Items (Net of Tax) 343
PROFIT AFTER TAX (As per Audited Accounts) 58,915
ADJUSTEMENTS FOR RESTATEMENT:a) Change in Accounting Policies (841)b) Other Adjustements and Prior Period Items 3,219 c) Current tax on Adjustments (686)d) Deferred tax on Adjustments 529 e) Arrear Salary and Wage 0 Total Adjustments after Tax Impacts 2,221
Net Income PROFIT AFTER TAX (RESTATED) 61,136 Net Profit Margin 18.0%
Profit(Loss) brought forward from previous year (17,516)Less: Trasitional Provision for Employee Benefit 0 Profit(Loss) available for appropriation 43,620
APPROPRIATIONReserve for foreign Exchange Transaction 31Transfer to General Reserve 7,876 Transfer to CSR Reserve 0
Interim Dividend 12,633
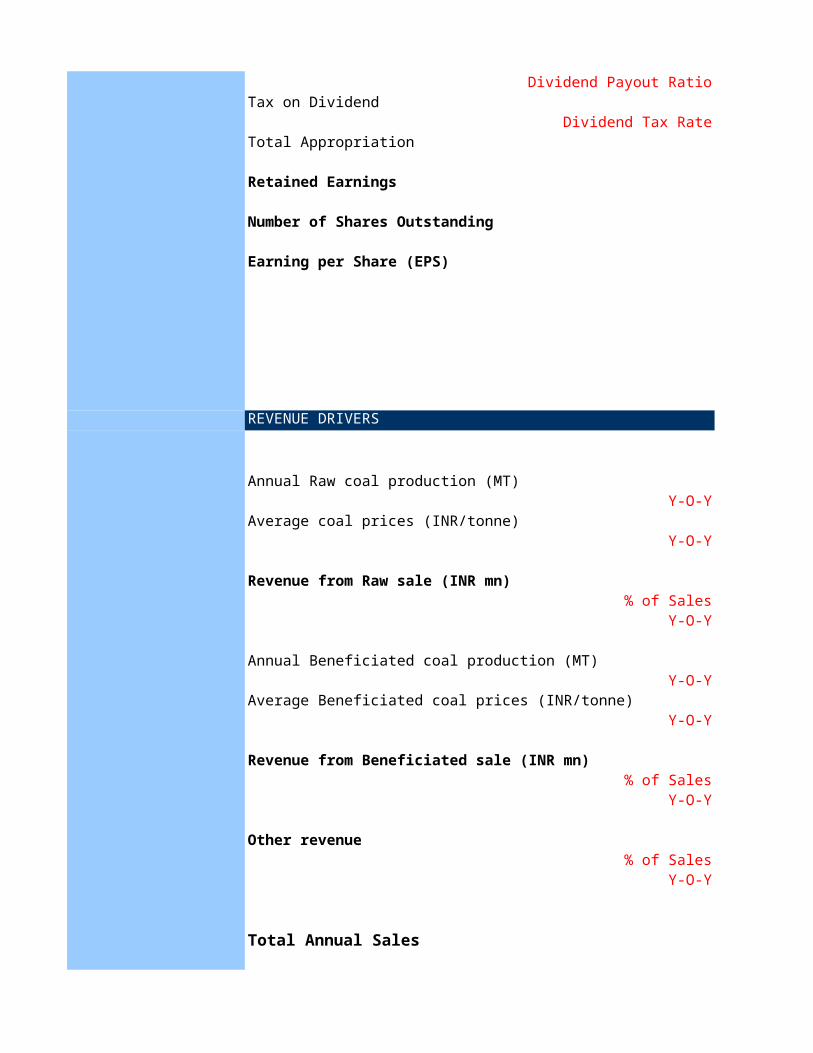
Dividend Payout Ratio 20.7%Tax on Dividend 4,756
Dividend Tax Rate 37.7%Total Appropriation 25,297
Retained Earnings 18,324
Number of Shares Outstanding 6,316
Earning per Share (EPS) 9.68
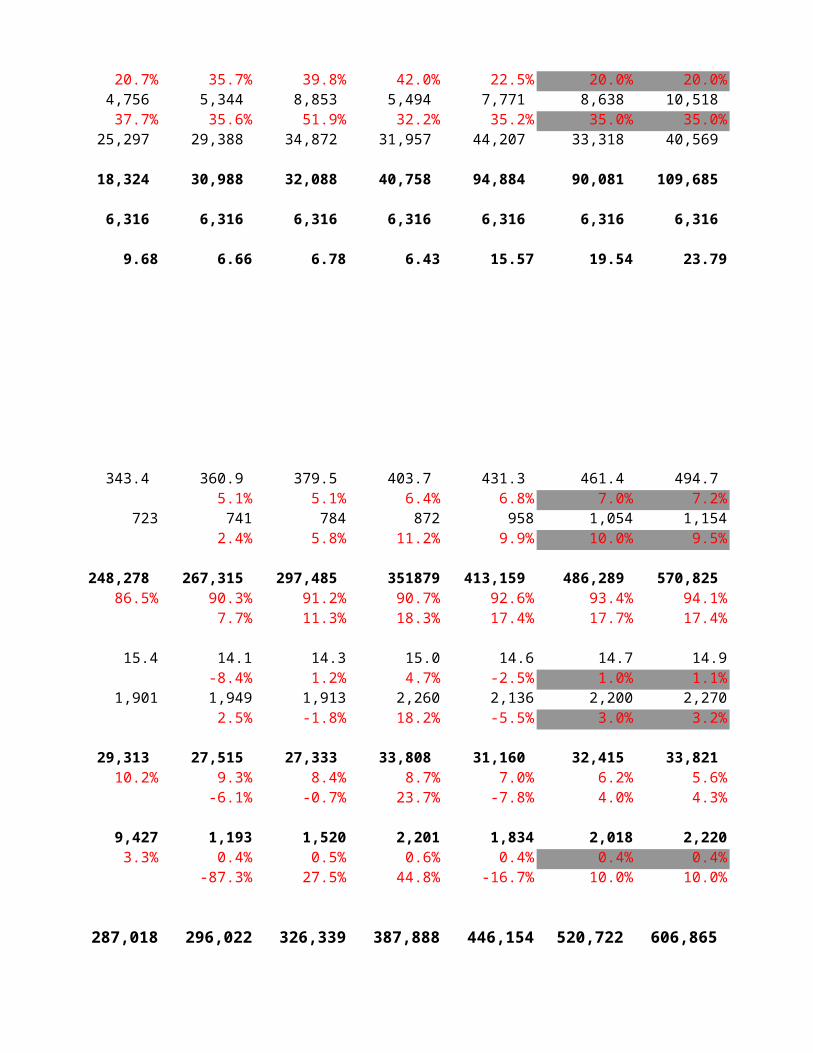
REVENUE DRIVERS
Annual Raw coal production (MT) 343.4 Y-O-Y
Average coal prices (INR/tonne) 723Y-O-Y
Revenue from Raw sale (INR mn) 248,278 % of Sales 86.5%
Y-O-Y
Annual Beneficiated coal production (MT) 15.4Y-O-Y
Average Beneficiated coal prices (INR/tonne) 1,901Y-O-Y
Revenue from Beneficiated sale (INR mn) 29,313 % of Sales 10.2%
Y-O-Y
Other revenue 9,427% of Sales 3.3%
Y-O-Y
Total Annual Sales 287,018
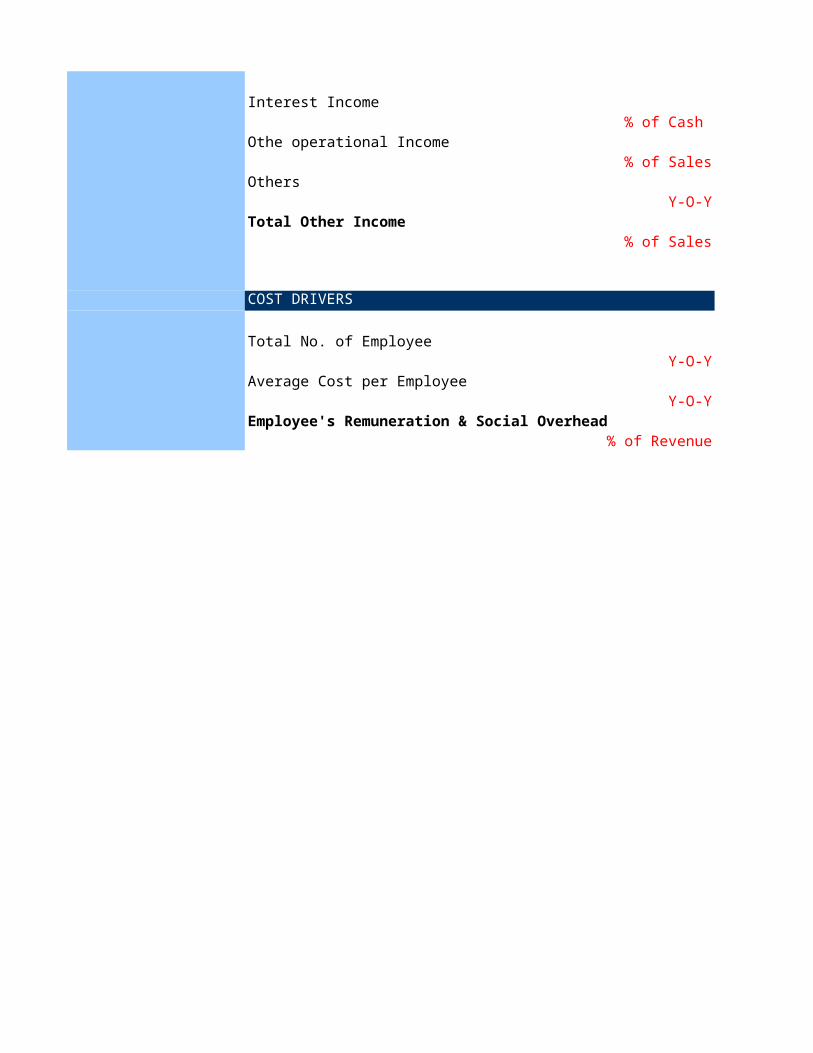
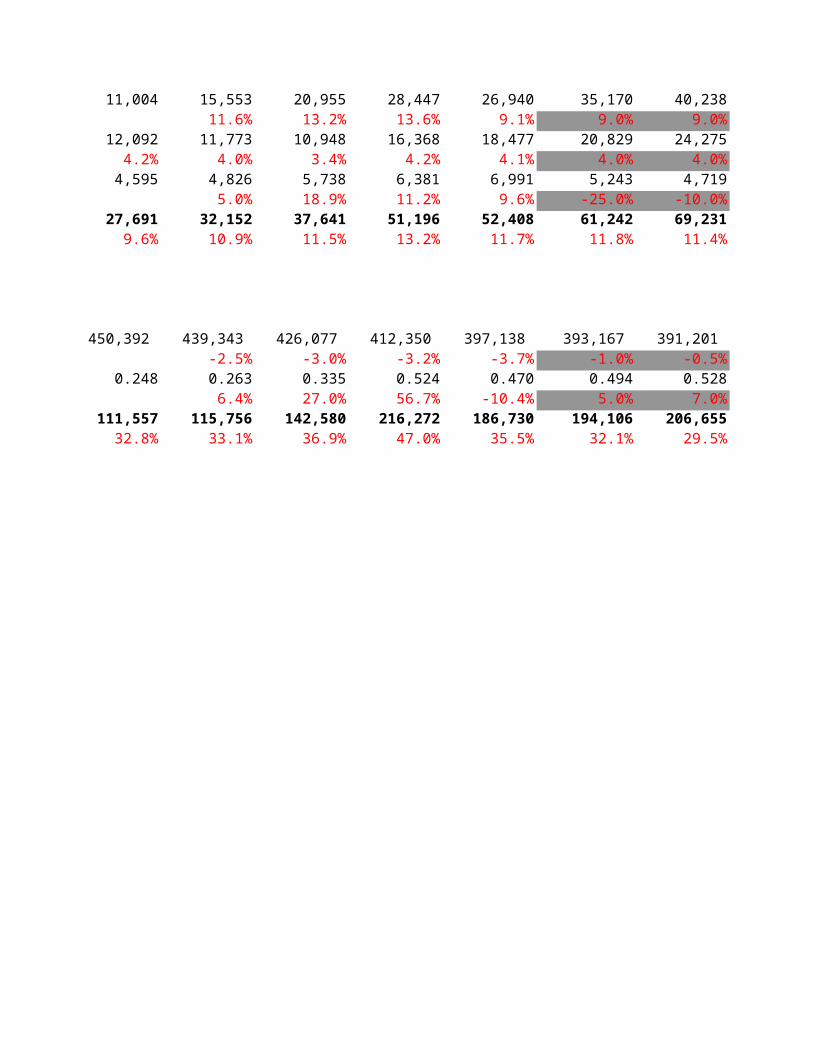
Interest Income 11,004% of Cash
Othe operational Income 12,092% of Sales 4.2%
Others 4,595Y-O-Y
Total Other Income 27,691% of Sales 9.6%
COST DRIVERS
Total No. of Employee 450,392 Y-O-Y
Average Cost per Employee 0.248Y-O-Y
Employee's Remuneration & Social Overhead 111,557% of Revenue 32.8%
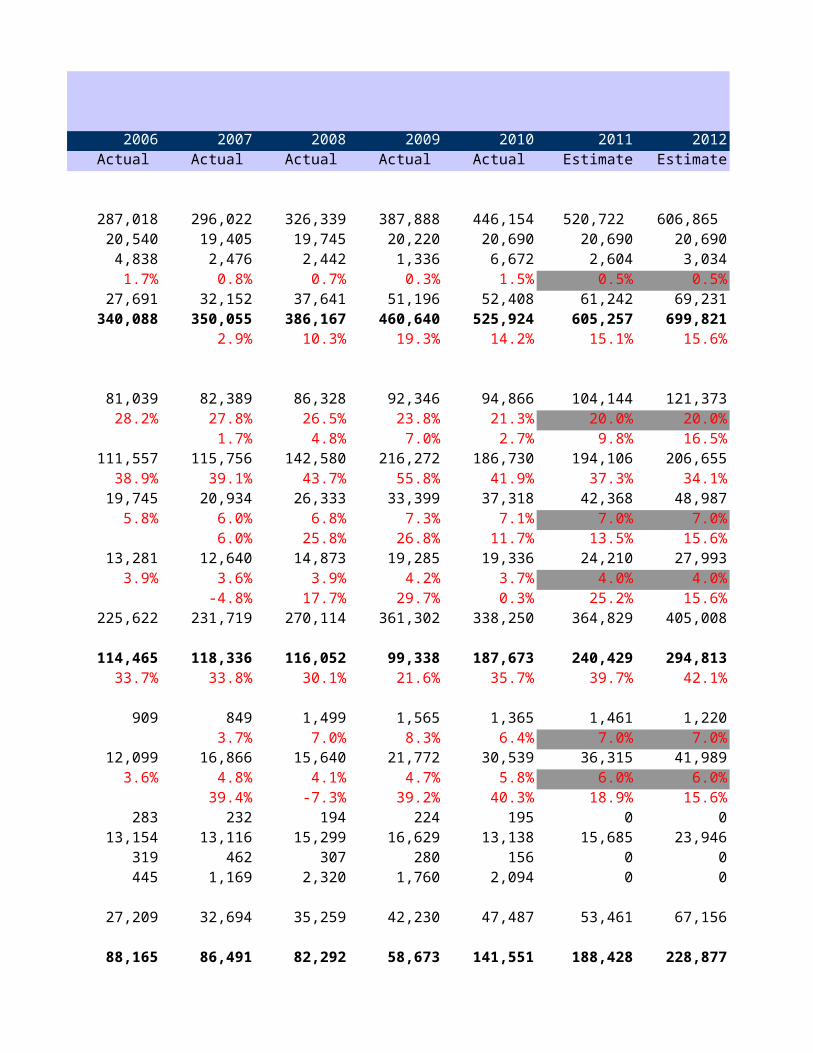
2007 2008 2009 2010 2011 2012 2013 2014Actual Actual Actual Actual Estimate Estimate Estimate Estimate
296,022 326,339 387,888 446,154 520,722 606,865 706,696 816,378 19,405 19,745 20,220 20,690 20,690 20,690 20,690 20,690
2,476 2,442 1,336 6,672 2,604 3,034 3,533 4,0820.8% 0.7% 0.3% 1.5% 0.5% 0.5% 0.5% 0.5%
32,152 37,641 51,196 52,408 61,242 69,231 87,334 109,396350,055 386,167 460,640 525,924 605,257 699,821 818,254 950,546
2.9% 10.3% 19.3% 14.2% 15.1% 15.6% 16.9% 16.2%
82,389 86,328 92,346 94,866 104,144 121,373 141,339 163,27627.8% 26.5% 23.8% 21.3% 20.0% 20.0% 20.0% 20.0%
1.7% 4.8% 7.0% 2.7% 9.8% 16.5% 16.5% 15.5%115,756 142,580 216,272 186,730 194,106 206,655 229,594 261,002
39.1% 43.7% 55.8% 41.9% 37.3% 34.1% 32.5% 32.0%20,934 26,333 33,399 37,318 42,368 48,987 57,278 66,538
6.0% 6.8% 7.3% 7.1% 7.0% 7.0% 7.0% 7.0%6.0% 25.8% 26.8% 11.7% 13.5% 15.6% 16.9% 16.2%
12,640 14,873 19,285 19,336 24,210 27,993 32,730 38,0223.6% 3.9% 4.2% 3.7% 4.0% 4.0% 4.0% 4.0%
-4.8% 17.7% 29.7% 0.3% 25.2% 15.6% 16.9% 16.2%231,719 270,114 361,302 338,250 364,829 405,008 460,941 528,838
118,336 116,052 99,338 187,673 240,429 294,813 357,313 421,70933.8% 30.1% 21.6% 35.7% 39.7% 42.1% 43.7% 44.4%
849 1,499 1,565 1,365 1,461 1,220 1,604 2,0793.7% 7.0% 8.3% 6.4% 7.0% 7.0% 7.0% 7.0%
16,866 15,640 21,772 30,539 36,315 41,989 49,095 57,0334.8% 4.1% 4.7% 5.8% 6.0% 6.0% 6.0% 6.0%
39.4% -7.3% 39.2% 40.3% 18.9% 15.6% 16.9% 16.2%232 194 224 195 0 0 0 0
13,116 15,299 16,629 13,138 15,685 23,946 25,161 26,444462 307 280 156 0 0 0 0
1,169 2,320 1,760 2,094 0 0 0 0
32,694 35,259 42,230 47,487 53,461 67,156 75,860 85,555
86,491 82,292 58,673 141,551 188,428 228,877 283,057 338,232
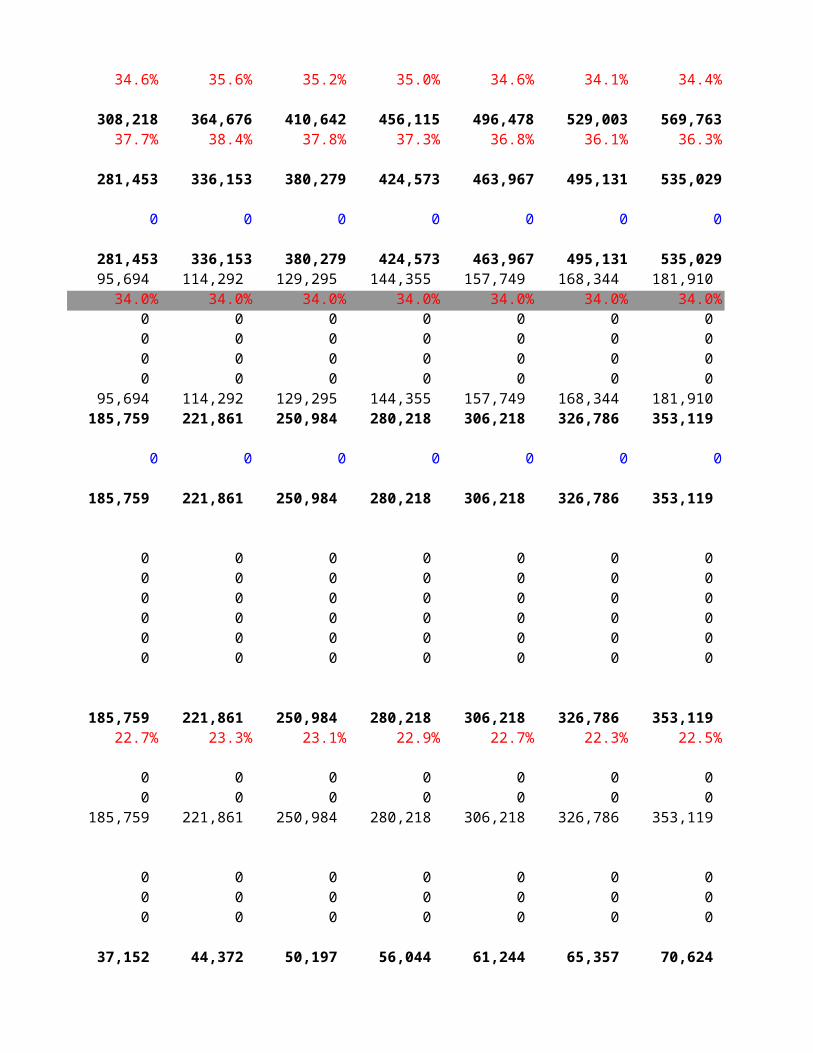
24.7% 21.3% 12.7% 26.9% 31.1% 32.7% 34.6% 35.6%
99,607 97,591 75,302 154,689 204,113 252,824 308,218 364,67628.5% 25.3% 16.3% 29.4% 33.7% 36.1% 37.7% 38.4%
85,642 80,793 57,108 140,186 186,968 227,657 281,453 336,153
221 1,111 277 (537) 0 0 0 0
85,863 81,905 57,385 139,650 186,968 227,657 281,453 336,15331,685 35,986 36,839 44,332 63,569 77,403 95,694 114,292
36.9% 43.9% 64.2% 31.7% 34.0% 34.0% 34.0% 34.0%(2,780) (2,488) (1,032) (336) 0 0 0 0
(356) 765 460 576 0 0 0 0 0 (0) (142) (1,147) 0 0 0 0
388 484 507 0 0 0 0 0 28,937 34,745 36,632 43,425 63,569 77,403 95,694 114,292 56,925 47,159 20,753 96,225 123,399 150,254 185,759 221,861
162 5274 33 0 0 0 0 0
57,088 52,433 20,785 96,225 123,399 150,254 185,759 221,861
(272) 780 533 58 0 0 0 0 (1,494) (5,523) (766) 2,437 0 0 0 0 2,654 5,209 (2,882) (2,342) 0 0 0 0
(1,321) (1,513) 2,004 (227) 0 0 0 0 (14,602) (8,535) 20,951 2,185 0 0 0 0 (15,035) (9,583) 19,841 2,113 0 0 0 0
42,053 42,851 40,627 98,338 123,399 150,254 185,759 221,861 12.0% 11.1% 8.8% 18.7% 20.4% 21.5% 22.7% 23.3%
18,324 30,988 32,088 40,758 0 0 0 0 0 (6,878) 0 (4) 0 0 0 0
60,377 66,961 72,714 139,091 123,399 150,254 185,759 221,861
138 67 70 73 0 0 0 0 8,906 8,897 9,339 12,671 0 0 0 0
0 0 0 1,592 0 0 0 0
15,000 17,054 17,054 22,100 24,680 30,051 37,152 44,372
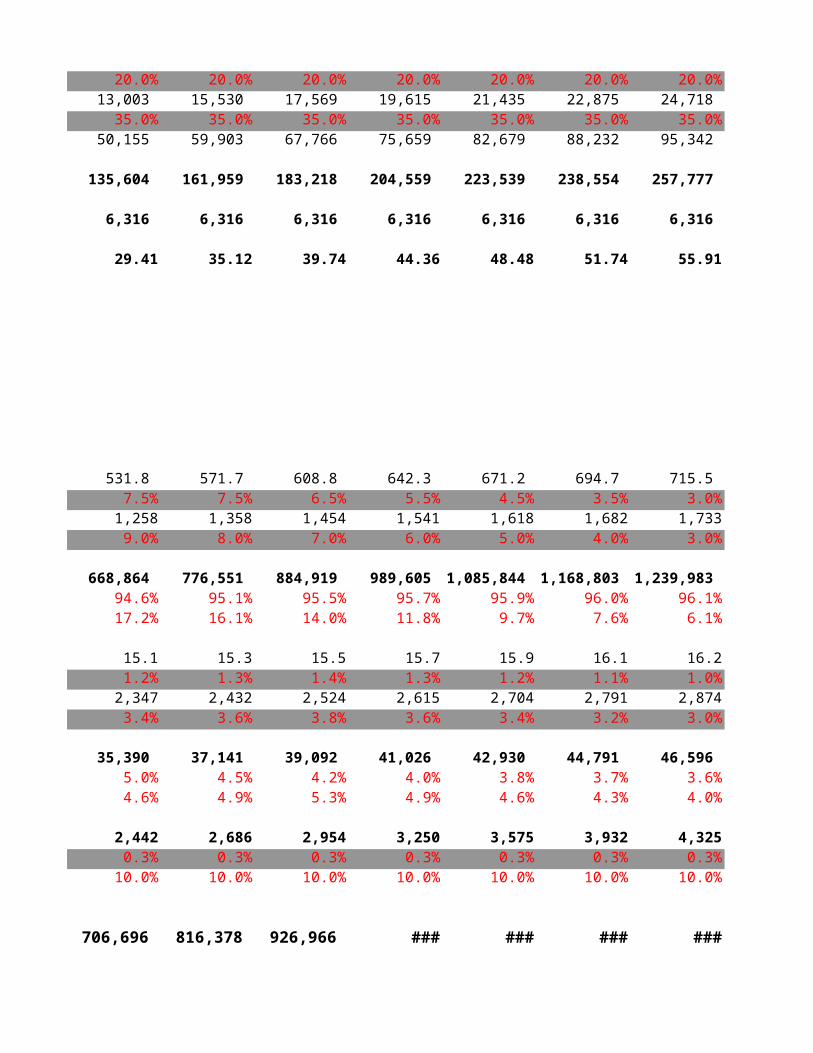
35.7% 39.8% 42.0% 22.5% 20.0% 20.0% 20.0% 20.0%5,344 8,853 5,494 7,771 8,638 10,518 13,003 15,530 35.6% 51.9% 32.2% 35.2% 35.0% 35.0% 35.0% 35.0%
29,388 34,872 31,957 44,207 33,318 40,569 50,155 59,903
30,988 32,088 40,758 94,884 90,081 109,685 135,604 161,959
6,316 6,316 6,316 6,316 6,316 6,316 6,316 6,316
6.66 6.78 6.43 15.57 19.54 23.79 29.41 35.12
360.9 379.5 403.7 431.3 461.4 494.7 531.8 571.7 5.1% 5.1% 6.4% 6.8% 7.0% 7.2% 7.5% 7.5%
741 784 872 958 1,054 1,154 1,258 1,3582.4% 5.8% 11.2% 9.9% 10.0% 9.5% 9.0% 8.0%
267,315 297,485 351879 413,159 486,289 570,825 668,864 776,551 90.3% 91.2% 90.7% 92.6% 93.4% 94.1% 94.6% 95.1%
7.7% 11.3% 18.3% 17.4% 17.7% 17.4% 17.2% 16.1%
14.1 14.3 15.0 14.6 14.7 14.9 15.1 15.3-8.4% 1.2% 4.7% -2.5% 1.0% 1.1% 1.2% 1.3%1,949 1,913 2,260 2,136 2,200 2,270 2,347 2,4322.5% -1.8% 18.2% -5.5% 3.0% 3.2% 3.4% 3.6%
27,515 27,333 33,808 31,160 32,415 33,821 35,390 37,141 9.3% 8.4% 8.7% 7.0% 6.2% 5.6% 5.0% 4.5%
-6.1% -0.7% 23.7% -7.8% 4.0% 4.3% 4.6% 4.9%
1,193 1,520 2,201 1,834 2,018 2,220 2,442 2,6860.4% 0.5% 0.6% 0.4% 0.4% 0.4% 0.3% 0.3%
-87.3% 27.5% 44.8% -16.7% 10.0% 10.0% 10.0% 10.0%
296,022 326,339 387,888 446,154 520,722 606,865 706,696 816,378
15,553 20,955 28,447 26,940 35,170 40,238 54,112 71,44011.6% 13.2% 13.6% 9.1% 9.0% 9.0% 9.0% 9.0%
11,773 10,948 16,368 18,477 20,829 24,275 28,268 32,6554.0% 3.4% 4.2% 4.1% 4.0% 4.0% 4.0% 4.0%
4,826 5,738 6,381 6,991 5,243 4,719 4,955 5,3015.0% 18.9% 11.2% 9.6% -25.0% -10.0% 5.0% 7.0%
32,152 37,641 51,196 52,408 61,242 69,231 87,334 109,39610.9% 11.5% 13.2% 11.7% 11.8% 11.4% 12.4% 13.4%
439,343 426,077 412,350 397,138 393,167 391,201 395,113 401,039 -2.5% -3.0% -3.2% -3.7% -1.0% -0.5% 1.0% 1.5%0.263 0.335 0.524 0.470 0.494 0.528 0.581 0.6516.4% 27.0% 56.7% -10.4% 5.0% 7.0% 10.0% 12.0%
115,756 142,580 216,272 186,730 194,106 206,655 229,594 261,00233.1% 36.9% 47.0% 35.5% 32.1% 29.5% 28.1% 27.5%
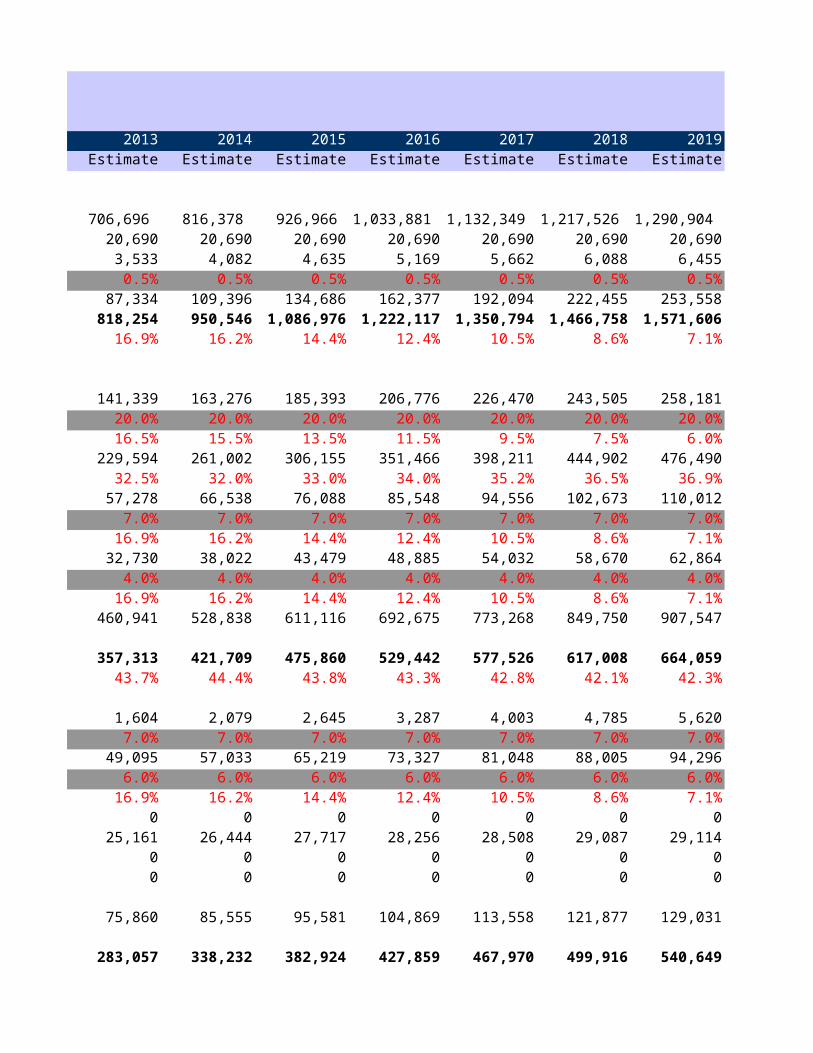
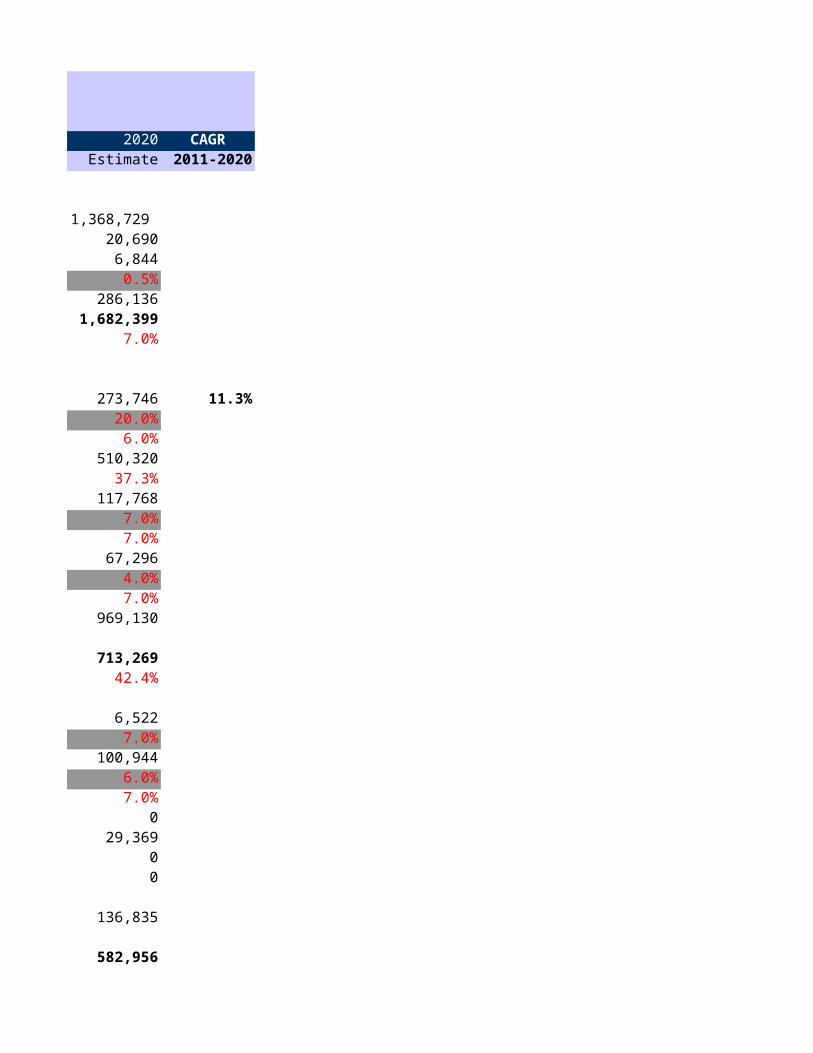
2015 2016 2017 2018 2019 2020 CAGREstimate Estimate Estimate Estimate Estimate Estimate 2011-2020
926,966 1,033,881 1,132,349 1,217,526 1,290,904 1,368,729 20,690 20,690 20,690 20,690 20,690 20,690
4,635 5,169 5,662 6,088 6,455 6,8440.5% 0.5% 0.5% 0.5% 0.5% 0.5%
134,686 162,377 192,094 222,455 253,558 286,1361,086,976 1,222,117 1,350,794 1,466,758 1,571,606 1,682,399
14.4% 12.4% 10.5% 8.6% 7.1% 7.0%
185,393 206,776 226,470 243,505 258,181 273,746 11.3%20.0% 20.0% 20.0% 20.0% 20.0% 20.0%13.5% 11.5% 9.5% 7.5% 6.0% 6.0%
306,155 351,466 398,211 444,902 476,490 510,32033.0% 34.0% 35.2% 36.5% 36.9% 37.3%
76,088 85,548 94,556 102,673 110,012 117,7687.0% 7.0% 7.0% 7.0% 7.0% 7.0%
14.4% 12.4% 10.5% 8.6% 7.1% 7.0%43,479 48,885 54,032 58,670 62,864 67,296
4.0% 4.0% 4.0% 4.0% 4.0% 4.0%14.4% 12.4% 10.5% 8.6% 7.1% 7.0%
611,116 692,675 773,268 849,750 907,547 969,130
475,860 529,442 577,526 617,008 664,059 713,26943.8% 43.3% 42.8% 42.1% 42.3% 42.4%
2,645 3,287 4,003 4,785 5,620 6,5227.0% 7.0% 7.0% 7.0% 7.0% 7.0%
65,219 73,327 81,048 88,005 94,296 100,9446.0% 6.0% 6.0% 6.0% 6.0% 6.0%
14.4% 12.4% 10.5% 8.6% 7.1% 7.0%0 0 0 0 0 0
27,717 28,256 28,508 29,087 29,114 29,3690 0 0 0 0 00 0 0 0 0 0
95,581 104,869 113,558 121,877 129,031 136,835
382,924 427,859 467,970 499,916 540,649 582,956
35.2% 35.0% 34.6% 34.1% 34.4% 34.7%
410,642 456,115 496,478 529,003 569,763 612,32537.8% 37.3% 36.8% 36.1% 36.3% 36.4%
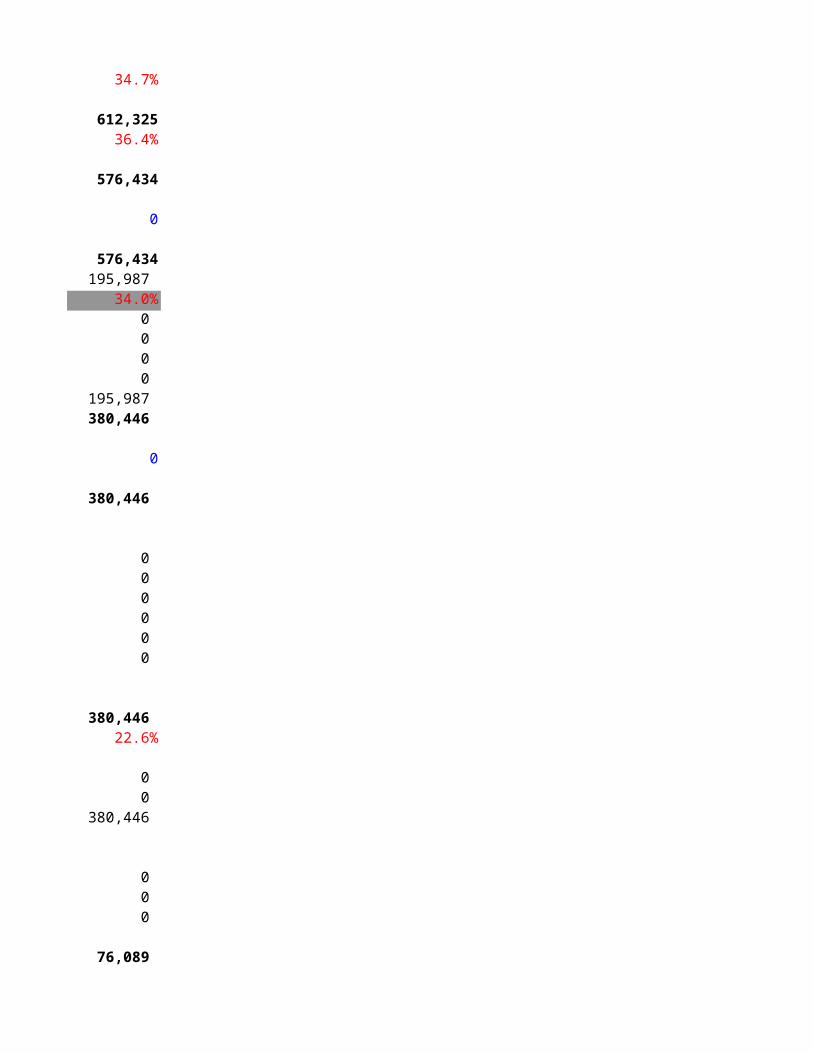
380,279 424,573 463,967 495,131 535,029 576,434
0 0 0 0 0 0
380,279 424,573 463,967 495,131 535,029 576,434129,295 144,355 157,749 168,344 181,910 195,987
34.0% 34.0% 34.0% 34.0% 34.0% 34.0%0 0 0 0 0 0 0 0 0 0 0 0 0 0 0 0 0 0 0 0 0 0 0 0
129,295 144,355 157,749 168,344 181,910 195,987 250,984 280,218 306,218 326,786 353,119 380,446
0 0 0 0 0 0
250,984 280,218 306,218 326,786 353,119 380,446
0 0 0 0 0 0 0 0 0 0 0 0 0 0 0 0 0 0 0 0 0 0 0 0 0 0 0 0 0 0 0 0 0 0 0 0
250,984 280,218 306,218 326,786 353,119 380,446 23.1% 22.9% 22.7% 22.3% 22.5% 22.6%
0 0 0 0 0 0 0 0 0 0 0 0
250,984 280,218 306,218 326,786 353,119 380,446
0 0 0 0 0 0 0 0 0 0 0 0 0 0 0 0 0 0
50,197 56,044 61,244 65,357 70,624 76,089
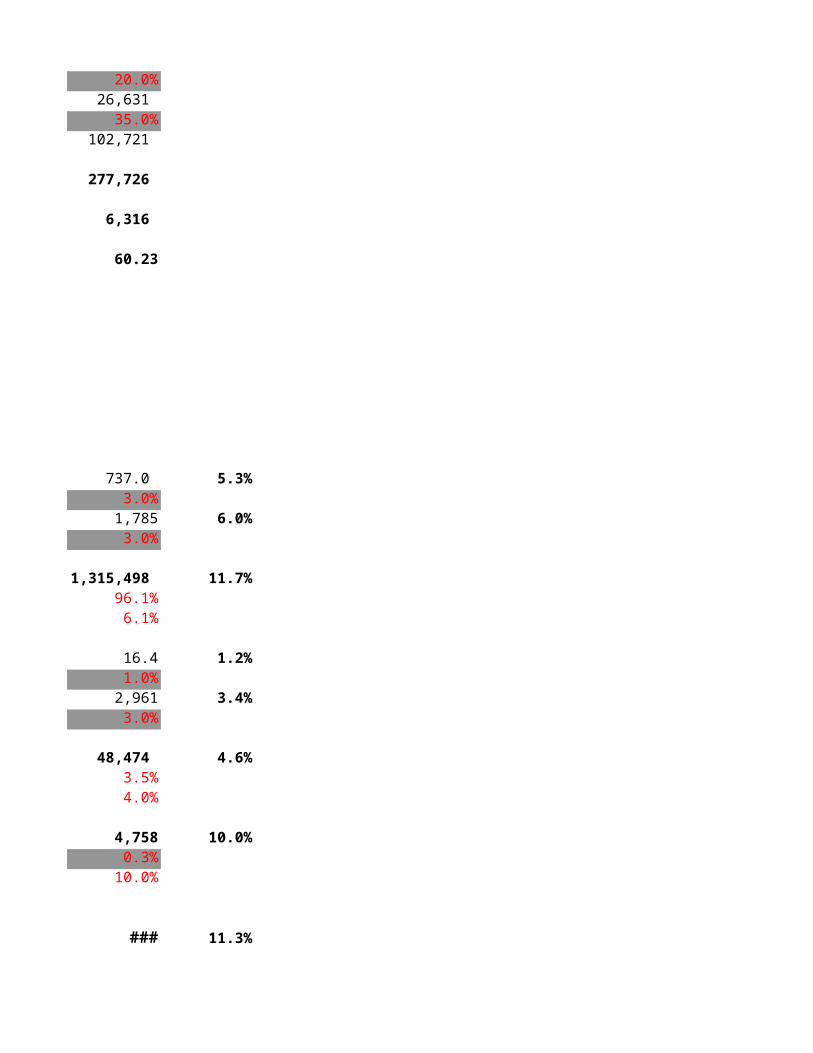
20.0% 20.0% 20.0% 20.0% 20.0% 20.0%17,569 19,615 21,435 22,875 24,718 26,631
35.0% 35.0% 35.0% 35.0% 35.0% 35.0%67,766 75,659 82,679 88,232 95,342 102,721
183,218 204,559 223,539 238,554 257,777 277,726
6,316 6,316 6,316 6,316 6,316 6,316
39.74 44.36 48.48 51.74 55.91 60.23
608.8 642.3 671.2 694.7 715.5 737.0 5.3%6.5% 5.5% 4.5% 3.5% 3.0% 3.0%
1,454 1,541 1,618 1,682 1,733 1,785 6.0%7.0% 6.0% 5.0% 4.0% 3.0% 3.0%
884,919 989,605 1,085,844 1,168,803 1,239,983 1,315,498 11.7%95.5% 95.7% 95.9% 96.0% 96.1% 96.1%14.0% 11.8% 9.7% 7.6% 6.1% 6.1%
15.5 15.7 15.9 16.1 16.2 16.4 1.2%1.4% 1.3% 1.2% 1.1% 1.0% 1.0%
2,524 2,615 2,704 2,791 2,874 2,961 3.4%3.8% 3.6% 3.4% 3.2% 3.0% 3.0%
39,092 41,026 42,930 44,791 46,596 48,474 4.6%4.2% 4.0% 3.8% 3.7% 3.6% 3.5%5.3% 4.9% 4.6% 4.3% 4.0% 4.0%
2,954 3,250 3,575 3,932 4,325 4,758 10.0%0.3% 0.3% 0.3% 0.3% 0.3% 0.3%
10.0% 10.0% 10.0% 10.0% 10.0% 10.0%
926,966 1,033,881 1,132,349 1,217,526 1,290,904 1,368,729 11.3%
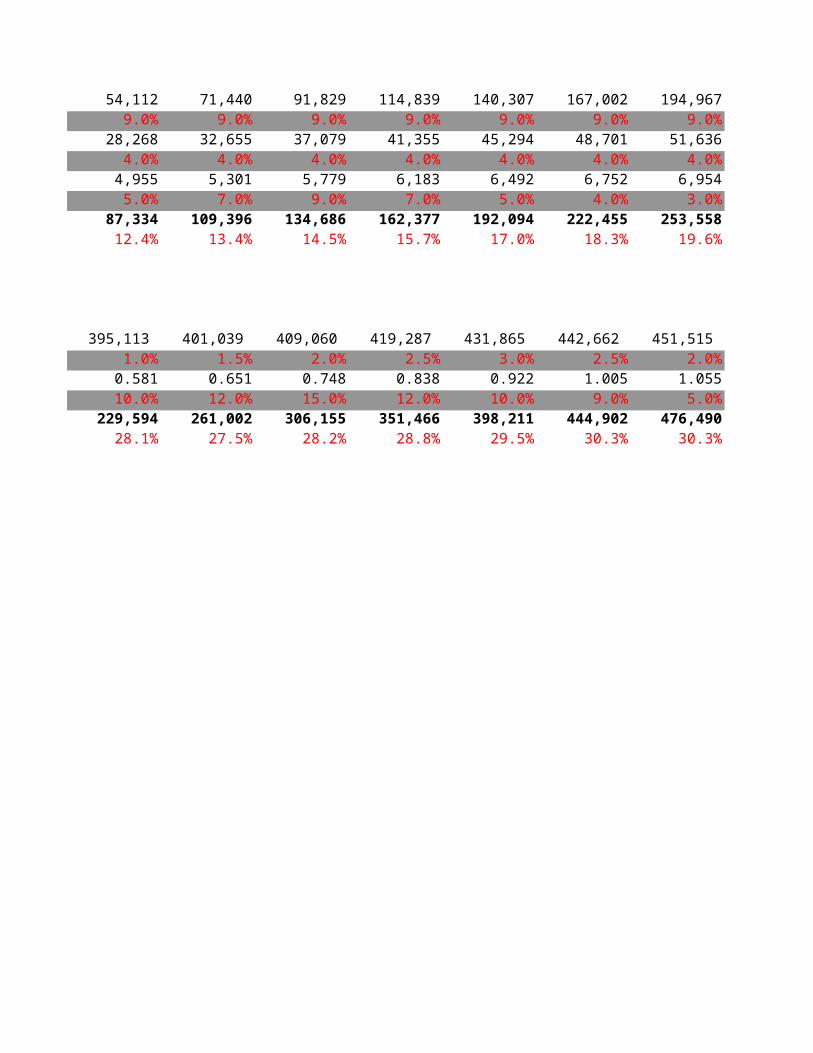
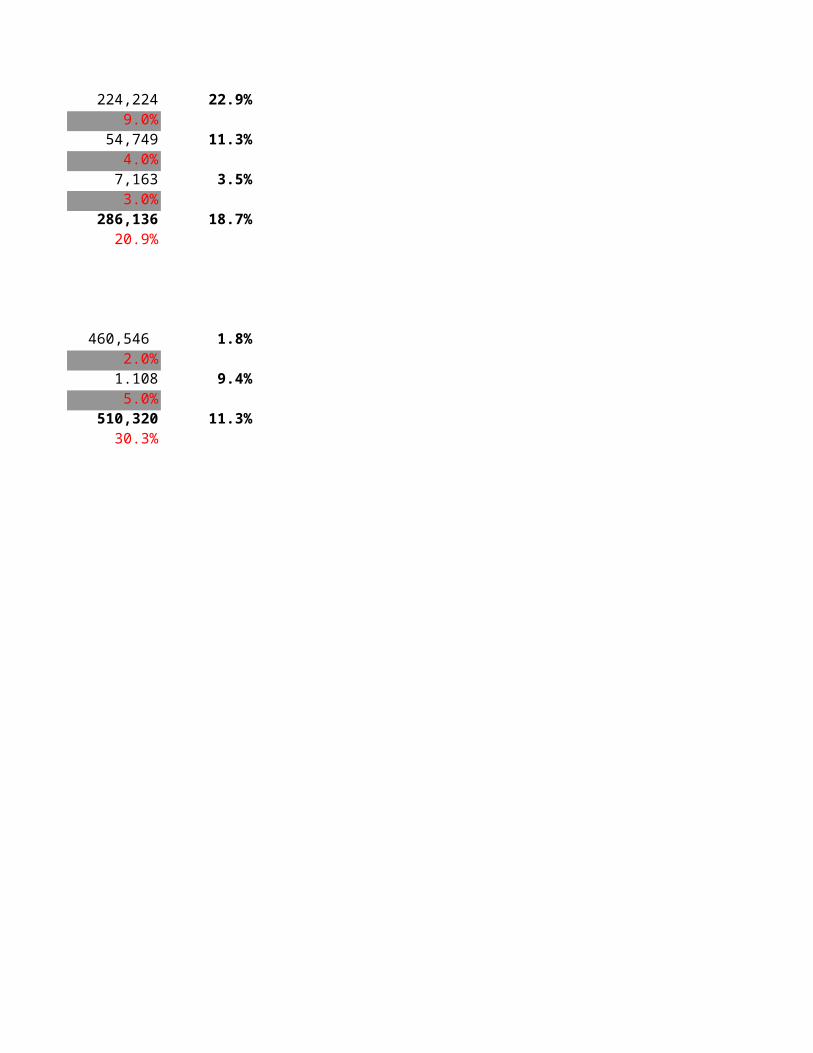
91,829 114,839 140,307 167,002 194,967 224,224 22.9%9.0% 9.0% 9.0% 9.0% 9.0% 9.0%
37,079 41,355 45,294 48,701 51,636 54,749 11.3%4.0% 4.0% 4.0% 4.0% 4.0% 4.0%
5,779 6,183 6,492 6,752 6,954 7,163 3.5%9.0% 7.0% 5.0% 4.0% 3.0% 3.0%
134,686 162,377 192,094 222,455 253,558 286,136 18.7%14.5% 15.7% 17.0% 18.3% 19.6% 20.9%
409,060 419,287 431,865 442,662 451,515 460,546 1.8%2.0% 2.5% 3.0% 2.5% 2.0% 2.0%
0.748 0.838 0.922 1.005 1.055 1.108 9.4%15.0% 12.0% 10.0% 9.0% 5.0% 5.0%
306,155 351,466 398,211 444,902 476,490 510,320 11.3%28.2% 28.8% 29.5% 30.3% 30.3% 30.3%
Reported Currency - INR (in millions)2006
Assigned Feature Particulars Actual
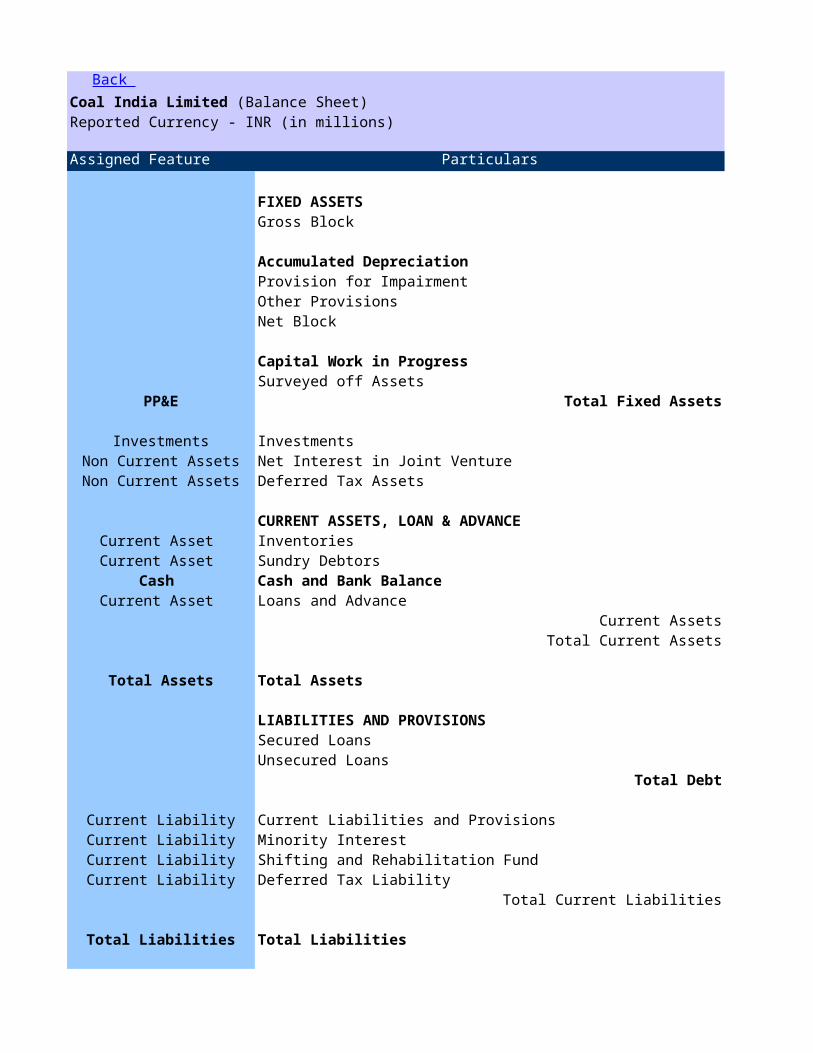
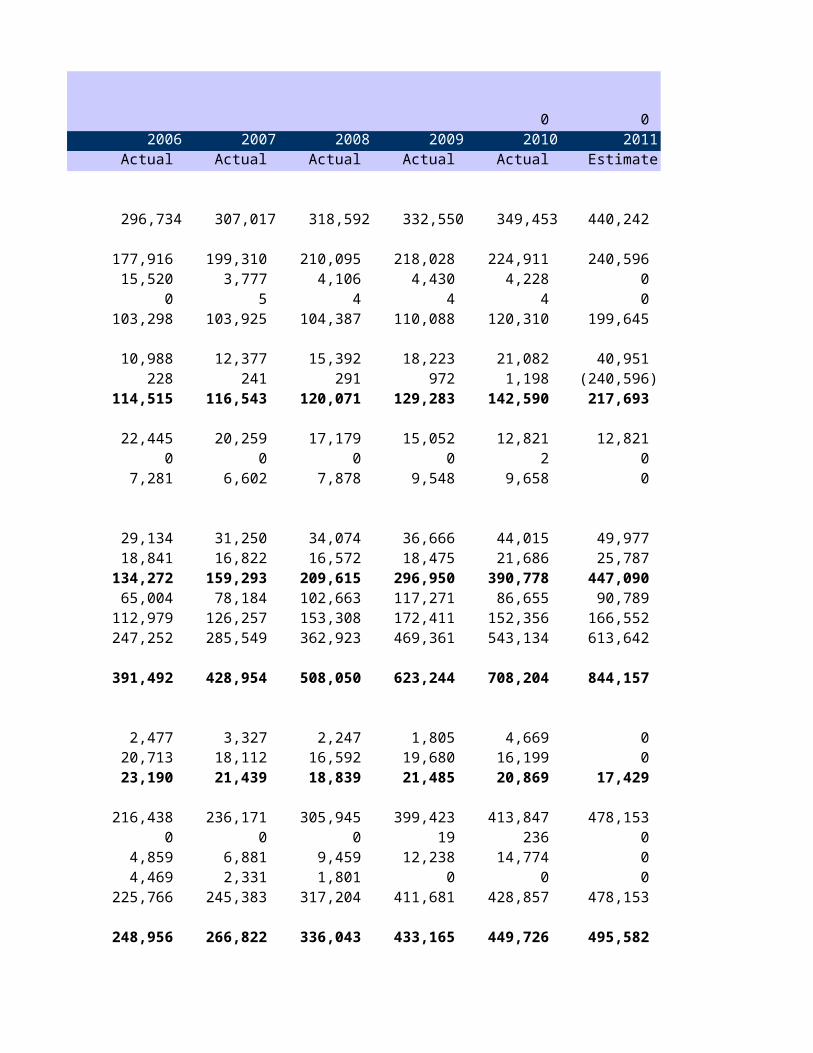
FIXED ASSETSGross Block 296,734
Accumulated Depreciation 177,916 Provision for Impairment 15,520 Other Provisions 0 Net Block 103,298
Capital Work in Progress 10,988 Surveyed off Assets 228
PP&E Total Fixed Assets 114,515
Investments Investments 22,445 Non Current Assets Net Interest in Joint Venture 0 Non Current Assets Deferred Tax Assets 7,281
CURRENT ASSETS, LOAN & ADVANCECurrent Asset Inventories 29,134 Current Asset Sundry Debtors 18,841
Cash Cash and Bank Balance 134,272 Current Asset Loans and Advance 65,004
Current Assets 112,979 Total Current Assets 247,252
Total Assets Total Assets 391,492
LIABILITIES AND PROVISIONSSecured Loans 2,477 Unsecured Loans 20,713
Total Debt 23,190
Current Liability Current Liabilities and Provisions 216,438 Current Liability Minority Interest 0 Current Liability Shifting and Rehabilitation Fund 4,859 Current Liability Deferred Tax Liability 4,469
Total Current Liabilities 225,766
Total Liabilities Total Liabilities 248,956
Back Coal India Limited (Balance Sheet)
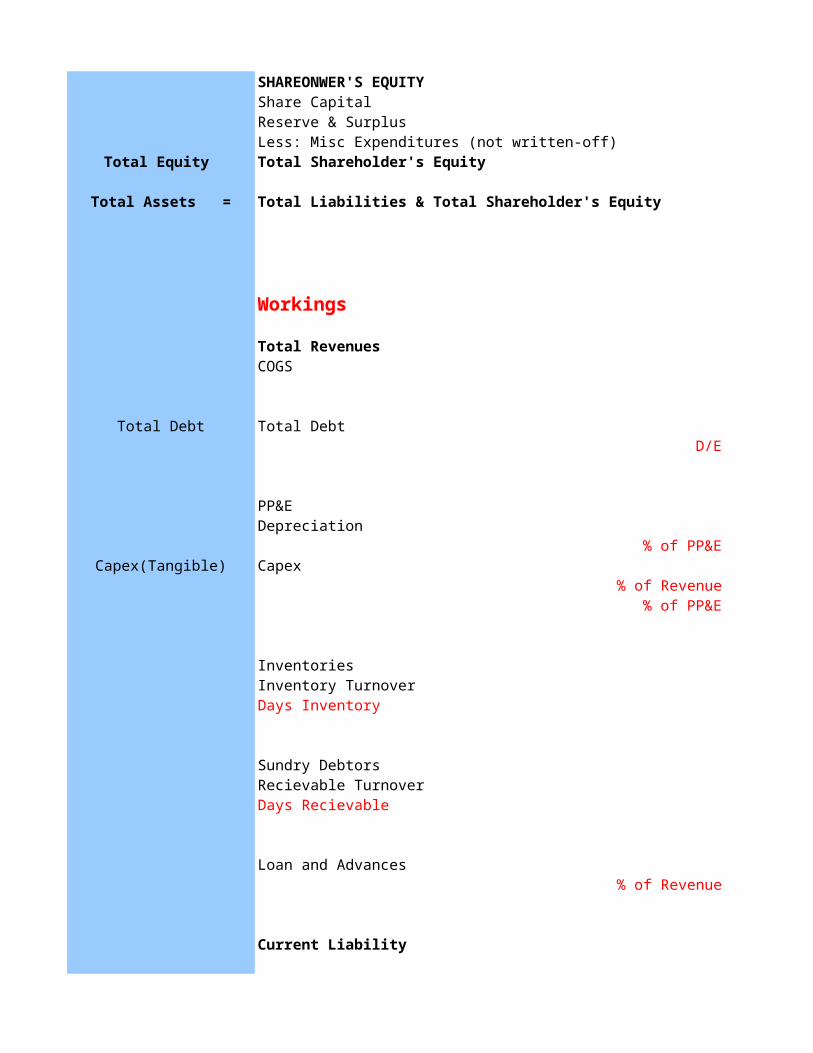
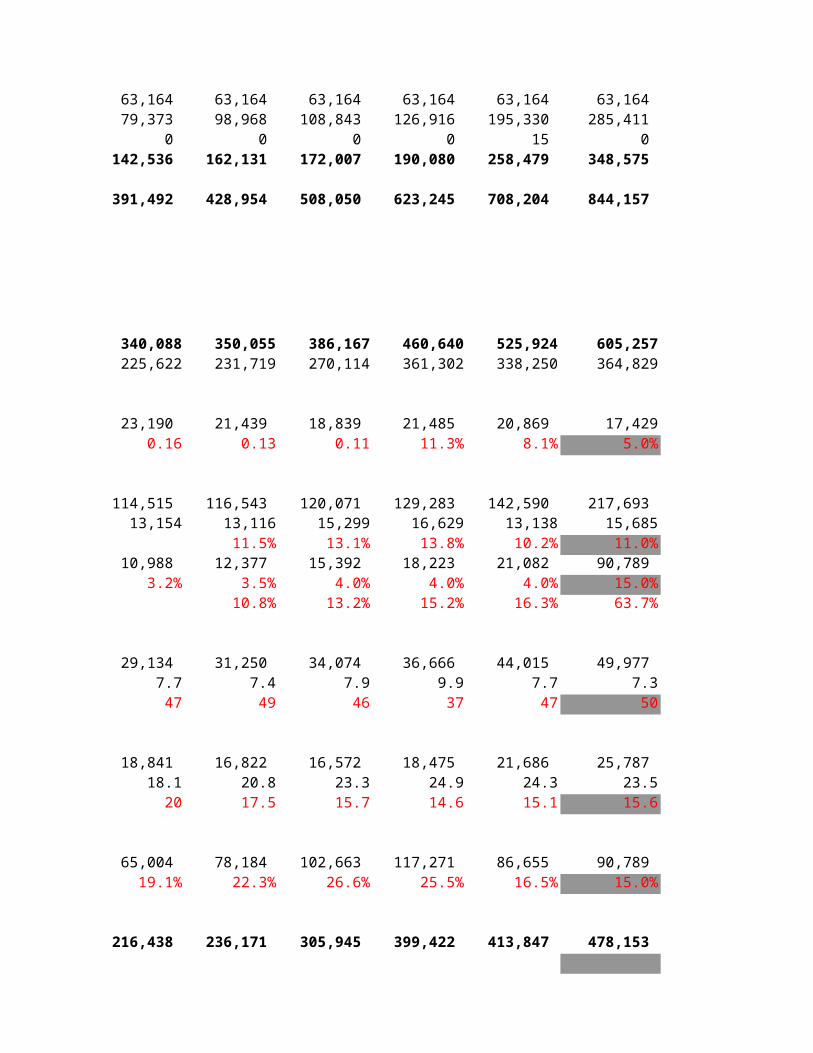
SHAREONWER'S EQUITYShare Capital 63,164 Reserve & Surplus 79,373 Less: Misc Expenditures (not written-off) 0
Total Equity Total Shareholder's Equity 142,536
Total Assets = Total Liabilities & Total Shareholder's Equity 391,492
Workings
Total Revenues 340,088COGS 225,622
Total Debt Total Debt 23,190 D/E 0.16
PP&E 114,515 Depreciation 13,154
% of PP&ECapex(Tangible) Capex 10,988
% of Revenue 3.2%% of PP&E
Inventories 29,134 Inventory Turnover 7.7Days Inventory 47
Sundry Debtors 18,841 Recievable Turnover 18.1Days Recievable 20
Loan and Advances 65,004 % of Revenue 19.1%
Current Liability 216,438
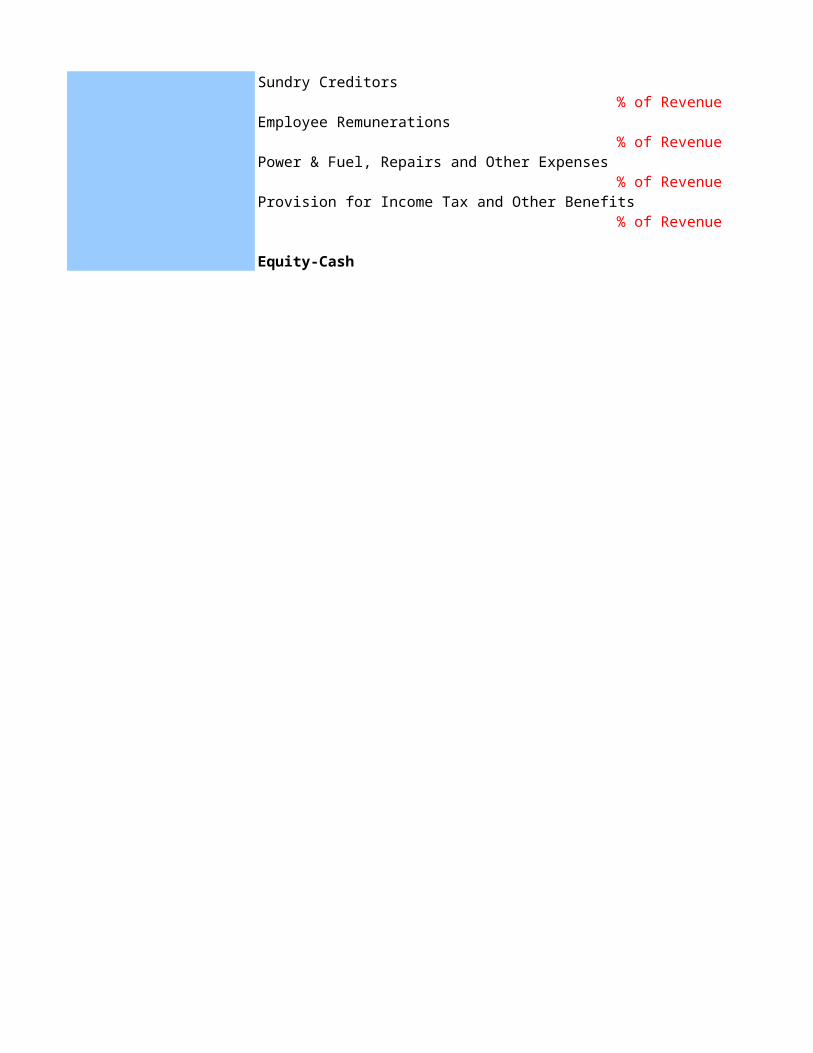
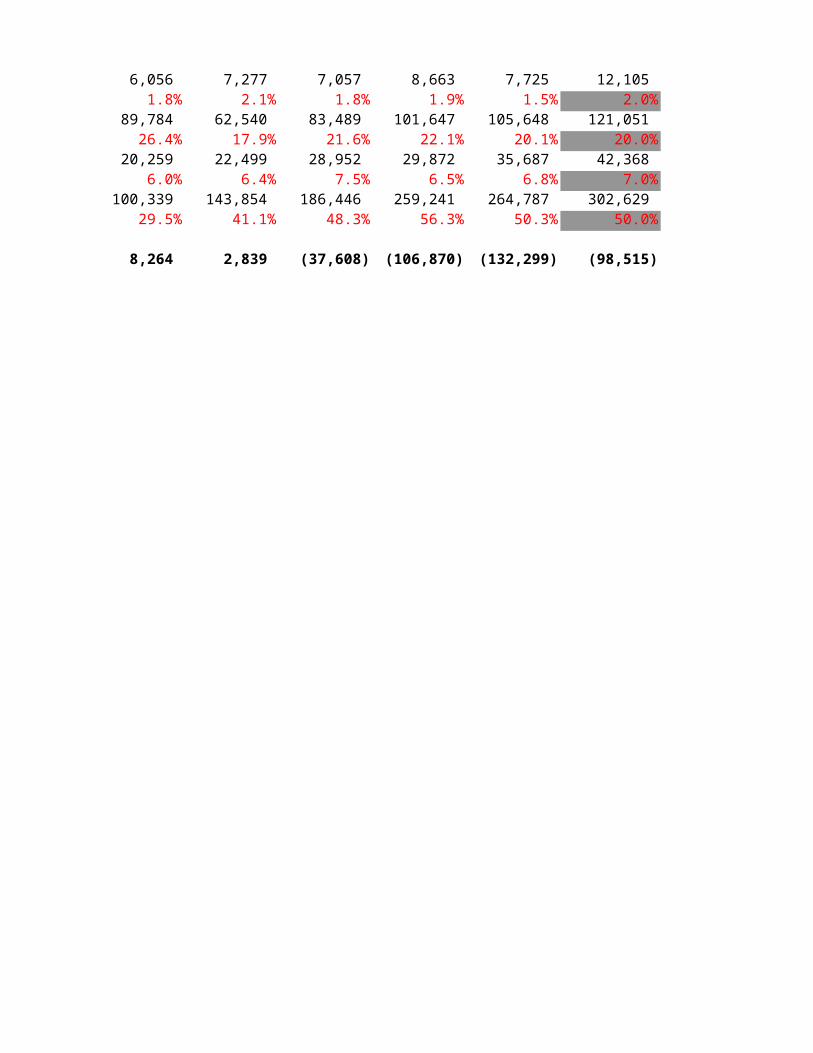
Sundry Creditors 6,056 % of Revenue 1.8%
Employee Remunerations 89,784 % of Revenue 26.4%
Power & Fuel, Repairs and Other Expenses 20,259 % of Revenue 6.0%
Provision for Income Tax and Other Benefits 100,339 % of Revenue 29.5%
Equity-Cash 8,264
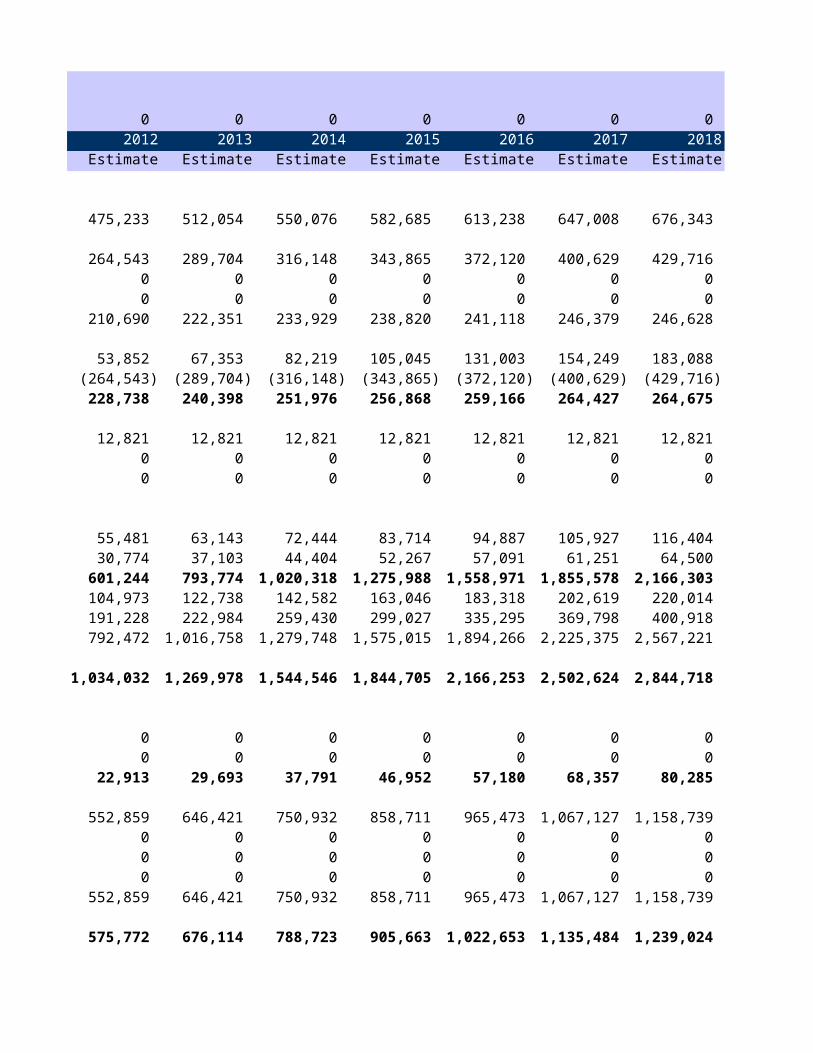
0 0 0 0 0 2007 2008 2009 2010 2011 2012 2013 2014
Actual Actual Actual Actual Estimate Estimate Estimate Estimate
307,017 318,592 332,550 349,453 440,242 475,233 512,054 550,076
199,310 210,095 218,028 224,911 240,596 264,543 289,704 316,148 3,777 4,106 4,430 4,228 0 0 0 0
5 4 4 4 0 0 0 0 103,925 104,387 110,088 120,310 199,645 210,690 222,351 233,929
12,377 15,392 18,223 21,082 40,951 53,852 67,353 82,219 241 291 972 1,198 (240,596) (264,543) (289,704) (316,148)
116,543 120,071 129,283 142,590 217,693 228,738 240,398 251,976
20,259 17,179 15,052 12,821 12,821 12,821 12,821 12,821 0 0 0 2 0 0 0 0
6,602 7,878 9,548 9,658 0 0 0 0
31,250 34,074 36,666 44,015 49,977 55,481 63,143 72,444 16,822 16,572 18,475 21,686 25,787 30,774 37,103 44,404
159,293 209,615 296,950 390,778 447,090 601,244 793,774 1,020,318 78,184 102,663 117,271 86,655 90,789 104,973 122,738 142,582
126,257 153,308 172,411 152,356 166,552 191,228 222,984 259,430 285,549 362,923 469,361 543,134 613,642 792,472 1,016,758 1,279,748
428,954 508,050 623,244 708,204 844,157 1,034,032 1,269,978 1,544,546
3,327 2,247 1,805 4,669 0 0 0 0 18,112 16,592 19,680 16,199 0 0 0 0 21,439 18,839 21,485 20,869 17,429 22,913 29,693 37,791
236,171 305,945 399,423 413,847 478,153 552,859 646,421 750,932 0 0 19 236 0 0 0 0
6,881 9,459 12,238 14,774 0 0 0 0 2,331 1,801 0 0 0 0 0 0
245,383 317,204 411,681 428,857 478,153 552,859 646,421 750,932
266,822 336,043 433,165 449,726 495,582 575,772 676,114 788,723
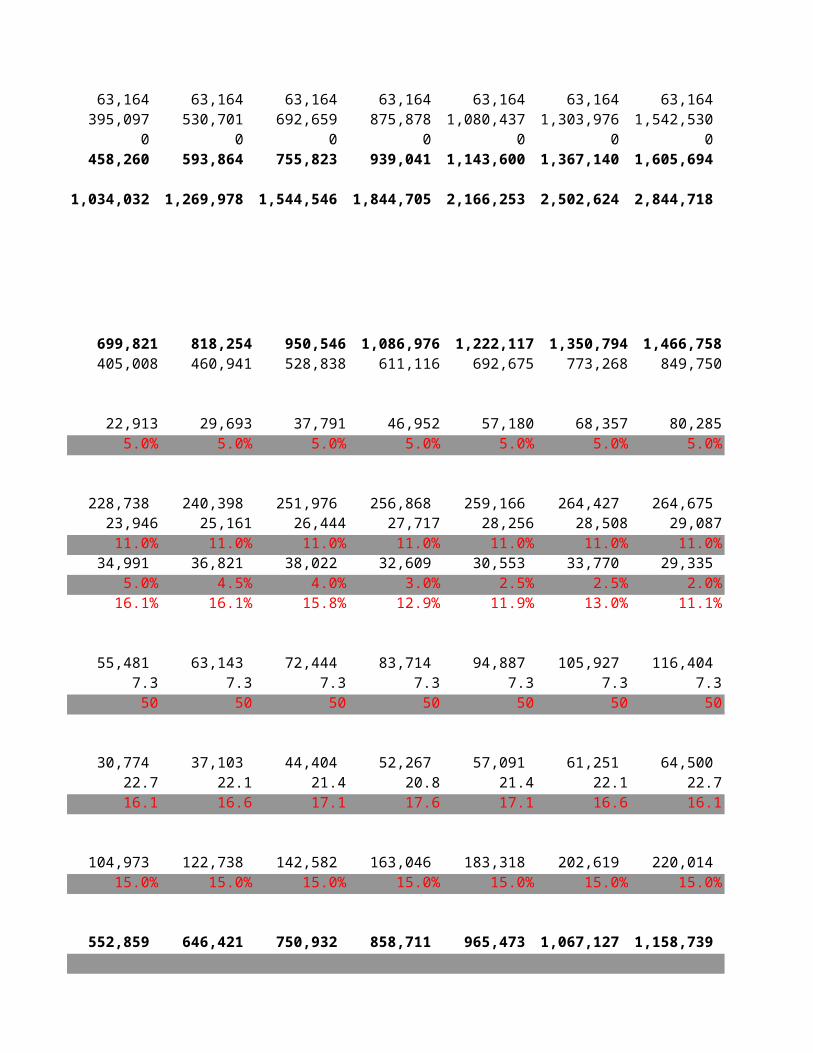
63,164 63,164 63,164 63,164 63,164 63,164 63,164 63,164 98,968 108,843 126,916 195,330 285,411 395,097 530,701 692,659
0 0 0 15 0 0 0 0 162,131 172,007 190,080 258,479 348,575 458,260 593,864 755,823
428,954 508,050 623,245 708,204 844,157 1,034,032 1,269,978 1,544,546
350,055 386,167 460,640 525,924 605,257 699,821 818,254 950,546231,719 270,114 361,302 338,250 364,829 405,008 460,941 528,838
21,439 18,839 21,485 20,869 17,429 22,913 29,693 37,7910.13 0.11 11.3% 8.1% 5.0% 5.0% 5.0% 5.0%
116,543 120,071 129,283 142,590 217,693 228,738 240,398 251,976 13,116 15,299 16,629 13,138 15,685 23,946 25,161 26,44411.5% 13.1% 13.8% 10.2% 11.0% 11.0% 11.0% 11.0%
12,377 15,392 18,223 21,082 90,789 34,991 36,821 38,022 3.5% 4.0% 4.0% 4.0% 15.0% 5.0% 4.5% 4.0%
10.8% 13.2% 15.2% 16.3% 63.7% 16.1% 16.1% 15.8%
31,250 34,074 36,666 44,015 49,977 55,481 63,143 72,444 7.4 7.9 9.9 7.7 7.3 7.3 7.3 7.349 46 37 47 50 50 50 50
16,822 16,572 18,475 21,686 25,787 30,774 37,103 44,404 20.8 23.3 24.9 24.3 23.5 22.7 22.1 21.417.5 15.7 14.6 15.1 15.6 16.1 16.6 17.1
78,184 102,663 117,271 86,655 90,789 104,973 122,738 142,582 22.3% 26.6% 25.5% 16.5% 15.0% 15.0% 15.0% 15.0%
236,171 305,945 399,422 413,847 478,153 552,859 646,421 750,932
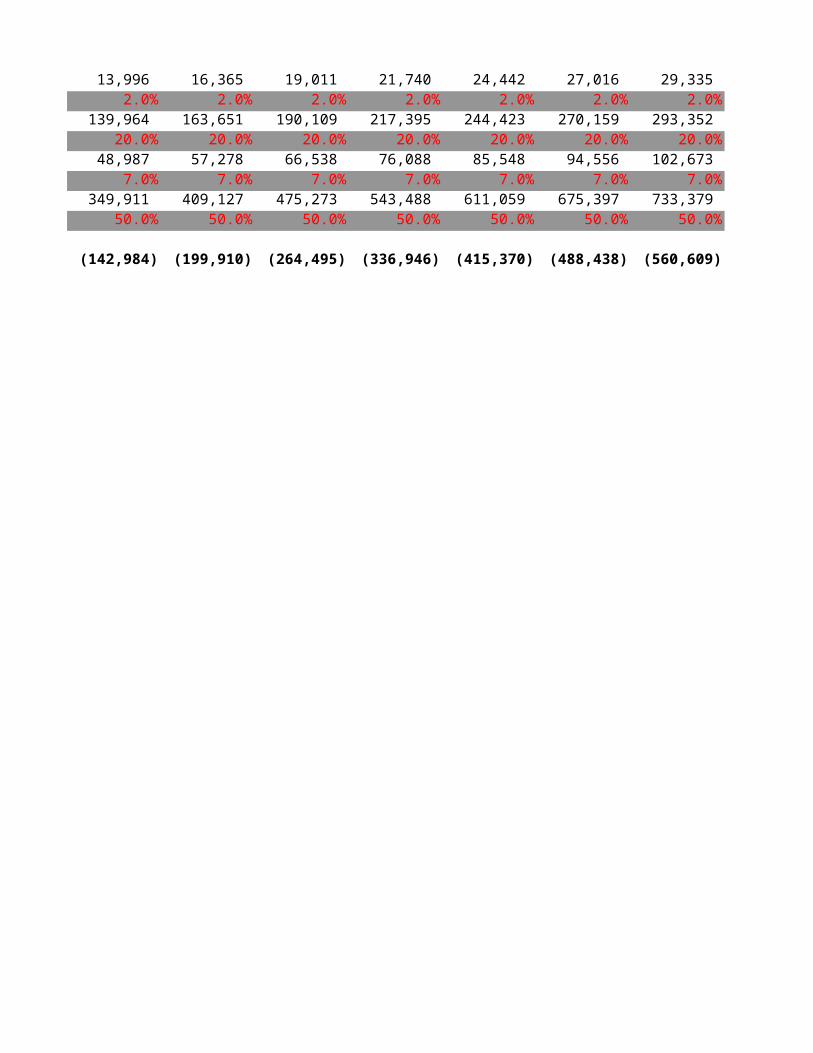
7,277 7,057 8,663 7,725 12,105 13,996 16,365 19,011 2.1% 1.8% 1.9% 1.5% 2.0% 2.0% 2.0% 2.0%
62,540 83,489 101,647 105,648 121,051 139,964 163,651 190,109 17.9% 21.6% 22.1% 20.1% 20.0% 20.0% 20.0% 20.0%
22,499 28,952 29,872 35,687 42,368 48,987 57,278 66,538 6.4% 7.5% 6.5% 6.8% 7.0% 7.0% 7.0% 7.0%
143,854 186,446 259,241 264,787 302,629 349,911 409,127 475,273 41.1% 48.3% 56.3% 50.3% 50.0% 50.0% 50.0% 50.0%
2,839 (37,608) (106,870) (132,299) (98,515) (142,984) (199,910) (264,495)
0 0 0 0 0 0 2015 2016 2017 2018 2019 2020
Estimate Estimate Estimate Estimate Estimate Estimate
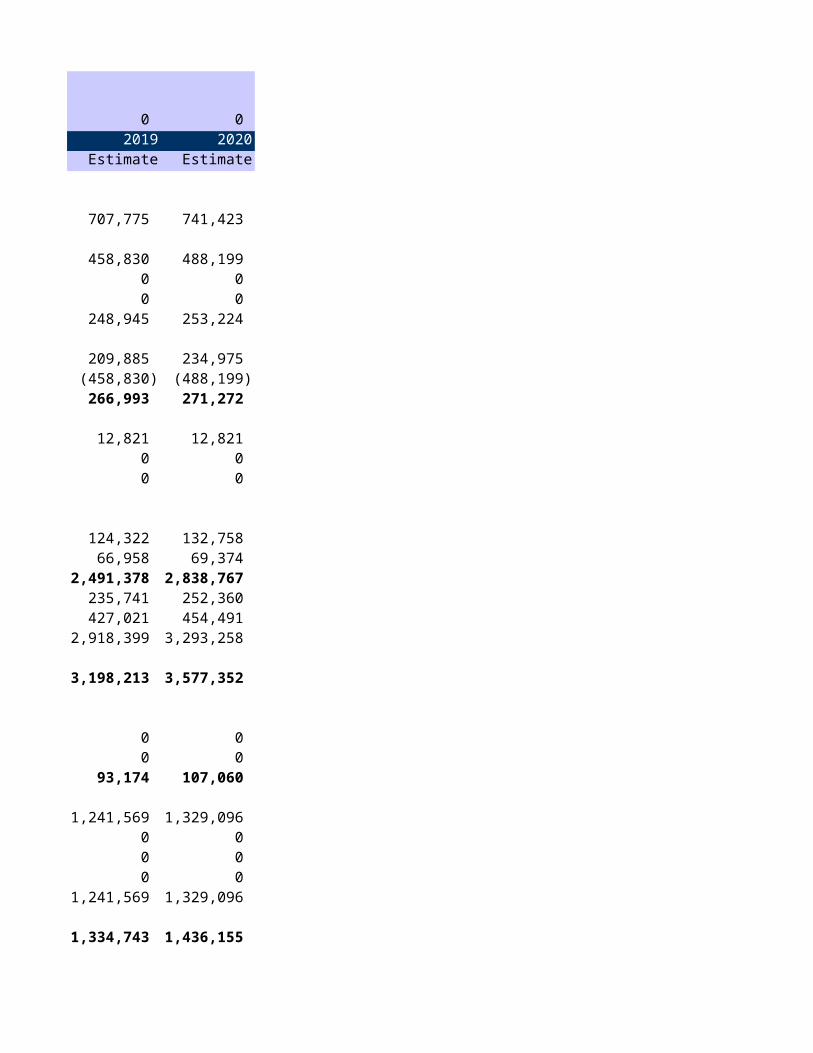
582,685 613,238 647,008 676,343 707,775 741,423
343,865 372,120 400,629 429,716 458,830 488,199 0 0 0 0 0 0 0 0 0 0 0 0
238,820 241,118 246,379 246,628 248,945 253,224
105,045 131,003 154,249 183,088 209,885 234,975 (343,865) (372,120) (400,629) (429,716) (458,830) (488,199)256,868 259,166 264,427 264,675 266,993 271,272
12,821 12,821 12,821 12,821 12,821 12,821 0 0 0 0 0 0 0 0 0 0 0 0
83,714 94,887 105,927 116,404 124,322 132,758 52,267 57,091 61,251 64,500 66,958 69,374
1,275,988 1,558,971 1,855,578 2,166,303 2,491,378 2,838,767 163,046 183,318 202,619 220,014 235,741 252,360 299,027 335,295 369,798 400,918 427,021 454,491
1,575,015 1,894,266 2,225,375 2,567,221 2,918,399 3,293,258
1,844,705 2,166,253 2,502,624 2,844,718 3,198,213 3,577,352
0 0 0 0 0 0 0 0 0 0 0 0
46,952 57,180 68,357 80,285 93,174 107,060
858,711 965,473 1,067,127 1,158,739 1,241,569 1,329,096 0 0 0 0 0 0 0 0 0 0 0 0 0 0 0 0 0 0
858,711 965,473 1,067,127 1,158,739 1,241,569 1,329,096
905,663 1,022,653 1,135,484 1,239,024 1,334,743 1,436,155
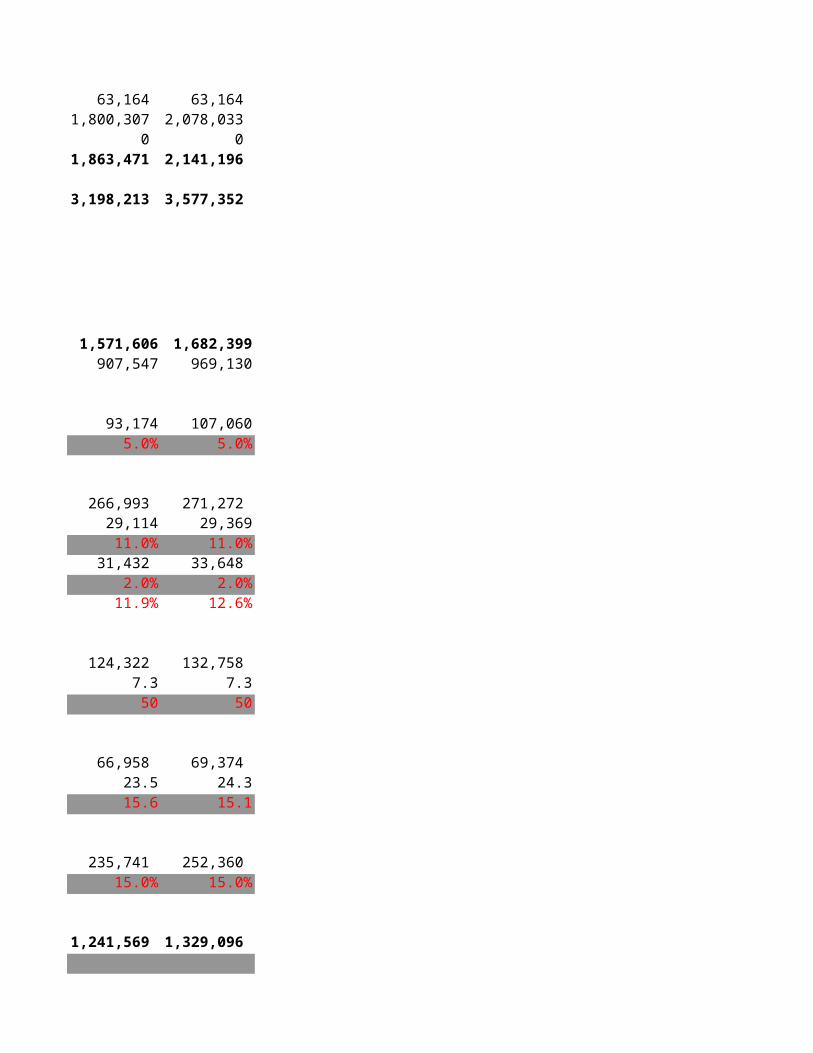
63,164 63,164 63,164 63,164 63,164 63,164 875,878 1,080,437 1,303,976 1,542,530 1,800,307 2,078,033
0 0 0 0 0 0 939,041 1,143,600 1,367,140 1,605,694 1,863,471 2,141,196
1,844,705 2,166,253 2,502,624 2,844,718 3,198,213 3,577,352
1,086,976 1,222,117 1,350,794 1,466,758 1,571,606 1,682,399611,116 692,675 773,268 849,750 907,547 969,130
46,952 57,180 68,357 80,285 93,174 107,0605.0% 5.0% 5.0% 5.0% 5.0% 5.0%
256,868 259,166 264,427 264,675 266,993 271,272 27,717 28,256 28,508 29,087 29,114 29,36911.0% 11.0% 11.0% 11.0% 11.0% 11.0%
32,609 30,553 33,770 29,335 31,432 33,648 3.0% 2.5% 2.5% 2.0% 2.0% 2.0%
12.9% 11.9% 13.0% 11.1% 11.9% 12.6%
83,714 94,887 105,927 116,404 124,322 132,758 7.3 7.3 7.3 7.3 7.3 7.350 50 50 50 50 50
52,267 57,091 61,251 64,500 66,958 69,374 20.8 21.4 22.1 22.7 23.5 24.317.6 17.1 16.6 16.1 15.6 15.1
163,046 183,318 202,619 220,014 235,741 252,360 15.0% 15.0% 15.0% 15.0% 15.0% 15.0%
858,711 965,473 1,067,127 1,158,739 1,241,569 1,329,096
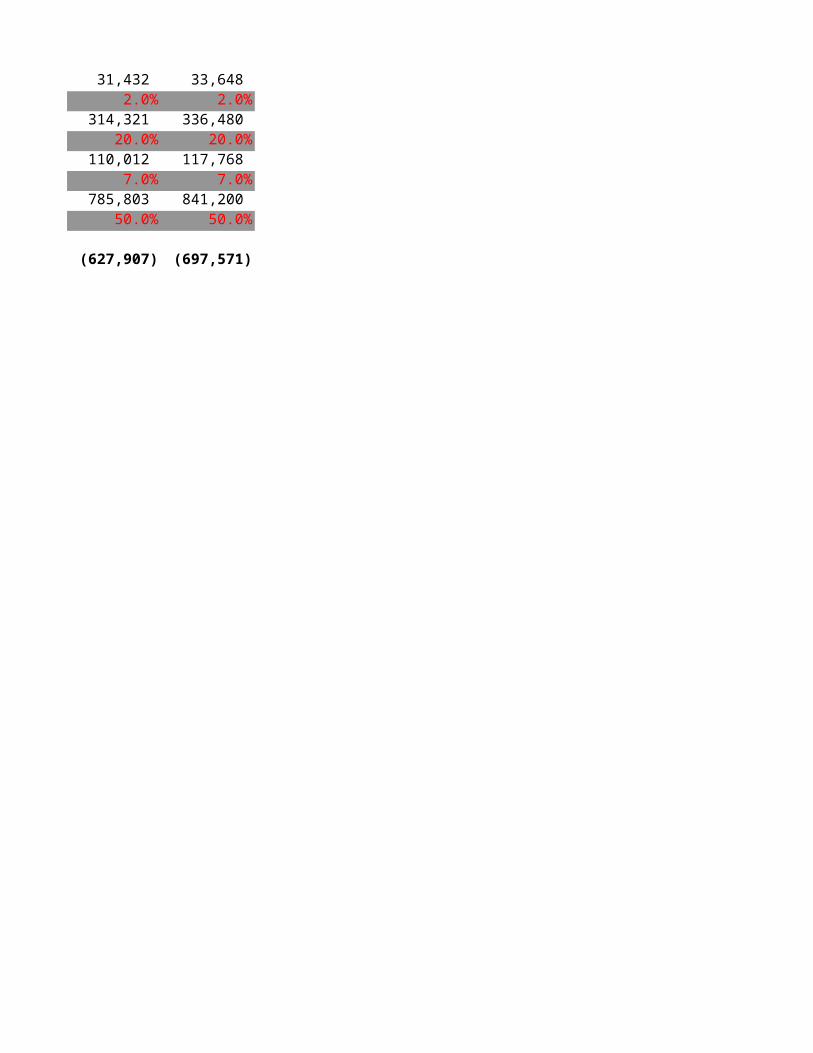
21,740 24,442 27,016 29,335 31,432 33,648 2.0% 2.0% 2.0% 2.0% 2.0% 2.0%
217,395 244,423 270,159 293,352 314,321 336,480 20.0% 20.0% 20.0% 20.0% 20.0% 20.0%
76,088 85,548 94,556 102,673 110,012 117,768 7.0% 7.0% 7.0% 7.0% 7.0% 7.0%
543,488 611,059 675,397 733,379 785,803 841,200 50.0% 50.0% 50.0% 50.0% 50.0% 50.0%
(336,946) (415,370) (488,438) (560,609) (627,907) (697,571)
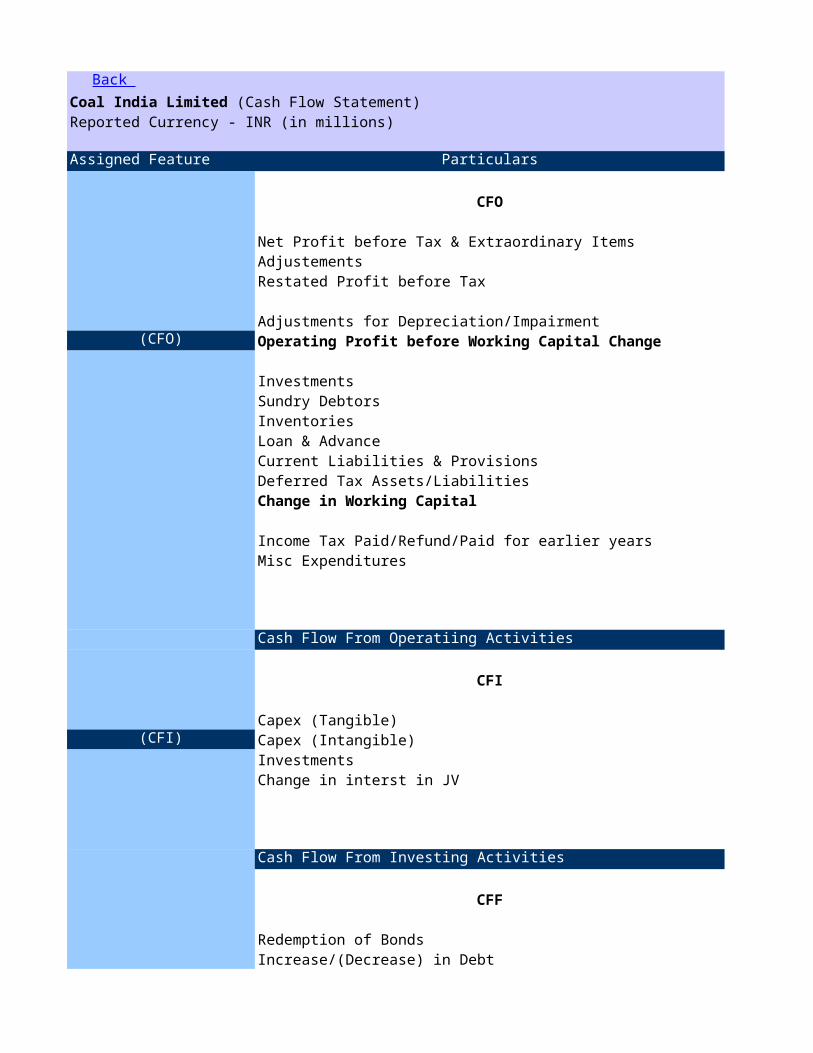
Reported Currency - INR (in millions)2006
Assigned Feature Particulars Actual
CFO
Net Profit before Tax & Extraordinary Items 87,541Adjustements 3,250Restated Profit before Tax 90,791
Adjustments for Depreciation/Impairment 12,987 (CFO) Operating Profit before Working Capital Change 103,778
Investments 0 Sundry Debtors 1,881 Inventories (4,620)Loan & Advance (14,413)Current Liabilities & Provisions 28,213 Deferred Tax Assets/Liabilities (1,502)Change in Working Capital 9,559
Income Tax Paid/Refund/Paid for earlier years (29,661)Misc Expenditures 0
Cash Flow From Operatiing Activities 83,676
CFI
Capex (Tangible) (12,446)(CFI) Capex (Intangible) 0
Investments 0Change in interst in JV
Cash Flow From Investing Activities (12,446)
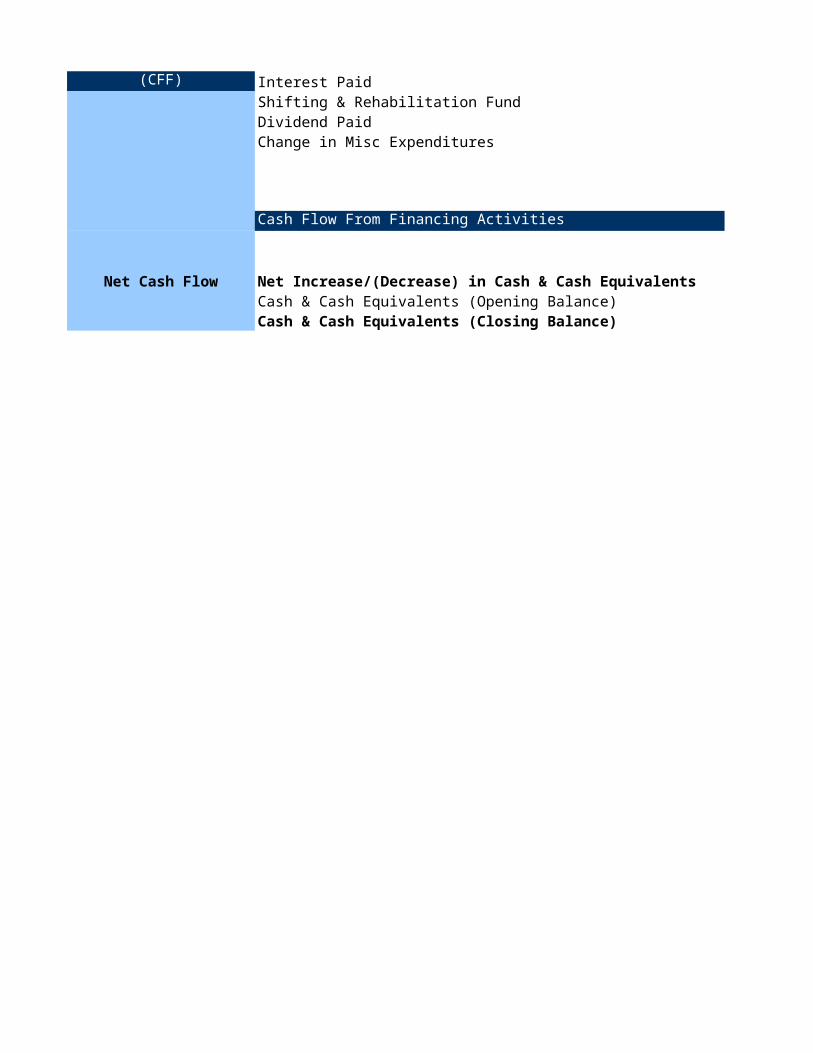
CFF
Redemption of Bonds (110)Increase/(Decrease) in Debt (4,191)
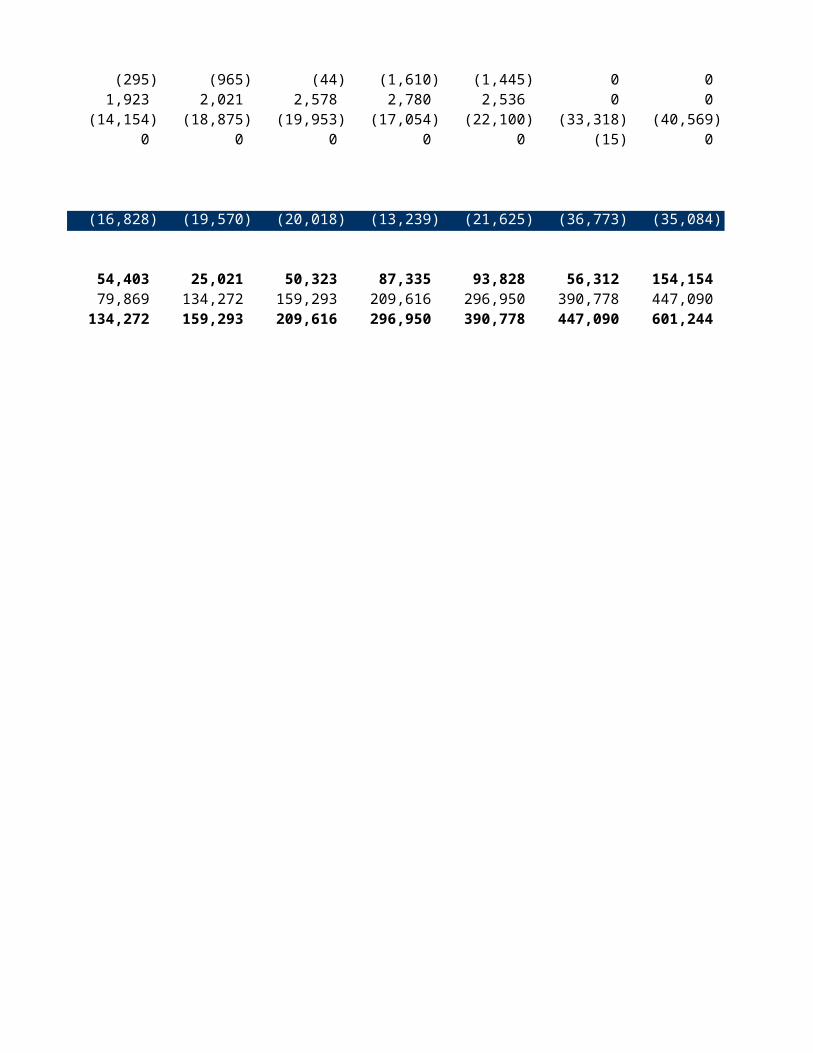
(CFF) Interest Paid (295)Shifting & Rehabilitation Fund 1,923 Dividend Paid (14,154)
Back Coal India Limited (Cash Flow Statement)
Change in Misc Expenditures 0
Cash Flow From Financing Activities (16,828)
Net Cash Flow Net Increase/(Decrease) in Cash & Cash Equivalents 54,403 Cash & Cash Equivalents (Opening Balance) 79,869 Cash & Cash Equivalents (Closing Balance) 134,272
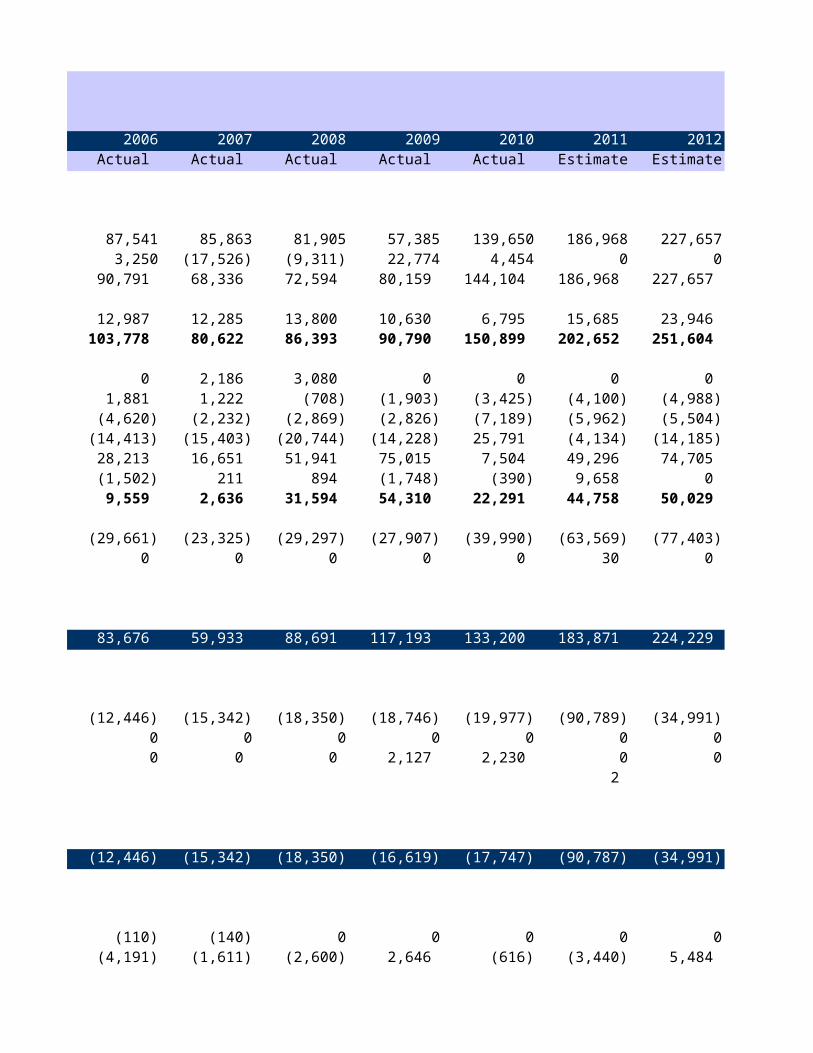
2007 2008 2009 2010 2011 2012 2013 2014Actual Actual Actual Actual Estimate Estimate Estimate Estimate
85,863 81,905 57,385 139,650 186,968 227,657 281,453 336,153(17,526) (9,311) 22,774 4,454 0 0 0 068,336 72,594 80,159 144,104 186,968 227,657 281,453 336,153
12,285 13,800 10,630 6,795 15,685 23,946 25,161 26,444 80,622 86,393 90,790 150,899 202,652 251,604 306,614 362,597
2,186 3,080 0 0 0 0 0 0 1,222 (708) (1,903) (3,425) (4,100) (4,988) (6,329) (7,301)
(2,232) (2,869) (2,826) (7,189) (5,962) (5,504) (7,662) (9,301)(15,403) (20,744) (14,228) 25,791 (4,134) (14,185) (17,765) (19,844)16,651 51,941 75,015 7,504 49,296 74,705 93,562 104,511
211 894 (1,748) (390) 9,658 0 0 0 2,636 31,594 54,310 22,291 44,758 50,029 61,806 68,065
(23,325) (29,297) (27,907) (39,990) (63,569) (77,403) (95,694) (114,292)0 0 0 0 30 0 0 0
59,933 88,691 117,193 133,200 183,871 224,229 272,726 316,370
(15,342) (18,350) (18,746) (19,977) (90,789) (34,991) (36,821) (38,022)0 0 0 0 0 0 0 0
0 0 2,127 2,230 0 0 0 02
(15,342) (18,350) (16,619) (17,747) (90,787) (34,991) (36,821) (38,022)
(140) 0 0 0 0 0 0 0(1,611) (2,600) 2,646 (616) (3,440) 5,484 6,780 8,098
(965) (44) (1,610) (1,445) 0 0 0 0 2,021 2,578 2,780 2,536 0 0 0 0
(18,875) (19,953) (17,054) (22,100) (33,318) (40,569) (50,155) (59,903)
0 0 0 0 (15) 0 0 0
(19,570) (20,018) (13,239) (21,625) (36,773) (35,084) (43,375) (51,805)
25,021 50,323 87,335 93,828 56,312 154,154 192,530 226,544 134,272 159,293 209,616 296,950 390,778 447,090 601,244 793,774 159,293 209,616 296,950 390,778 447,090 601,244 793,774 1,020,318
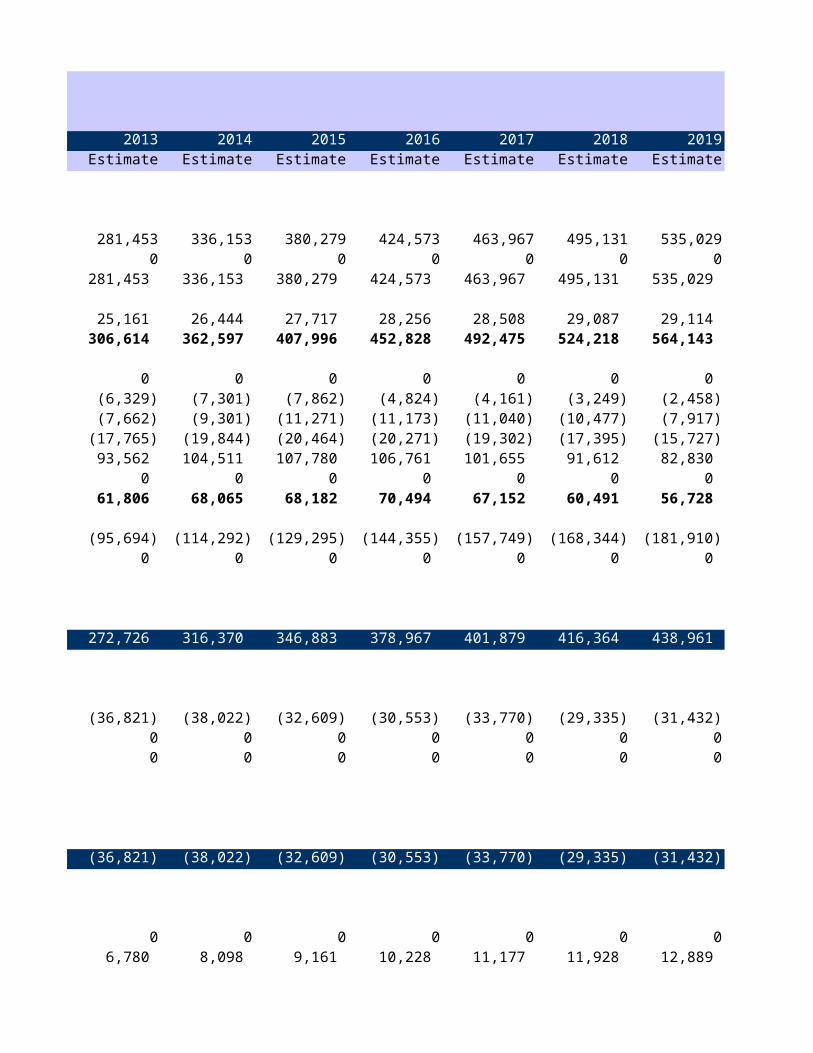
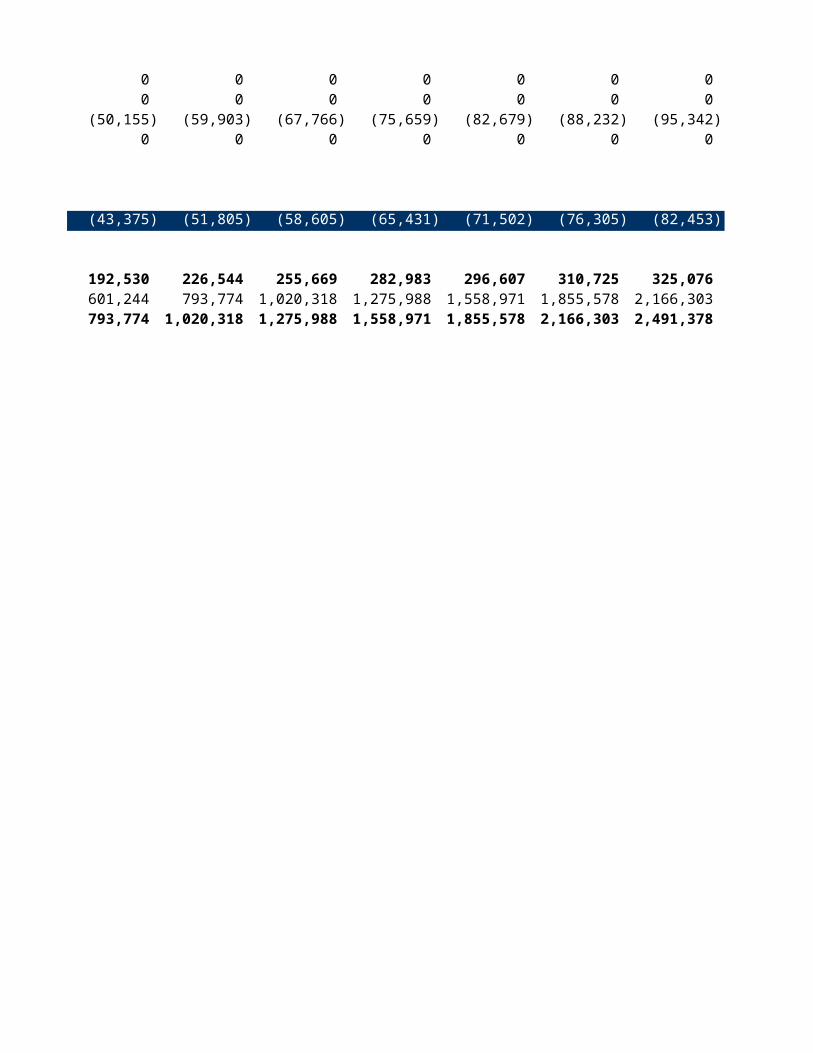
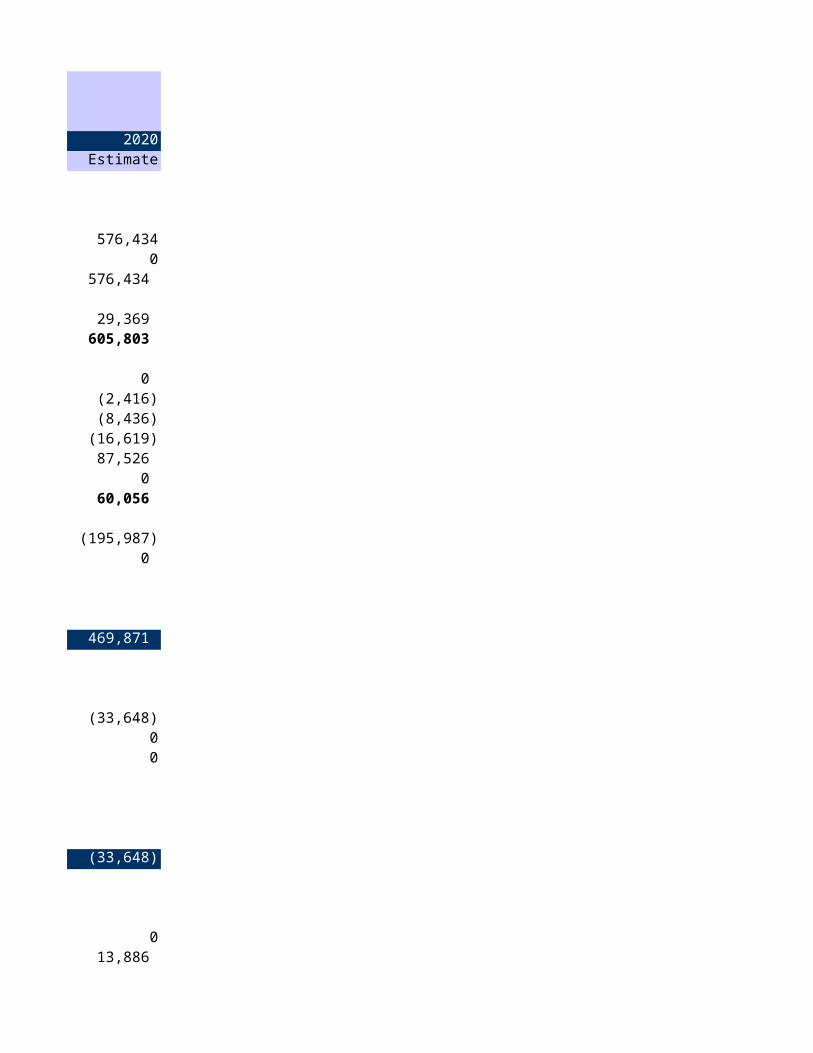
2015 2016 2017 2018 2019 2020Estimate Estimate Estimate Estimate Estimate Estimate
380,279 424,573 463,967 495,131 535,029 576,4340 0 0 0 0 0
380,279 424,573 463,967 495,131 535,029 576,434
27,717 28,256 28,508 29,087 29,114 29,369 407,996 452,828 492,475 524,218 564,143 605,803
0 0 0 0 0 0 (7,862) (4,824) (4,161) (3,249) (2,458) (2,416)
(11,271) (11,173) (11,040) (10,477) (7,917) (8,436)(20,464) (20,271) (19,302) (17,395) (15,727) (16,619)107,780 106,761 101,655 91,612 82,830 87,526
0 0 0 0 0 0 68,182 70,494 67,152 60,491 56,728 60,056
(129,295) (144,355) (157,749) (168,344) (181,910) (195,987)0 0 0 0 0 0
346,883 378,967 401,879 416,364 438,961 469,871
(32,609) (30,553) (33,770) (29,335) (31,432) (33,648)0 0 0 0 0 00 0 0 0 0 0
(32,609) (30,553) (33,770) (29,335) (31,432) (33,648)
0 0 0 0 0 09,161 10,228 11,177 11,928 12,889 13,886
0 0 0 0 0 0 0 0 0 0 0 0
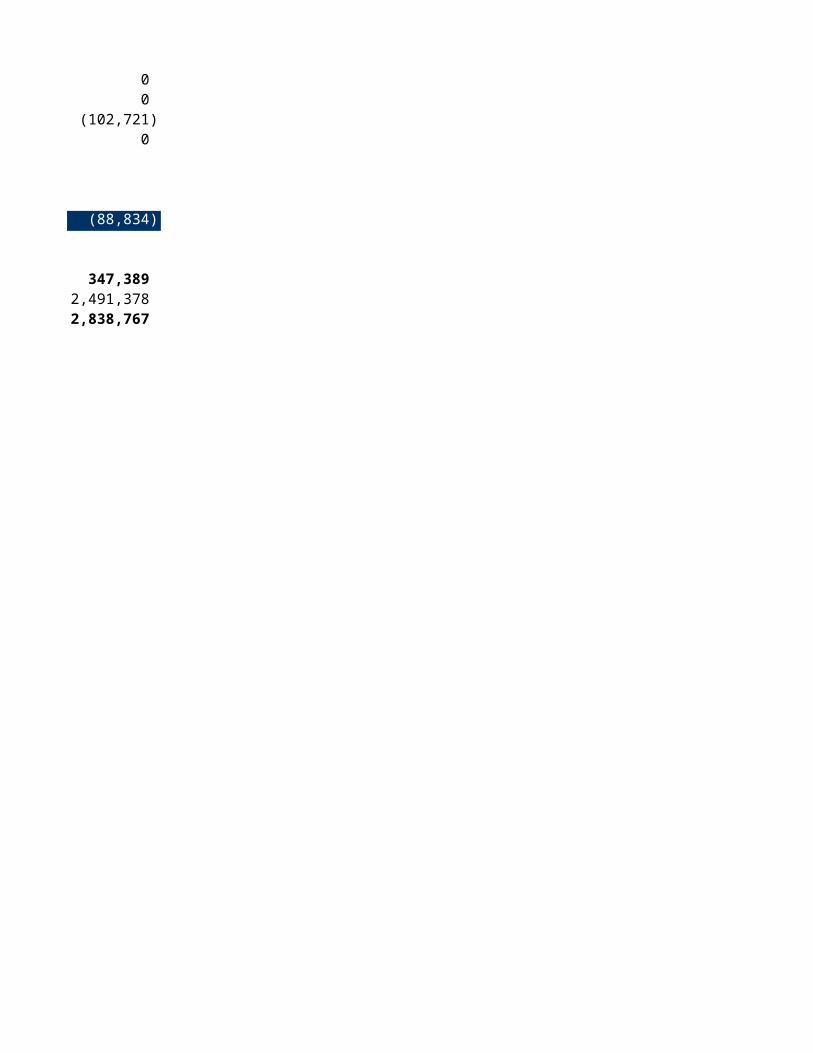
(67,766) (75,659) (82,679) (88,232) (95,342) (102,721)
0 0 0 0 0 0
(58,605) (65,431) (71,502) (76,305) (82,453) (88,834)
255,669 282,983 296,607 310,725 325,076 347,389 1,020,318 1,275,988 1,558,971 1,855,578 2,166,303 2,491,378 1,275,988 1,558,971 1,855,578 2,166,303 2,491,378 2,838,767
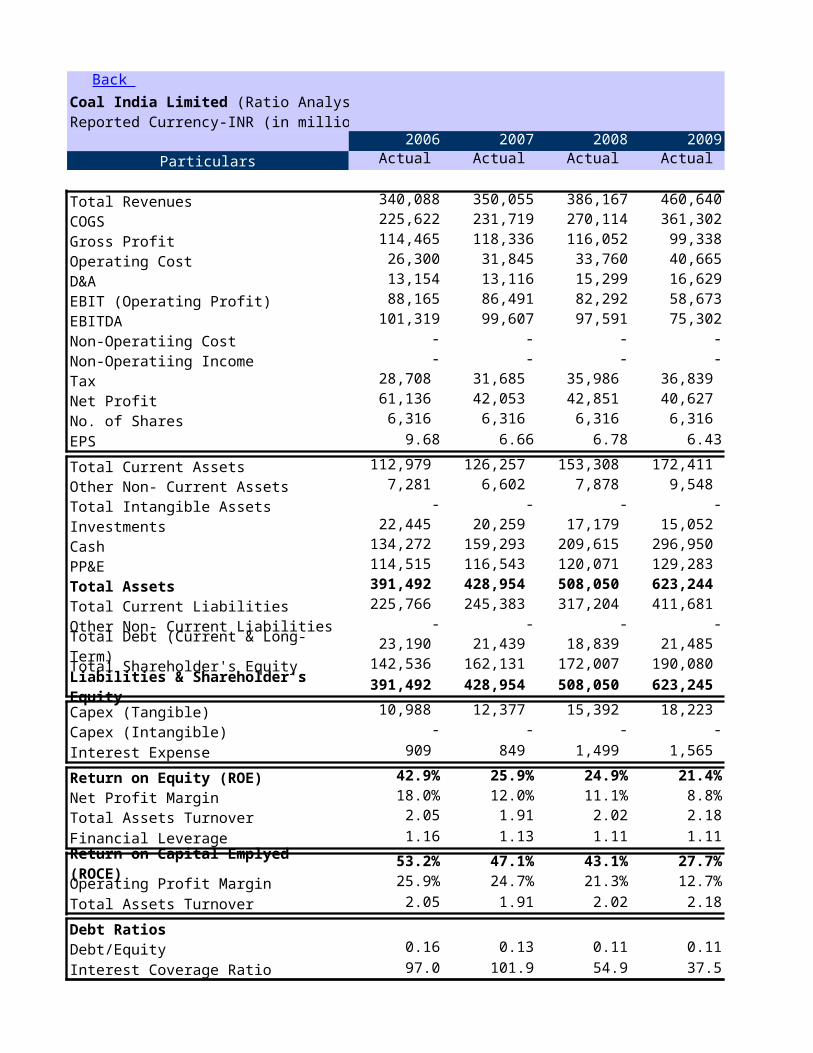
Reported Currency-INR (in millions)2006 2007 2008 2009 2010
Particulars Actual Actual Actual Actual Actual
Total Revenues 340,088 350,055 386,167 460,640 525,924COGS 225,622 231,719 270,114 361,302 338,250Gross Profit 114,465 118,336 116,052 99,338 187,673Operating Cost 26,300 31,845 33,760 40,665 46,122D&A 13,154 13,116 15,299 16,629 13,138EBIT (Operating Profit) 88,165 86,491 82,292 58,673 141,551EBITDA 101,319 99,607 97,591 75,302 154,689Non-Operatiing Cost - - - - -Non-Operatiing Income - - - - -Tax 28,708 31,685 35,986 36,839 44,332 Net Profit 61,136 42,053 42,851 40,627 98,338 No. of Shares 6,316 6,316 6,316 6,316 6,316 EPS 9.68 6.66 6.78 6.43 15.57
Total Current Assets 112,979 126,257 153,308 172,411 152,356 Other Non- Current Assets 7,281 6,602 7,878 9,548 9,660 Total Intangible Assets - - - - -Investments 22,445 20,259 17,179 15,052 12,821 Cash 134,272 159,293 209,615 296,950 390,778 PP&E 114,515 116,543 120,071 129,283 142,590 Total Assets 391,492 428,954 508,050 623,244 708,204 Total Current Liabilities 225,766 245,383 317,204 411,681 428,857 Other Non- Current Liabilities - - - - -Total Debt (Current & Long-Term) 23,190 21,439 18,839 21,485 20,869 Total Shareholder's Equity 142,536 162,131 172,007 190,080 258,479 Liabilities & Shareholder's Equity 391,492 428,954 508,050 623,245 708,204
Capex (Tangible) 10,988 12,377 15,392 18,223 21,082 Capex (Intangible) - - - - -Interest Expense 909 849 1,499 1,565 1,365
Return on Equity (ROE) 42.9% 25.9% 24.9% 21.4% 38.0%Net Profit Margin 18.0% 12.0% 11.1% 8.8% 18.7%Total Assets Turnover 2.05 1.91 2.02 2.18 1.88Financial Leverage 1.16 1.13 1.11 1.11 1.08
Return on Capital Emplyed (ROCE) 53.2% 47.1% 43.1% 27.7% 50.7%Operating Profit Margin 25.9% 24.7% 21.3% 12.7% 26.9%Total Assets Turnover 2.05 1.91 2.02 2.18 1.88
Debt RatiosDebt/Equity 0.16 0.13 0.11 0.11 0.08Interest Coverage Ratio 97.0 101.9 54.9 37.5 103.7
Back Coal India Limited (Ratio Analysis)
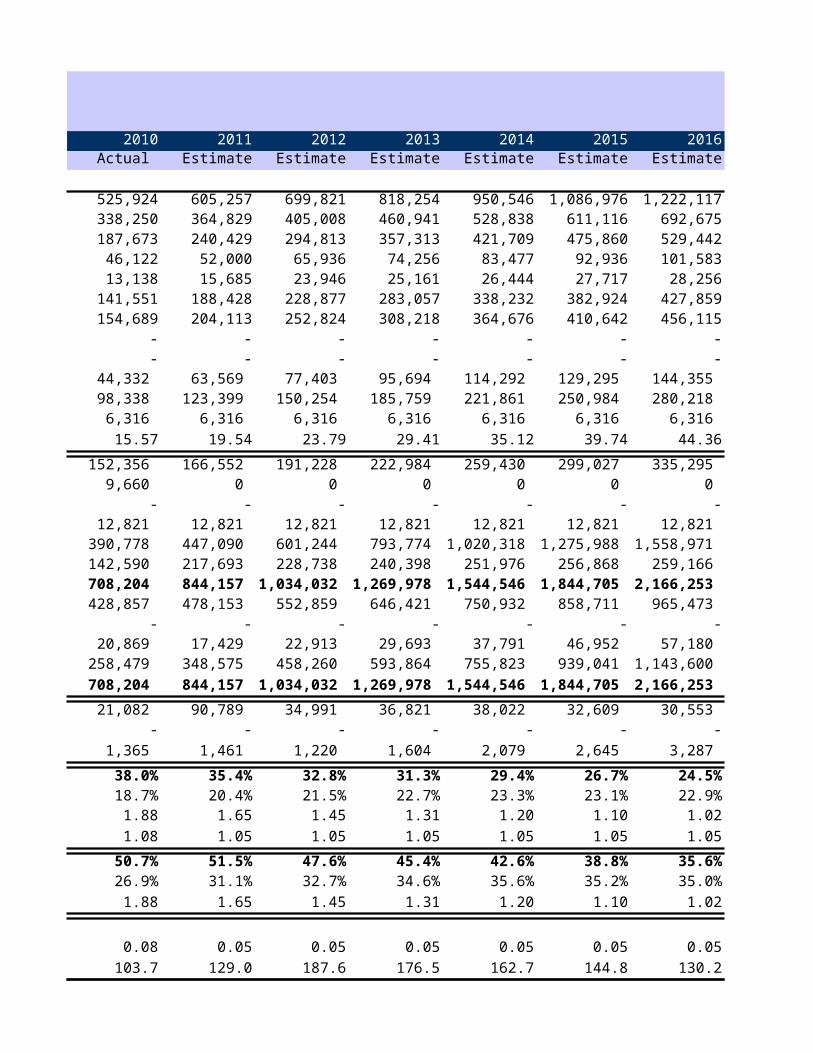
2011 2012 2013 2014 2015 2016 2017 2018Estimate Estimate Estimate Estimate Estimate Estimate Estimate Estimate
605,257 699,821 818,254 950,546 1,086,976 1,222,117 1,350,794 1,466,758364,829 405,008 460,941 528,838 611,116 692,675 773,268 849,750240,429 294,813 357,313 421,709 475,860 529,442 577,526 617,008
52,000 65,936 74,256 83,477 92,936 101,583 109,556 117,09315,685 23,946 25,161 26,444 27,717 28,256 28,508 29,087
188,428 228,877 283,057 338,232 382,924 427,859 467,970 499,916204,113 252,824 308,218 364,676 410,642 456,115 496,478 529,003
- - - - - - - -- - - - - - - -
63,569 77,403 95,694 114,292 129,295 144,355 157,749 168,344 123,399 150,254 185,759 221,861 250,984 280,218 306,218 326,786
6,316 6,316 6,316 6,316 6,316 6,316 6,316 6,316 19.54 23.79 29.41 35.12 39.74 44.36 48.48 51.74
166,552 191,228 222,984 259,430 299,027 335,295 369,798 400,918 0 0 0 0 0 0 0 0 - - - - - - - -
12,821 12,821 12,821 12,821 12,821 12,821 12,821 12,821 447,090 601,244 793,774 1,020,318 1,275,988 1,558,971 1,855,578 2,166,303 217,693 228,738 240,398 251,976 256,868 259,166 264,427 264,675 844,157 1,034,032 1,269,978 1,544,546 1,844,705 2,166,253 2,502,624 2,844,718 478,153 552,859 646,421 750,932 858,711 965,473 1,067,127 1,158,739
- - - - - - - -17,429 22,913 29,693 37,791 46,952 57,180 68,357 80,285
348,575 458,260 593,864 755,823 939,041 1,143,600 1,367,140 1,605,694 844,157 1,034,032 1,269,978 1,544,546 1,844,705 2,166,253 2,502,624 2,844,718
90,789 34,991 36,821 38,022 32,609 30,553 33,770 29,335 - - - - - - - -
1,461 1,220 1,604 2,079 2,645 3,287 4,003 4,785
35.4% 32.8% 31.3% 29.4% 26.7% 24.5% 22.4% 20.4%20.4% 21.5% 22.7% 23.3% 23.1% 22.9% 22.7% 22.3%
1.65 1.45 1.31 1.20 1.10 1.02 0.94 0.871.05 1.05 1.05 1.05 1.05 1.05 1.05 1.05
51.5% 47.6% 45.4% 42.6% 38.8% 35.6% 32.6% 29.7%31.1% 32.7% 34.6% 35.6% 35.2% 35.0% 34.6% 34.1%
1.65 1.45 1.31 1.20 1.10 1.02 0.94 0.87
0.05 0.05 0.05 0.05 0.05 0.05 0.05 0.05129.0 187.6 176.5 162.7 144.8 130.2 116.9 104.5
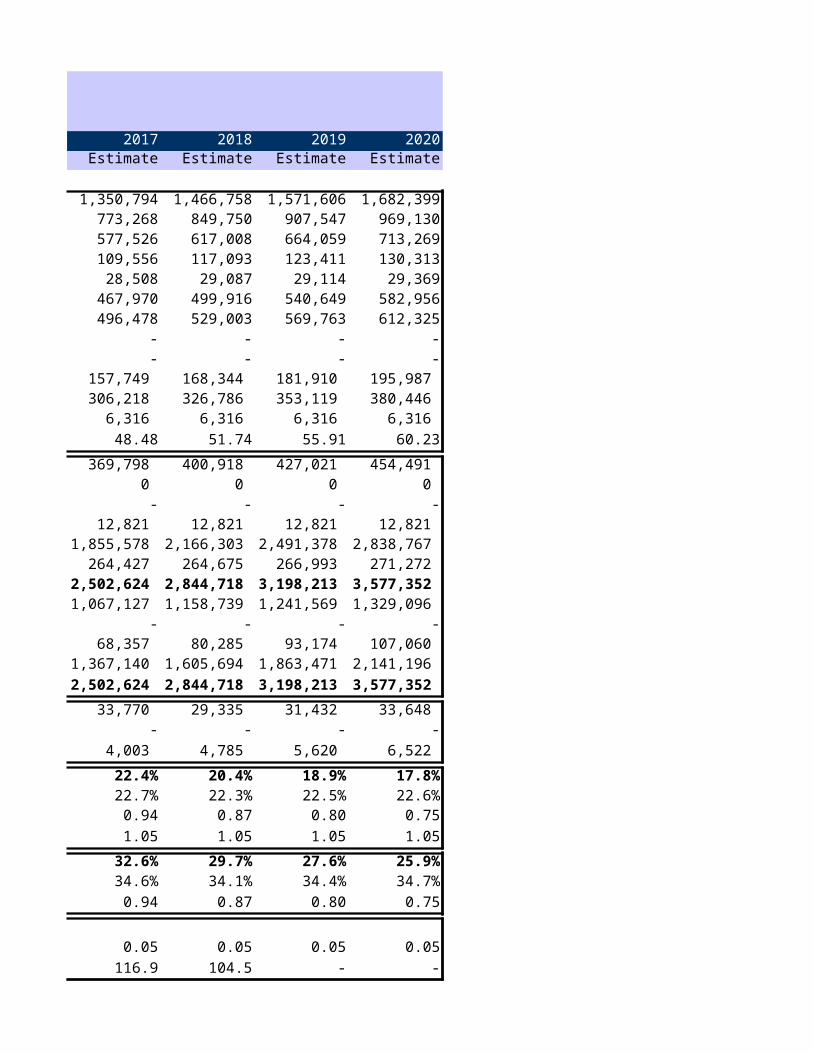
2019 2020Estimate Estimate
1,571,606 1,682,399907,547 969,130664,059 713,269123,411 130,313
29,114 29,369540,649 582,956569,763 612,325
- -- -
181,910 195,987 353,119 380,446
6,316 6,316 55.91 60.23
427,021 454,491 0 0 - -
12,821 12,821 2,491,378 2,838,767
266,993 271,272 3,198,213 3,577,352 1,241,569 1,329,096
- -93,174 107,060
1,863,471 2,141,196 3,198,213 3,577,352
31,432 33,648 - -
5,620 6,522
18.9% 17.8%22.5% 22.6%
0.80 0.751.05 1.05
27.6% 25.9%34.4% 34.7%
0.80 0.75
0.05 0.05- -
Reported Currency-INR (in millions)2006 2007 2008 2009 2010
Particulars Actual Actual Actual Actual Actual
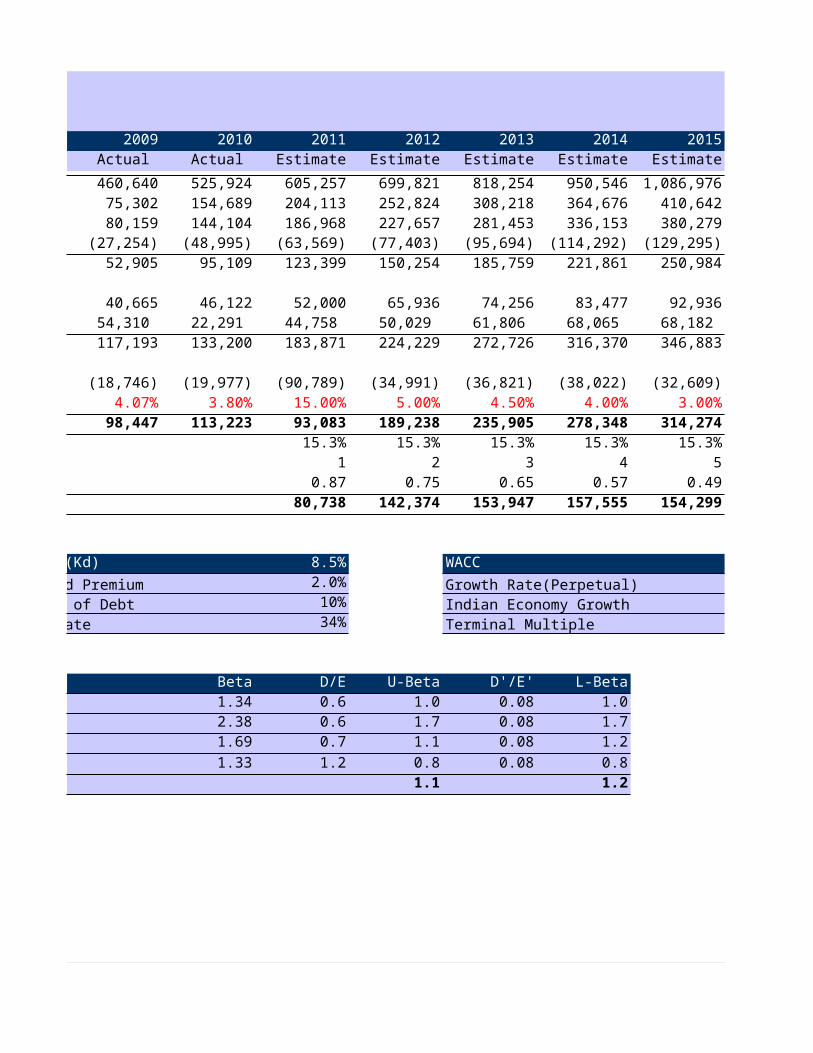
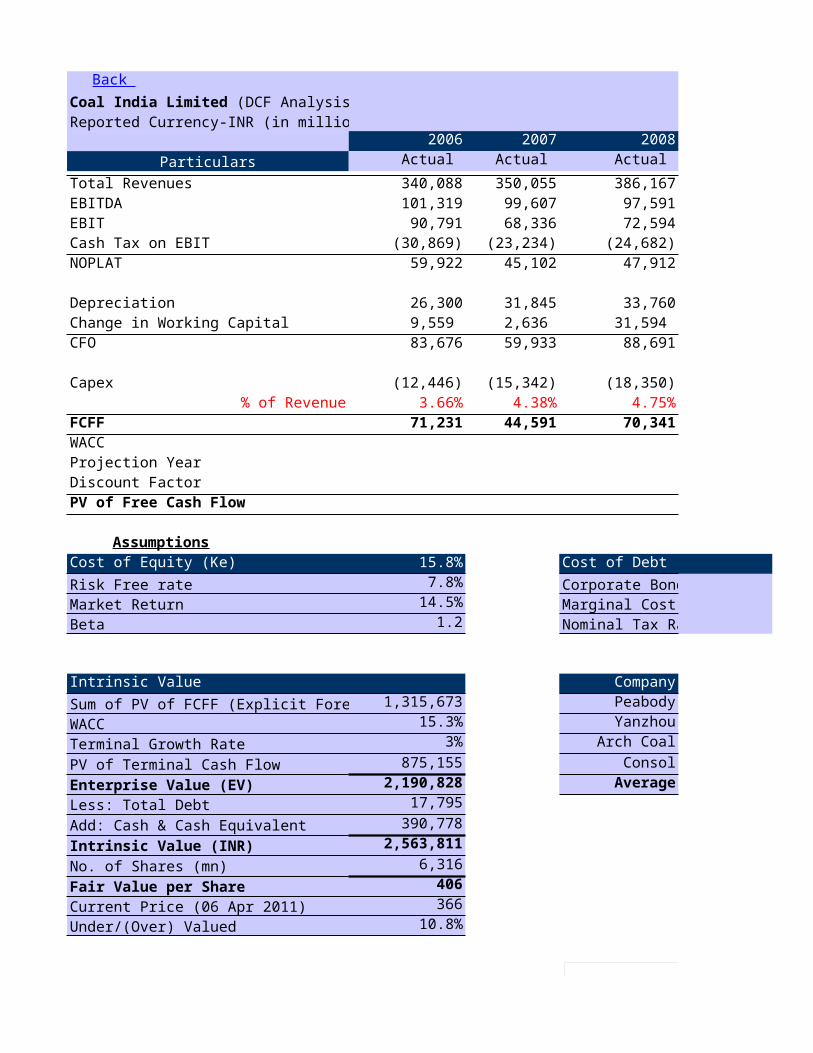
Total Revenues 340,088 350,055 386,167 460,640 525,924EBITDA 101,319 99,607 97,591 75,302 154,689EBIT 90,791 68,336 72,594 80,159 144,104Cash Tax on EBIT (30,869) (23,234) (24,682) (27,254) (48,995)NOPLAT 59,922 45,102 47,912 52,905 95,109
Depreciation 26,300 31,845 33,760 40,665 46,122Change in Working Capital 9,559 2,636 31,594 54,310 22,291 CFO 83,676 59,933 88,691 117,193 133,200
Capex (12,446) (15,342) (18,350) (18,746) (19,977)% of Revenue 3.66% 4.38% 4.75% 4.07% 3.80%
FCFF 71,231 44,591 70,341 98,447 113,223WACCProjection YearDiscount FactorPV of Free Cash Flow
AssumptionsCost of Equity (Ke) 15.8% Cost of Debt (Kd)Risk Free rate 7.8% Corporate Bond PremiumMarket Return 14.5% Marginal Cost of DebtBeta 1.2 Nominal Tax Rate
Intrinsic Value Company BetaSum of PV of FCFF (Explicit Forecast) 1,315,673 Peabody 1.34WACC 15.3% Yanzhou 2.38Terminal Growth Rate 3% Arch Coal 1.69PV of Terminal Cash Flow 875,155 Consol 1.33Enterprise Value (EV) 2,190,828 AverageLess: Total Debt 17,795Add: Cash & Cash Equivalent 390,778Intrinsic Value (INR) 2,563,811No. of Shares (mn) 6,316Fair Value per Share 406Current Price (06 Apr 2011) 366Under/(Over) Valued 10.8%
Back Coal India Limited (DCF Analysis)
2006 2007 2008 2009 2010 2011 2012 2013 2014 2015 2016 2017 2018 2019 20200
50,000
100,000
150,000
200,000
250,000
300,000
350,000
400,000
450,000
500,000Free Cash Flow (in INR)
Years
2006 2007 2008 2009 2010 2011 2012 2013 2014 2015 2016 2017 2018 2019 20200
50,000
100,000
150,000
200,000
250,000
300,000
350,000
400,000
450,000
500,000Free Cash Flow (in INR)
Years
2011 2012 2013 2014 2015 2016 2017 2018Estimate Estimate Estimate Estimate Estimate Estimate Estimate Estimate
605,257 699,821 818,254 950,546 1,086,976 1,222,117 1,350,794 1,466,758204,113 252,824 308,218 364,676 410,642 456,115 496,478 529,003186,968 227,657 281,453 336,153 380,279 424,573 463,967 495,131(63,569) (77,403) (95,694) (114,292) (129,295) (144,355) (157,749) (168,344)123,399 150,254 185,759 221,861 250,984 280,218 306,218 326,786
52,000 65,936 74,256 83,477 92,936 101,583 109,556 117,09344,758 50,029 61,806 68,065 68,182 70,494 67,152 60,491
183,871 224,229 272,726 316,370 346,883 378,967 401,879 416,364
(90,789) (34,991) (36,821) (38,022) (32,609) (30,553) (33,770) (29,335)15.00% 5.00% 4.50% 4.00% 3.00% 2.50% 2.50% 2.00%93,083 189,238 235,905 278,348 314,274 348,414 368,109 387,02915.3% 15.3% 15.3% 15.3% 15.3% 15.3% 15.3% 15.3%
1 2 3 4 5 6 7 80.87 0.75 0.65 0.57 0.49 0.43 0.37 0.32
80,738 142,374 153,947 157,555 154,299 148,376 135,973 124,003
8.5% WACC 15.3% Weights 2.0% Growth Rate(Perpetual) 3% Total Debt (Current & Long Term)10% Indian Economy Growth 4% Total Shareholder's Equity34% Terminal Multiple 9.5X We
D/E U-Beta D'/E' L-Beta0.6 1.0 0.08 1.00.6 1.7 0.08 1.70.7 1.1 0.08 1.21.2 0.8 0.08 0.8
1.1 1.2
2006 2007 2008 2009 2010 2011 2012 2013 2014 2015 2016 2017 2018 2019 20200
50,000
100,000
150,000
200,000
250,000
300,000
350,000
400,000
450,000
500,000Free Cash Flow (in INR)
Years
2006 2007 2008 2009 2010 2011 2012 2013 2014 2015 2016 2017 2018 2019 20200
50,000
100,000
150,000
200,000
250,000
300,000
350,000
400,000
450,000
500,000Free Cash Flow (in INR)
Years
2019 2020 SecondEstimate Estimate Stage
1,571,606 1,682,399 1,989,342569,763 612,325 724,040535,029 576,434 593,727
(181,910) (195,987) (201,867) 875,155 353,119 380,446 391,860
123,411 130,313 130,31356,728 60,056 60,056
438,961 469,871 483,967
(31,432) (33,648) (37,798)2.00% 2.00% 1.90%
407,529 436,223 446,17015.3% 15.3%
9 100.28 0.24
113,255 105,153 875,155
Weights Total Debt (Current & Long Term) 20,869Total Shareholder's Equity 258,479
0.9 Wd 0.1
Senstivity Analysis (WACC and Terminal Growth)
PV of Terminal Cash FlowWACC PV of FCFF 2% 3% 4%13.3% 1,448,211 1,135,635 1,245,166 1,378,280 14.3% 1,379,686 955,459 1,039,392 1,139,640 15.3% 1,315,673 809,846 875,155 952,033 16.3% 1,255,815 690,854 742,339 802,203 17.3% 1,199,784 592,684 633,734 680,962
PV of Terminal Cash FlowPV of FCFF 2% 3% 4%
1.0 1,395,699 984,701 1,084,509 1,204,1801.1 1,354,847 887,099 972,706 1,074,3611.2 1,315,673 801,323 875,155 962,0661.3 1,278,096 725,630 789,624 864,3641.4 1,242,036 658,583 714,303 778,917
Back
Senstivity Analysis (Beta-b and Terminal Growth)
Beta (b)
Senstivity (Price-RAW Coal and Terminal Growth)
CAGR PV of Terminal Cash FlowRaw Coal Price PV of FCFF 2% 3% 4%
4.0% 1,078,147 542,279 592,288 651,1575.0% 1,193,540 666,081 727,474 799,7436.0% 1,315,673 809,846 875,155 952,0337.0% 1,444,947 949,003 1,036,418 1,139,3198.0% 1,581,781 1,110,173 1,212,414 1,332,768
Senstivity (Average Cost Per Employee and Terminal Growth)
CAGR PV of Terminal Cash FlowEmployee Cost PV of FCFF 2% 3% 4%
7.4% 1,420,843 930,555 1,016,256 1,117,1408.4% 1,369,639 868,594 948,603 1,042,7879.4% 1,315,673 801,323 875,155 962,066
10.4% 1,258,796 728,296 795,422 874,44111.4% 1,198,846 649,003 708,853 779,305
Senstivity (Raw Material Cost and Terminal Growth)
% of Revenue PV of Terminal Cash FlowRaw Material Cost PV of FCFF 2% 3% 4%
18.0% 1,382,765 845,936 923,865 1,015,59919.0% 1,349,219 823,636 899,516 988,83920.0% 1,315,673 801,323 875,155 962,06621.0% 1,282,127 778,999 850,780 935,27822.0% 1,248,581 756,660 826,390 908,473
13.3% 14.3% 15.3% 16.3% 17.3%300
350
400
450
500
550Fair Value vs WACC
2% (Growth)
3% (Growth)
4% (Growth)
WACC
Fair
Valu
e (IN
R)
1.00 1.10 1.20 1.30 1.40300
350
400
450
500
550 Fair Value vs Beta()
2% (Growth)
3% (Growth)
4% (Growth)
Beta ()
Fair
Valu
e (IN
R)
13.3% 14.3% 15.3% 16.3% 17.3%300
350
400
450
500
550Fair Value vs WACC
2% (Growth)
3% (Growth)
4% (Growth)
WACC
Fair
Valu
e (IN
R)
1.00 1.10 1.20 1.30 1.40300
350
400
450
500
550 Fair Value vs Beta()
2% (Growth)
3% (Growth)
4% (Growth)
Beta ()
Fair
Valu
e (IN
R)
4.0% 5.0% 6.0% 7.0% 8.0%300
350
400
450
500
550 Fair Value vs Coal Price
2% (Growth)
3% (Growth)
4% (Growth)
Raw Coal Price (CAGR)
Fair
Valu
e (IN
R)
7.4% 8.4% 9.4% 10.4% 11.4%300
350
400
450
500
550 Fair Value vs Employee Cost
2% (Growth)
3% (Growth)
4% (Growth)
Cost Per Employee(CAGR)
Fair
Valu
e (IN
R)
18.0% 19.0% 20.0% 21.0% 22.0%300
350
400
450
500
550 Fair Value vs Raw Material Cost
2% (Growth)
3% (Growth)
4% (Growth)
Raw Material Cost (% of Revenue)
Fair
Valu
e (IN
R)
Fair Value per Share2% 3% 4% Sensitivity Index
468 485 507429 442 458396 406 418 (8.21)367 375 385343 349 357
Fair Value per Share2% 3% 4% Sensitivity Index
436 452 471414 428 444394 406 420 (0.51)376 386 398360 369 379
Fair Value per Share2% 3% 4% Sensitivity Index
316 324 333353 363 375396 406 418 10.93 438 452 468485 501 520
Fair Value per Share2% 3% 4% Sensitivity Index
431 445 461413 426 441394 406 420 (5.15)374 384 397352 361 372
Fair Value per Share2% 3% 4% Sensitivity Index
412 424 439403 415 429394 406 420 (2.26)385 397 410377 388 401
1.00 1.10 1.20 1.30 1.40300
350
400
450
500
550 Fair Value vs Beta()
2% (Growth)
3% (Growth)
4% (Growth)
Beta ()
Fair
Valu
e (IN
R)
1.00 1.10 1.20 1.30 1.40300
350
400
450
500
550 Fair Value vs Beta()
2% (Growth)
3% (Growth)
4% (Growth)
Beta ()
Fair
Valu
e (IN
R)
7.4% 8.4% 9.4% 10.4% 11.4%300
350
400
450
500
550 Fair Value vs Employee Cost
2% (Growth)
3% (Growth)
4% (Growth)
Cost Per Employee(CAGR)
Fair
Valu
e (IN
R)