29/05/2012 1 GRAVITY CONCENTRATION Presented by: J.A. Engelbrecht May 2012 CONTENTS • Normalised Epm and Breakaway Size • Relative Cut Density Shift • Coarse particle separation - 100 – 0.5mm • Economic evaluation • Fine particle separation - 3 - 0.1mm • Economic evaluation Normalised Epm Figure 1: Partition Curve 0 20 40 60 80 100 1.20 1.25 1.30 1.35 1.40 1.45 1.50 1.55 1.60 Relative Density Recovery to Clean Coal [O/F] EPM75/25 = 0.030 EPM90/10 = 0.0625 EPM95/5 = 0.085 Normalised Epm 0.00 0.10 0.20 0.30 0.40 0.50 0.60 0.70 0.80 0.90 1.00 1.2 1.3 1.4 1.5 1.6 1.7 1.8 1.9 2 2.1 Partition Number Relative Density Figure 2. Actual EPM Values for Low and High Density Separations D50 = 1.80 D50 = 1.35 EPM = (1.369 - 1.337) / 2 = 0.016 EPM = (1.822 - 1.779) / 2 = 0.0215 Actual EPM = A + B p W /d A = Constant B = Constant, f( Medium Characteristics) Normalised Epm Figure 3 : Normalised EPM Values for Low and High Density Separations 0.00 0.20 0.40 0.60 0.80 1.00 0.80 0.90 1.00 1.10 1.20 Relative Density Partition Number D50 = 1.35 D50 = 1.8 (1.369 - 1.337) / ( 2 * 1.8 ) = 0.012 (1.822 - 1.779) / ( 2 * 1.35 ) = 0.012 Normalised Epm D M Cyclones 0.00 0.01 0.02 0.03 0.04 0.05 0.06 0.07 0.08 0.09 0.10 0.11 0.12 0.13 0.14 0.15 0.16 0.17 0 1 2 3 4 5 6 7 8 9 10 Normalised Epm Particle Size (mm) Figure 5 : Cyclone Efficiency Curves 1450 420
Transcript
29/05/2012
1
GRAVITY CONCENTRATION
Presented by: J.A. Engelbrecht
May 2012
CONTENTS
• Normalised Epm and Breakaway Size
• Relative Cut Density Shift
• Coarse particle separation - 100 – 0.5mm
• Economic evaluation
• Fine particle separation - 3 - 0.1mm
• Economic evaluation
Normalised Epm
Figure 1: Partition Curve
0
20
40
60
80
100
1.20 1.25 1.30 1.35 1.40 1.45 1.50 1.55 1.60
Relative Density
Re
co
ve
ry t
o C
lea
n C
oa
l [O
/F]
EPM75/25 = 0.030
EPM90/10 = 0.0625
EPM95/5 = 0.085
Normalised Epm
0.00
0.10
0.20
0.30
0.40
0.50
0.60
0.70
0.80
0.90
1.00
1.2 1.3 1.4 1.5 1.6 1.7 1.8 1.9 2 2.1
Part
itio
n N
um
ber
Relative Density
Figure 2. Actual EPM Values for Low and High Density Separations
D50 = 1.80
D50 = 1.35
EPM = (1.369 - 1.337)
/ 2 = 0.016
EPM = (1.822 - 1.779) /
2 = 0.0215
Actual EPM = A + B p W /d
A = Constant
B = Constant, f( Medium
Characteristics)
Normalised Epm
Figure 3 : Normalised EPM Values for Low and High Density
Separations
0.00
0.20
0.40
0.60
0.80
1.00
0.80 0.90 1.00 1.10 1.20
Relative Density
Part
itio
n N
um
ber
D50 = 1.35
D50 = 1.8
(1.369 - 1.337) / ( 2 * 1.8 ) = 0.012
(1.822 - 1.779) / ( 2 * 1.35 ) = 0.012
Normalised Epm
D M Cyclones
0.00
0.01
0.02
0.03
0.04
0.05
0.06
0.07
0.08
0.09
0.10
0.11
0.12
0.13
0.14
0.15
0.16
0.17
0 1 2 3 4 5 6 7 8 9 10
No
rma
lis
ed
Ep
m
Particle Size (mm)
Figure 5 : Cyclone Efficiency Curves
1450
420
29/05/2012
2
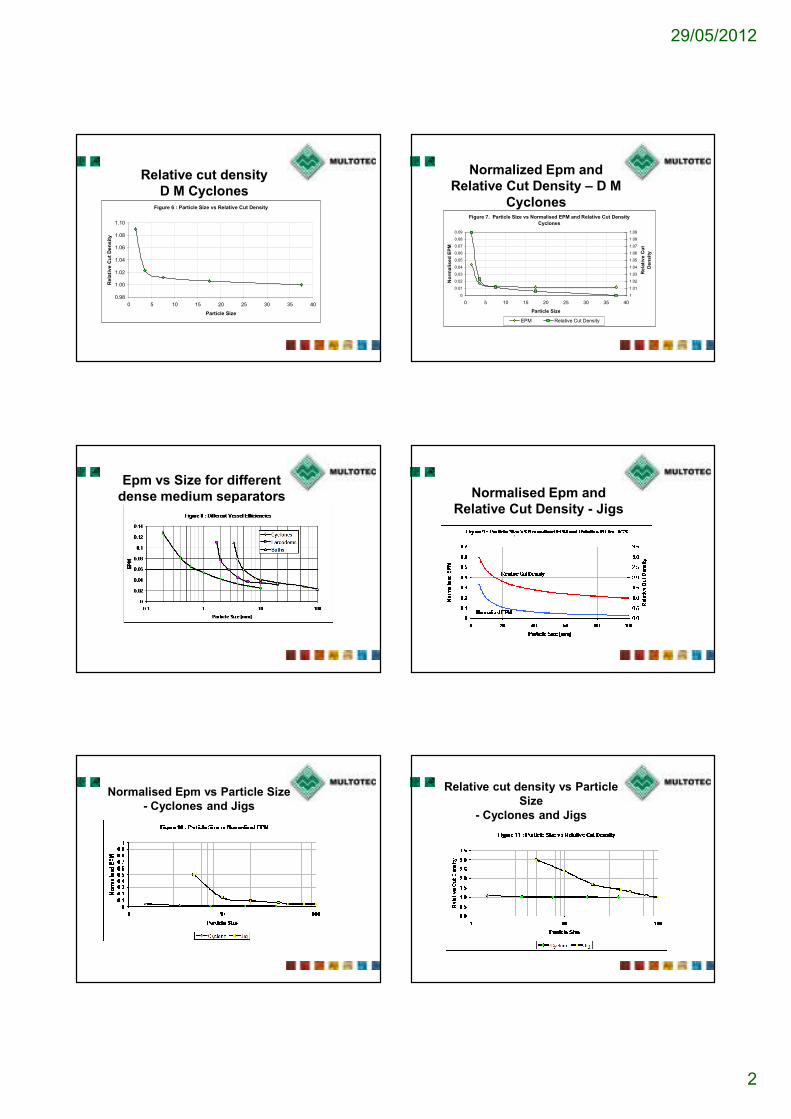
Relative cut density
D M CyclonesFigure 6 : Particle Size vs Relative Cut Density
0.98
1.00
1.02
1.04
1.06
1.08
1.10
0 5 10 15 20 25 30 35 40
Particle Size
Rela
tive C
ut
Den
sit
y
Normalized Epm and
Relative Cut Density – D M
CyclonesFigure 7. Particle Size vs Normalised EPM and Relative Cut Density
Cyclones
0
0.01
0.02
0.03
0.04
0.05
0.06
0.07
0.08
0.09
0 5 10 15 20 25 30 35 40
Particle Size
No
rma
lis
ed
EP
M
1
1.01
1.02
1.03
1.04
1.05
1.06
1.07
1.08
1.09
Re
lati
ve
Cu
t
De
ns
ity
EPM Relative Cut Density
Epm vs Size for different
dense medium separators Normalised Epm and
Relative Cut Density - Jigs
Normalised Epm vs Particle Size
- Cyclones and Jigs
Relative cut density vs Particle
Size
- Cyclones and Jigs
29/05/2012
3
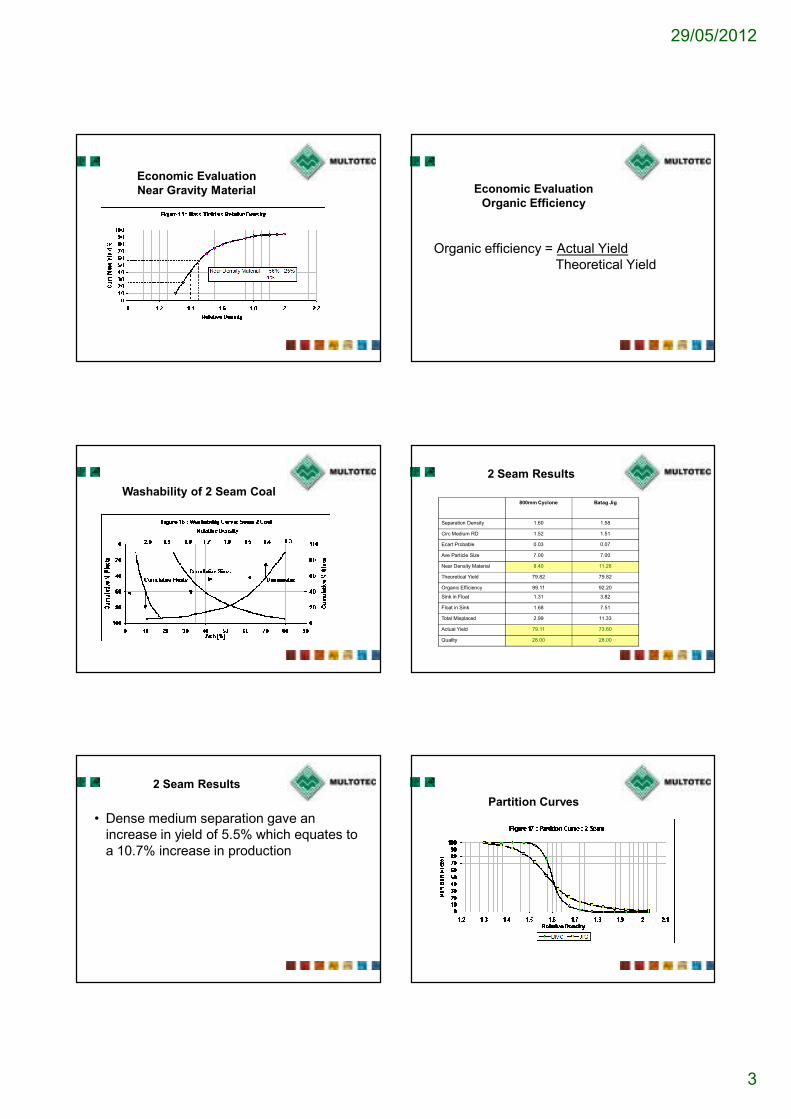
Economic Evaluation
Near Gravity Material Economic Evaluation
Organic Efficiency
Organic efficiency = Actual Yield
Theoretical Yield
Washability of 2 Seam Coal
2 Seam Results
800mm Cyclone Batag Jig
Separation Density 1.60 1.58
Circ Medium RD 1.52 1.51
Ecart Probable 0.03 0.07
Ave Particle Size 7.00 7.00
Near Density Material 8.40 11.26
Theoretical Yield 79.82 79.82
Organic Efficiency 99.11 92.20
Sink in Float 1.31 3.82
Float in Sink 1.68 7.51
Total Misplaced 2.99 11.33
Actual Yield 79.11 73.60
Quality 28.00 28.00
• Dense medium separation gave an
increase in yield of 5.5% which equates to
a 10.7% increase in production
2 Seam Results
Partition Curves
29/05/2012
4
Washability of 4 Seam Coal4 Seam Results
800mm Cyclone Batag Jig
Separation Density 1.48 1.41
Circ Medium RD 1.42 1.36
Ecart Probable 0.02 0.05
Ave Particle Size 7.00 7.00
Near Density Material 25.30 24.45
Theoretical Yield 38.80 38.86
Organic Efficiency 89.55 56.05
Sink in Float 4.87 9.30
Float in Sink 4.91 5.59
Total Misplaced 9.77 14.88
Actual Yield 34.74 21.78
Quality 28.00 28.00
4 Seam results
• Dense medium separation gave an
increase in yield of 13% and the increase
in production is 59.5%
4 Seam Results
Partition Curves
Organic Efficiency vs Epm Economic Evaluation
DM Cyclones Jigs
Capital Costs Equal Equal
Running Costs R6,0 R1,50
29/05/2012
5
At a mine site value of R500 per Tonne of coal, the
breakeven yield gain is 0,9% for the Dense Medium Plant
with the higher running costs compared to a jig plant
Conclusions
Coarse particles
• Dense medium separation is one of the
most efficient processes available in the
size range 0.5 – 50 mm
• The cut density shift is less pronounced in
dense medium separation
• The running costs of a dense medium
plant is higher
Conclusions
Coarse particles
• Dense medium separation is more flexible
• In black and white or very easy separations jigs may be economically viable depending on the percentage near gravity material
Fine Particle Separation
0,1mm – 3 mm
Gravity Separation Equipment in
Use
• Spiral Concentrators
• Teetered Bed Separators and Water Only
Cyclones
• Fine Dense Medium Cyclones
Fine Dense Medium Cyclones
• Separation to 0 at Homer City and Curragh with
500mm cyclones were inefficient
• Separation at Greenside in 150mm cyclones
with a medium of 50% minus 10 micron was
difficult with high losses of medium
• Coaltech 20:20 solved the problem with two
stage 420mm cyclones using a coarse medium
29/05/2012
6
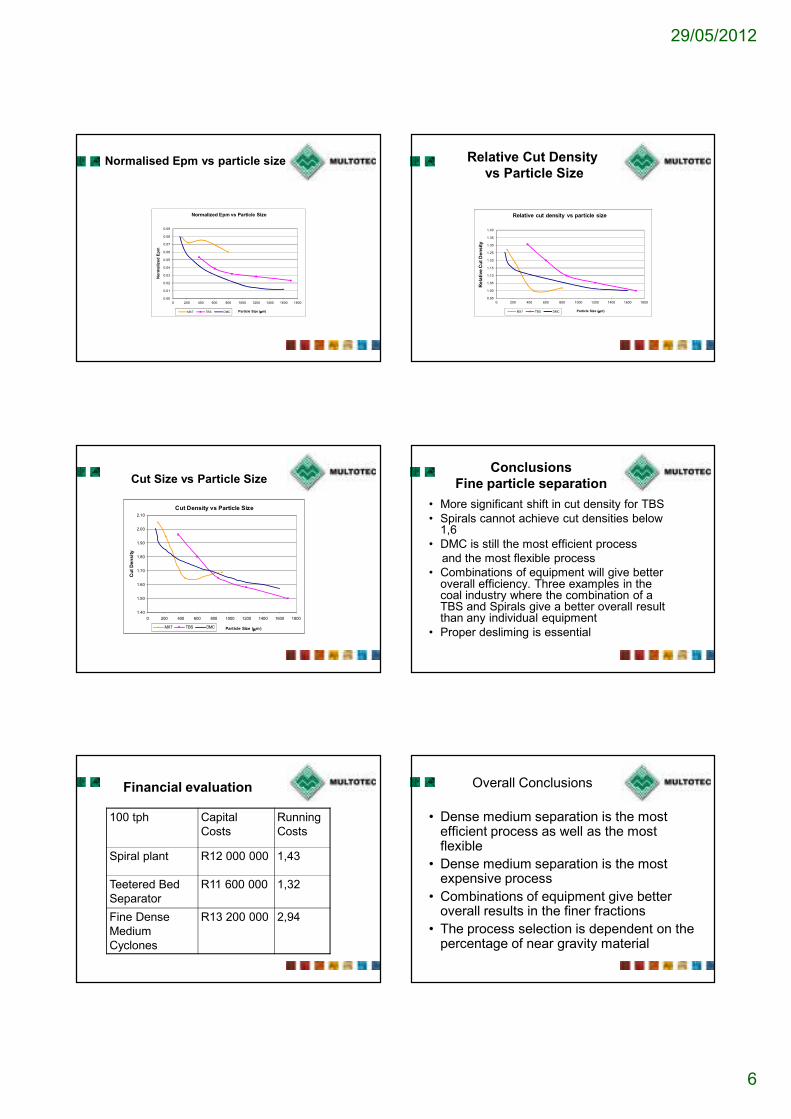
Normalised Epm vs particle size
0.00
0.01
0.02
0.03
0.04
0.05
0.06
0.07
0.08
0.09
0 200 400 600 800 1000 1200 1400 1600 1800
No
rma
lize
d E
pm
Particle Size (µµµµm)
Normalized Epm vs Particle Size
MX7 TBS DMC
Relative Cut Density
vs Particle Size
0.95
1.00
1.05
1.10
1.15
1.20
1.25
1.30
1.35
1.40
0 200 400 600 800 1000 1200 1400 1600 1800
Re
lati
ve
Cu
t D
en
sit
y
Particle Size (µµµµm)
Relative cut density vs particle size
MX7 TBS DMC
Cut Size vs Particle Size
Cut Density vs Particle Size
1.40
1.50
1.60
1.70
1.80
1.90
2.00
2.10
0 200 400 600 800 1000 1200 1400 1600 1800
Particle Size (µµµµm)
Cu
t D
en
sit
y
MX7 TBS DMC
Conclusions
Fine particle separation
• More significant shift in cut density for TBS
• Spirals cannot achieve cut densities below 1,6
• DMC is still the most efficient process
and the most flexible process
• Combinations of equipment will give better overall efficiency. Three examples in the coal industry where the combination of a TBS and Spirals give a better overall result than any individual equipment
• Proper desliming is essential
Financial evaluation
100 tph Capital
Costs
Running
Costs
Spiral plant R12 000 000 1,43
Teetered Bed
Separator
R11 600 000 1,32
Fine Dense
Medium
Cyclones
R13 200 000 2,94
Overall Conclusions
• Dense medium separation is the most efficient process as well as the most flexible
• Dense medium separation is the most expensive process
• Combinations of equipment give better overall results in the finer fractions
• The process selection is dependent on the percentage of near gravity material
29/05/2012
7
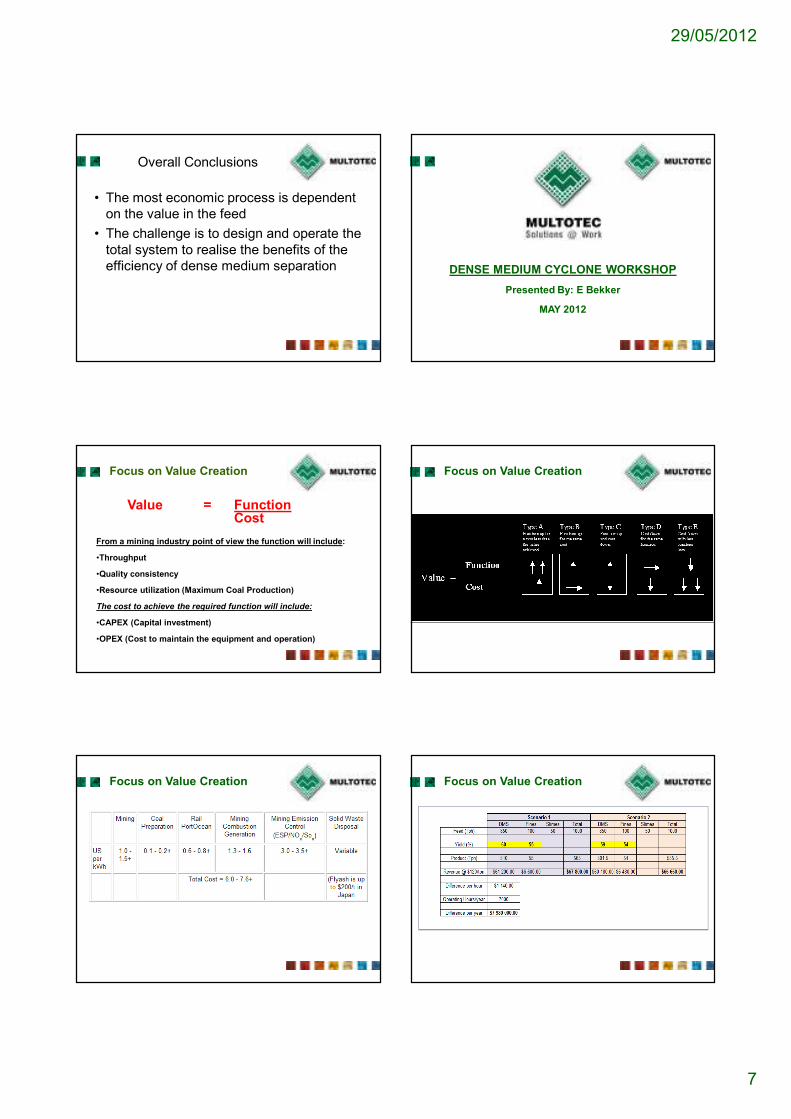
Overall Conclusions
• The most economic process is dependent
on the value in the feed
• The challenge is to design and operate the
total system to realise the benefits of the
efficiency of dense medium separation DENSE MEDIUM CYCLONE WORKSHOP
Presented By: E Bekker
MAY 2012
Value = FunctionCost
From a mining industry point of view the function will include:
•Throughput
•Quality consistency
•Resource utilization (Maximum Coal Production)
The cost to achieve the required function will include:
•CAPEX (Capital investment)
•OPEX (Cost to maintain the equipment and operation)
Focus on Value Creation Focus on Value Creation
Focus on Value Creation Focus on Value Creation
29/05/2012
8
Contents
� DMC Process
� Washability
� Dense Medium Cyclones
� Cyclone Operation
� Cyclone Design
� Performance Constraints
� DMC Factors
� Operational Parameters
� Cyclone selection
� Fault Finding
� Maintenance
DMC Flow SheetsTypical Dense Medium Process Flow Sheets
DMC Flow SheetsTypical Dense Medium Process Flow Sheets
Contents
� DMC Process
� Washability
� Dense Medium Cyclones
� Cyclone Operation
� Cyclone Design
� Performance Constraints
� DMC Factors
� Operational Parameters
� Cyclone selection
� Fault Finding
� Maintenance
� Defined as -
The % (Dx) of NEAR DENSITY material which lies within ± 0.1RD intervals on either side of the Separation Density.(New standard +/- 0.05)
Dx, % Degree of Difficulty
0 – 7 Simple
7 – 10 Moderate Difficult
10 – 15 Difficult
15 – 20 Very Difficult
20 – 25 Exceedingly Difficult
> 25 Formidable
Near Density
WashabilityNear Density
Washability
29/05/2012
9
0
5
10
15
20
25
1.3 1.4 1.5 1.6 1.7 1.8 1.9 2
Perc
en
tag
e
Density
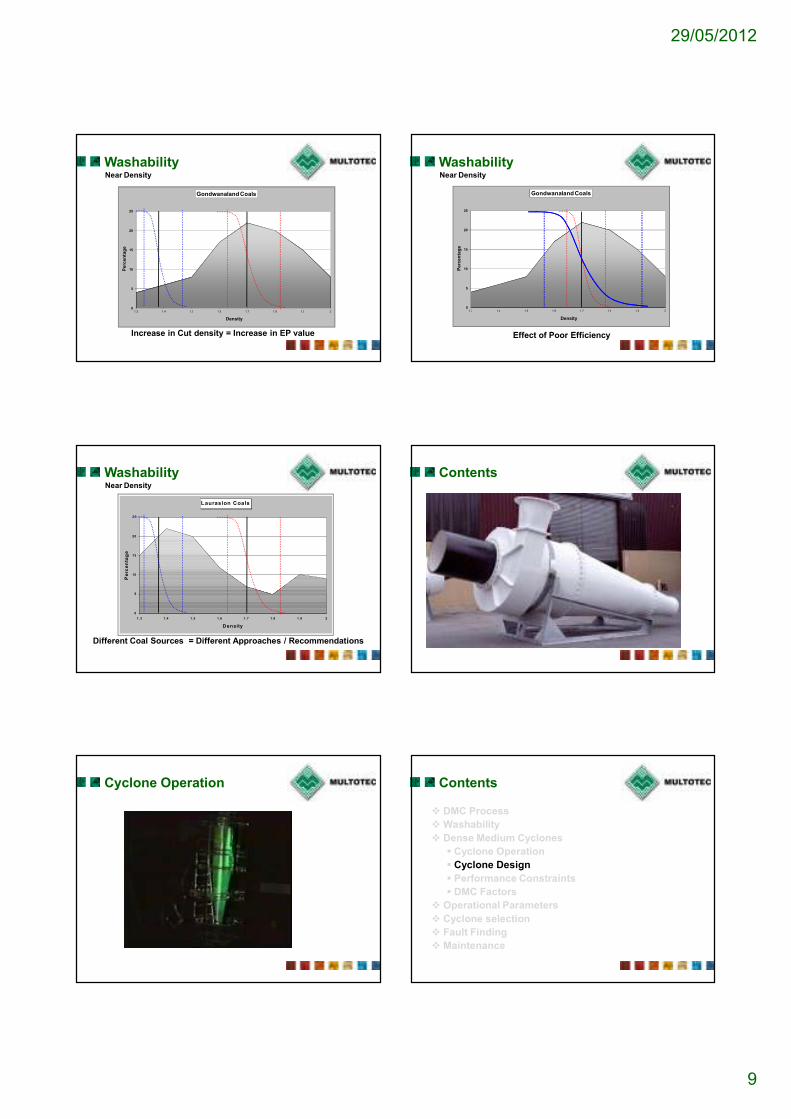
Gondwanaland Coals
Increase in Cut density = Increase in EP value
Near Density
Washability
0
5
10
15
20
25
1.3 1.4 1.5 1.6 1.7 1.8 1.9 2
Perc
en
tag
e
Density
Gondwanaland Coals
Effect of Poor Efficiency
Near Density
Washability
Laurasion Coals
0
5
10
15
20
25
1.3 1.4 1.5 1.6 1.7 1.8 1.9 2
Density
Pe
rce
nta
ge
Different Coal Sources = Different Approaches / Recommendations
Near Density
Washability Contents
� DMC Process
� Washability
� Dense Medium Cyclones
� Cyclone Operation
� Cyclone Design
� Performance Constraints
� DMC Factors
� Operational Parameters
� Cyclone selection
� Fault Finding
� Maintenance
Cyclone Operation Contents
� DMC Process
� Washability
� Dense Medium Cyclones
� Cyclone Operation
� Cyclone Design
� Performance Constraints
� DMC Factors
� Operational Parameters
� Cyclone selection
� Fault Finding
� Maintenance
29/05/2012
10
Cyclone Dimensions: DSM vs. Multotec
Cyclone Design
Cyclone type DSM Multotec
Diameter D D
Inlet 0.2xD-Tangential 0.2xD,0.25xD,0.3xD – Evolute and
Scrolled Evolute
Cone Angle 20 Degrees 20 Degrees
Vortex finder 0.43xD 0.43xD,0.5xD
Spigot 0.7xVF 0.7xVF, 0.8xVF
Barrel Seldom used Yes
Cyclone Dimensions: DSM vs. Multotec
Cyclone Design
Tangential Involute Scrolled Evolute
Multotec Standard Capacity Cyclones Multotec High Capacity Cyclones
Cyclone
Diameter (mm)
Max Particle Size
(mm)Coal Feed (t/h)
Cyclone
Diameter (mm)
Max Particle Size
(mm)Coal Feed (t/h)
510 34 54 510 51 99
610 41 81 610 61 145
660 44 97 660 66 175
710 47 114 710 71 207
800 53 149 800 80 270
900 60 196 900 94 355
1000 67 249 1000 100 454
1150 77 351 1150 115 638
1300 87 468 1300 130 854
1450 97 608 1450 145 1108
Cyclone Dimensions: DSM vs. Multotec
Cyclone DesignEffect of Cyclone Configuration
Cyclone DesignB
T
yp
e In
let
A T
yp
e In
let
A V
ort
ex
F
ind
er
XA
V
ort
ex
F
ind
er
No
B
arr
el
Ba
rre
l
Inlet Size Increases
Vortex Finder Increases
Cyclone Length Increases
Inlet Size Increases
Cyclone Capacity Increases
Efficiency Decreases
Larger Spigot Available (0.8 x VF)
Cyclone Capacity Increases
Cyclone Capacity Increases
Efficiency Decreases
Efficiency Increases
As the Inlet Head increases:
As the Vortex Finder increases:
With the inclusion of a Barrel:
Effect on Efficiency
Cyclone Design
0.01
0.012
0.014
0.016
0.018
0.02
0.022
Ep
m
Cyclone Type
Cyclone DesignEffect on Efficiency
29/05/2012
11
Contents
� DMC Process
� Washability
� Dense Medium Cyclones
� Cyclone Operation
� Cyclone Design
� Performance Constraints
� DMC Factors
� Operational Parameters
� Cyclone selection
� Fault Finding
� Maintenance
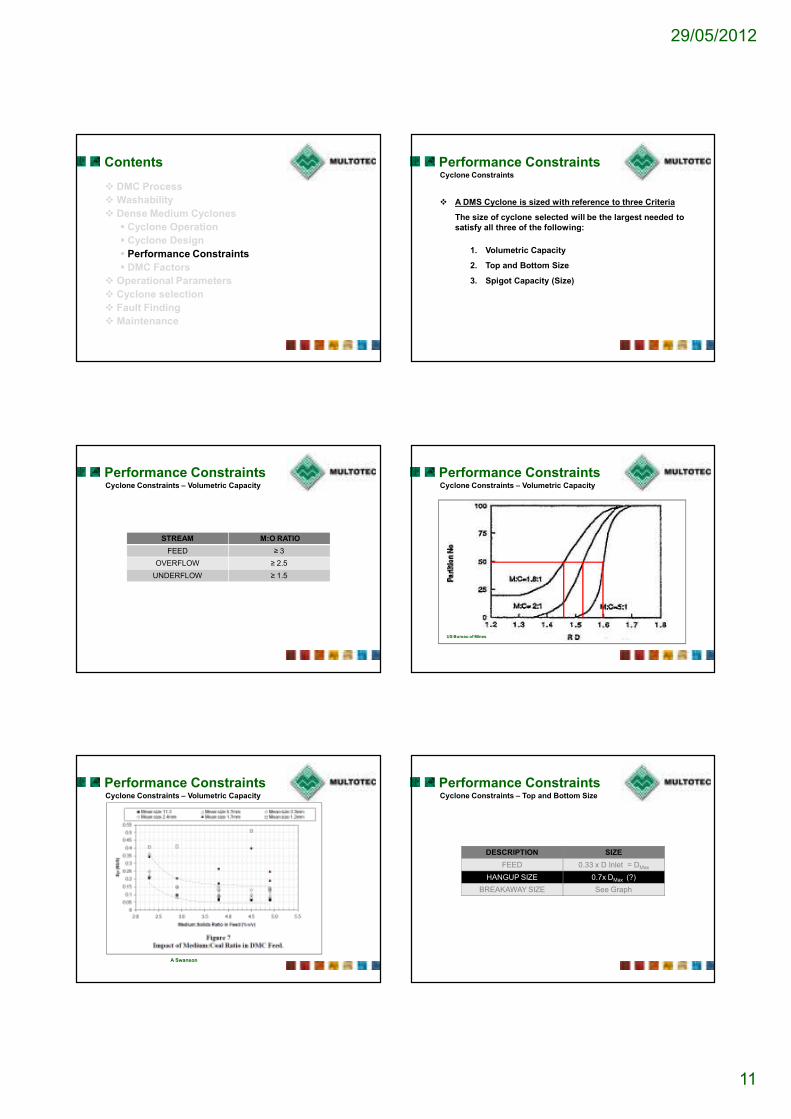
� A DMS Cyclone is sized with reference to three Criteria
The size of cyclone selected will be the largest needed to
satisfy all three of the following:
1. Volumetric Capacity
2. Top and Bottom Size
3. Spigot Capacity (Size)
Cyclone Constraints
Performance Constraints
STREAM M:O RATIO
FEED ≥ 3
OVERFLOW ≥ 2.5
UNDERFLOW ≥ 1.5
Cyclone Constraints – Volumetric Capacity
Performance Constraints Performance Constraints
US Bureau of Mines
Cyclone Constraints – Volumetric Capacity
Performance Constraints
A Swanson
Cyclone Constraints – Volumetric Capacity
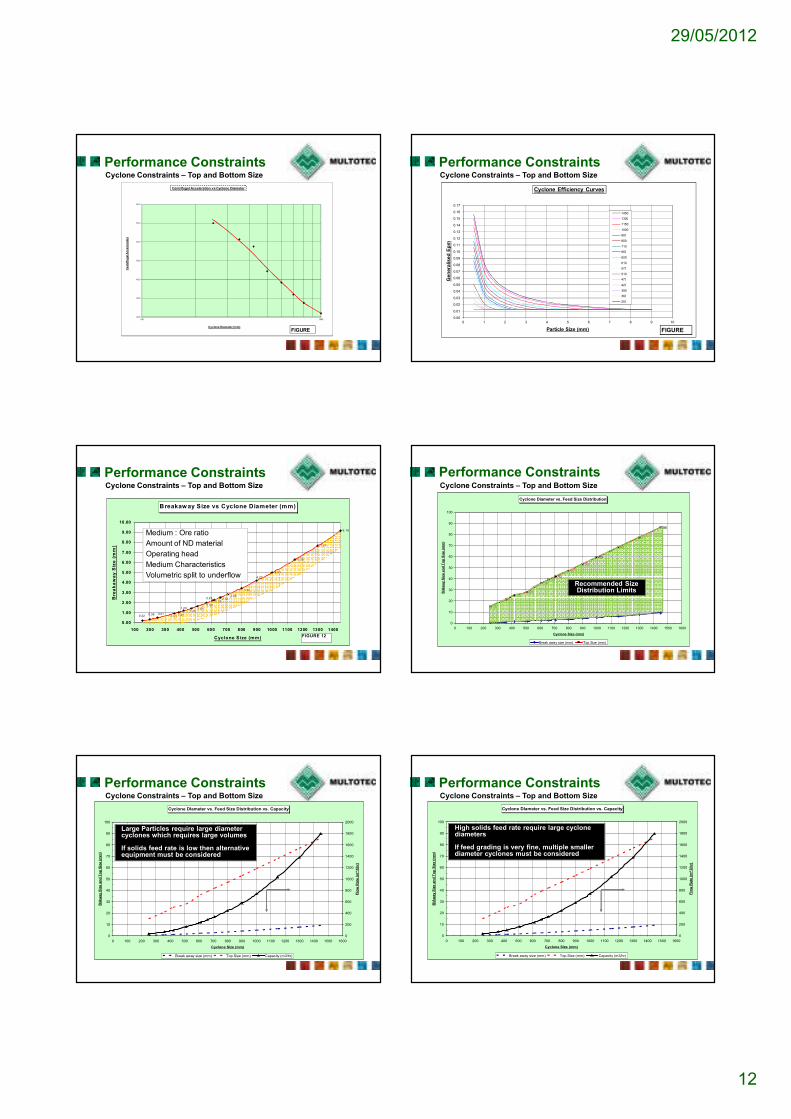
DESCRIPTION SIZE
FEED 0.33 x D Inlet = DMax
HANGUP SIZE 0.7x DMax (?)
BREAKAWAY SIZE See Graph
Performance ConstraintsCyclone Constraints – Top and Bottom Size
29/05/2012
12
30.0
35.0
40.0
45.0
50.0
55.0
60.0
100 1000
Ce
ntr
ifu
gal A
cce
lera
tio
n
Cyclone Diameter (mm)
Centrifugal Acceleration vs Cyclone Diameter
FIGURE
Performance ConstraintsCyclone Constraints – Top and Bottom Size
0.00
0.01
0.02
0.03
0.04
0.05
0.06
0.07
0.08
0.09
0.10
0.11
0.12
0.13
0.14
0.15
0.16
0.17
0 1 2 3 4 5 6 7 8 9 10
Gen
era
lised
Ep
m
Particle Size (mm)
Cyclone Efficiency Curves
1450
1300
1150
1000
900
800
710
660
620
610
570
510
470
420
390
360
250
FIGURE
Performance ConstraintsCyclone Constraints – Top and Bottom Size
Figure 2. Actual EPM Values for Low and High Density Separations
D50 = 1.80
D50 = 1.35
EPM = (1.369 - 1.337) / 2
= 0.016
EPM = (1.822 - 1.779) / 2 =
0.0215
Actual EPM = A + B p W /d
A = Constant
B = Constant, f( Medium
Characteristics)
p =RD
DMC FactorsNormalised Epm
Figure 3 : Normalised EPM Values for Low and High Density
Separations
0.00
0.20
0.40
0.60
0.80
1.00
0.80 0.90 1.00 1.10 1.20
Relative Density
Pa
rtit
ion
Nu
mb
er
D50 = 1.35
D50 = 1.8
(1.369 - 1.337) / ( 2 * 1.8 ) = 0.012
(1.822 - 1.779) / ( 2 * 1.35 ) = 0.012
DMC FactorsNormalised Epm
0.00
0.01
0.02
0.03
0.04
0.05
0.06
0.07
0.08
0.09
0.10
0.11
0.12
0.13
0.14
0.15
0.16
0.17
0 1 2 3 4 5 6 7 8 9 10
No
rmali
sed
Ep
m
Particle Size (mm)
Figure 5 : Cyclone Efficiency Curves
1450
420
DMC FactorsNormalised Epm
29/05/2012
14
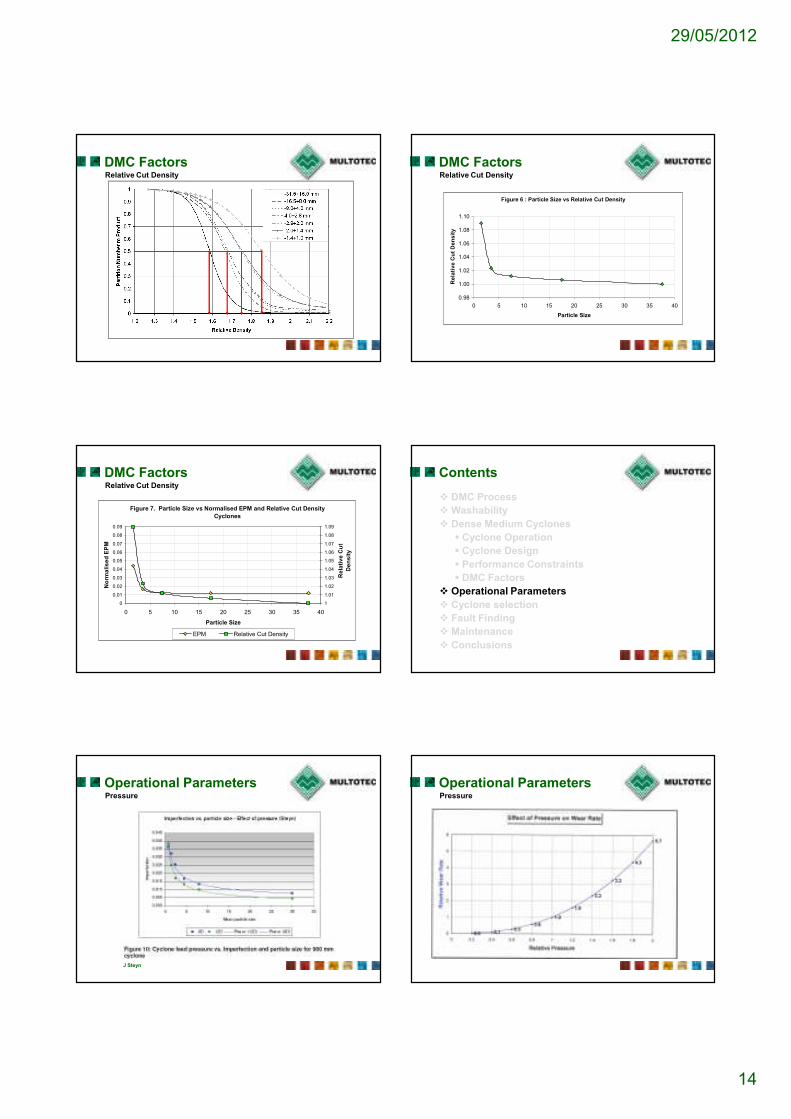
DMC FactorsRelative Cut Density
Figure 6 : Particle Size vs Relative Cut Density
0.98
1.00
1.02
1.04
1.06
1.08
1.10
0 5 10 15 20 25 30 35 40
Particle Size
Re
lati
ve
Cu
t D
en
sit
y
DMC FactorsRelative Cut Density
Figure 7. Particle Size vs Normalised EPM and Relative Cut Density
Cyclones
0
0.01
0.02
0.03
0.04
0.05
0.06
0.07
0.08
0.09
0 5 10 15 20 25 30 35 40
Particle Size
No
rma
lis
ed
EP
M
1
1.01
1.02
1.03
1.04
1.05
1.06
1.07
1.08
1.09
Re
lati
ve
Cu
t
De
ns
ity
EPM Relative Cut Density
DMC FactorsRelative Cut Density
Contents
� DMC Process
� Washability
� Dense Medium Cyclones
� Cyclone Operation
� Cyclone Design
� Performance Constraints
� DMC Factors
� Operational Parameters
� Cyclone selection
� Fault Finding
� Maintenance
� Conclusions
Operational ParametersPressure
J Steyn
Operational ParametersPressure
29/05/2012
15
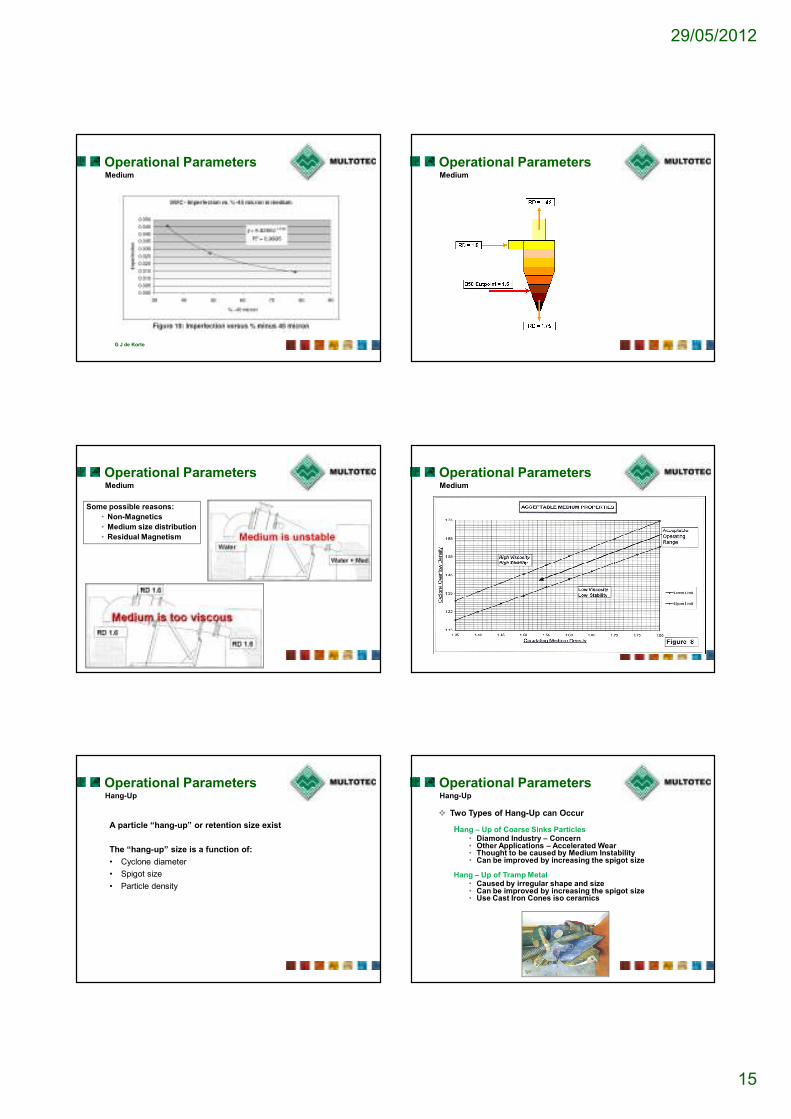
Operational ParametersMedium
G J de Korte
Operational ParametersMedium
Some possible reasons:
• Non-Magnetics
• Medium size distribution
• Residual Magnetism
Operational ParametersMedium
Operational ParametersMedium
Operational ParametersHang-Up
A particle “hang-up” or retention size exist
The “hang-up” size is a function of:
• Cyclone diameter
• Spigot size
• Particle density
� Two Types of Hang-Up can Occur
Hang – Up of Coarse Sinks Particles• Diamond Industry – Concern• Other Applications – Accelerated Wear• Thought to be caused by Medium Instability• Can be improved by increasing the spigot size
Hang – Up of Tramp Metal• Caused by irregular shape and size• Can be improved by increasing the spigot size• Use Cast Iron Cones iso ceramics
Operational ParametersHang-Up
29/05/2012
16
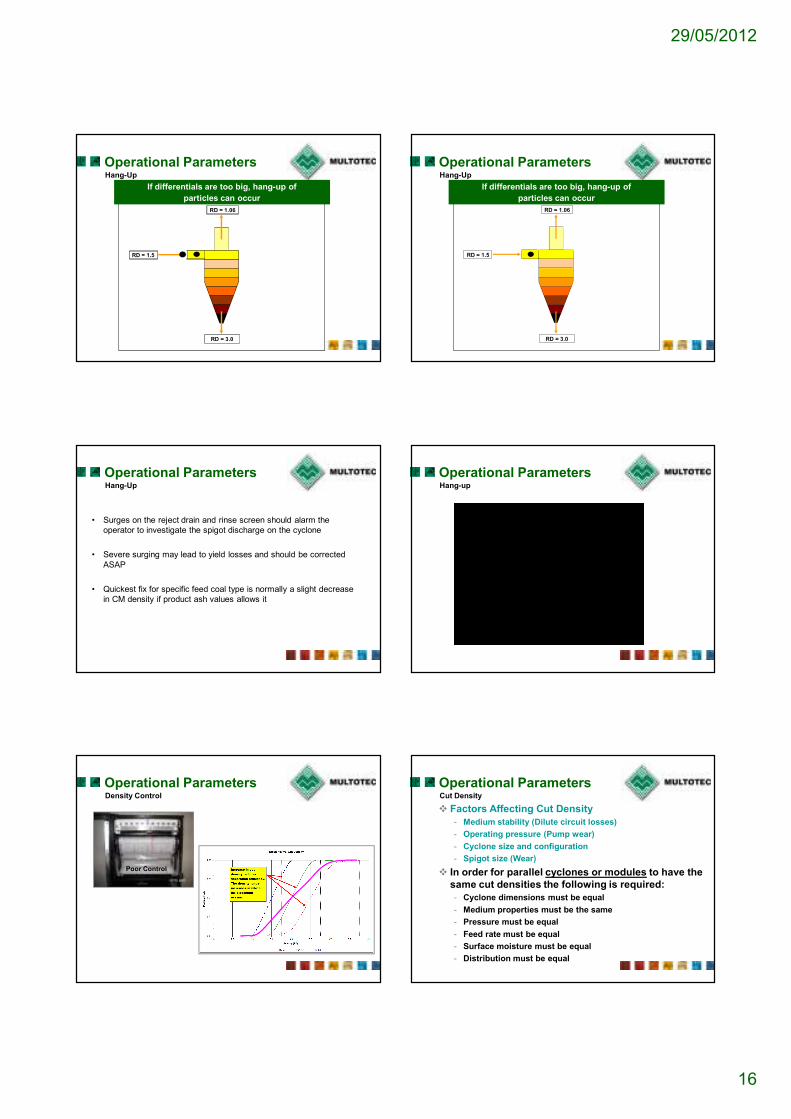
RD = 1.5
RD = 1.06
RD = 3.0
Operational Parameters
If differentials are too big, hang-up of
particles can occur
Hang-Up
RD = 1.5
RD = 1.06
RD = 3.0
Operational Parameters
If differentials are too big, hang-up of
particles can occur
Hang-Up
Operational ParametersHang-Up
• Surges on the reject drain and rinse screen should alarm the
operator to investigate the spigot discharge on the cyclone
• Severe surging may lead to yield losses and should be corrected
ASAP
• Quickest fix for specific feed coal type is normally a slight decrease
in CM density if product ash values allows it
Operational ParametersHang-up
Poor Control
Operational ParametersDensity Control
� Factors Affecting Cut Density
- Medium stability (Dilute circuit losses)
- Operating pressure (Pump wear)
- Cyclone size and configuration
- Spigot size (Wear)
� In order for parallel cyclones or modules to have the
same cut densities the following is required:
- Cyclone dimensions must be equal
- Medium properties must be the same
- Pressure must be equal
- Feed rate must be equal
- Surface moisture must be equal
- Distribution must be equal
Operational ParametersCut Density
29/05/2012
17
Operational ParametersDistributors
Operational ParametersDistributors
Operational ParametersDistributors
Contents
� DMC Process
� Washability
� Dense Medium Cyclones
� Cyclone Operation
� Cyclone Design
� Performance Constraints
� DMC Factors
� Operational Parameters
� Cyclone selection
� Fault Finding
� Maintenance
� Conclusions
When selecting DM Cyclones be careful:
– To only base the selection on the smallest cyclone
with the highest capacity (Efficiency)
– Note important maintenance issues (Eff)
– Consider all the coal feed types (statistical view,
especially on yield expectations and spigot overload
conditions)
Cyclone Selection
• One should consider the following:
– Feed rate (solids)
– Medium to Ore Ratio (Feed, OF & UF)
– Top Size in the feed
– Feed Particle Size Distribution
– Yield to Product
– Spigot capacity
Cyclone Selection
29/05/2012
18
• Example
– Feed tonnage = 200 t/h
– Feed Solids density = 1.4 t/m3
– Top size = 50 mm
– Yield = 60 % to product
– Sinks density = 1.55 t/m3
Cyclone Selection
Feed Particle Size Distribution
Cyclone Selection
Data for All Inlet Types
Cyclone Selection
0
200
400
600
800
1000
1200
0.1 1 10 100
Particle Size (mm)
Cy
clo
ne
Dia
me
ter
(mm
)
db
dmax
• Example
– Calculate coal balance around cyclone
– Feed = 200 tph (143 m3/h)
– Floats = 200 x 0.60 = 120 tph
– Sinks = 200 - 90 = 80 tph (52 m3/h)
Cyclone Selection
• Example
– Do initial selection on medium to Coal ratio
– Minimum ratio for coal is 3.0 to 1.0
– Medium volume = 3.0 x 143 = 429 m3/h
– Pulp volume required = 572 m3/h
Cyclone Selection Cyclone Selection
29/05/2012
19
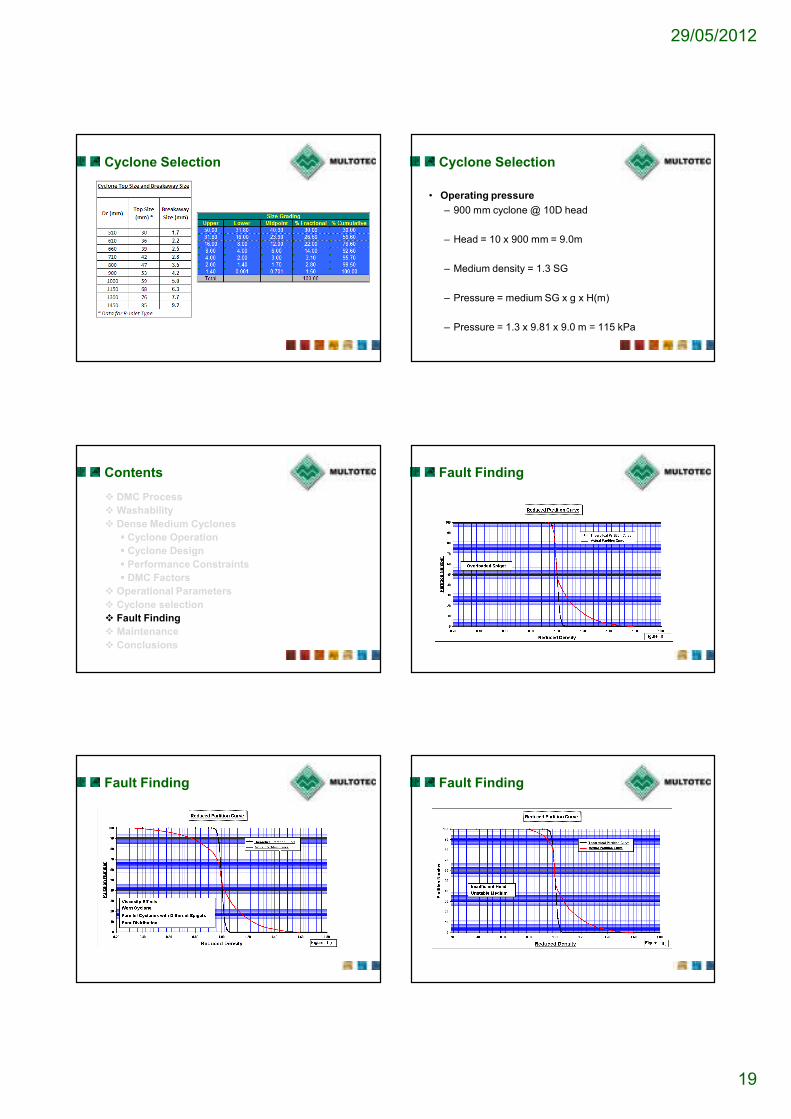
Cyclone Selection
• Operating pressure
– 900 mm cyclone @ 10D head
– Head = 10 x 900 mm = 9.0m
– Medium density = 1.3 SG
– Pressure = medium SG x g x H(m)
– Pressure = 1.3 x 9.81 x 9.0 m = 115 kPa
Cyclone Selection
Contents
� DMC Process
� Washability
� Dense Medium Cyclones
� Cyclone Operation
� Cyclone Design
� Performance Constraints
� DMC Factors
� Operational Parameters
� Cyclone selection
� Fault Finding
� Maintenance
� Conclusions
Fault Finding
Fault Finding Fault Finding
29/05/2012
20
Fault Finding
• A list of factors, which can affect cyclone performance, follows:
– Size of cyclone
– Size of spigot
– Design of cyclone
– Steps or grooves inside cyclone
– Feed rate
– Yield
– Media stability and viscosity (% non magnetics, slimes, PSD of
medium solids)
– Particle size distribution of feed ore
– Operating head (Constant / Stable?)
– Density control (Constant / Stable?)
– Sampling and analyses errors
Fault Finding
Contents
� DMC Process
� Washability
� Dense Medium Cyclones
� Cyclone Operation
� Cyclone Design
� Performance Constraints
� DMC Factors
� Operational Parameters
� Cyclone selection
� Fault Finding
� Maintenance
� Oversize spigot
Maintenance
� Welding
Maintenance� Effect of a hammer
Maintenance
29/05/2012
21
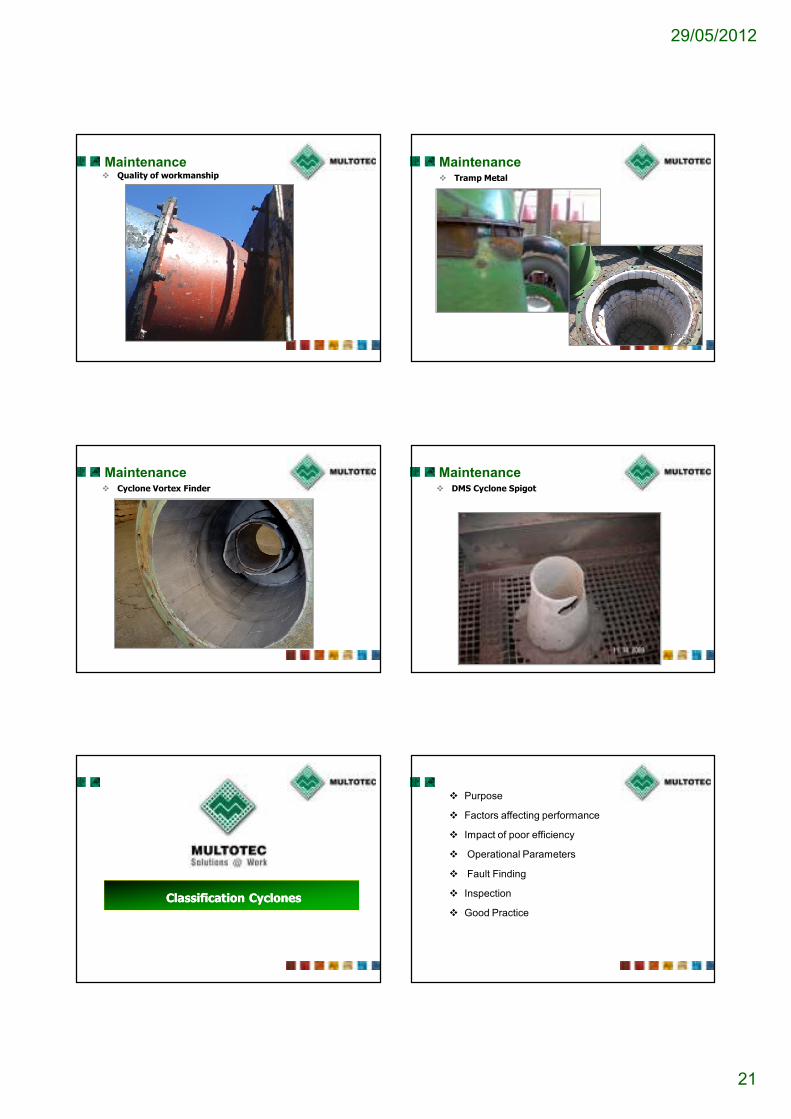
� Quality of workmanship
Maintenance� Tramp Metal
Maintenance
� Cyclone Vortex Finder
Maintenance� DMS Cyclone Spigot
Maintenance
Classification CyclonesClassification Cyclones
� Purpose
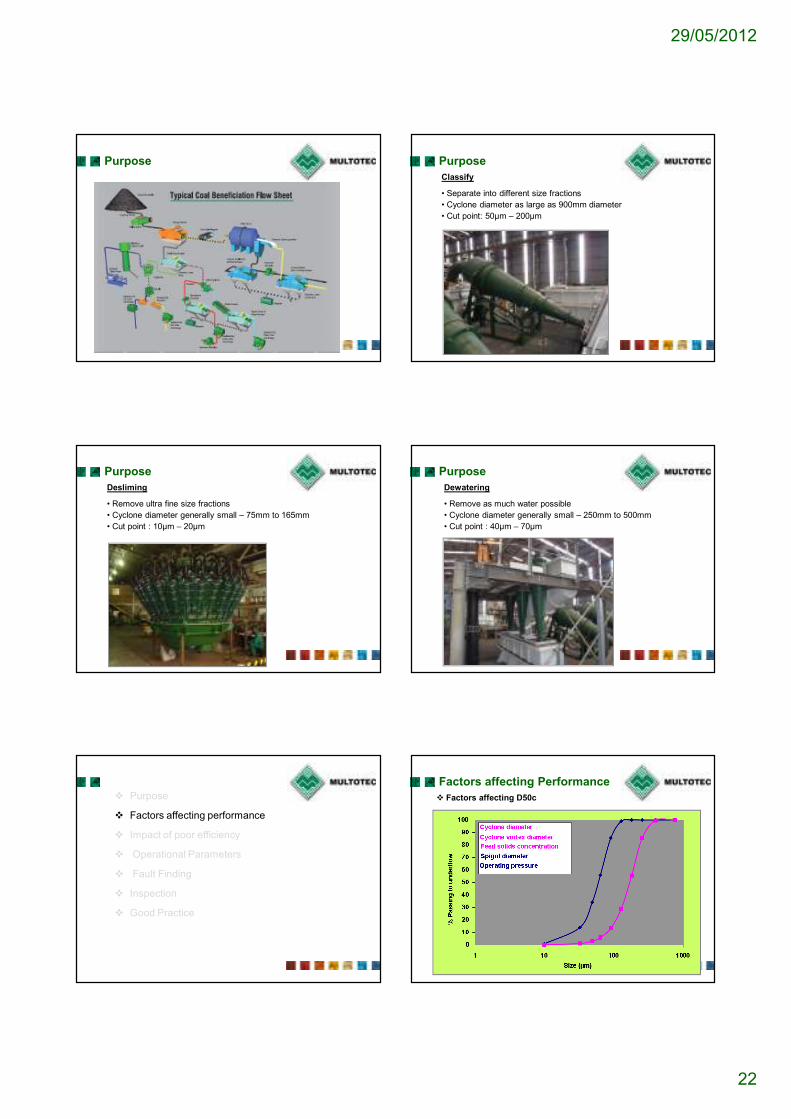
� Factors affecting performance
� Impact of poor efficiency
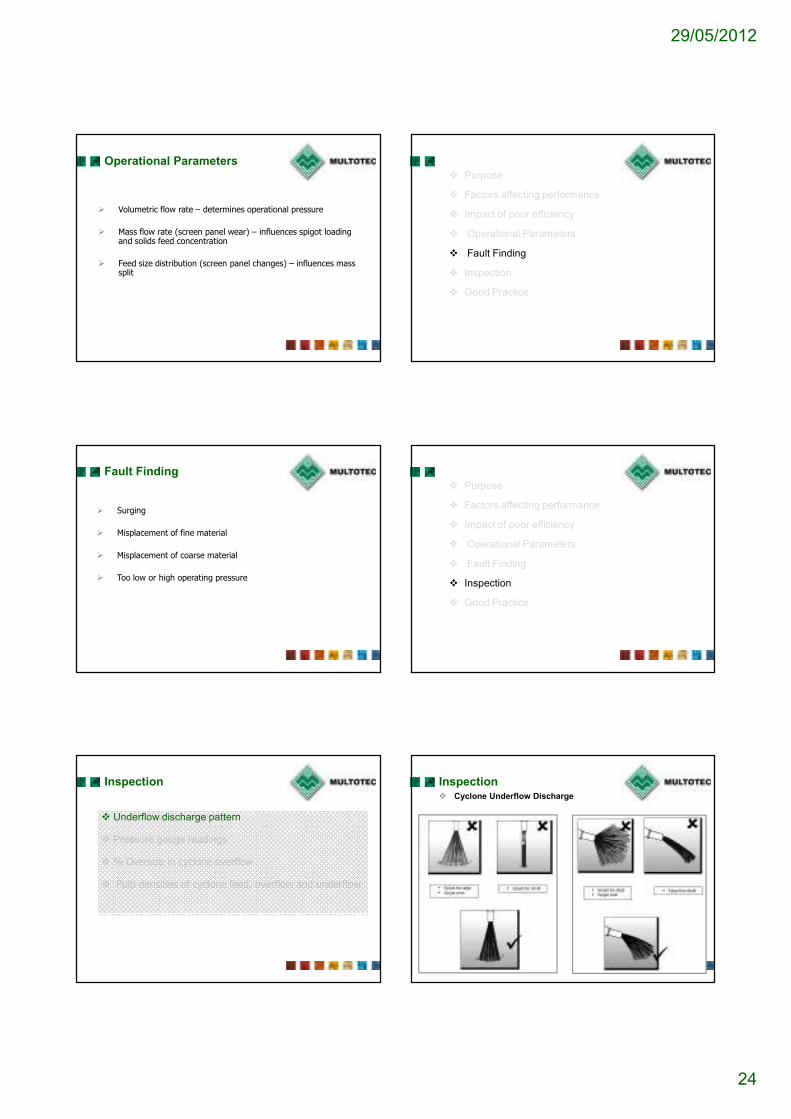
� Operational Parameters
� Fault Finding
� Inspection
� Good Practice
29/05/2012
22
Purpose
Classify
• Separate into different size fractions
• Cyclone diameter as large as 900mm diameter
• Cut point: 50µm – 200µm
Purpose
Desliming
• Remove ultra fine size fractions
• Cyclone diameter generally small – 75mm to 165mm
• Cut point : 10µm – 20µm
Purpose
Dewatering
• Remove as much water possible
• Cyclone diameter generally small – 250mm to 500mm
� Regular inspections – cyclones and screen panels
� Proper access for sampling
Good Practice
Coal SpiralsCoal Spirals
• Spirals in a Coal Prep Flow Sheet
• What are Spiral Concentrators ?
• How do they work?
• Who needs them?
• Why particles separate
• Separation criteria
• Factors affecting performance
• Single vs. Double stage spirals
• Effect of slimes
• Spirals vs. TBS
• General Problems
• What not to do
Spirals in a Coal Prep Flow sheet
• Generally treat 1.0 x 0.1 mm (16 x 150 Mesh)
• Allow heavy media cyclones to clean down to 1 mm—more efficient desliming and media recovery
• Allow froth flotation to clean minus 0.1 mm (150 mesh)—better flotation of finer particles
Fine coal (- 1 mm):
Up to 20% of ROM
Spirals in a Coal Prep Flow sheet
Spirals in a Coal Prep Flow sheet
29/05/2012
27
MX 7 spiral bank
Spirals are:
� very forgiving nature,
� tolerate wide range of feed tonnages,
� low cost to purchase& operate,
� Easy adjust and relativelygood performance.
Spirals in a Coal Prep Flow sheet • Spirals in a Coal Prep Flow Sheet
• What are Spiral Concentrators ?
• How do they work?
• Who needs them?
• Why particles separate
• Separation criteria
• Factors affecting performance
• Single vs. Double stage spirals
• Effect of slimes
• Spirals vs. TBS
• General Problems
• What not to do
� Process equipment
� No moving parts
� Used to separate valuable
from non valuable minerals
What are Spiral Concentrators?
� Uses differences in mineral
densities to separate them
� As minerals flow through
concentrator, they segregate
along the trough
� Large diameter spirals
� Small diameter spirals
How do they work?
� Used in several sectors
within the minerals
processing industry
including:
� Coal
� Heavy Minerals
� Chromite
� Tin/tantalite
� Base metals
� Gold
� Iron Ore
Who needs them?• Spirals in a Coal Prep Flow Sheet
• What are Spiral Concentrators ?
• How do they work?
• Who needs them?
• Why particles separate
• Separation criteria
• Factors affecting performance
• Single vs. Double stage spirals
• Effect of slimes
• Spirals vs. TBS
• General Problems
• What not to do
29/05/2012
28
Simplified forces balance: Individual particle - radial direction
Dynamic lift
Gravity
Centrifugal forces
Viscous forces (fluid drag)
Wall friction
Separation Ratio Application
Excellent 2,0 Mineral Sands
Good 1,5 Coal
Poor 1,1 Diamonds
Why particles separate
AshClean Coal
Why particles separate
• Gravity separation utilising spiral concentrators is not onlydependent on the differential between particle specific gravity, butvarious other mineral characteristics such as;
� Particle size
� Shape
� Porosity
� Mineral content
Separation Criteria
Check feed to spirals:
o Factors that affect the feed
� Slimes content
� Size distribution
� Percent solids
� Grade
� Mineral
� Tonnage
� Volumetric flow
Factors affecting Performance
• Spirals in a Coal Prep Flow Sheet
• What are Spiral Concentrators ?
• How do they work?
• Who needs them?
• Why particles separate
• Separation criteria
• Factors affecting performance
• Single vs. Double stage spirals
• Effect of slimes
• Spirals vs. TBS
• General Problems
• What not to do
Single vs. Double Stage Spirals
SINGLE vs. DOUBLE STAGE ASH-YIELD
6%
7%
8%
9%
10%
11%
12%
13%
14%
40% 45% 50% 55% 60% 65% 70% 75%
Yield
Ash
Double stage
Single stage
5 %
2.5 %
29/05/2012
29
� Two-in-one coal spirals
• savings in space• pumps• sumps• power and piping
� results in a very quickpay back
Single vs. Double Stage Spirals
� Deslime cyclones ahead of the spirals radically improved theperformance of the spirals.
Effect of Slimes
• Spirals in a Coal Prep Flow Sheet
• What are Spiral Concentrators ?
• How do they work?
• Who needs them?
• Why particles separate
• Separation criteria
• Factors affecting performance
• Single vs. Double stage spirals
• Effect of slimes
• Spirals vs. TBS
• General Problems
• What not to do
Cut Density vs Particle Size
1.40
1.50
1.60
1.70
1.80
1.90
2.00
2.10
0 200 400 600 800 1000 1200 1400 1600 1800
Particle Size (µµµµm )
Cu
t D
en
sit
y
MX7 TBS
� Results showed the equipment range links to size range
� Spirals best between 800 and 100 micron
� T B S better over coarser range
Spirals vs. TBS
� Flow sheet 1
Spirals vs. TBS Spirals vs. TBS� Flow sheet 2
29/05/2012
30
• Spirals in a Coal Prep Flow Sheet
• What are Spiral Concentrators ?
• How do they work?
• Who needs them?
• Why particles separate
• Separation criteria
• Factors affecting performance
• Single vs. Double stage spirals
• Effect of slimes
• Spirals vs. TBS
• General Problems
• What not to do
General Problems
We must understand that spirals are:
� Static pieces of equipment
� Have no moving parts – splitters only
� They cannot think or move without outside
intervention
� Very often neglected in a plant
If the spiral plant is not producing the goods, it is due to:
� Poor plant design
� Deterioration of the spirals or equipment
� Changes to feed conditions
� Plant changes
� Ignore or neglect operating conditions
General Problems
Two areas affected when problems:
� Production related
� Operation related
General Problems
Production Related:
� Loss in yield and quality of final product due to under
washing on other processes to maintain product
quality
� Off spec product produced to get yield
� Results in loss of revenue
General Problems
Operation Related:
� Blockages
� Deterioration of the spirals
� Incorrect pipes in launders
� Incorrect feed conditions
� Overflowing slurry
� Leak in pipes and launders
� Worn spirals
General Problems
29/05/2012
31
Areas to look out for:
� Distribution of slurry
� Feed conditions
� Spiral and equipment condition
General Problems• Spirals in a Coal Prep Flow Sheet
• What are Spiral Concentrators ?
• How do they work?
• Who needs them?
• Why particles separate
• Separation criteria
• Factors affecting performance
• Single vs. Double stage spirals
• Effect of slimes
• Spirals vs. TBS
• General Problems
• What not to do
Incorrect Piping Incorrect Piping
Incorrect Piping Incorrect Piping
29/05/2012
32
Incorrect Piping Pump surge – too high volume
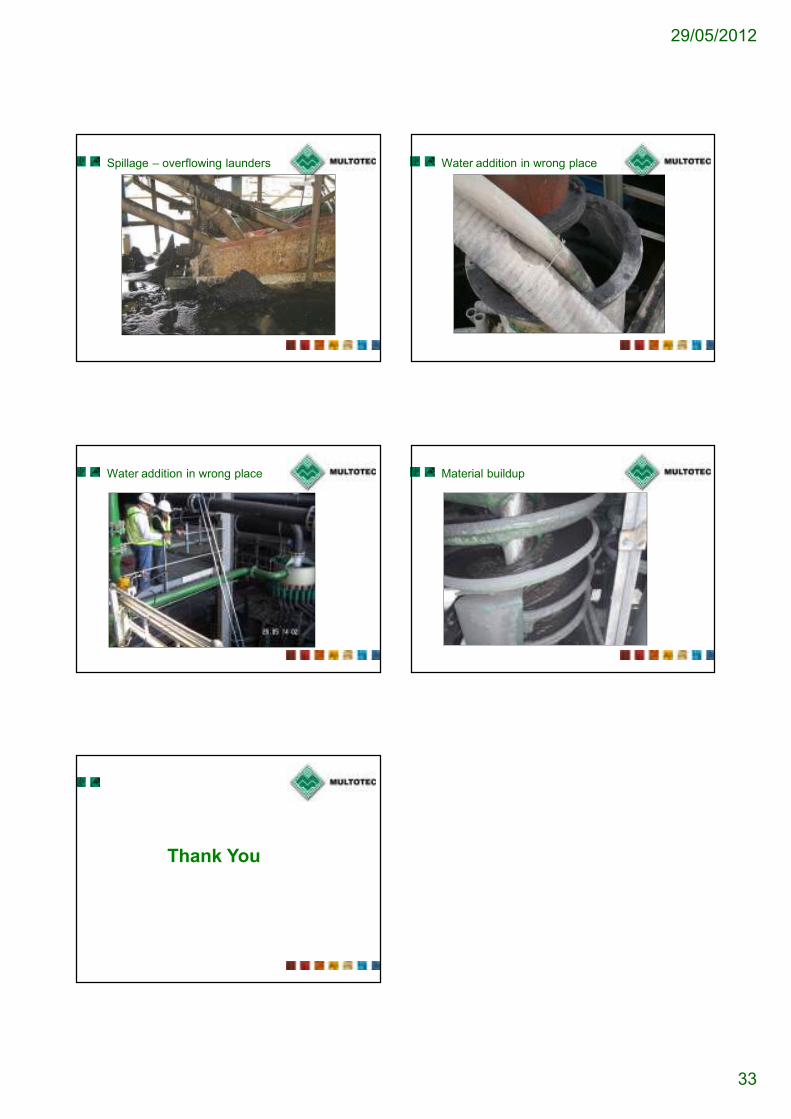
Too high volume Worn troughs
Beaching Spirals used as ladders
29/05/2012
33
Spillage – overflowing launders Water addition in wrong place