+ All Categories
Home > Documents > COAL TO -METHANOL .J&~·r FEASIBILITY STUDY ,.c raJ 1/?1 ...

COAL TO -METHANOL .J&~·r FEASIBILITY STUDY ,.c raJ 1/?1 ...

Date post: 19-Dec-2021
Category:
Upload: others
View: 1 times
Download: 0 times
Share this document with a friend
474
••• O c ' T""" 0 0 LO LO 1"--· ('I) ' ('I) ? COAL TO -METHANOL FEASIBILITY STUDY ,.c_raJ 1/?1 BELUGA METHANOL PROJECT v, 1 DOE GRANT DE-FG01-80RA-50299 !'! 1: .,... 11' '1 F.b. :;-{ FINAL REPORT VOLUME IV ENVIRONMENTAL J\Jaska Resource> L!1: ":._ c\: Services Libr:i'V iJ>.i:.;·;, .. ,_ SJ:1•: Ill 321 i lJrivc AK S:l508--16!4 ALASKA COOK INLET REGION, INC. AND PLACER AMEX INC. SEPTEMBER 1981
Transcript

•••

O c ' T"""

0 0 LO LO 1"--· ('I) ' ('I)

? COAL TO -METHANOL .J&~·r

FEASIBILITY STUDY ,.c_raJ 1/?1

BELUGA METHANOL PROJECT v, 1

DOE GRANT DE-FG01-80RA-50299

!'! 1: .,... 11' '1

F.b. :;-{ i~~ ~ ~)

FINAL REPORT

VOLUME IV ENVIRONMENTAL

J\Jaska Resource> L!1: ":._ c\: iPfmrn~1tion Services Libr:i'V iJ>.i:.;·;, .. ,_ SJ:1•: Ill

321 i ~:.rc'. i:}~ ~-:c lJrivc Anch.:>r:t~' AK S:l508--16!4

ALASKA

COOK INLET REGION, INC. AND

PLACER AMEX INC.

SEPTEMBER 1981

BELUGA COAL TO METHANOL PROJECT

. . This submission to the Department of Energy consists of six volumes, namely,

• An Executive Review of the project as of September, 1981, and

• A five volume report presenting the findings of the Phase I Feasibility Study.

The contents of the above volumes are indicated by main headings from their Tables of Content, as listed below:

VOLUME I MINING

Introduction Geology Coal Quality Capps Mine Chuitna West Mine Tables Ancilliary Facilities Exhibits

VOLUME II

EXECUTIVE REVIEW

Executive Letter Table of Contents Technical Viability Plan for Phase II Summary of Study Appendix

VOLUME Ill GEOTECHNICAL, INFRASTRUCTURE

Introduction Geotechnical Railroad Barge Dock Bus System Camp, Town, Airstrip Product Transportation

VOLUME IV ENVIRONMENT AND SOCIOECONOMIC

Introduction Baseline Data

COAL TO METHANOL PLANT Environmental Effects

Introduction Conceptual Design Coa.l Preparation Gasification Syogas Upgrading Synthesis and Distillation Oxygen - Nitrogen - Air Utilities Wastewater, Treatment Emergency and Safety Systems Buildings and Vehicles Dust Control Drawing List

Safety and Risk Site Evaluation Bibliography Participants

VOLUME V COMMERCIAL

Introduction Marketing Capital Cost Financial Trade-Off Studies

TABLE OF CONTENTS

BELUGA METHANOL PROJECT

ENVIRONMENTAL, HEALTH, SAFETY

& SOCIOECONOMIC ASSESSMENTS

INTRODUCTION

1.0 PURPOSE OF REPORT

2.0

PROJECT LOCATION

PROJECT DESCRIPTION

SUMMARY OF THE STUDY

METHODOLOGY

General

Field Programs

SUMMARY OF MAJOR ISSUES

Fisheries

Water Sources

Wetlands

Erosion and Sedimentation

Tyonek Village

Air Quality

ENVIRONMENTAL ACCEPTABILITY OF THE PROJECT

Page No.

1-1

1-2

1-2

2-1

2-1

2-1

2-2

2-7

2-7

2-8

2-8

2-9

2-9

2-9

2-10

C' Table of Contents

Continued

AFFECTED ENVIRONMENTAL (BASELINE DATA)

3.0 GEOTECHNICAL

THE COOK INLET REGION

Geologic History

Formation of Coal Bearing Units

SURFICIAL SOl LS

THE BELUGA AREA

Topography

Geology

SITE CHARACTERIZATION

Methanol Plant Site 0 Topography 0 Subsurface Conditions 0 Groundwater 0 Plant Site Conditions

Town Site ----0 Topography 0 Subsurface Conditions 0 Groundwater

° Construction Feasibility

Dock Site 0

0

0

Topography

Subsurface Conditions

Dock Construction

Transportation Corridor and Mine Areas 0 Topography of Mine Areas

ii

Page No.

3-1

3-1

3-1

3-4

3-7

3-8

3-8

3-10

3-14

3-14

3-14·

3-16

3-22

3-22

3-26

3-26

3-26

3-28

3-28

3-31

3-31

3-32

3-32

3-36

3-36

c

c

4.0

Table of Contents

Continued

0 Surficial Conditions at Mine Areas 0

0

Transportation Corridor

Trafficability

Construction Materials 0 Surficial Geology 0 Concrete Aggregates 0

0

Asphalt Concrete Aggregates

Crushed Base Course 0 Rail road Ballast

GEOLOGIC HAZARDS

Seismicity 0 Aleutian Megathrust 0

0

Castle Mountain Fault

Bruin Bay Fault 0 Lake Clark-Lone Ridge Fault 0 Border Ranges Fault 0 Seismic Design Considerations

Ground Failure

Landslides

Volcanos

Tsunamis

Permafrost

Additional Geologic Hazards

HYDROLOGY

GROUNDWATER

Introduction

Available Supply

iii

Page No.

3-36

3-38

3-38

3-38

3-38

3-43

3-48

3-49

3-50

3-52

3-52

3-52

3-55

3-55

3-56

3-56

3-57

3-60

3-60

3-61

3-62

3-63

3-63

4-1

4-1

4-1

4-3

5.0

C~

c-

Table of Contents

Continued

0

0

Nikolai Creek Flats

Plant Site

Existing Uses

SURFACE WATER

Existing Sources 0 Lakes 0 Streams and Rivers

Possible Use of Surface Waters

ECOSYSTEMS

FRESHWATER AQUATIC ECOLOGY

Existing Habitats (Populations) 0

0

0

Habitat Characterization

Beluga Drainage

Chuitna Drainage

Nikolai Drainage

Congahbuna Drainage

Fishes

Invertebrates

TERRESTRIAL ECOLOGY

Existing Vegetation

Wetlands

Existing Mammal Populations 0 Brown Bear Denning 0

0

Brown Bear Movement and Activity Patterns

Black Bears 0 Moose

iv

Page No.

4-3

4-5

4-9

4-9

4-9

4-9

4-14

4-31

5-1

5-2

5-2

5-2

5-2

5-9

5-18

5-21

5-22

5-28

5-28

5-28

5-38

5-40

5-43

5-46

5-47

5-48

c

c

c

Table of Contents

Continued

0 Other Mammals 0 General Sensitivity to Changed Conditions

Existing Avian Populations

Amphibians

MARINE ECOLOGY

Inter-tidal and Shallow Subtidal Habitats 0 Mud Flats

Gravel and Cobble Substrate

Granite Point Intertidal and Shallow Subtidal

Marine Species 0 Fisheries

Commercial Fisheries

- Sport Fishery

Subsistence Fishery 0 Birds 0 Mammals 0 Trading Bay State Game Refuge

6.0 CLIMATOLOGY AND AIR QUALITY

CLIMATIC CONDITIONS

EXISTING AMBIENT AIR QUALITY

ATMOSPHERIC EMISSION SOURCES

v

Page No.

5-49

5-53

5-54

5-55

5-61

5-61

5-61

5-63

5-66

5-66

5-66

5-75

5-78

5-79

5-80

5-83

5-89

6-1

6-1

6-6

6-7

c, Table of Contents

Continued

7. 0 OCEANOGRAPHY

PHYSICAL OCEANOGRAPHY OF COOK INLET

Tides and Currents

Cl RCULATION

Upper Cook Inlet

Middle Cook Inlet

Lower Cook Inlet

WATER CHEMISTRY

Salinity

Temperature

Suspended Sediments

Nutrient

SEA ICE

PORTS

8.0 ARCHAEOLOGIC & HISTORIC SITES

ETHNOHISTORY AND SETTLEMENT PATTERNS

Settlement Patterns

Dwellings

Caches

Burial

Material Culture

European Contact and Trade

Historic and Prehistoric Sites

ARCHAEOLOGIC SITES

vi

Page No.

7-1

7-1

7-3

7-4

7-4

7-6

7-6

7-6

7-7

7-7

7-7

7-8

. 7-11

7-13

8-1

8-1

8-1

8-2

8-3

8-4

8-4

8-6

8-8

8-10

Table of Contents

Continued

9.0 OTHER FRAGILE LANDS

10.0

FRAGILE OR HISTORIC LANDS

NATURAL HAZARD LANDS

RENEWABLE RESOURCE LANDS

LAND PLANNING

EXISTING SOCIAL AND ECONOMIC ENVIRONMENT

WEST COOK INLET DEVELOPMENT

Employment Activities and Population

Land Ownership, Status and Use Restrictions

Land Ownership and Status 0 State of Alaska 0

0

0

0

Resource Management Lands

Industrial Lands

Reserved Use Lands

Material Lands

° Cook Inlet Region Inc. 0 Tyonek Native Corporation

° Kenai Peninsula Borough

Land Development Planning Authority 0

0

0

0

Governor1s Coal Policy Group

Beluga Interagency Task Force

Kenai Peninsula Borough

Tyonek Village Council

Transportation and Power Infrastructure

vii

Page No.

9-1

9-1

9-2

9-3

9-3

10-1

10-1

10-1

10-2

10-3

10-3

10-5

10-6

10-6

10-6

10-7

10-7

10-8

10-8

10-9

10-9

10-9

10-10

10-11

c

0 Existing 0

Air~orts

0 Docks 0 Power

Roads and

Table of Contents

Continued

Easements

Kenai Peninsula Borough Services

Other West Cook Inlet Coal Develo~ment

TYONEK VILLAGE

Background

Community Facilities and Infrastructure 0

0

0

Housing and Utilities

Education

Public Safety

Em~loyment

Community Attitudes Towards Development

CONSTRUCTION AND OPERATIONS REQUIREMENTS

Background

Direct Labor Force Requirements

Indirect Em~loyment and Total Po~ulation

OVERALL PROJECT DEVELOPMENT

Construction Cam~

° Conce~t

° Camp Facilities 0

0

Housing and Su~~ort Facilities

Utilities

Air~ort

0

0

Concept

Facilities

Permanent New Town

viii

Pa9e No.

10-11

10-13

10-14

10-15

10-15

10-16

10-17

10-17

10-19

10-19

10-20

10-21

10-22

10-24

10-25

10-25

10-25

10-26

10-26

10-28

10-28

10-30

10-30

10-33

10-35

10-35

10-35

10-38

( \ __

° Concept

Table of Contents

Continued

0 Housing, Education and Commercial Facilities 0 Transportation 0 Utilities

11.0 ACOUSTIC ENVIRONMENT

INTRODUCTION

GENERAL OVERVIEW

NOISE SENSITIVE LAND USES

ENVIRONMENTAL IMPACT

Page No.

10-38

10-39

10-41

10-42

11-1

11-1

11-3

11-3

12.0 GEOLOGY AND SOILS 12-1

CONSTRUCTION EFFECTS 12-1

LONG-TERM EFFECTS 12-1

MAJOR REGULATORY REQUIREMENTS 12-3

ENVIRONMENTAL ACCEPTABILITY OF PROPOSED ACTION 12-3

13.0 HYDROLOGY 13-1

CONSTRUCTION EFFECTS 13-1

ix

Table of Contents

Continued

Groundwater 0

0

0

Construction Water Source

Effects on Water Table

Appropriation of Water Rights

Surface Water 0 Siltation During Construction 0 Accidental Petroleum and Hazardous Substance Spills 0 As a Water Source for Construction

LONG-TERM EFFECTS

Groundwater 0

0

0

Plant Water Source

Effects on Water Table and Marshes

Appropriation of Water Rights

Surface Water 0

0

0

Wastewater Discharges and Treatment

Projected Effluent Characteristics

Effects to Surface Waters

MAJOR REGULATORY REQUIREMENTS

ENVIRONMENTAL ACCEPTABILITY OF PROPOSED ACTION

14.0 ECOSYSTEMS

CONSTRUCTION AND LONG-TERM EFFECTS

MAJOR REGULATORY REQUIREMENTS

ENVIRONMENTAL ACCEPTABILITY OF PROPOSED ACTION

X

Page No.

13-1

13-1

13-1

13-1

13-2

13-2

13-3

13-4

13-4

13-4

13-4

13-5

13-6

13-6

13-6

13-21

13-23

13-27

13-27

14-1

14-1

14-9

14-10

c Table of Contents

Continued

15.0 AIR QUALITY

CONSTRUCTION EFFECTS

EMISSIONS AND LONG-TERM EFFECTS

Process Plant Area Emissions

° Coal Preparation 0 Process Coal

° Coal Gasification

° Fugitive Emissions

Power Plant 0 Start-up and Shutdown 0 Emergencies

Mining Area Emissions

Air Emission Effects

Models Used

MAJOR REGULATORY REQUIREMENTS

ENVIRONMENTAL ACCEPTABILITY OF PROPOSED ACTION

16.0 OCEANOGRAPHY

CONSTRUCTION EFFECTS

LONG-TERM EFFECTS

MAJOR REGULATORY REQUIREMENTS

ENVIRONMENTAL ACCEPTABILITY OF PROPOSED ACTION

xi

Page No.

15-1

15-2

15-3

15-3

15-3

15-4

15-4

15-5

15-5

15-6

15-7

15-7

15-8

15-9

15-15

15-16

16-1

16-1

16-1

16-2

16-3

Table of Contents

Continued

Page No.

17.0 ARCHAEOLOGIC AND HISTORIC SITES 17-1

CONSTRUCTION EFFECTS 17-1

LONG-TERM EFFECTS 17-1

MAJOR REGULATORY REQUIREMENTS 17-2

ENVIRONMENTAL ACCEPTABILITY OF PROPOSED ACTION 17-2

18.0 SOLID WASTE 18-1

CONSTRUCTION EFFECTS 18-1

Clearing Debris 18-1

Construction Refuse 18-1

LONG-TERM EFFECTS 18-2

Ash and Sludge 18-2

Methanol Process Solid Waste 18-4

Hazardous Substances 18-5

Fugitive Coal Dust 18-5

Refuse 18-5

Sanitary Waste Solids 18-6

MAJOR REGULATORY REQUIREMENTS 18-6

RCRA of 1976 (Federal) 18-6

18 ACC 60 (State of Alaska) 18-7

ENVIRONMENTAL ACCEPTABILITY OF PROPOSED ACTION 18-7

xii

Table of Contents

Continued

19.0 SHORT- AND LONG-TERM SOCIOECONOMIC EFFECTS

COOK INLET IMPACTS

Population and Employment

Growth-1 nducing Effects

Land Use, Transportation and Ownership Changes 0 State Lands 0 Borough Lands

° Cook Inlet Region Inc. (CIRI) Lands 0 Tyonek Native Corporation Lands

Borough Services Impacts 0 Options for Town Management and Governance 0 Borough Planning of the Town Site 0 Impacts if Growth Occurs in the Kenai Peninsula

TYONEK VILLAGE IMPACTS

Village Impacts

Culture and Life-style Changes

Economic Impacts

20.0 ACOUSTIC ENVIRONMENT

CONSTRUCTION EFFECTS

Construction Activities

Vehicular Traffic

LONG-TERM EFFECTS

MAJOR REGULATORY REQUIREMENTS

Page No.

19-1

19-1

19-1

19-2

19-3

19-4

19-6

19-6

19-7

19-7

19-8

19~9

19-9

19-10

19-11

19-11

19-13

20-1

20-1

20-1

20-1

20-2

20-3

EI\IVIRONMENTAL ACCEPTA81LII Y UF PRUPUSEI.J AC IIUN 20-3

xiii

c::

Table of Contents

Continued

21.0 METHANOL IN THE ENVIRONMENT (SUMMARY)

METHANOL IN THE ENVIRONMENT (GENERAL)

Environmental Hazards, Aquatic and Marine

Marine and Estuarine

Comparison of Marine Environmental Impact Costs:

Fresh Water

Terrestrial - Direct Exposure

Emissions

METHANOL IN THE ENVIRONMENT (SPECIFIC)

Introduction

Fish

Crustaceans

Molluscs

Birds and Mammals

Summary

SAFETY AND RISK

22.0 SAFETY AND RISK ANALYSIS

INTRODUCTION

ASSESSMENT PROCEDURES

Program Characteristics

Regulatory Assessment

SAFETY OVERVIEW

Health Effects

xiv

Page No.

21-1

21-1

21-1

21-1

Methanol/Oil 21-4

21-8

21-12

21-14

21-15

21-15

21-16

21-17

21-18

21-19

21-20

22-1

22-1

22-1

22-1

22-3

22,-4

22-4

c

Table of Contents

Continued

0 Process Down Time 0 Start-up 0 On-stream Operation 0 Shutdowns

PROCESS HAZARDS

Coal Storage

Coal Preparation

Coal Feeding

Methanol Distillation Gasification

Ash Removal and Disposal

Venturi Scrubber

Shift Conversion

Acid Gas Removal

Methanol Synthesis Utilities

MONITORING THE PROCESS ENVIRONMENT

Industrial Hygiene

Monitoring

Medical

Education and Training

Compliance

Regulated Areas

Emergency Procedures

FIRE SAFETY

C oncl usi on

XV

Page No.

22-5

22-7

22-8 22-9

22-9 22-9 22-10

22-10 22-13 22-11

22-11 . 22-12

22-12 22-12 22-12

22-13

22-13 22.,.13

22-13 22-14 22-14

22-15 22-15 22-15

22-15 22-16

Table of Contents

Continued

SITE EVALUATION SUMMARY

23.0 SITE SELECTION

INTRODUCTION

Level 1 - Screening Analysis 0 Granite Point on Cook Inlet 0 Capps Coal Field Area 0 Chuitna Coal Field Area 0 Remote Location

° Comparison of Alternatives

Level II - Preliminary Site Selection 0

0

Near Tidewater

Upland Location

Level Ill - Final Site Selection

BIBLIOGRAPHY

PARTICIPANTS

xvi

Page No.

23-1

23-1

23-2

23-2

23-2

23-3

23-4

23-4

23-6

23-6

23-7

23-8

LIST OF TABLES

Page No.

2.1 Beluga Field Program, Summary of Principal Activities, 2-3 1980-81

2.2 Beluga Field Program, Agencies Contacted or Briefed by 2-6 DOWL in 1981

3.1 Fine Concrete Aggregates, #4 Minus 3-45

3.2 Typical Asphalt Concrete Surface Course 3-48

3.3 Typical Base Course 3-51

3. 4 Typical Rai I road Ballast 3-51

4.1 Test Well #1, Summary of Driller•s Log

4.2 Test Well #2, Summary of Driller•s Log

4. 3 Lakes of the Beluga Region

4.4 Selected Data on Stream and River Systems

4.5 Stream Flow Data (Selected Stations)

4.6

4.7

4.8

4.9

4.10

4.11

4.12

4.13

5.1

5.2

5.3

Selected Discharge Data

Summary Data on Suspended Solids

Selected Water Quality Data, November 1980

Selected Water Quality Data, May 1981

Selected Water Quality Data, June 1981

Selected Water Quality Data, July 1981

Water Quality Comparison, Groundwater & Chuitna River

Sediment Sample Analyses

Life History Data for Five Species of Pacific Salmon

Selected Fish Trapping Data, Nikolai Drainage (June 1981)

Checklist of Freshwater Fish of Beluga Area

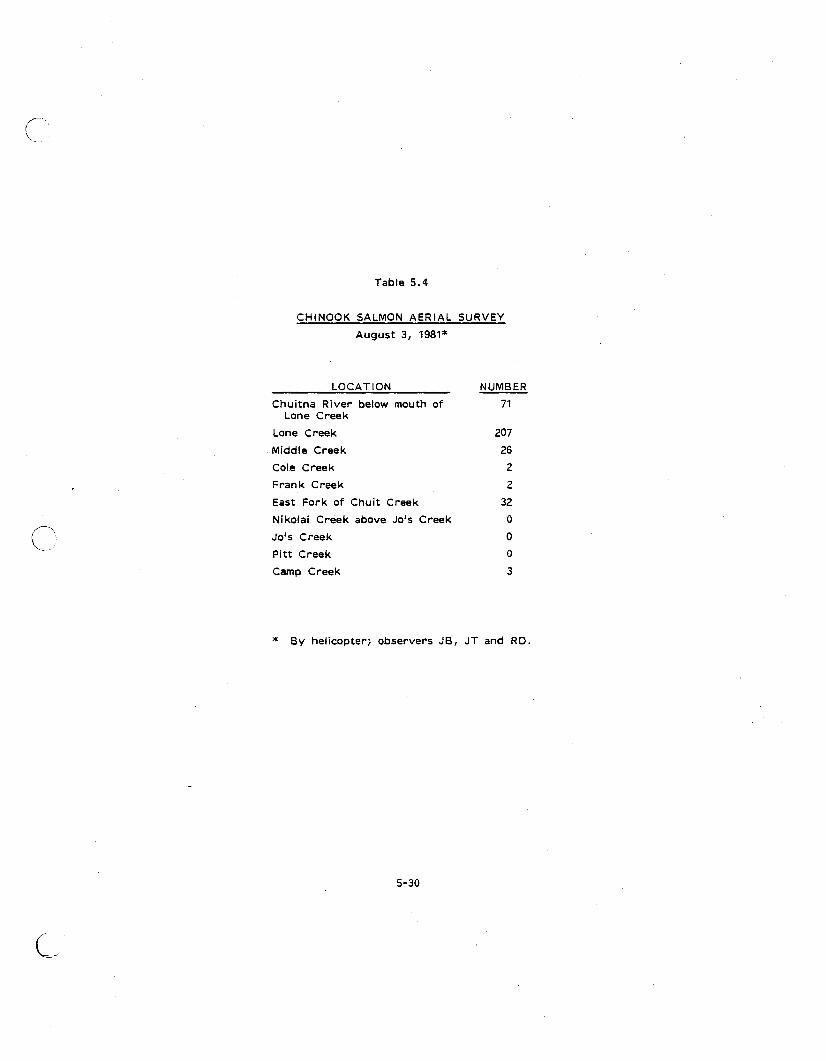
5.4 Chinook Salmon Aerial Survey

5.5 Benthic Invertebrate Community

5.6 Moose/Bear Observations (Aerial) June 1-4, 1981

5.7 1980 Moose Survey

xvii

4-4

4-7

4-11

4-16

4-18

4-21

4-22

4-25

4-26

4-27

4-28

4-33

4-34

5-25

5-26

5-27

5-30

5-31

5-50

5-51

(~,

C/'

5. 8 Terrestrial Birds

LIST OF TABLES

(Continued)

5. 9 Pacific Salmon of Alaska - Life Features

5.10 General Salmon Timing Information for Northern Cook Inlet Streams

5.11 Cook Inlet Fisheries, 1973-1977

5.12 Waterfowl, Shorebirds and Seabirds

7.1 Cook Inlet Tidal Ranges

10.1 Anticipated Construction and Operation Work Forces, Beluga Methanol Project

12.1 Preliminary List of Construction Activities Associated with Development in the Beluga Region

13.1 Summary of Estimated Flows & Characteristics of Process-Related and Sanitary Wastewater Discharges

13.2 Summary of Coal Area Wastewater Characteristics

13.3 Summary of Boiler Cleaning Wastewater Characteristics

13.4 Estimated Contaminated Process Area Runoff Characteristics

13.5 Summary of Projected Effluent Characteristics

13.6 Possible Interaction of Project Activities with Surface Water

14.1 Outline of Potential Environmental Impacts and Relevant Pollutants Resulting from Site Preparation and Construction Practices

15.1 New Source Performance Standards & Anticipated Emission Rates

15.2 Accepted & Anticipated Emission Levels

15.3 Emission Inventory

xviii

Page No.

5-56

5-69

5-70

5-76

5-84

7-3

10-27

12-2

13-9

13-14

13-16

13-17

13-22

13-26

14-2

15-10

15-12

15-13

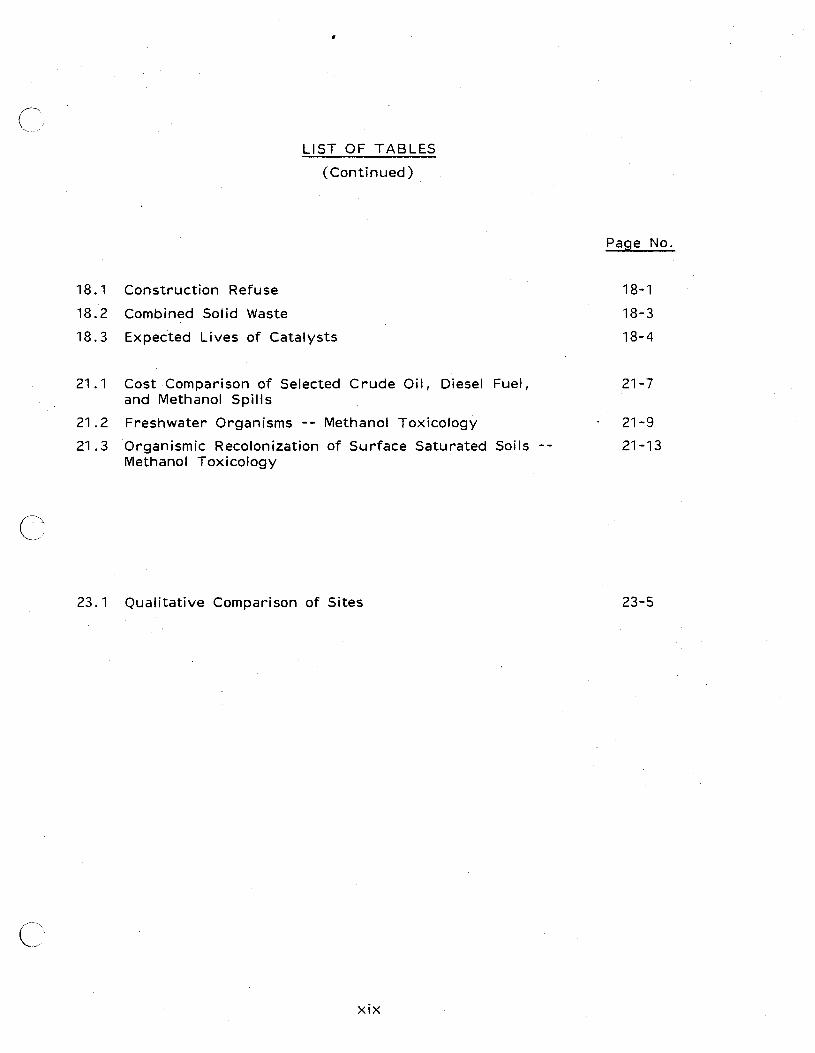
18.1 Construction Refuse

18.2 Combined Solid Waste

LIST OF TABLES

(Continued)

18.3 Expected Lives of Catalysts

21.1 Cost Comparison of Selected Crude Oil, Diesel Fuel, and Methanol Spills

21.2 Freshwater Organisms -- Methanol Toxicology

21.3 Organismic Recolonization of Surface Saturated Soils -­Methanol Toxicology

23.1 Qualitative Comparison of Sites

xix

Page No.

18-1

18-3

18-4

21-7

21-9

21-13

23-5

c

c

c-

LIST OF FIGURES

Page No.

1.1 General Location - Beluga Methanol Plant 1-3

1.2 Project Location Map (Beluga Methanol Plant) 1-4

1·. 3 Simplified Block Flow Diagram of a Typical Coal to 1-6 Methanol Plant

2.1 Field Program Participants 2-5

3.1 Stratigraphic Column, Upper Cook Inlet Basin 3-2

3.2 Proposed Stratigraphic Nomenclature for Kenai Group 3-6

3.3 Generalized Physiography and Geology of the Beluga Area, 3-11 Alaska

3.4 Preliminary Geologic Map of the Congahbuna Area, 3-12 Cook Inlet Region, Alaska

3.5 Vicinity Map, CIRI/Piacer-Amex, Methanol Plant

3. 6 Soi I Samples and Well Locations, C I R I /Piacer-Amex, Methanol Project

3.7 Locations of Soils Test (CIRI/Piacer-Amex Plant Site)

3. 8 Idealized Peat Distribution Methanol Plant Area

3. 9 Log of Test Hole, Plant Site Area

3.10 Log of Test Pit, Plant Site Area

3.11 Grain Size Distribution - Gradation Curve

3.12 Locations of Soil Test (CIRI/Piacer-Amex Townsite)

3.13 Log of Test Hole, Town Site Area

3-15

3-17

3-18

3-19

3-20

3-21

3-23

3-27

3-29

3.14 Log of Test Pit, Town Site Area 3-30

3.15 ·Dock Site Test Hole Locations 3-33

3.16 Idealized Soil Profile, Dock Site Area Dock Site Idealized 3-34 Soil Profile

3.17 Log of Test Hole, Dock Site Area

3.18 Typical Soil Profile of Capps Area, Alaska

3.19 Typical Soil Profile of Chuitna Area

3.20 Grain Size Distribution - Gradation Curve

3.21 Abrasion Test Results

XX

3-35

3-37

3-39

3-42

3-44

C'

LIST OF FIGURES

(Continued)

3.22 Major Faults in Southcentral Alaska

3.23 Cumulative Magnitude/Frequency Relationship, Anchorage Region

4.1 Well Locations, Granite Point Area

4.2 Groundwater Quality

4.3 Granite Point Area, Bedrock Outcrops and Depth to Bedrock in Wells

4. 4 Pump Test of Well #2

4. 5 Lakes of Beluga Area

4.6 Staff Gauge Locations - Beluga Region

4. 7 Rating Curve for Nikolai Creek (Bridge)

4-8 Typical Data Recovered From DAT APOD Experiment (Nikolai Creek)

4-9 Typical Surface Water Quality Analysis

5.1 General Location Sampled by Trapping and by Angling (May-Aug. '81)

5.2 Species Distribution and Spawning Areas

5.3 Areas Where Adult King Salmon Were Observed (July - August '81)

5. 4 General Vegetation Map

5.5 Preliminary Photo Interpretation Vegetation Map

5.6 Preliminary Determination of Wetlands

5. 7 Seasonal Concentrations of Moose

5.8 Bear Feeding and Denning Areas

5. 9 Known Nesting Sites (Active, 1981)

5.10 Habitat Types, Cook Inlet Shoreline

5.11 Distribution of Organisms in Mud Flats

5.12 Generalized Food Web for Mud Flat

5.13 Granite Point Intertidal and Shallow Subtidal Species Assemblages

xxi

Page No.

3-53

3-58

4-2

4-6

4-8

4-10

4-13

4-16

4-29

4-30

4-32

5-3

5-23

5-29

5-33

5-37

5-39

5-41

5-42

5-60

5-62

5-64

5-65

5-67

LIST OF FIGURES

(Continued)

5.14 Life Cycle of King Salmon

5.15 Life Cycle of Silver Salmon

5.16 Resource Use in the Cook Inlet Area

5.17 Trading Bay State Game Refuge

6.1 Representative Climatic Conditions for Project

6.2 Locations of Weather Monitoring Stations

6. 3 Wind Rose

7.1 Division of Cook Inlet

7. 2 Net Surface Circulation

7. 3 Bottom Sediments in Cook Inlet

8.1 Archaeologic and Historic Sites

10.1 Existing Land Status

10.2 Existing Roads and Easements

10.3 Overall Site Plan

10.4 Camp Siting Considerations

10.5 Camp Plan

10.6 Airport Siting Considerations

10.7 Airport Plan

10.8 Town Land Use Plan

11.1 Levels of Noise in Terms of a Weighted Sound Levels, dB(A)

Area

14.1 A Possible Perturbation Matrix for Considering Enviornmental Impacts of the Methanol Project

20.1 Levels of Noise, dB(A) - Beluga Methanol Plant

xxii

Page No.

5-71

5-72

5-81

5-90

6-3

6-4

6-5

7-2

7-5

7-9

8-9

10-4

10-12

10-29

10-31

10-32

10-36

10-37

10-40

11-2

14-6

20-4

~.

~ ... ·

AGENCIES

ACMP AEIDC CEQ COE DEC DF&G DNR DOE DOSH DPDP EPA

FAA FWS

GLOSSARY OF ENVIRONMENTAL TERMS

- Alaska Coastal Management Program - Artie Environmental Information and Data Center - Council on Environmental Quality - u~s. Army Corps of Engineers - Department of Environmental Conservation (Alaska) - Department of Fish & Game (Alaska) - Department of Natural Resources (Alaska) - U.S. Department of Energy - Division of Occupational Safety and Health (Alaska) - Division of Policy Development and Planning (Alaska) - U.S. Environmental Protection Agency

(unless designated as state agency) - Federal Aviation Administration - Fish and Wildlife Services (Federal)

MSHA - Mine Safety and Health Administration NRDC - National Resource Defense Council OSHA - Occupational Safety and Health Administration OSM - Office of Surface Mining USGS - United States Geological Service

REGULATIONS/ACTS

AAC ANCSA CAAA CFR CWA EA

l012R

- Alaska Administrative Code - Alaska Native Claims and Settlement Act - Clean Air Act Amendments of 1977 - Code of Federal Regulations - Clean Water Act of 1977 - Environmental Assessment

(' '~

~

L

EIS DEIS FEIS FR FWPCA MSHA NAAQS NEPA OSHA RCRA SMCRA TSCA

- Environmental Impact Statement Draft Environmental Impact Statement

- Final Environmental Impact Statement - Federal Register - Federal Water Pollution Control Act - Mine Safety and Health Act of 1977 - National Ambient Air Quality Standards - National Environmental Policy Act of 1969 - Occupational Safety and Health Act of 1970 - Resource Conservation and Recovery Act of 1976 - Surface Mining Control and Reclamation Act of 1977 - Toxic Substances Control Act of 1976

REGULATIONS/ENGINEERING

BACT BAT BMP GEP LAER NPDES NSPS PSD SPCC UNAMAP

- Best Available Control Technology - Best Available Technology: Economically Achievable - Best Management Practices - Good Engineering Practice - Lowest Achievable Emission Rate - National Pollutant Discharge Elimination System - New Source Performance Standards - Prevention of Significant Deterioration - Spill Prevention Control and Countermeasure Plans - User•s Network for Applied Modeling of Air Pollution

(series of meteorological models developed by the U.S. EPA)

PTMAX - Single stack meteorological model in EPA UNAMAP series VALLEY - Meteoro logica 1 mode 1 used by USEPA to calculate con­

centrations on elevated terrain

1012R

z ~ ~

0 0 c () ·~

0 z

c

1. 0

C,

c

INTRODUCTION

PURPOSE OF THE REPORT

The objectives of the environmental, health, safety and socioeconomic

assessment tasks of this feasibility study were to define the major

environmental issues relevant to development of a coal gasification

and methanol fuels production facility and related coal mining activ­

ities and transportation systems in the west Cook Inlet area, Alaska.

To achieve this, extensive review into existing information on the

Beluga region of west Cook Inlet was conducted and updated with the

findings of current and on-going land resource projects. Specific

field activities then were initiated to expand the environmental data

base in areas relevant to this project where there was a paucity of

information. Based on these findings the project was reviewed in

detail to identify significant environmental issues and to outline the

state and federal permit requirements to ensure that these elements

are an integral component of all subsequent project planning and

management decisions.

While the format of this report is similar to that of an environmental

assessment, this document is not a formal environmental assessment.

The initial scope of work was to provide for the assemblage of suf­

ficient information to develop a more detailed scope of work for the

initiation of the requisite permitting procedures and for the prepara­

tion of an Environmental Impact Statement. Therefore, data gaps

may be identified but not necessarily addressed beyond the level

necessary to identify or define the issue of concern. This document

includes the results of the literature review and substantial contri­

butions from the 1981 field program. The report also incorporates

input from various state and federal agencies, from other consultants

participating in the feasibility study, and from the staffs of both

CIRI and Placer Amex.

1-1

PROJECT LOCATION

The proposed project is located on the west side of middle Cook Inlet

approximately 75 air miles southwest of Anchorage. A general loca­

tion map is shown in Figure 1. 1. The overall project area is bor­

dered on the north and south by the Beluga River and Nikolai Creek

and on the east and west by the Cook Inlet and the terminus of the

Capps Glacier and the Chichanta River. A project location map is

shown in Figure 1.2.

PROJECT DESCRIPTION

The proposed project consists of several components: The methanol

plant site, a dock site, a new town site, a construction camp site,

and a transportation corridor, as well as the coal mine areas.

The plant site would occupy some 400 acres located about two miles

inland from the Granite Point shoreline of Cook Inlet. About half the

area would be occupied by methanol processing facilities and the re­

mainder would be for coal handling and general plant grounds.

The transportation corridor is a 300-foot-wide unspecified alignment

easement 27~ miles long between the Capps coal field and Cook Inlet.

A preferred route has been selected which has a maximum gradient of

2%. A heavy duty railroad line capable of transporting approximately

42,000 tons of coal daily would be constructed to transport coal from

the mines in 100-ton cars. Ash would be returned to the Chuitna

West mine site in special 80-ton ash handling cars. A 40-foot-wide

access road would generally parallel the railroad route within the

same easement corridor.

The construction camp site is located about one mile north of the

proposed plant site. It would be used to house construction person­

nel in four quadrants of dormitory style barracks.

1-2

FIGURE 1.1

COOK INLET

GULF OF

ALASKA

GENERAL LOCATION- BEWGA METHANOL PLANT

CAPPS GLACIER I

I

0 GIRl LANDS

c~ FIGURE 1.2

CIRI LANDS

r---l '

_..,...,..,..,....,..--------.J L.l B.HW

LEASES

I

I I

I I

~

TYONEK NATIVE

CORP. LANDS

PROJECT LOCATION MAP (BELUGA METHANOL PLANT)

The town site is an area about three miles northwest of the proposed

plant site, which has tentatively been selected for development of a

permanent new community in which plant and mine employees and

their families could live. It is envisioned that this community would

eventually contain all the amenities of a self-sufficient town.

The dock site is an area near Granite Point on Cook Inlet where a

permanent dock structure is proposed. The dock 1s initial use would

be to receive equipment and construction materials during the devel­

opment phase of this project.

Presently mineable coal reserves of the area exceed one billion tons,

all within 25 miles of the proposed plant site and deep water in Cook

Inlet. The coal is characterized as sub-bituminous (6,500 - 7,500

Btu/lb.), with low sulfur (0. 2%), high moisture (25 - 28%), and high

ash content (14 - 25%). The rate of coal consumption by the meth­

anol plant would be less than 10 million tons per year. The coal

feedstock for this project would be extracted from both the Chuitna

Center Ridge mine area and the Capps lease. The coal would be

mined open pit with shovels and/or draglines, would pass through a

crushing process at the mine and would be transported via railroad a

distance of 15 to 25 miles to the coal receiving station at the methanol

plant near Cook Inlet.

Following preparation the coal would be gasified utilizing the Winkler

procedure followed by the remaining two major processing steps in

the production of methanol: syngas upgrading and methanol synthe­

sis (see Figure 1.3). These are commercially proven processing

systems currently in operation in various parts of the world.

Approximately 80% of the commercial plants now in operation use the

methanol synthesis technology proposed for this project. The basic

design philosophy has been to select process steps in widespread use

with proven reliability which would maximize the possibility for future

increases in production with limited additional capital investment.

The resulting production of the plant would be approximately 54,000

1-5

~

FIGURE 1.3

~

COAL --... PREPARATION

FLUE GAS

CLEAN-UP·

STEAM AND POWER GENERATION

GASIFICATION AND HEAT --

RECOVERY

OXYGEN

AIR

s·EPARATION

t. AIR J POWER/ STEAM

rl) \·t-.. /

ASH

DISPOSAL

+

RAW GAS ACID GAS METHANOL

SHIFT ,._...

REMOVAL --... SYNTHESIS 8

DISTILLATION

J ! SULFUR METHANOL

RECOVERY PRODUCT

+ SULFUR

SIMPLIFIED BLOCK FLOW DIAGRAM OF A TYPICAL

COAL TO METHANOL PLANT

/\ ( I

j

barrels per day of fuel grade methanol targeted primarily for power

plant consumption on the west coast of the United States. The

methanol would be batched at the plant and transported approximately

40 miles south via the existing Cook Inlet pipeline to the existing

Drift River Terminal currently operated by the Cook Inlet Pipe Line

Company. The Drift River marine terminal is a single-berth 1 fixed­

platform 1 offshore loading facility capable of accommodating tankers

up to 70 1 000 DWT. The methanol would be loaded at this dock and

transported by tanker to market.

1-7

c; 2.0 SUMMARY OF THE STUDY

METHODOLOGY

General

To achieve the objectives stated in the purpose of the report, a

five-step process was utilized:

a. Review all existing data and published environmental and socio­

economic information relative to the project area.

b. Supplement the published information with the findings of recent

and ongoing land resource projects (conducted primarily by state

and federal agencies).

c. Identify specific areas where the environmental data base is insuf­

ficient to make meaningful appraisals of the environmental effects

and permit requirements of this project. Following this identifica­

tion, develop, plan and conduct specific field investigations in the

highest priority areas.

d. Review the total project design and consider its effect on each

major environmental attribute.

e. Summarize the issues and make preliminary findings relative to

permit requirements, general environmental acceptability of the

project, and environmental factors (data gaps) material to the next

stage of planning and development.

Participation by and input from concerned state and federal agencies

was encouraged during the course of this work. Briefing meetings

were conducted on numerous occasions with the various agencies at

both the state and federal levels. Representatives of the U.S. Army

Corps of Engineers (COE), Alaska Department of. Fish and Game

2-1

C: /

(DF&G), and federal Fish and Wildlife Service ( FWS), Environmental

Protection Agency (EPA) and Department of Energy (DOE) visited the

project site to review the general project concept and observe the

environmental field activities. It has been the intention during the

course of this study to encourage as broad a participation as possible

and to present the findings in a systematic format that would be

compatible with the National Environmental Policy Act outline for an

Environmental Impact Statement (EIS). The goal was to produce the

data base in a form that could be utilized efficiently to prepare the

scope of work for the preparation of an EIS, which would be the

next major step in the orderly progression of project permitting.

DOWL staff members and consultants as well as personnel from C I R 1/

Placer Amex also participated in an Adaptive Environmental Assess­

ment program sponsored by the FWS in Anchorage in late July 1981

which focused on the broader aspects of coal development in the

Beluga region. Although this study generally addresses the entire

project area from the inlet to the coal mine areas, the emphasis of

the investigation and field program was on the proposed methanol

plant site.

Field Programs

The field program was initiated in the fall of 1980 with a reconnais­

sance survey of aquatic and terrestrial habitats. In the early spring

of 1981, aerial reconnaissance of the general area was undertaken to

determine the onset of spring 11 break-up 11 and the migratory patterns

of moose and emerging bear populations. Following seeping meetings

with representatives of CIRI/Piacer Amex and Davy McKee, the

spring-summer field program was initiated in early May. A summary

of the highlights of the activities and the participants is shown in

Table 2.1. The field program was designed to address specific gaps

in available background information under three general categories:

Geotechnical (soils)

Hydrologic (groundwater)

General Environmental

2-2

Table 2.1

BELUGA FIELD PROGRAM

SUMMARY OF PRINCIPAL ACTIVITIES, 1980-81

Dates

November 3-7, 1980

May 4 - June 8, 1981

May 2-6, June 1-5, July 13-17, & August 3-7, 1981

Activities

Reconnaissance of aquatic and terrestrial habitats

Soils and groundwater in­vestigations including the drilling of Z water wells and 1 observation well

Field programs in hydrol­ogy, fisheries, wildlife, habitat evaluation of aquatic, terrestrial & marine habitats

2-3

Participants

DOWL Engineers, Arctic Environmental Information & Data Center (AEIDC)

DOWL Engineers, Alaska Testlab with support of Explora­tion Services and M-W Drilling

DOWL Engineers, with support from AEIDC, Radian Corp. and individual consult­tants. Included site visits by personnel representing the state DF&G, and the federal FWS, EPA and COE

Under the general environmental program, preliminary work was

undertaken to perform reconnaissance surveys of aquatic habitats and

determine the presence or absence of fish in the numerous streams in

the area; perform reconnaissance surveys of big game distribution

(moose and bear); and conduct a reconnaissance survey of the inter­

tidal habitat near the proposed dock location. Other tasks also fell

under this general category: vegetation mapping, wetlands deter­

mination, socioeconomics, etc.

In this report, the perspective of the current field program must

always be considered. The areas of ecological concern for a project

of this magnitude varies with the specific activity and the resource

concerned. It will only be when the assemblage of baseline data is

more complete that the functional relationships of these ecosystems

can be understood and habitat values established.

The hydrology and geotechnical programs included drilling two test

water wells and an observation well; drilling six test holes; digging

32 test pits; and collecting six grab samples from existing road cuts.

Personnel and/or organizations involved in the field program are

shown in Figure 2. 1. In addition, contributions from Benne Patsch

of Placer Amex and John Ramsey of the Bass-Hunt-Wilson leaseholder

group provided valuable insight into the geology and groundwater

conditions of the general area. Details as to field methodologies,

sample sizes and handling techniques, nature of laboratory tests, and

general operational procedures have not been provided as part of the

various overviews and summary sections. Numerous state and federal

agencies (Table 2.2) were briefed as to the intent and scope of the

program, and valuable input was received from many of these

agencies.

2-4

(-' r-----------------------------------------------------------------------~ ~.)

v. Sterling Technical Editor

I ALASKA TESTLAB

M. Nichols, Partner M. Hol urn, Engineer T. Barber, Geologist 0. Hatch, Geologist

D. Cole, Engineer T. Williams, Geologist

I EXPLORATION SERVICES

COi1PANY

I PRECISION ALASKA

PHOTO HELICOPTERS

FIGURE 2.1

BELUGA FIELD PROGRAM - 1981 (Organization)

DOWL ENGINEERS J. Paulson

Program Manager

R. Dagon Manager, Field Programs

B. Kranich Engineer

I M-W DRILLING I

I l

DOWL ENGINEERS L. Dickinson

Partner in Charge

P. Wahl L. Frankl in

Environmental Analysts

R. Goldman Research Analyst

AEIDC, U. of Alaska J. Baldridge, Biologist

D. Trudgen·, Bi o 1 og i st J. Th i e 1 , B i c 1 og i st

RADIAN M. Hoban, Marine Biolgist

E. Rashin, Biologist

W. Trihey Hydraulic Engineer

R. Hensel Wildlife Biologist

P. D'Eliscu Marine Biologist

NORTH PACIFIC GEO-CHEM AERIAL SURVEYS LAB

FIELD PROGRAM PARTICIPANTS

N I

0>

Table 2.2

BELUGA FIElD PROGRAM

AGENCIES CONTACTED OR BRIEFED BY DOWl IN "1981

U.S. GOVERNMENT

Department of the Army, Corps of Eng.ineers ( COE)

Department of the Interior, Fish and Wildlife Service ( FWS)

Department of the Interior, Geological Survey (USGS)

Environmental Protection Agency (EPA)

- Alaska District, Regulatory Functions Branch

- land & Water Resources Development; Biological Services; Environmental Contaminant Evaluation

- Water Resources Branch

- Region 10, Environmental Evaluations Branch

Department of Agriculture, Soil Conservation Service (SCS) - Susitna Task Force

Department of Agriculture, Forest Service (USFS)

Department of Energy (DOE)

- Forestry Science Laboratory, Susitna Task Force

- Region 10 Representative

STATE OF ALASKA

Department ol' Fish & Game (DF&G)

Department of Community & Regional Affairs (DCRA)

Department of Commerce & Economic Development (DCED)

Department of Environmental Conservation (DEC)

Department of Natural Resources ( DNR)

Governor's Commission

- Habitat; Game Management; Sport Fish; Office of the Commissioner

- Division of Community Planning

- Office of the Commissioner; Director of Industrial Development

- Southcentral Region; Division of Environmental Quality; Office of the Commissioner ·

- lands; Research; Geological Survey; Water Resources; Ot'fice of the Commissioner

- Coal Task Force

SUMMARY OF MAJOR ISSUES

Fisheries

The Beluga area, although not one of the major salmon fisheries in

Alaska, has three principal drainage systems containing relatively

productive fish habitat: Nikolai Creek and its tributaries to the

immediate south of the project area; the Beluga River system to the

north; and the Chuitna River and its extensive tributary system in

between, which flows through major portions of the overall project

area. Prior to the 1981 environmental baseline field work conducted

for this study, relatively few details were known about the salmon

populations in these systems. The system best known is the Chuitna

River which supports four species of Pacific salmon (pink, chum,

coho and king). Other species of fish (i.e., rainbow trout and Dolly

Varden) are also present in these systems. A key environmental

issue concerns the fish populations in each of these three areas,

primarily the Chuitna River system due to its immediate proximity to

the Chuitna mine area. Any water discharges to this river system or

development activities near it would involve particularly close scru­

tiny by the Alaska departments of Fish and Game and Environmental

Conservation. Alaska Statute 16.05.870 11 Protection of Fish and

Game 11 defines the requirements of one of the major permits that

would be necessary to get approval for development activities near a

fishery. Principal impacts to the fisheries resource would result from

disruption or elimination of habitat in the feeder streams of the

principal creeks and the possible disruption of the groundwater that

supplies these habitats. Consequently one of the major unknowns

that will require extensive exploration is the nature and operation of

the ground water regime. There are two major groundwater con­

siderations. It is potentially an operational problem to the mining

activities and it has a potential impact on the flows in adjacent

streams. A reasonable determination will probably have to be made

as to whether alteration of mine area groundwater flows will reduce

or deplete flows in important streams and if so how you re-establish

2-7

c: the water source. At this time, fisheries are considered one of the

key environmental issues relative to opening the coal mine portion of

the proposed project. The methanol plant and proposed town site

would have no affect on the Chuitna or Beluga river systems but

could potentially impact the lower reaches of Nikolai Creek.

Water Source

Operation of a methanol plant requires large volumes of water. The

plant process and cooling concept requires approximately 15,000 gpm.

Present freshwater surface sources have been ruled out as insuffi­

cient, and desalination of Cook Inlet water to fill the freshwater

requirement was considered unfeasible due to the extraordinary power

requirements. This study confirmed that deep groundwater is avail­

able in limited quantities, but even with storage it would be far too

inadequate to provide the anticipated supply. An infiltration gallery

system in the lower reaches of Nikolai Creek appears to be the most

viable alternative for large volumes of fresh water. It appears that

this could be done with an acceptable impact on the water flows in

Nikolai Creek. The lack of alternate sources, however, and the

possible affects on the Nikolai drainage system remain significant

development issues to be further defined.

Wetlands

Although wetland areas constitute major portions of the general

Beluga area, the plant site area avoids standing bodies of water and

appears relatively dry. There is a fairly high water table and the

plant site supports types of vegetation representative of a wetland,

and for this reason a major portion of the plant site may be con­

sidered a wetland by definition. A preliminary determination by the

Corps of Engineers, however, indicates that plant development in this

area may fall under the jurisdiction of the Corps of Engineers nation­

wide permit procedure thereby possibly simplifying future permit

requirements.

2-8

c:

Erosion and Sedimentation

The potential sedimentation from mining activities and runoff during

the construction and operation phases of the plant remain an issue of

major concern, relative to fisheries. The potential discharge of

sediment laden wastewaters may be one of the factors that would

prompt the Environmental Protection Agency to require an environ­

mental impact statement for this project. New Source Performance

Standards exist for a point wastewater (drainage) discharge from a

coal mine, and these discharges would require a National Pollution

Discharge Elimination System (NPDES) Permit under the Clean Water

Act. An industry which would create potential discharges for which

there are New Source Performance Standards can be required to file

environmental impact statements. One of the principal concerns,

primarily in mining activities, will be sedimentation and its potential

impact on existing fishery habitat.

Tyonek Village

Due primarily to likely cultural changes and the changes to the pre­

sent subsistence life-style, the neighboring Village of Tyonek gen­

erally does not welcome the inevitable growth that would accompany

development of one the the state's major energy resources in the

Beluga area. Special consideration should be given to the potential

socioeconomic conflicts with village residents. Coal development

would probably mean that for the first time in their long history, the

Tyonek residents would be in the minority in their own region.

Air Quality

The primary air pollutant emitted from the mining operation would be

suspended particulates, and from the plant operation it would be

products of combustion. The existing air quality of the Beluga area

is considered virtually pristine, being relatively unaffected by indus­

trial activities in the Kenai area. Because this project would con-

2-9

(' '~- stitute an introduction of air emissions into a clean air shed, there

would be air quality impacts. However, these all should be well

within the limits of the air quality regulations under the Clean Air

Act.

ENVIRONMENTAL ACCEPTABILITY OF THE PROJECT

Based on the present level of environmental knowledge in the project

area and current environmental law and regulations, Cook Inlet Re­

gion, Inc./Placer Amex, Inc. should be able to obtain permits for

this project and mitigate major environmental concerns with prudent

construction and operation practices. The information gathered in

the field, previous assessments of the issues in the Beluga area and

the periodic involvement and comments of state and federal agency

personnel during the course of the on-going environmental studies

revealed no single environmental or permit issue which could preclude

proceeding with this project. There would be environmental impacts,

as with any large project involving land or water resources. How­

ever, it appears that if managed properly, an acceptable balance

between orderly industrial and social growth and the preservation

and enhancement of environmental values can be achieved.

2-10

~ m !:: z m

~

3.0

C=

AFFECTED ENVIRONMENT (BASELINE DATA)

GEOTECHNICAL

THE COOK INLET REGION

To understand the geology of the Beluga area, it is necessary to

consider a much larger geographic area, and to discuss the geologic

events that have occurred in the area over a broad time frame.

Geologic History

The Cook Inlet area has been described as a topographic, structural

and sedimentary basin containing 60,000-70,000 cumulative feet of

marine and non-marine sedimentary and volcanic rocks ranging in age

from Late Paleozoic to Recent (Barnes, 1966). Rocks of Triassic to

Recent age outcrop in the Cook Inlet Basin, while older rocks are

overlain by an estimated 40,000 feet of sediments. Figure 3.1 shows

the sequence or general correlation of sediments occurring in the

Cook Inlet Basin.

During Paleozoic and early Mesozoic eras, sediments were deposited in

a linear depression occurring in Southeastern Alaska. Volcanic

islands and other land masses served as the source of these sedi­

ments and reef limestone depositions. Sediments which were de­

posited at this time include bedded cherts, tuffaceous silts, shales

and carbonates. The Triassic (early Mesozoic) rocks outcrop on the

southeastern rim of the Cook Inlet Basin near Seldovia. These rocks

include limestone, tuff, and banded chert underlain by ellipsoidal

lava, slate and graywacke. The thickness of the Triassic rocks in

the Cook Inlet Basin is estimated to exceed 2,000 feet.

Jurassic rocks of southern Alaska represent the most complete

sequence of this age in North America. During the middle Jurassic,

3-1

ERA

(.) ..... 0 N 0 z ~ (.)

(.) ..... 0 N 0 til

~

PERIOD

i

Figure 3.1

STRATIGRAPHIC COLUMN

UPPER COOK INLET BASIN

EPOCH

Pliocene

Miocene

Oligocene

Eocene

Paleocene

GROUP

Tuxedni Group

FORMATION

Sterling Formation

Beluga Formation

Tyonek Formation

THICKNESS (Feet)

6,000 l l 5,000

7,000

Hemlock Conglomerate l 1 ,500 l ~-~ ....................... ,..,,.,.,....., ........ ,.,..,..,.,,.,....,_......,....., ........ ~-,..,_........,....,..~~

West Foreland Formation I 3,300

1

l l

"""'""""",..,~~---"""'""""I~~-~-~ Matanuska Formation 8,500 !

l l """"',_,,..,_,_,,..,..,..,.,._,.. """"'"""'_,..,...J

~IMatan~.~ : 1

Nelchina Limes tone ! 700 l

--------t-l Naknek Formation ! 7,200 l Chinitina Formation j 2,300

1 9. 700 I

Talkeetna Formation 8,400

Unnamed Rocks 1,300

the sediments within the Southcentral Alaska area were tilted, up­

lifted and/or depressed to form anticlinal and synclinal belts - large

linear ridges and troughs. Volcanic activity increased during this

time and large batholiths and other intrusions of igneous rocks took

shape.

The rocks of Jurassic time comprise the Talkeetna Formation, Tuxedni

Group, and Chinitna and Naknek formations, and are widely dis­

tributed along the western shores of Cook Inlet and the Matanuska

Valley. These formations contain rocks predominantly consisting of

tuff and volcanic agglomerates in lower, older sections. The

Talkeetna Formation is composed of volcanic detritus containing fossil

plants and marine invertebrates, and is estimated to be several

thousand feet thick. The middle Jurassic Tuxedni Group consists of

sandstone, shale, conglomerate, and arkose with an estimated thick­

ness of up to 7,000 to 10,000 feet.

The Chinitna Formation, composed of several thousand feet of red

and dark argillaceous marine shales, is dated upper Jurassic and lies

conformably on the Tuxedni Group. The Chinitna Formation is com­

formably overlain by the Naknek Formation. The Naknek Formation

is the uppermost of the Jurassic system and consists of a basal con­

glomerate overlain by shales, arkose, and sandstone. The formation

ranges in thickness from 2,000 to more than 7,000 feet.

During the early Cretaceous era the seas of the Jurassic era shal­

lowed and the land rose. This emergence of land masses caused

increased erosion in some areas and less deposition in other areas,

causing a linear structural belt. The rock formations associated with

the Cretaceous era include a limestone unit referred to as the

Nelchina Formation; the Matanuska Formation which consists of

shales, siltstone and sandstone sequences; and the Arkose Ridge

Formation, consisting of well indurated arkose and conglomerate.

3-3

The rocks which comprise the Kenai and Chugach mountains probably

also were formed during the late Cretaceous era. The strata consists

primarily of slate and graywacke which has been intensely deformed

and metamorphosed. Considerable volcanics and ultra-basic intru­

sions also are present, but these are considered to be late additions

to the area. More than 30,000 feet of sediments were deposited from

the time of the late Paleozoic era to the early Mesozoic era. This

period of deposition was followed by a period of uplift, erosion and

--------~mo_untaio_building. __ Ibe-Aiaska-l"al"lge-was-also-fot"med-dul"'iA§-this---------­

period of mountain building, by large-scale batholithic intrusions.

In early Tertiary time a change occurred in Southcentral Alaska. As

the Chugach and Kenai mountain ranges began to emerge, the seas

were closed off and a fresh-to-brackish water basin was created. It

was within this basin that the extensive formations of the Tertiary

were laid down.

Formation of Coal Bearing Units

During early Tertiary time a narrow, deep basin, some 200 miles long

and 70 miles wide, formed in the area now known as Cook Inlet. It

was in this basin that more than 26,000 feet of non-marine sediments

were deposited during repetitive cycles of clastic sedimentation

alternating with coal swamps. In addition, considerable igneous

activity occurred in the northern part of the basin.

The formations deposited in the Cook Inlet Basin vary within the

basin. In the Matanuska Valley, the northern part of the basin, the

Tertiary sequences include three formations: The Chickaloon, Wish­

bone and Tsadaka. The Chickaloon Formation, deposited in the

Paleocene epoch, consists of more than 5,000 feet of non-marine

clastic sediments including many beds of bituminous coal, and random

intrusions of igneous stocks, sills, and dikes. The Chickaloon

Formation is conformably overlain by the Wishbone Formation. This

late Paleocene/early Eocene formation consists of a sequence of coarse

3-4

clastic, non-marine sedimentary rocks, and is about 3,000 feet thick.

The Tsadaka Formation, a sandstone and conglomerate of more than

1,000 feet thick, rests with angular unconformity on the Wishbone

and Chickaloon formations.

Outside the Matanuska Valley and in the southern portions of the

Cook Inlet Basin including the Beluga area, the Kenai Group is the

primary sequence of sediments. The Kenai Group is a mixture of

conglomerates, sandstone, siltstone, claystone and coal deposits and

has been divided into five formations: The West Foreland, Hemlock

Conglomerate, Tyonek, Beluga and Sterling formations. Of these,

three are significant with respect to energy resources. All of the

oil, gas and proposed coal production within the Cook Inlet Basin

originates from the Kenai Group. Oil production comes from the

Hemlock and lower Tyonek formations, gas production from the

Beluga Formation {minor amounts from the Sterling Formation), and

proposed coal extraction would be primarily from the Tyonek For­

mation. Figure 3.2 illustrates the stratigraphic sequence of the

Kenai Group as proposed by Calderwood and Fackler (1972).

The lowest member of the Kenai Group is the West Foreland For­

mation, a tuffaceous siltstone and claystone. ·There are also scat­

tered lenticular beds of sandstone and conglomerates within this

formation. The West Foreland Formation rests unconformably on older

Tertiary, Cretaceous and Jurassic rocks, and varies in thickness

from a few hundred feet to more than 1 ,000 feet.

The Hemlock Formation is the principal oil horizon in the basin. It is

composed of poorly to moderately sorted sandstone and conglomerate,

with interbedded carbonaceous siltstone, shale and coal. The Hem­

lock Formation varies in thickness from a few hundred feet to about

1, 000 feet.

The middle member of the Kenai Group is the Tyonek Formation. It

is a massive unit varying in thickness between 4,000 feet and 8,000

3-5

C) -~

ERA PERIOD

I E-<

~

I Ct

f

I I I I I i \ i I I

! ' \ I j i ' l i I ! u >< I 1-! ~ I 0 < l N 1-!

• 0 E-< • z ~ i

~ ~ ' • u I E-< I

i i l

! !

' ! l i i I

I

I I

I I

I

Figure 3.2

PROPOSED STRATIGRAPHIC NOMENCLATURE

FOR KENAI GROUP

GROUP FORMATION DESCRIPTION

Alluvium and Glacial Deposits

Sterling Formation Massive sandstone and conglomerate beds with occasional thin lignite beds and gray clay

~-----------~---~~ Beluga Formation Claystone, siltstone and

thin sandstone beds, thin sub-bituminous coal beds

__ ,.._,.,_,.,.,--~-,...,....,..,--~-I I

A-1 I Tyonek Formation I Sandstone, claystone & ~ 0 : siltstone interbeds and ~ l <:!:1 massive sub-bituminous

! coal beds. 1-!

~ ~ I

Hemlock Conglomerate Sandstond and conglom-erate.

~-~--~--~---~-

West Foreland Tuffaceous siltstone & Formation claystone. Scattered

sandstone & conglom-erate beds.

I I

~,..,...,,...,,..,...,....., __ ~~-,..,...,---~~_,...,..,_,..,_~~--------,...,...,--------------Rests unconformably on older Tertiary, Cretaceous and Jurrasic rocks

Source: Calderwood and Fackler, 1972

feet, and is composed of alternating lenticular beds of sandstone,

siltstone and claystone, with massive sub-bituminous coal beds.

Overlying the Tyonek Formation is the Beluga Formation. It varies

in thickness to a maximum of about 6,000 feet and is primarily clay­

stone and siltstone interbedded with thin sandstone beds and sub­

bituminous coal.

The upper unit of the Kenai Group is the Sterling Formation which

varies in thickness to about 11 ,000 feet. It consists primarily of

massive, fine to medium grain, unconsolidated sandstone and con­

glomerate with occasional thin beds of coal and gray claystone.

SURFICIAL SOILS

The landscape in the Beluga coal fields and proposed methanol plant

area is dotted with unconsolidated Quaternary deposits which mask

the underlying structures and bedrock. These deposits include

glacial morainal and outwash deposits; alluvium in stream valleys; and

talus and landslide masses. The thickness of Quaternary deposits

varies to a maximum of 300 feet. This variation in thickness is due

primarily to irregular deposition on a surface of considerable relief,

and post glacial erosion.

Shallow discontinuous glacial debris consisting of gravel, sand, and

silt was deposited over the bedrock of the Kenai Group during the

Quaternary. These deposits include a complex system of lateral and

ground moraines deposited by the numerous glaciers which have

scoured the area. Lateral moraines are parallel to the Nikolai

escarpment and then broaden into kames and ground moraines. The

glaciers which deposited these sediments extended southeastward

across Cook Inlet almost to Boulder Point on the Kenai Peninsula.

Isolated eskers also dot the area.

3-7

Other surficial soils are a result of Holocene marine deposition. It is

thought that the Chakachatna River and McArthur River region,

south of the Nicholai escarpment and the Chuitna River, is the set­

ting of Recent (Holocene) marine deposition. The most recent and

near surface deposits are probably tidal or estuarine shallow water

sediments, primarily of fine grain. These sediments include sandy

beach deposits, silty/sandy lagoon and outwash deposits, and silt

and clay tidal, estuarine, or shallow marine deposits.

Pond and bog deposits of Holocene age dot the post-glacial deposits

in discontinuous depressions. These deposits, chiefly peat and other

organic debris, also contain silt, clay and fine-grain sands. There

are also several thin beds of volcanic ash. The pond and bog de­

posits can be found in areas of poor drainage where the ground is

soft and wet except when frozen in winter.

Landslide deposits are found in several areas within the vicinity of

the Beluga coal fields. They are generally comprised of slumped

beds of the Kenai Group and occur along the steep slopes of the

upper Chuitna Valley and other locations where slopes have been

over steepened by erosion or mountain building. A large landslide of

approximately six square miles in area is located on the east-facing

slope of the valley below the Capps Glacier. Another massive land­

slide extends for about two miles along the west ridge of the Beluga

River near Felt Lake.

THE BELUGA AREA

Topography

The proposed methanol plant site, townsite, construction dock, and

transportation corridor areas are located on the west shore of Cook

Inlet. The Cook lnlet-Susitna Lowlands form an intermontane prov-

3-8

ince between the Aleutian Range and the Kenai-Chugach mountains of

the coast range.

The topography of the western shore of Cook Inlet is generally char­

acterized by high glaciated mountains dropping rapidly to a glacial

moraine/outwash plateau which slopes gently to the inlet. The out­

wash/moraine deposits generally begin at an elevation of 2,500 feet

and drop to tidewater in about 30 to 50 miles. The beach area often

consists of either a steep (1 :2) escarpment which may be 50 to 120

feet high and which is caused by beach erosion of glacial deposits,

or it may be composed of extensive mud flats. The upper portion of

Cook Inlet is relatively shallow and the submarine topography slopes

at only a few degrees.

The proposed development sites are on the Nikolai moraine, which

runs southeast from the vicinity of the Tordrillo Mountains and has

been mapped as extending across Cook Inlet to the Kenai Peninsula

(Schmoll, et al., 1981). A well defined escarpment (Nikolai escarp­

ment) marks the southwestern edge of the moraine, but the north­

eastern edge (Susitna escarpment) is cut by numerous streams and is

not as steep or distinct. The surface of the moraine is generally of

low relief, and in the vicinity of the proposed plant there are num­

erous level areas containing peat bogs. Relief is generally 50 feet or

less in this area.

Stream channels are deeply eroded and may be hundreds of feet

deep. Slopes along the eroded stream channels and near the moun­

tains often exceed the maximum angle of repose of soil, and numerous

landslides have occurred, some of which cover areas of more than

five square miles. Bluffs along eroding rivers such as the Chuitna,

and along tidewater have also been unstable. However, the proposed

methanol plant site is on the upper portion of the moraine and has

little slope except near the escarpment. The escarpment is generally

stable near the plant site. Maximum slopes are approximately 10°

3-9

except at small eroded areas and at the base of the escarpment where

the slope is about 20°.

Geology

Extensive reconnaissance geologic mapping, most recently by H. R.

Schmoll and others (USGS 1980), has resulted in a detailed geologic

map in the vicinity of the proposed development, shown on Figures

3.3 and 3.4. The town and plant sites are on the Nikolai moraine,

and the construction dock site is on the submarine extension of the

moraine. The moraine consists of a complex group of ground and

lateral moraines with numerous kames and eskers.

The moraine appears to lie in contact with sedimentary Tertiary

rocks, but subsurface conditions have not been extensively investi­

gated. The depth to bedrock is not accurately known, although gas

and water wells have been drilled in this area. The age and extent

of the moraine are unresolved. It appears to be slightly older than

many of the other moraines in Cook Inlet which formed about 10,000

years ago during the last major glacial retreat. No lacustrine or

marine deposits are known to underlie the moraine, and hence it may

have formed earlier than the extensive lacustrine/marine Bootlegger

Cove clay which underlies much of upper Cook Inlet and which has

been dated as 10,000 years old. Test Well #2, which was drilled at

the plant site during the 1981 field program, indicated some fine sand

at depths below 200 feet, but the samples were obtained by wash

boring, which may have produced nonrepresentative samples. The

log of Test Well #2 appears in Section 4.0 HYDROLOGY.

The Nikolai moraine is bounded on the southwest by the Chaka­

chatna-McArthur embayment, an area containing Recent alluvial and

marine deposits of sand and silt. Coarse material is generally found

at higher elevations in the embayment, and gray silt is found near

tidewater. No soils exploration was conducted in this area, but

3-10

0

MT.

5 0 5 10 I I I I I I I I

miles 5 0 5 10 I I I I I I I I

kilometers

.w.w.u. Margin of mountains and hills underlain by pre-Tertiary metamorphic rocks and igneous rocks mainly of early Tertiary age.

..1.-.L-1.. Margin of plateau underlain by sedimentary rocks of Tertiary age.

Glacial and marine deposits of Pleistocene age; Bootlegger Cove clay present in area of more widely spaced diagonal lines, overlain by gravel, sand, or peat.

Alluvial and tidal sand, silt, and grovel of Holocene age.

Areas underlain by semiconsolidoted volcanic debris flows late Tertiary or Quaternary in age.

..,..,..,.. Outer limit of moraines of early Holocene age.

TIT

--·. Outer limit of prominent moraines of late Pleistocene age.

Major fault zones(dotted where less certain): bb,Bruin Boy! em, Castle Mtn.; lc, Lake Clark; lr, Lone Ridge.

TYONEK TIMBER KENAI

PENINSULA

(\ ' )

SELECTED LOCALITIES•

A Granite Point

B

c

D

E

young landslides

Beluga River mollusk - shell locality

possible area of gravitational spreading

surface-exposed volcanic clasts in diamicton (till?) Stedotna Creek area

F soft ground along. access trail

G Strandline Lake

X Selected oreos of extensive londsliding

FIGURE 3.3 GENERALIZED PHYSIOGRAPHY AND GEOLOGY OF THE BELUGA AREA, ALASKA

c

C-

TRADINS SAY

H. R. SCHMOLL, L.A. YEHLE, C. A. GARDNER , 1981 --PROPOSED PLANT SITE BOUNDARY

Pond Marine a

Alluvial Embayment Glacial Deposits Bo9 Colluvial CONTACT Deposits rD;;..;e;:;,pa;;..;s;;;it.;;.s_........._,.---~-" '----,,...-Deposits

•••• INFERRED FAULT a,af

Holocene LINEAMENT _,

fc /

ff p c

oc,of

r·-\ CURVILINEAR FEATURE ag

Upper Pleistocene Trm1TI" INFERRED FORMER

I I gh I g I gl

Quaternary or Tertiary SHORELINE

CORRELATION OF MAP UNITS EXPLANATION

SCALE 1•63,360

i3::s:::e·f:5::s:::a::lo~========t:::=========2E=:=:=:=:;f3==========i4 Miles

8:ECE"'i55EC8CEO:=:==:i::::=====2E=:=:i::3 ====:::::14 Kilometers

FIGURE 3.4 PRELIMINARY GEOLOGIC MAP OF THE CONGAHBUNA AREA, COOK INLET REGION, ALASKA

c: water well drillers have indicated that coarse material overlays fine­

grain-material near the Nikolai escarpment. The layer of coarse

material becomes thinner west of the escarpment. In Test Well #1,

which was drilled west of the proposed town site at Nikolai Creek,

coarse material was encountered to 85 feet and silt was found below

85 feet.

The Chuitna River approximately follows the northeast boundary of

.the Nikolai moraine, but this edge is cut with numerous stream

channels and forms an indistinct boundary. This area exhibits no

evidence of recent glaciation and appears to be a long-established

drainage channel for runoff from the Nikolai and adjacent moraines.

Hence, the area contains well washed alluvium with a small amount of

fines and is generally a good source of aggregate.

The Nikolai moraine has been mapped as extending across Cook Inlet.

The area to the south of the moraine, which forms the present

beach, consists of a thin deposit of fine sand and silt over very

dense moraine type material. The proposed dock area appears to be

underlain by a dense soil exhibiting properties similar to that of the

onshore moraine.

The Nikolai moraine consists of a complex group of ground and lateral

moraines with numerous kames and eskers. It is composed of very

dense diamicton including boulders up to 10 feet or more in diameter.

The diamicton exhibits well to obscure bedding and contains layers of

volcanic clasts, sandstone, siltstone, and at one location east of the

site, coal. The diamicton may be generally characterized as a silty

sand. although numerous inclusions of silty sandy gravel and sandy

silt were observed. The very dense diamicton was only observed at

ground surface along steep bluffs, but drilling revealed similar soil

at several sites on the moraine. Numerous deposits of clean sand

and boulders were also found, often in distinctly bedded planes.

The upper soils have been mapped as more recent moraine deposits.

3-13

Alluvial deposits of sand and gravel are found in broad channels

along the moderate slopes near the plant site and consist of material

which is less dense and which contains less fines than the surround­

ing moraines. These areas (OC material in ·Figure 3.4) may present

loose soil conditions. Test Pit 7 was placed in this area.

Peat generally covers the moraine and is usually at least one foot

thick except upon eroding surfaces and may be 10 feet thick or more

on level, poorly drained areas. Vegetation was observed to have

little correlation with peat depth. Large black spruce, cottonwood,

and birch were observed to grow on peat which was more than 10

feet thick.

Surface water is relatively high in areas with peat bogs, which in­

cludes the top of the moraine and most of the plant site, but many

wells in the vicinity of Tyonek and elsewhere on the moraine indicate

a water table at depths of 30 to 50 feet or more. Surface water

drainage is impeded by the layer of organic material and organic silt

immediately below the peat. During soil exploration drilling, water

was encountered at depths which varied from 0 to more than 24 feet.

The deeper water levels were observed in areas with little or no

peat.

SITE CHARACTERIZATION

Methanol Plant Site

Most of the subsurface exploration was performed along the existing

road system (Figure 3. 5).

0 Topography

The site lies entirely upon the Nikolai moraine and generally

slopes to the south at a rate of about 50 feet per mile. The

3-14

0

FIGURE 3.5 VICINITY MAP, CIRI/PLACER-AMEX, METHANOL PLANT

0

c7

maximum elevation is about 350 feet. The southwest section of the

site approaches the Nikolai escarpment and has slopes of up to 10%

or more.

The topography of the area is characterized by low moraines

structures with relief of less than 50 feet set among nearly level

peat bogs. This topography changes to one of increasing slope

with steeply eroded stream channels along the south and southwest

portions of the site·.

Subsurface Conditions

Existing information on subsurface conditions was expanded with a

field program that included backhoe excavation of 32 Test Pits

(TP1 through TP32); drilling nine Test Holes to depths up to 50

feet (B1 through B9); and taking six grab samples from existing

road cuts ( G1 through G6). Logs of borings from two test water

wells (Well #1 and Well #2) and from one observation well (Well

#3), which were drilled during the 1981 field hydrology investi­

gation for this study, also provided data. Locations of test pits,

borings, and grab samples are shown on Figures 3. 6 and 3. 7.

These investigations indicate the subsurface conditions at the site

consist of an upper layer of peat of varying depth (Figure 3. 8)

underlain by very dense silty sand and hard sandy silt. One to

three feet of organic silt may also be found beneath the peat.

Layers of clean sand are present occasionally, and cobbles and

boulders are encountered frequently. Logs for a typical test hole

and test pit are shown in Figures 3.9 and 3.10. The upper soil

contains large amounts of boulders, cobbles, and angular sand and

gravel. These angular particles differ from the deeper soil which

contains subangular to moderately rounded fragments.

Although both types of material appear to be glacially transported,

sources and distance to the sources may differ for each group.

The silty sand resembles the diamicton exposed along the steep

3-16

FIGURE 3.6

• TEST PIT • GRAB SAMPLES o WATER WELLS

SOIL SAMPLES AND WELL LOCATIONS, CIRI/PLACER-AMEX,METHANOL PROJECT

TP-11•

" ...........

KEY • BORINGS

• TEST PITS -- ROADS

FIGURE 3.7

0 • TP-12

Section 18 Section 19

I

I I

I I

•'8-4 7 •TP-2/

I I

:¥ ~ ~ ~I

I J•TP-1

/_ ;•TP-3

Sectlonl7 Section 20

·8·6 -.,

~'\-16 NOT TO SCALE

LOCATIONS OF SOIL TEST (ClRIIPLACER-AMEX PLANT SITE)

I

II

;r"""\ \

'1(11 FT.

JSn ~PEAT DEPTH GREATER

THAN FIVE FEET.

::::-:: =:: EXISTING ROADS

~PLANT SITE

19

T.IIN R.12W SEWARD MERIDIAN

)(61N.

xl FT.

FIGURE 3.8 IDEALIZED PEAT DISTRIBUTION METHANOL PLANT AREA

(·-.

\__ '

5

I= LU LU ~ c\ ~20 a.. LU 0

30

>- '0 1- a: iii LUI-z- a::z LUU.. :::JLU ou 1-1->-.:!: U:lz a:: <So 0 ~u

KEY

(/) 1-(/) LU 1-a:: LU :I:

5

M.~

W. 0. NO. D 1 3131 LOGGED BY 0. H •

BORING 3 -PLANT

= 334'

SATURATED, SOFT

F-4, BROWN TO GREY SILT AND ORGANIC SILT WITH RANDOM GRAVEL, SOFT--

F-2, BROWN SILTY GRAVELLY ~, MOIST, DENSE

NFS/F-2, GREY GRAVELLY SAND AND SANDY GRAVEL, SATURATED, VERY DENSE

~.;.;..;;.J. __ -- -- -- -- -- -- -- - -- --BOTTOM OF TEST HOLE= 30.0'. COMPLETED 5/15/81.

PP = UNCONFINED COMPRESSIVE STRENGTH (PENETROMETER) (TSF) TV : SHEAR STRENGTH (TORVANE) (TSF) MA: MECHANICAL ANALYSIS LL = LIQUID LIMIT (%) PI = PLASTIC INDEX 0 - GRAB SAMPLE :i - SPT SAMPLE • - 2.5" L D. SPOON SAMPLE

340 # WEIGHT, 30'' FAi..L ~ - SHELBY TUBF.: - PUSHED

- GROUND WATER TABLE WHILE DRILLiNG LOG OF BORING

~ ~

FIGURE 3.9

13 • 0 I

17 • 0 I

23.5'

30.0'

c::

c -

TEST PIT 9 WORK ORDER 0 1 31 32 LOGGED BY T • Barber

TEST ~PrT~H--~R~E~==~~S ____ ~S~A=M~PL~E~Strrrrrr~~E~L~EV.~~~~I~ON~=~----~N------~E~----------~D~E~~~HL_

II~L' I fiiTI

F-4, BROWN SANDY SILT, (TOPSOIL)

2

3

4

5

6

7

8

9

10

II

12

13

~~:·-;~ ~{j·.Q~1 F-1, BROWN SILTY SANDY GRAVEL, SUB-'.· .o ·0 • ROUNDED 3" GRAVEL )0·"--;'.~ ,GP!:-' )~oP~ lif~.o:.~

;·($~·~

@ 7.:·i>j:Sj NFS, BROWN TO GREY SANDY GRAVEL,

G ~·;!)~. 4" SHARP AND SUBROUNDED GRAVEL ... GP:"; ..1:"'\::.L .g.:<?~·.· \7

~~~~~ -F-2/F-3, GREY VERY SILTY SAND AND VOLCANIC ASH MIXED, WET TO

SATURATED, MEDIUM DENSE

F-2, GREY SILTY GRAVELLY SAND, SUBROUNDED GRAVEL, 10" COBBLE, WE'I TO SATURATED, VERY DENSE

1 o 0 I

2.5 1

4 • 0 I

4.5 1

- 13.0 1

TEST KEY: W = MOISTURE CONTENT

LL = LIQUID LIMIT PL = PLASTIC LIMIT MA: MECHANICAL ANALYSIS

BOTTOM OF EXPLORATION= 13.0 1

LOG OF TEST PIT

-·-· ·-- ~ I""

0

0

bluffs. It is very dense as shown by the standard penetration

blow counts in excess of 100, and consists of poorly graded,

brown silty sand with gravel. A gradation curve for a sample

from Test Hole 3 is shown in Figure 3.11. The sandy silt is

hard, nonplastic to slightly plastic, and contains some gravel. No

clay was found on the site.

A layer of volcanic ash was observed close to the bottom of the

peat layer and resembles reddish brown silt. This layer is less

than one foot thick.

Groundwater

Groundwater is near the surface due to the high water level in

the peat. Water level depth increased north of the site in areas

with little peat and along the southern bluff. Well drillers indi­

cated artesian conditions may exist in deep, water bearing strata.

Groundwater is discussed in more detail in Section 4. 0 HYDROL­

OGY.

Permeability of the dense silty sand is low (estimated to be . 0001

inches/second or less), but the occasional layers of poorly

graded, clean sand have moderate to high permeabilities. Esti­

mates of the coefficient of permeability for this material range from

1 to .001 inches/second. However, these highly permeable layers

are not expected to be large in area, and well pump tests also

indicate limited aquifer extent.

Steeply eroded stream channels provide surface water drainage.

These channels also are found in the peat bogs, where they may

be 5 to 10 feet deep.

Plant Site Conditions

The inorganic soils in the plant site are medium dense to very

dense and offer generally excellent foundation conditions, but

3-22

.,,, () '···• _/ /=)

I SIEVE ANALYSIS HYDROMETER ANALYSIS I SIZE OF OPENING IN INCHES NUMBER OF MESH PER INCH u.s. STANDARD GRAIN SIZE IN MM.

~ 0

2~~ ~~ "' _S!3~~§ ~ ,

~ ao ::t' ~ ~If "' 0 ~ 0 ~fi! 00 N a "' ... I') N N - ~ .... CD2 - N .... ..,_ q q qqqqq .C!

100

...... 90 ..... 10

......

80 "'-20

1- 70 30~ ........ :I:

(!)

(!) ...... w w 3:: 3:: 60

...... 40 >-

' m >-m 0::

ffi 50 w

50 lQ z <t u:: 0

(.)

1- '10 601-z z w w (.) (.)

~

ffi 30 70 0:: w 0..

' 0..

20 BO

10 90

00 0 0 2 s ~ 0 0 ~ Cl) "'"'"' "' N - U! "! "! "*: "! "! -: Cl) "' "'"' "' N q Cl) 8~~ "' N

_100 0 ~ Cl) "' N q q qq q q 0 0 0 0 N

GRAIN SIZE IN MILLIMETERS q qqq q q q

KEY LOCATION SAMPLE NO. DEPTH UNIFIED CLASS. FROST CLASS. SOIL DESCRIPTION

'I'H l 4 -- SI"I F-2 esti. Silty Gravelly Sand

W.O. Dl2780

FIGURE 3.11 GRAIN SIZE D I STR I BUT ION - G RADATION CURVE

C;

C-

these soils are often covered with peat and/or organic silt to

depths up to 13 feet (Figure 3.8). The peat is generally unac­

ceptable foundation material although limited service roads may be

constructed on it using deep gravel overlays. Peat depths are

deep near the middle of the site, and become shallower along the

northern and southern boundaries. Existing roads were generally

placed in areas with little peat.

The dense inorganic soil has good stability and a very low poten­

tial for settlement or liquefaction. Soil bearing capacity is good,

generally in the range of 4,000 to 8,000 lbs. per square foot.

However, the very dense, coarse material is moderately difficult to

excavate, especially in areas with numerous boulders. Boulders

with diameters of 5 feet and more were observed, and they appear

to be well distributed throughout the site. Soil strength was not

measured directly, but standard penetration values indicate the

very dense till has an angle of internal friction of approximately

40°, and no cohesion.

The till, or silty sand, which forms much of the moraine should be

easily compacted with vibratory equipment, provided the moisture

can be closely controlled. The material contains a moderate

amount of silt (10 to 20%) and will not compact if it contains too

much water. The silty material may require dust control during

dry periods. The clean sands and coarse upper soils found in

isolated areas throughout the moraine should compact easily with

vibratory equipment within a wide range of moisture content.

The lack of large quantities of clean on-site fill indicates that silty

sand may be needed for a large amount of fill, both for plant and

road foundations. Frost protection of roads would require use of

up to 18 or more inches of non-frost-susceptible (NFS) sub-base.

N FS materials are granular inorganic soils which contain less than

3% by weight finer than 0. 02 millimeters. Existing logging roads

are in excellent condition and are constructed with material from

3-24

on-site borrow pits and with gravel obtained from the Chakachatna

River. Much of the road material is silty sand, but NFS material

was scalped from many small knolls. Roads occasionally are of

gravel-covered log corduroy construction in deep peat areas.

No impermeable fine-grain soils were found on site, but some

clayey silt was found in the Granite Point beach area. These

slightly plastic silts generally make poor impoundment material,

but a specific analysis should be performed for each application.

Beach borings in the prospective dock area indicate large quan­

tities of the silt material, but the quality may vary from slightly

plastic silt to nonplastic sandy silt.

An investigation of the extent of organic soils was performed at

the proposed plant and town sites. This entailed' an interpretation

of available air photos and literature, field reconnaissance tra- ·

verses of the site, and hand-probing the depth of organic soils.

The peat probes were spaced approximately 600 feet apart, with

traverses following existing seismic line cuts, and on random

traverses. An idealized map of the plant area has been prepared

(Figure 3.8) showing the depth of organic soils to range from 0 to

13-plus feet. The organic soil ranged in depth from 0.2 to 3 feet

in the town site. A map showing the location of organic soil in

the proposed town site was not prepared because there are no

significant deep organic soil areas.

Slope stability is generally good due to the dense soil and moder­

ate slopes in the vicinity of the plant site. Small areas adjacent

to streams have been over steepened by erosion and are unstable,

but these areas can be avoided or cut to a stable slope. The

maximum observed slopes of 10° to 20° would be marginally stable

under 0. 4g loading and high groundwater conditions, but the

majority of the slopes would be stable for all expected earthquake

accelerations. Cut stability would be good and temporary cuts

should stand at slopes of 1:1 for short periods. Long-term slope

3-25

stability probably would be controlled by erosion criteria, and

slopes approaching 2:1 may be required. The very dense coarse

material generally has a low potential for erosion, but layers of

silty material can erode rapidly under either wind or water action.

Town Site

0

0

Topography

The proposed town site is located on the Nikolai moraine, two

miles northwest of the plant site. The site is approximately one

mile from the Nikolai escarpment and has an elevation of about 450

feet.

Topography generally slopes to the southwest at about 200 feet

per mile, but becomes increasingly steep near the escarpment. An

intermittent stream with a steeply eroded channel cuts across the

north end of the site.

The land surface is typical of the Nikolai moraine, which is a com­

plex of ground and lateral moraines with numerous kames. The

area has generally low relief but is moderately well drained. Peat

bogs which contain 2 to 3 feet of peat are found in poorly drained

areas near the southern portion of the site, but most of the

proposed town site appears to have, at most, only a few feet of

peat.

Subsurface Conditions

Two borings and five test pits to depths up to 30 feet reveal the

town site has a surface layer of peat which is underlain by

medium dense silty sand or sandy silt extending to a depth of

about 2 to 5 feet (Figure 3.12). The next deeper layer is NFS

gravelly sand which may contain numerous boulders between

depths of 5 and 15 feet. Very dense silty sand and sand are

3-26

n '~1 I /

KEY • BORINGS • TEST PITS

-- ROADS

FIGURE 3.12

3 2

10 II

~ TP-20 ---...._~-I

~

~

~~-21 ~2

~ ~ TP-~

\ NOT TO SCALE

LOCATIONS OF SOIL TEST (CIRI/PLACER-AMEX TOWNSITE)

0

c

0

found below the boulders. Volcanic ash layers up to 4 inches

thick may also be found beneath the boulder layer.

A boulder layer has been identified in many parts of the moraine,

but its source has not been firmly established. It may represent

volcaniclastic debris or glacially transported volcanic material.

Volcanic debris at this distance from known volcanos would repre­

sent volcanic activity more intense than currently anticipated.

Logs of a typical test hole and test pit are shown in Figures 3.13

and 3.14.

Groundwater

The town site is generally well drained due to the proximity of the

escarpment, but the southern section of the town site contains

small areas of peat. The upper coarse soils have a moderate to

high permeability, but the underlying silty sand is very dense

and possesses a moderate to low permeability.

Groundwater was observed in the peat at depths of 2 to 4 feet,

but this appears to be surface water which is inhibited from

draining by the low permeability silt underlying the peat. Suf­

ficient slope exists to permit surface drainage through channels,

and the shallow water level should not provide extensive problems

for construction. Coarse soils with moderate to high permeabilities

are found directly below the surface silt and peat. This soil

could be used to provide on-site wastewater disposal if systems

could be placed in areas with a low water table.

Construction Feasibility

The proposed town site is characterized by very dense soil

underlying a few feet of surface peat and silt. The upper soft

soils are sufficiently thin to allow excavation to expose very dense

granular soil. The dense soil provides excellent bearing capacity,

3-28

-;:: UJ UJ !!:. ::

c~: t-a.. UJ 0

>- ~ (/)

t- tii c;; UJ t-' UJ z- a::z t-UJU. ~UJ a:: ou t-t- UJ >-~ (J)z ::

BORING 2- TOWN

W. 0. NO. D 13131 LOGGED BY 0. H. t-

~ z(/)

~ a:: 00 b 0 ~(.)

I l

s Olr--------------.----------.-~~~~~~~EL~E~~~A~TI~O~N~=~4~3~0~

1

--------------------------------------------~DE~P~T~H ·fJ'i \7 BROWN PEAT, SOFT

5

10

15

20

25

30

I

I I

lli.IJI F-4, BROWN SILT, SLIGHTLY PLASTIC, SATURATED, SOFT

TO STIFF M..

I ' I

I I

I I

j~ NFS, BROliN SANDY GRAVEL •ITH OCCASIONAL COBBLES TO ~:o· 12 "+ MAXIMUM PARTICLE SIZE, MOIST, DENSE

I

I

I I

I

11.4 I

KEY

g¥.~1 ;~ ~~:i ~-,,.

~i7 ~~£.:~ -~i~

-~ SM 166

! i I

II j

SM

i

I ~ ,1()0 ..

I ; ~ 1~1~ !100·

! I

i I i I I ! I I

F-2, BROw~ GRAVELLY SILTY SAND WITH OCCASIONAL COBBLES TO 12"+ MAXIHUM PARTICLE SIZE, MOIST, VERY DENSE

F-2, BROm• GRAVELLY SILTY SAND WITH OCCASIONAL COBBLES, ~10IST, MEDIUM DENSETO VERY DENSE

BOTTOM OF TEST HOLE = 29.0 1• COl<iPLETED 5/14/81.

PP = UNCONFINED COMPRESSIVE STRENGTH (PENETROMETER) (TSF) TV = SHEAR STRENGTH (TORVANE) (TSF) MA = MECHANICAL ANALYSIS LL = LIQUID LIMIT (%) PI = PLASTIC INDEX :J - GRAB SAMPLE :;; - SPT SAMPLE • - 2.5" I. D. SPOON SAMPLE

340 # WEIGHT, 30" FALL ]] - SHELBY TUBE - PUSHED -::- - GROUND WATER TABLE

WHILE DRILLING LOG OF BORING FIGURE 3. /3

1 • 0 I

4.5 1

12.0 1

18 • 0 I

29.0 1

C'

DEPTH 0

2

4

5

6

7

8

9

10

II

12

13

14

15 ...

TEST RESULTS

TEST KEY:

SAMPLES

W = MOISTURE CONTENT LL = LIQUID LIMIT PL = PLASTIC LIMIT

TEST PIT20 WORK ORDER D 13132

LOGGED BY 7 • B •

ELEVATION= N E

F-4, BROWN PEAT AND ORGANIC SANDY SILT.

DEPTH

~

~ ~PT< ""':-~ r------------------- 1 • 5 I ~~~ ~ F-2, GREY SILTY GRAVELLY SAND WITH

1 WOOD AND ORGANICS MIXED, ANGULAR AND SUBROUNDED 8"+ GRAVEL AND

~~~C~O~B~B~L~E~S~,~M~E~D~I~U~M~D~E~N~S~E~·~------- 2 . 5 1

BECOMING CLEANER WITH DEPTH.

~·· ••••••• 0

~~~-----------------------11.5 1

~AS!j GREY AND PINK VOLCANIC ASH AND SIL'l'. 12 . O i

;~~ ~~~~E~~~~Li~~T~O~~V~~L~~~~RY

~~00~ ------------------14.5 I

MA = MECHANICAL ANALYSIS BOTTOM OF EXPLORATION= 14.5 1

LOG OF TEST PIT

FII,IIRF ~ 14

(_

generally in the range of 4,000 to 8,000 lbs. per square foot for

spread footings. Stability of the dense soil is good, and the

liquefaction and settlement potentials are low.

Extensive cobbles and boulders found there would create moder­

ately difficult excavation conditions, but cuts and exposed slopes

would be stable at relatively steep angles. Precautions to prevent

boulder slides should be provided during excavation. Slope sta­

bility is good, and only the small slopes along streams which have

been over steepened by erosion present stability problems. These

areas may be cut to a stable configuration or avoided entirely with

only a small loss of area. Removal of the surface peat and silt

near bluffs would contribute to increased water infiltration and

may possibly increase bluff erosion.

Dock Site

0 Topography

Topography at the proposed dock area consists of a narrow (200

feet or less), level beach which is submerged or only a few feet

above water during extreme high tides. The shore slopes south­

ward at a rate of about 20 to 40 vertical feet per mile. Bluffs up

to 120 feet high with slopes of 30° to 40° border the beach strand

on the north. The bluffs are cut by numerous small streams

which have formed narrow channels. Ground surface above the

bluffs also slopes to the south at about 50 feet per mile.

The bluffs are continuously eroding and the toe of the slope often

has deposits formed by erosion debris or slumped material. This

material forms a bench about 10 to 30 feet above extreme high

water.

3-31

0

0

Subsurface Conditions

A thin layer of soft gray silt covers the beach between mean and

low tide levels. Three test borings and two probes indicate that

soft or loose deposits of silt and sand extend to a depth of about

15 feet, below which is found very dense silty sand (Figures 3.15

and 3.16) The very dense material resembles the material of the

Nikolai moraine which has been mapped as extending across Cook

Inlet. The borings indicate that only a relatively thin marine

deposit covers the very dense material of the moraine. A log for

the boring Test Hole 2 is shown in Figure 3.17. The marine

deposits contain fine sand, silt, and clayey silt. The silt resem­

bles rock flour, being generally nonplastic and only slightly

compressible ( C = . 1). c

Dock Construction

The soils in the proposed dock area have excellent bearing capa­

city below the Recent soft, loose marine deposits (Figure 3. 16).

However, boulders are present and may create difficult pile

driving conditions.

The existing beach is narrow with little or no back beach area,

and lack of space may limit the amount of activity near the dock.

The beach is generally only a few feet above extreme high water,

and portions of it may have to be raised to provide protection

ag'ainst high water. The bluffs which border the site on the

north are steep and are eroding continuously. They also repre­

sent a hazard of landslides onto the narrow beach. The slopes

should be stabilized if activity were to occur near the toe of the

steep slopes. The bluffs are composed of very dense, granu~ar

material and should be stable at about a 1~:1 slope, provided

water is prevented from eroding the bluffs.

3-32

I

I I ,

' ,

o TEST HOLE LOCATION

---- MUD FLATS

0 OIL PLATFORM

SCALE: 1"= 4700'

FIGURE 3.15

'(_low tide waterline (5-20- 81)

DOCK SITE TEST HOLE LOCATIONS

0 BRUCE

0ANNA

(S) GRANITE POINT

0 VICINITY OF SHIRLEYVILLE

t­w

10

20

w 30 IJ._

40

5

60

FIGURE 3.16

B-3

-SILT

~SILTY SAND

fi/~}~/Y~\1 SAN o

or-------4~o=o ______ ~a~oo~----~1200 HORIZONTAL SCALE• I"" 400'

DOCK SITE IDEALIZED SOIL PROFILE

~-,

I

" 0

0

2C

3C

50

>-1-Cii z-UJU.. 0(.)

>-~ ct: Q

pp = TV= MA= LL = PI = ':] -~ ·-' =

.... ~

(/)

t;; W.O. NO. 1:013132 UJI-ct:z :::::lU,J ........ C/)z 00

UJ l-et: UJ

LOGGED BY 0. H.

BORING 2- DOCK ::lEU 5

1-Z (/)l­oa.. ct:UJ u..o ELEVATION= Refer to Profile DEPTH

MA

KEY

I :i~~:i¥ NFS, BROWN ~· SATURATED, ~lEDIUM DENSITY

i 1111 F-4, GREY SANDY SILT, NON-PLASTIC, SATURATED, SOFT

~ J~ 7

-~ SM 13

I I

~~ !""' £;; '"""" ..

I i • ' ' !

j

' I

I I

F-2, GREY SILTY ~, SATURATED, MEDIUl-1 DENSE

F-4, GREY SILT WITH SILTY SAND LENSES, NON-PLASTIC TO SLIGHTLY PLASTIC, SATURATED, SOFT

F-2, GREY SILTY GRAVELLY SAND, MAXH1UM ?ARTICLE SIZE TO 2"+, MOIST, VERY DENSE--

W.UJ.:L--- -- -- -- ------ ---- ---

BOTTOM OF TEST HOLE= 48.0'. COMPLETED 5/20/81.

UNCONFINED COMPRESSIVE STRENGTH SHEAR STRENGTH (TORVANE) (TSF) MECHANICAL ANALYSIS

(PENETROMETER) (TSF)

LIQUID LIMIT (%) PLASTIC INDEX GRAB SAMPLE SPT SAMPLE 2.5" I. D. SPOON SAMPLE 340 # WEIGHT, 30" FALL GIIELBY TUBE PUSIIED GROUND WATER TABLE WHILE DRILLiNG LOG OF BORING FIGURE 3.17

2.0'

8.0'

14.0'

19.0'

48.0'

C:

c:

Erosion of the beach appears to occur at a rate of about 2 feet

per year as shown by aerial photographs. Dock structures would

need protection from tidal current, ice scour, and wave action.

Protection in the form of riprap could be provided from several

sources. Boulder deposits occur on-site and appear to be wide­

spread, but their quality and quantity are unknown. Quarry

sites containing volcanics and intrusives of Jurassic time exist at

elevations above the outwash/moraine plateau and at various loca­

tions throughout Cook Inlet.

Transportation Corridor and Mine Areas

The proposed mine sites include the Capps coal field area and the

west half of the Chuitna coal fields (Center Ridge).

0 Topography of Mine Areas

The topography in the Capps and Chuitna coal fields includes

areas of significant mass wasting potential due to water runoff,

frost action, slope and other natural features. The ground sur­

face is covered with many small hummocky hills indented with small

cirques. The surficial features (patterned ground) indicate sur­

face frost action is occurring primarily in the uplands. The

presence of permafrost in the Capps coal field area is highly

possible. During hand probes, several samples obtained below 5

feet in depth were very cold to the touch.

0 Surficial Conditions at Mine Areas

The ground cover within the area of the Capps and Chuitna coal

fields consists of a thin layer of moss, grasses, wild flowers and

low woody plants. Field observations noted a cyclic build-up of

surficial soils. The mosses are gradually covered by wind-blown

sands and/or volcanic ash. Figure 3.18 illustrates a typical shal­

low soil profile of the Capps area. Soils tests show the sands to

3-36

0 Brown peat, with fin• to m1dlum eanda

Tan to buff eandy volcanic aeh

1.5l------------------------------Lay•r•d organice I eandy volcanic aeh

2.5-r-----------------Buff eandy volcanic 11h

•.o·r----:~--------------auu aandy volcanic aeh

0~========================== F1GURE 3.18. TYPICAL SOlL PR<FILE OF CAPPS AREA, ALASKA

c=~

0

0

be well-sorted with 68% retained between the #40 and #200

screens. A grain size analysis of the ash shows 48.5% is sand

and 41 .6% is minus #200 grain size.

Transportation Corridor

The transportation corridor traverses the upland tundra of the

Capps Field area, passes through the transition zone between the

tundra and mixed high brush where the Chuitna Field is located,

and enters the lower elevation which is dominated by mixed high

brush/spruce and hardwood forest area near tidewater.

The surface vegetation changes from grasses and moss to alders

and grasses with root systems which extend 18 inches or more.

The topsoil here has developed to a greater extent than the soils

of the Capps area, however, it is· still bisected with layers of

sandy volcanic ash. Figure 3.19 shows a typical section/soil pro­

file for the Chuitna Field area.

Trafficability

The trafficability of the upland Capps coal field area is very poor.

Layered organics and volcanic ash have been observed in recent

field reconnaissance to range from a few feet to more than six feet

in depth. In addition, the groundwater table is relatively high,

having been located in several test probes at depths from 20 to 60

inches.

Construction Materials

0 Surficial Geology

Subsurface soils investigations were performed in the proposed

plant and town sites and surrounding areas in order to observe

the existing soil conditions, and to determine on-site aggregate

3-38

(_; FIGURE 3.19

I.Z

t

F4 BROWN PEAT

F4 BUFF SANOY VOLCANIC ASH

F4 LAYERED BROWN AND TAN ORGANICS a SANOY VOLCANIC ASH, WET TO SATURATED

~~------------------------------------F4 BUFF GRAVELLY SANDY VOLCANIC ASH

1/2 -3/4 SUB ROUNDED GRAVEL, MOIST

TYPICAL SOIL PROFILE OF CHUITNA AREA

sources. The investigation was confined to existing roads and

accessible logging trails in the plant and town site areas. Random

grab samples were also taken along the transportation corridor.

Sufficient quantities of on-site aggregate resources for use in

concrete, bituminus paving, railroad ballast, and classified fill do

not appear to be present within the immediate plant or town sites.

It is suspected there are moderate quantities of on-site aggregate,

but the quantities are probably too small to be used for any major

construction purposes.

The soils encountered in the proposed development areas are con­

sidered to be glacial in origin. The glacial deposits are generally

divided into two types: Till, non stratified drift, and moderate to

well bedded diamicton; and stratified drift. The till is considered

to be a direct glacial deposit and the stratified drift is considered

to be deposited by a fluid medium less viscous than glacier ice,

i.e. water or air.

Two distinct kinds of glacial till are found in the plant and town

sites and surrounding areas. An upper layer of coarse, angular

till was observed to depths of 0 to 8.5 feet, but is suspected to

be deeper in some areas. It appears to be unsorted, virtually

unweathered material containing all particle sizes. Boulders 10

feet or more in diameter are scattered erratically on the ground

surface. Rock fragments are of all sizes, are angular to sub-

angular, and contain some sub rounded particle shapes. Lith­

ologically, the parent material is primarily volcanic, ranging from

non-visicular to visicular in texture, with little visible matrix.

The upper soils often exhibit a silty sandy matrix, which may

contain some organics leached from the surface organic soils.

A second type of glacial till is found below the upper till. It is a

poorly sorted, silty gravelly sand mixture, with occasional angular

to subrounded cobbles and boulders. This till appears to have

undergone a higher degree of weathering than the overlying till.

3-40

c

Various amounts of soil stratification were observed along road

cuts and in pits. Generally the deep soil is considered to be non­

stratified to moderately stratified and has been mapped as 11 ground

moraine deposit -- primarily diamicton 11•

There are areas on the plant site where stratified tills are pres­

ent. These deposits generally cap small knolls, eskers, and

kames which are characteristic of the moraine topography. Most

sites have already been scalped to build access roads for removing

timber. The soil below this shallow surface material is a till com­

posed of silty, gravelly sand. Poor accessibility caused by deep,

soft peat prevented investigation of many of the potential aggre­

gate source areas.

Random aggregate samples were taken at road cuts and existing

gravel pits, both on and off the site, but no significant sources

of aggregate were found. The search was extended to the Chack­

achatna River area and the lower reaches of the Chuitna River.

The Chuitna River area has had little glacial activity and generally

contains coarser material than the moraine areas.

Potential aggregate sources were examined as a part of this study.

The Chakachatna riverbed and the accompanying old stream chan­

nels were considered. The sample tested was taken near the

existing bridge, however similar material was observed about four

miles east of the river. Other potential material sources include

the existing pit at Tyonek, and Test Pit 6, where sample 1 which

is representative of on-site material, was taken at a depth of 4

feet (Figure 3. 7). Nearly unlimited quantities of material are ex­

pected to be present in the Chakachatna River area but on-site

quantities are expected to be severely limited. Gradations of the

samples tested are shown in Figure 3.20. The Chakachatna River

sample was not entirely representative of the material in the field,

because the natural deposit contains an abundance of large gravels

and cobbles not reflected in the sample.

3-41

I SIEVE ANALYSIS I HYDROMETER ANALYSIS I SIZE OF OPENING IN INCHES NUMBER OF MESH PER INCH u.s. S ANDARD. GRAIN SIZE IN MM.

::t! 0 2~~ ~~ "' -~8Q~ ~ C!> "' ~ ao ~ ~ ~~ ..;;t ,. .,g !!! 0

~ 0 g!i 00 q ~ qqqqq .Q a "'

,. "'N N N ,. .,_ 100

90 ... 10

\\ ' 80 20

~ .... ' ' 1'-

30 ~ 1-- 70 .,

:X: (!)

(!) w - :!= w l'\ 3:: 60 1'- "" 40>-

>- ...... m m a: w ffi ~0 OOg? z <t lL 0

u 1-- 40 ,......_ !"'. 601--z w z

w u u .. ffi 30 ....... l '\ 70 a: w Q. ..... ' Q.

' I'~

20 80

..... 10 90

..... 00 0 0 5: fil ~ 0 0 2 Q) coon<t "' N - ~ "! "! '01; "! "! ~ .. CD .... ,. "' N .,

8g~ "' N _100

0 Q Q) "' N q q qq q q q 0 0 0 0 N

GRAIN SIZE IN MILLIMETERS q qqq q q q

KEY LOCATION SAMPLE NO. DEPTH UNIFIED CLASS. FROST CLASS. SOIL DESCRIPTION

----- Tvonek Gravel -- -- GW NFS Sandy Gravel I nit-

Chakacha t~~' IRiuPr i~ri rP -- -- GP NFS Sandy Gravel

----- Plant Site s·~ Y: @4 -- GP NFS Sandy Gravel

W.O. 12780

FIGUR£3.2C GRAIN SIZE Dl S T R I B'U Tl 0 N -- G R ADA Tl ON cu R VE

c

0

c

A limited soils testing program was conducted in August 1981.

Samples were obtained in the Capps Field area from exposed

glacial till and volcanic ash. Grain size analyses were performed

on the sand and volcanic ash, and Atterberg Limits were deter­

mined for the volcanic ash. In addition, a Los Angeles Abrasion

Test (American Society for Testing and Materials [ASTM] C131-55,

grading E) was performed on a surface grab sample of the gla­

cially deposited volcanics in the Capps uplands.

The grain size analysis on the sand revealed a well-sorted sand

with 68% retained between the #40 and #200 screens. This, in

combination with field observations, indicates the mode of deposi­

tion was by wind. Because of the dark color of the sand and the

surrounding dominant volcanic rock type, the sand is most likely

derived from volcanic rocks and ash.

The grain size analysis of the volcanic ash reports 48.5% is sand

and 41.6% is minus #200 grain size. An Atterberg test was run on

the ash, and confirmed it to be non-plastic. Other volcanic ashes

in the field were plastic.

The Los Angeles Abrasion Test on 11 glacial 11 till which had been

reworked by surface runoff, reported a 15.6% loss by abrasion.

This is considered a very acceptable percentage loss and suggests

that this material could be used for a railroad ballast or for road

construction. Figure 3.21 illustrates the results of the abrasion

test.

Concrete Aggregates

The Chakachatna River material shows the most favorable grada­

tion of the three samples tested for both coarse and fine portland

cement concrete aggregates. Table 3.1 shows the gradation of the

three samples broken down on 1~11 and #4 sieves. Both fractions

of the test sample meet the appropriate ASTM C33 gradations.

3-43

Exploration Chemical Materials Inspection

~------~~--~--------~L~OS~A~N~GG~EtE~~S~A~BMST~ON~A~IS~TM~C~:~1.3~1l~-~si5~------~--------~

Size /1!----.-----r----r-----,-----.----.,-----1 Grading j F~u cUon ! I _ _.A~-;--..jBJ...--i-_..r,...__t-_.n...___!----'..__·;-1 _..._ F--t-~GG...---t+--..><:lU"""s,:,:.;ed.._ __ _,l

'I ! I

3" to 2-l/2" !1 I 2500 gi~~ I I' I . fj

2-l/2" to 2"!! 2500 g~! II 2" to !-l/2" :! i 5000 g~~ 5000 g;l !\

I I I I * l; 11-l/2" to 1" :! 1250 grr/ i i ' 5000 gm 1 5000 gm i! 1253.1

1252.2

1253.4

1249.9

I 3/3" to 1/t."~! I !2soo gm : 1 i! ll/<:" to¥<: !\

1

2500 gm ! I \1 II

f:4 to 4'8 :! ! 5000 gm! j jj+-_-_-_-_-_-_-_-_-___ _,_, _____ __, 5000 gm[ 10,000 grrll0;0009nll0,000gm I 5008.60 Actual Wt, (II) Totul Weight ii 5000 c;m: 5000 gm 5000 gm

~----II I I j No. of a a 1! s : 12 : 11 8 6 I 12 12 12 i/

I i ..., To!crance :!: 2%/size fraction

Proje-:t Beluqa - ~1ethanol Plant Loci! tion __:T.J_y_:::o~n:::_e k:,:..,------,,-------------Cllen~ Cl RT /Placer - A.nex ?it Silmpled 11250::.,.·::....3 ______________ _

Date 6/6/81

w. 0. 012780

Tech, C.TP -----

I FIGURE 3.21 I ABRASION TEST RESULTS

4158.6 Wt. Ret 4!12 (a)

850.0 i'..oss A- 3

17.0 1 % Loss(A-B)lOO i A

-~ : I /

Table 3.1

FINE CONCRETE AGGREGATES, 1*4 MINUS

Percent Passing Chakachatna

Sieve River T~onek Pit On-Site

4 100 100 100 8 87 80 . 82

16 68 59 66 30 38 34 46 so 19 16 27

100 9 10 11 200 5 8 4

F.M. 2.79 3.01 2.68 Absorption 2.9 3.6 3.3 Apparent Sp. G. 2.81 2. 71 2.76

*0-3 is concrete subject of abrasion

Percent Passin Sieve Coarse Concrete Al:Jgregates, 1 II to !t4

1~" 100 100 100 1" 60 86 87

3/4" 44 72 71 ~II 30 45 54

3/8" 16 30 32 !t4 0 0 0

Absor·ption 1.6 1.2 Apparent

Sp. G 2.77 2.69 L.A. Abrasion 26 17

3-45

C:

ASTM C33 Specs

95-100 80-100 50-85 25-60 10-30 2-10 0-5*

2.3-3.1

ASTM C33 Size 467 Specs

95-100

30-70

10-30 o-s

50 Max.

The oversized coarse gravel and cobbles would be wasted as a

part of the concrete aggregate operation, but would probably be

useful in some of the other products discussed below. The

amount of material passing the #200 sieve in the Chakachatna

River sample is only marginally within specifications. Washing of

the sand or selective mining of the pit to decrease the amount of

material passing the #200 sieve may be desirable to improve the

efficiency of this material as concrete aggregate. Los Angeles

abrasion loss on the coarse fraction of this sample is within

specification limits, although higher than for some aggregates in

the area.

The Tyonek pit material has grading deficiencies which would be a

problem for production of portland cement concrete. It has a

slight excess of coarse sand in the .#4 and #8 ranges, and an

excess of material passing the #200 sieve. It is slightly deficient

in the medium sand fraction passing the #30 and retained on the

#100. These deficiencies could be overcome by processing the

sands through a classifying plant and wasting some of the

unwanted sizes. In the coarse aggregate, the Tyonek pit material

has an excess of material passing the 3/8-inch and retained on the

#4. This (pea gravel) material decreases the economy of the

concrete by increasing the cement content required to achieve a

given strength level, and tends to cause poor finish-ability of the

concrete. Therefore, if this source is used it is recommended

that a large portion of the pea gravel size be wasted from the

concrete aggregate. It may be possible to utilize some of the

wasted pea gravel in other materials. The Tyonek pit material

would probably be quite durable under abrasive conditions as

indicated by its low loss in the Los Angeles abrasion test.

The on-site material as represented by the sample from Test Pit 6

typically is too silty for use as concrete aggregate. A test sample

taken from an area with lower silt content than typical shows a

gradation which could be processed to provide satisfactory con-

3-46

( crete aggregates. The sand in that sample conforms to ASTM C33

specifications for concrete sand except that an excessive amount

passes the #100 sieve. This deficiency could easily be corrected

by washing the sand. The coarse fraction of this material has an

excess of the pea gravel sizes, some of which would need to be

wasted to provide a satisfactory concrete aggregate.

Coarse aggregate sizes other than 1~-inch maximum shown on

Table 3.1 would also be practical to manufacture from the materials

investigated. A 1~-inch maximum aggregate size would probably

be economical to produce from the Chakachatna River material,

while a finer coarse size, perhaps 3/4 to 1 inch nominal, would be

more practical to produce with the Tyonek or on-site materials. It

would also be possible to introduce crushed gravel into the coarse

concrete aggregate. This would give a greater latitude in the

potential gradations available, particularly with the Chakachatna

River source.

No matter which source is selected for use as concrete aggregate,

further testing should be performed to verify the acceptability of

the source. Particles consist mostly of a mixture of coarse and

fine-grain igneous rocks. Certain fine-grain igneous materials and

glassy igneous minerals are alkali reactive. It is possible to com­

pensate for alkali reactive constituents in aggregates if their

presence is known beforehand. Therefore it is recommended that

alkali reactivity tests be performed on any aggregate source con­

sidered for use. Also useful would be to produce some laboratory

concrete test batches with materials tentatively selected for use.

It would then be possible to check the workability of the concrete

and the water demand, and to determine proper design strength

levels for that aggregate source. If concrete placements which

would be subjected to freeze-thaw action in a damp environment

are contemplated, freeze-thaw tests of specimens of hardened

concrete might also be considered.

3-47

(

c-_.

0 Asphalt Concrete Aggregates

Table 3.2 shows a typical aggregate grading for asphalt concrete.

The material coarser than the #4 sieve in asphalt concrete consists

mostly of crushed particles. The gradation of the coarse material

could be controlled by controlling the crushing process, provided

there is sufficient oversize material to provide a good crusher

feedstock. The Chakachatna River source has abundant coarse

gravel and cobbles that could provide large quantities of crusher

feedstock. The other two sources would have smaller quantities of

oversize material, but probably would have enough for production

of asphalt concrete in limited quantities.

It is usually not practical to crush a fine asphalt aggregate to

achieve a desired gradation, but it is necessary to find a material

with a fine fraction graded within specifications or to blend sev­

eral materials to obtain the desired gradation. None of the three

sources contains a fine aggregate graded entirely to meet the

specification shown on Table 3.2 for fine aggregate. The Chaka-

Table 3.2

TYPICAL ASPHALT CONCRETE SURFACE COURSE (Asphalt Institute I Vb)

Sieve

3/411

3/211

3/8' #4 #8

#16 #30 #50

#100 #200

Percent Passing

100 80-100 70-90 50-70 35-50

18-29 13-23

8-16 4-10

Material coarser than #4 sieve should be mostly crushed gravel.

3-48

c

0

chatna River fine aggregate is deficient in materials passing the

#50, #100 and #200 sieves for use as an asphalt concrete aggre­

gate. The Tyonek pit material is deficient in the sizes passing

the #50 sieve and retained on the #200 sieve. The grade of the

on-site material more closely approximates the asphalt specifica­

tion, but is deficient in material passing the #200 sieve. Other

on-site materials have more material passing the #200 so it is

expected that a satisfactory blend could be achieved. If either

the Chakachatna or the Tyonek material were used for asphalt

concrete, it is recommended that a fine silty sand or sandy silt be

blended with the natural material to produce a more desirable

gradation for asphalt concrete. The exact blend would depend on

which source is selected. The Tyonek pit material showed high

resistance to abrasion using the Los Angeles abrasion test and

would be expected to produce an asphalt concrete more resistent

to traffic abrasion than would the Chakachatna material. The

gradation on Table 3.2 is simply typical of what may be used for

asphalt concrete. It may be worthwhile to ·test gradations outside

that specification, as a wide range of gradations is capable of

producing acceptable asphalt concrete.

Crushed Base Course

Surfaces which are to be paved with asphalt concrete probably

require a greater quantity of crushed base/leveling course than of

aggregate for asphalt concrete. A typical gradation of base/

leveling course is shown on Table 3.3. Since it is primarily a

crushed product the gradation of the coarse material must be

controlled by the crushing process. Efficient materials for pro­

cessing into a base course would be those with a relatively high

percentage of material coarser than the 3/4-inch screen. Use of

sufficient quantities of coarse material would allow material from

any of the three sources Chakachatna, Tyonek or on-site, to be

processed into acceptable base course material. Some base course

specifications may allow a larger maximum size than shown on

3-49

0

c:

(_/

Table 3. 3 and some allow a greater percentage passing the #200

sieve. No material with a 11 0 11 value ·less than 50 when tested for

susceptibility to degradation during agitation in water according

to Alaska Test Method T-13 should be used to produce base

course.

Railroad Ballast

Table 3.4 shows a typical gradation for railroad ballast. This is

an open graded coarse aggregate containing a mixture of crushed

and natural particles. Any of the three sources considered could

be used as a raw material source for railroad ballast. If the

Chakachatna River material were used, large quantities of coarse

gravel and cobbles for crusher feedstock would be available, but

the number of crushed particles in the finished product would

probably be greater than required by the specification. If rail­

road ballast were being produced from either the Tyonek or on

site source at the same time concrete aggregate were being pro.­

duced, the oversize material wasted from the concrete aggregate

could be crushed and utilized in the railroad ballast, while pea

gravel sizes undesirable in the concrete aggregate could be wasted

from the concrete aggregate and utilized in the railroad ballast as

part of the uncrushed material.

The relative quantities of the different types of materials needed

are important in selecting the most practical pit from which to

borrow. The Chakachatna River material is expected to produce

the largest quantity of coarse gravel and cobbles for crusher

feedstock. The other sources would provide larger quantities of

naturally rounded medium-size particles. If exceptionally large

quantities of concrete were required, sands from any of the three

sources could probably be processed through classification into an

acceptable gradation. If the quantities of concrete would not

justify importation of a classification plant, the Chakachatna River

material shows the most favorable natural gradation of sand. Use

3-50

Table 3.3

TYPICAL BASE COURSE (State of Alaska 0-1 Specification)

1" 3!4" 3/8" lt4 #8

!*40 1*200

Crushed Particles

Percent Passing

100 70-100 50-80 35-65 20-50 8-30 0-6

70% + lt4 single face

Source: DOTPF 1981 Standard Specifications for Highway Construction.

Table 3.4

TYPICAL RAILROAD BALLAST (Alaska Railroad G-2)

At least 70% of material coarser than 1*4 seive should be crushed.

Seive

1~"

1" ~II

lt4 #8

#16 Crushed Particles

Percent Passing

100 65-100 35-75 10-35 0-10 0-5

21-60

Source: Typical Alaska Railroad Construction Specification.

3-51

G

of waste materials from one product in another product can im­

prove the economics of aggregate production, and could have an

affect on selection of the pit site.

GEOLOGIC HAZARDS

Seismicity

The Cook lnlet-Susitna Lowlands, the setting for the proposed pro­

ject, are included in a region of great seismic and volcanic activity

associated with the subduction zone formed as the Pacific Ocean plate·.

dips below the North American plate. Features of this collision zone

include the arcuate Aleutian Island chain of volcanos and many, but

not all, of the recorded large seismic events in Alaska.

Major fault systems have been identified in the general area Figure

3.22, and include the Aleutian Megathrust (subduction zone), Castle

Mountain, Bruin Bay, Lake Clark, and Border Ranges faults. Each

of these, as well as other more distant features, is capable of pro­

ducing seismic events, but the frequency and magnitude associated

with each system are not well known due to the relatively short

length of record, which is generally the case throughout Alaska. '

Since 1899, nine Alaska quakes have exceeded Richter magnitude 8,

and more than 60 have exceeded magnitude 7. Thirteen earthquakes

of magnitude 6 or greater have occurred in the Cook l nlet region

during that time. The general project area lies at the border be­

tween Zones 3 and 4 in the 1979 Uniform Building Code, but his­

torical seismicity indicates a high level of seismic activity for all of

upper Cook Inlet.

0 Aleutian Megathrust

The subduction zone between the North American and Pacific

Ocean tectonic plates is topographically expressed in the North

3-52

FIGURE 3.22

@ ~ ... -~ --

FAULT SYSTEMS

I DENALI lA FAREWELL SEGMENT IB HINES CREEK STRAND IC McKINLEY STRAND

ID SHAKWAK VALLEY STRAND

2 CASTLE MT-LAKE CLARK

3 BORDER RANGES 4 CHUGACH -ST. ELIAS 5 FAIRWEATHER

6 JACK BAY a WHALEN BAY

7 ALEUTIAN MEGATHRUST

8 CONTINENTAL MARGIN TRANSITION

9 BRUIN BAY

MAJOR FAULTS IN SOUTHCENTRAL ALASKA

Pacific by the arcuate Aleutian Island chain, the mountains which

forrn the Alaska Peninsula, and the deep Aleutian oceanic trench.

The subduction zone in this area of the Pacific is thought to be a

shallow, north dipping (reverse fault) thrust zone termed a 11 megathrust 11

• The unusually shallow (10°) angle of thrust is

inferred from hypocentral locations and fault plane solutions of the

earthquakes that continually express the tectonic realignment along

the northern limits of the Pacific Ocean Plate. Although a sim­

plistic interpretation of earthquake epicenters and topographic

expression implies the Aleutian megathrust is a smooth circular arc

with a radius of approximately 800 miles (1,280 kilometers) it is

now believed that the arc is composed of relatively short straight

line segments joined together at slight angles. It is further

thought that these segments are tectonically independent. There

has been a tendency for the hypocenters of large earthquakes to

occur near one end of these blocks, and for the accompanying

aftershocks to spread over the remaining portion, so that during

large events strain is released over an entire segment of the

megathrust zone, stopping abruptly at the discontinuity between

individual segments.

Nearly the entire Aleutian Arc between 145°W and 170°E has rup­

tured in a series of great earthquakes (ML greater than 7 .8) since

the late 1930s. The most recent great event was the 1964 Prince

William Sound earthquake, which was the largest ever recorded on

the North American continent (ML = 8.3 to 8.6). It is believed

that this activity is typical rather than atypical for the area, and

that future earthquakes of magnitude 7. 9 or larger can be ex­

pected along the megathrust.

Continual motion along the thrust system produces a large amount

of regional subsidence and uplift due to plate warpage, and is

responsible for the orogenesis (mountain building) for the region.

The proposed plant site lies outside the zone of major vertical

movement produced by the 1964 event. Although large displace-

3-54

0

0

ments of 35 to 50 feet were noted elsewhere in Alaska, only about

one foot of vertical displacement was noted by residents of

Shirleyville, a small settlement near Granite Point.

Castle Mountain Fault

The proposed plant site lies in an area which is near the ends or.

juncture of three major faults, the Castle Mountain, Bruin Bay,

and Lake Clark faults. Continuity of these faults has been

inferred by gravimetric methods, but no surface expressions tie

them together.

The Castle Mountain Fault has been classified by various investi­

gators as both a right-lateral strike slip fault and a steeply

dipping reverse fault. Right-lateral slip was observed in Creta­

ceous units, and dip-slip motion has occured since Miocene time.

Schmoll has indicated the fault was active east of the · Susitna

River in Holocene time, but Recent movement west of the river is

unknown (Schmoll, et al , 1981).

The magnitude of earthquakes associtated with this fault generally

is small (ML = 3.0 to 4.5), and their focal depths are shallow-­

generally less than SOkm. However, it is thought that six re­

corded earthquakes with magnitudes greater than 6.0 have

occurred on the fault. The maximum historical earthquake is

believed to be 7. 3 in 1943, but uncertainty exists concerning its

location.

The Castle Mountain Fault is capable of producing a magnitude 8.0

earthquake based on its length of about 215 miles (exclusive of

the Lake Clark Fault), but a probable maximum is 7 .5.

Bruin Bay Fault

It is postulated that the Bruin Bay Fault passes through the plant

site and joins the Castle Mountain Fault through the Moquawkie

3-55

0

0

Contact. No surface lineaments are noted at the site, but

Congahbuna Lake has been suggested as a surface feature of the

fault (Schmoll, et al , 1981).

The activity of this fault system has not been established in

Recent time, but Tertiary movement is suspected. More extensive

investigations should be performed to determine its activity and

location, since this is the closest fault to the proposed plant site.

The length of the fault (320 miles) implies that it could produce

seismic events with magnitudes greater than those associated with

the Castle Mountain Fault; however, no Holocence activity is

known.

Lake Clark - Lone Ridge Fault

It is postulated that the Lake Clark Fault is a continuation of fea­

tures similar to the Castle Mountain Fault. However, a gravi­

metric study indicates different tectonic blocks are involved. It is

also postulated that the Lone Ridge lineament belongs to the Lake

Clark system (Detterman, et al ) . This ridge lies north of the

Chuitna coal field and exhibits steep scarps.

Border Ranges Fault

The Border Ranges or Knik Fault is located across Cook Inlet from

the proposed site and forms a boundary of the Cook Inlet low­

lands. A magnitude 7. 0 earthquake has been estimated to be the

maximum expected for the Border Ranges Fault, but little physical

evidence is available concerning its activity. No fault movement

has been documented for the past 10,000 years near Anchorage,

suggesting that part of the fault is inactive.

3-56

0 Seismic Design Considerations

Seismic considerations significantly affect the design of structures

in the Cook Inlet region. Risk studies based solely on historic

seismicity in the upper Cook Inlet region (Anchorage and vicinity)

indicate peak -rock accelerations of about 0.4g have a 10% chance

of exceedence in 50 years, and peak rock accelerations of 0.17g

have a SO% chance of exceed.ence in the same design period.

These values have been calculated for Anchorage during previous

investigations, but a regional study indicates that similar values

should apply to adjacent areas including the plant site. The fea­

tures which contribute to seismicity indicate that a 7. 5 magnitude

earthquake would be reasonable for a closely occurring earth­

quake, and an 8.5 earthquake may be expected from a distant

earthquake attributable to the Aleutian Megathrust or other large

fault. Frequency of these events for Anchorage is shown on

Figure 3.23. The Castle Mountain and Bruin Bay faults probably

could produce greater accelerations than the values given above,

but these accelerations constitute the maximum credible accelera­

tions at the site and have a low probability of occurrence. Boore

(Boore, et al., 1978) indicates that peak accelerations of 0.8 to

1.0g would be expected from major activity on the nearby faults,

such as the Castle Mountain or Bruin Bay fault.

Frequency contents of distant and near earthquakes would differ

appreciably, but little information is available on the frequency

content of Alaska earthquakes. However, comparison with Cali­

fornia earthquakes indicates that 11 design earthquakes 11 should

differ for near and distant sources, i.e. a higher frequency con­

tent for close earthquakes than for distant earthquakes. The

peak rock acceleration may be used as a scale factor for design

earthquakes from close or distant sources. However, the peak

rock accelerations and design earthquakes were not determined

during this investigation.

3-57

c -a: <t IJJ >­...... (/) 1-z IJJ > IJJ

Ll.. 0

a: IJJ Ill :::!!: :::> z

100.0

10.0

1.0

log n = 3.79-0.70M

PERIOD OF RECORD= 70yrs.

0.10

0.01 '---'"""-----'----L..----'--"'"---....L....---L.--&.....L--1 0 2 3 4 5 6 7 8 9

MAGNITUDE (M)

CUMULATIVE MAGNITUDE FIGURE 3.2 FREQUENCY RELATIONSHIP {ANCHORAGE RE,GION)

c-·. Peak ground acceleration is a function of the input rock accelera­

tion, soil response, and the soil-structure interaction. The very

dense soils which underlie the plant site indicate that surface

motion would not differ largely from the input motion, but an

investigation of ground motion should be performed for the site.

The dense soil will offer excellent protection against liquefaction

or subsidence since it is already near its densest condition. Peat

in the area may contribute to amplified ground movement during

earthquakes if it is incorporated into foundations or if it underlies

filled areas.

The effects of seismic motions may include some slope instability,

but only in those areas which have been over-steepened by ero­

sion. Bluff areas near the proposed plant site appear to have

been relatively stable during the 1964 event except for areas along

the beach and rivers which had been over-steepened by erosion.

Slope failure did occur during the 1964 event along the steep

bluffs northeast of the site. The proprietor of Shirleyville indi­

cated that his house was damaged by an earthslide which occurred

soon after the 1964 earthquake, but that the slope was stable

during the event. Frost and water may have contributed to this

phenomena of delayed slope failure. However, it must be con­

cluded that many of the slopes in the area were not affected by

the 1964 earthquake. The beach bluffs typically receed 2 to 3

feet per year due to erosion or due to shallow, slump type fail­

ures regardless of earthquake activity.

The bluffs adjacent to the plant site appear to be stable for all

expected earthquake accelerations, provided large toe cuts are

avoided and large loads are not applied at the top of bluffs.

Some small, locally over-steepened slopes exist, but these areas

could be avoided or cut to a stable configuration.

3-59

Ground Failure

Local ground subsidence is not likely due to the dense state of the

soil at the proposed plant site, but surface faulting along the Bruin

Bay/Moquawkie Contact (Figure 3.22) could have severe consequences

to development if it were to occur. Local investigations should be

performed to determine the fault's activity and possibly the location

and alignment of its surface expression. Since peat in this area is

saturated, an investigation using trenching would be relatively dif­

ficult without extensive dewatering. The problems associated with

surface faulting through developed areas could be avoided by re­

stricting development in the area of possible ground faulting as

inferred by linear features, such as Congahbuna Lake.

Landslides

Landslides in the Beluga area often occur within the Kenai Formation.

The soils consist of low-grade sedimentary sandstone, conglomerates,

siltstone, and claystone. Most of the slides occur on steep slopes

which are undercut by stream action and/or where frost action, sur­

face and subsurface water, and gravity have contributed to slides.

Some tectonic activity due to movement along the Castle Mountain

Fault and earthquakes may also play a significant role in landslides in

the area.

The Capps Glacier slide is a very large slide covering approximately

five square miles. The land has a stepped slump topographic ap­

pearance. Many large coal blocks lie in a random orientation in rela­

tion to the surrounding in situ coal beds. The Capps Glacier slide is

active with the most recent movement observed occurring adjacent to

the top of the escarpment in Section 25, T14N, R14W, Seward

Meridian.

A subsurface soils investigation performed by the USGS (Yehle, et

al , 1980) indicated the strength index test on unconfined compres-

3-60

sive strengths on a drill hole made in the Capps Field ranged from

0.20 to 4.20 MPa (29 to 609 psi) with an average of 1.74 MPa (252

psi). The test hole material ranged from soft soil to soft rock.

During field reconnaisance by DOWL Engineers (1981), the observable

surface outcrops in landslide areas are low-grade sedimentary rock

which is slightly to poorly cemented and friable. It appears to break

down readily in water and is clearly affected by freeze-thaw cycles

when surface water is present.

Along the Chuitna River and its tributaries, large and small slides

are easily observed. Many slides are due to oversteepening of high­

cut banks by stream action and surface runoff. Resistive beds of

coal jut out from the face of the carved river banks. When enough

underlying soil is eroded below a resistive bed, large blocks of coal

fall into the stream channels.

Volcanos

Five active volcanos are found in the Cook Inlet region. The most

recent eruptions were by Mr. Spurr in 1953 and Mt. Augustine in

1976. Mt. Spurr is located about 40 miles from the proposed plant

site near the Capps Glacier. Mt. Augustine, located in south Cook

Inlet near Kamishak Bay, is considered potentially explosively erup­

tive and is under observation by the USGS. The USGS should be

able to provide warning if activity becomes imminent.

Volcanic deposits of 1 to 2 feet of ash from numerous eruptions were

found in the vicinity of the proposed plant site, and these deposits

are being mapped to determine historical volcanic activity in the

region. The most recent ash fall at the proposed plant site occurred

following the eruption of Mt. Augustine in 1976.

The volcanics in the Beluga area are Miocene or younger in age.

The Capps upland is covered by a reported 0 to 100-foot thick cap of

3-61

C=

glacial till which is made up of silts, sands, gravel, cobbles and,

boulders. Most of the till is derived from extrusive and intrusive

volcanics.

Many ash falls (nu 'ees ardentes) have occurred. The eruption of

Katmai, in 1912, 240 miles south of Beluga, produced an ash and

sand flow of nu 'ee ardente origin which formed sandy tuff 100 or

more feet thick over 53 square miles. One such ash fall also covered

an observable area of six miles, and likely much more, in the Beluga

area. Flora prints of plant leaves are easily observed at the base of

the ash fall. The ash fall has been described as a lappilli (composed

of volcanic ejecta 4mm-32mm in diameter). Lappilli was observed,

during field studies by DOWL Engineers, near the uplands at the

2,400-foot elevation and on banks of the Chuitna near Botts Creek at

elevations of 750 to 800 feet. In both areas, the volcanic ash tuff

overlies a coal bed ranging in thickness from a few feet to- 7± feet

where easily observed.

Tsunamis

Tsunamis are great sea waves most often caused by rapid vertical

displacement of the ocean floor or submarine landslides. Two tsun­

amis have been recorded in lower Cook Inlet since 1883. Mt.

Augustine errupted in 1883 and produced a 25-foot-high wave at

English Bay; and the 1964 Prince William Sound earthquake produced

a 4-foot-wave at Seldovia. These locations are 70 to 90 miles from

the proposed site.

The restricted opening of Cook Inlet provides some degree of protec­

tion from incident tsunamis generated along the potential source areas

along the Pacific Rim. In 1964, the Prince William Sound earthquake

produced only a few feet of tidal disturbance inside Cook Inlet, al­

though coastal areas such as Seldovia recorded some tsunami damage.

Tsunamis generated in Cook Inlet may have severe impacts on coastal

structures, but the plant site is at sufficiently high elevation to

preclude tsunami damage.

3-62

(~

Permafrost

No permafrost was detected in any of the borings. In addition, sur­

face reconnaissance indicates little evidence of shallow permafrost. It

is also unlikely that this south-facing area has deep permafrost.

Sample temperatures were at or above 42°F, but some sample heat

gain is usually associated with auger drilling. The upland areas may

have some permafrost present but this is not confirmed.

Additional Geologic. Hazards

Slope stability in the plant and town site areas is good, but slopes in

the vicinity of the proposed construction dock are generally unstable

and may require stabilization.

Other hazards were noted by Schmoll (USGS, 1980) in his preliminary

report regarding the surficial geology of the area. Gravitational

spreading of surficial deposits which produced graben-like features

was noted along the Nikolai escarpment. However, this area is about

10 miles northwest of the proposed plant in an area of much steeper

escarpments than found in the areas of the plant and town sites.

Volcanic clasts were observed within a few miles of the plant site and

may indicate an unsuspected level of volcanic activity, or they may

represent glacially transported volcanic debris. Additional investiga­

tion to determine the origin of this material should be considered.

The mountains north and west of the project site are extensively gla­

ciated, among them being the Capps and Triumvirate glaciers. The

glaciers present no foreseeable hazard to the higher portions of

Nikolai margin, but the Triumvirate Glacier forms a dam creating

Strandline Lake which then empties into Beluga River. Glacier dams

can be unstable and have caused numerous floods, but a flood of this

nature would not affect the proposed plant, town, or dock sites.

3-63

c: 0 -t\1 Cl -c UJ ~

> c:

0 UJ ..... >o Q)

> .. ~

UJ

BELUGA FIELD PROGRAM 1981

upper Chuitna R ive r ar e a

vicinity Congahbuna Lake

upper C a pps - exposed coal seam

BEL U GA FIELD PROGRAM 198 1

4.0 HYDROLOGY

GROUNDWATER

Introduction

The availability of industrial quantities of groundwater in the study

area is dependent on the existence of fairly extensive deposits of

highly permeable granular materials which contact areas of high re­

charge capacity. The Chuitna River, although currently cutting its

way through consolidated formations, may have some abandoned

channel areas in which sufficient depths of gravels have been de­

posited so that a shallow groundwater or induced filtration situation

may be developed. However, throughout the upland area from

Nikolai Creek to the Beluga Lowlands the unconsolidated formations

consist predominantly of impermeable glacial till with scattered and

isolated deposits of sand -- ranging from silty sand to gravelly sand.

As a result, production of previously drilled wells in the general area

ranges from 0 to 50 gallons per minute (gpm). The only well of 500

gpm or more we know of in the Beluga area is at the Chugach Elec­

tric Association power plant. The vicinity of the Chakachatna River

appears favorable for high groundwater production, perhaps 1, 000

gpm or greater, due to extensive gravel deposits and sizable rivers

to provide recharge. However, no production wells are known in

that area. Information obtained by others drilling seismic shot holes

in the Nikolai Creek flats area indicated that the Nikolai Creek area

is underlain by gravel which might provide a substantial water

source. A supply adequate for the proposed new town development

may be available along the toe of the escarpment near the town site.

It is against this background that the water exploration program for

this project was developed. The program included drilling two test

wells, Test Well #1 in the Nikolai Creek Flats area and Test Well #2

within the proposed methanol plant site (Figure 4.1). An observation

well, Well #3, was drilled near Test Well #1.

4-1

C'

FIGURE 4.1

MACARTHUR FLATS

0

EXPLANATION

UPLAND BOUNDARY- AREA OF GENERALLY SHALLOW- MINIMAL PRODUCTION WELLS

LOCATION OF OTHER WELLS (see FIG. 4. 3)

DOWL/ATL TEST WELLS, 1981 (depth)

DOWL/ATL OBSERVATION WELLS,I981

OBSERVATION WELLS, BHW,I980

BELUGA LOWLANDS B£WGA

WELL LOCATIONS, GRANITE POINT AREA

Available Supply

0 Nikolai Creek Flats

The vicinity of Nikolai Creek Flats appeared to be the most prom­

ising for development of high production wells within a reasonable

distance of the proposed plant site. It did not appear that in­

dustrial quantities of groundwater could be obtained within a

2±-mile radius of the proposed plant site. However, it was felt

that if an extensive shallow gravel' or coarse sand aquifer existed

in the Nikolai flats area, the creek would provide sufficient re­

charge to insure the long-term production of :the formation. Since

road construction would have been necessary to gain access to the

flats nearer to the proposed town or plant sites, it was decided to

drill the test well near the logging road bridge approximately six

miles upstream from the plant site. It was felt that specific test

information from this site could be combined with other generalized

sources of subsurface information of the area to provide a rea­

sonable indication of the groundwater potential in similar

areas of the Nikolai flats nearer the proposed town and plant

sites.

The primary objective of drilling in this area was to determine if

relatively shallow aquifers exist which are recharged by Nikolai

Creek; the drilling was to be shallow, less than 200 feet deep.

Two holes were drilled, Test Well #1 and Well #3, which demon­

strated that, at least in the area of the bridge, no such aquifer

exists (Table 4.1). This verifies the surficial geologic mapping

of the area done by USGS. The drilling did determine, however,

that a series of predominantly fine-grain materials which are

under considerable artesian pressure underlie the general area.

These formations begin at a depth of 55± feet below the surface

and extend beyond the maximum drilling depth of 217 feet.

Although artesian leaks around the casings of Wells #1 and #3

were measured at 75 and 150 gpm, respectively, it was found that

4-3

Table 4.1

TEST WELL ltl

SUMMARY OF DRILLER'S LOG

Drilled 5/16/81 to 5/19/81 - By M-W Drilling

Deeth ~Feet)

0.0 - 0.5

0.5 - 24.0

24.0 - 40.0

40.0 - 48.0

48.0 - 133.0

133.0 - 172.0

172.0 - 213.0

213.0 - 217.5

Descrietion

Fill

Silty Gravel with Water

Gravelly Silt - Dry

Silty Gravel - Damp

Silty Sand with Water - Flowing

Sandy Clay with Water - Flowing

Gravelly Sand with Water - Flowing

Silty Sand with Water - Flowing

Screen was installed from 182 to 200 feet and the well was surged 22\ hours. The water would not clean up. The well was pumped one-hal.f hour at 180z gpm with a drawdown to 150 feet. The esti­mated sustained well capacity at this depth interval is about lOOz gpm. There was an artesian leak around the casing at 75± gpm which was unaffected by pumping from the screened interval. The leak was sealed by grouting. The static water level was calculated at 79 feet above the surface.

4-4

('

0

the formations were too fine and variable in gradation to be

tapped by a naturally developed well. Although a screen was set

in Well #1, a period of surging did not wash the fines from the

formation sufficiently to perform a meaningful pump test.

It is possible that wells of 200 to 300 gpm capacity could be

developed in these formations using an artificially gravel-packed

construction method. The water in these formations is of very

good quality (Figure 4. 2) and has a static level 79 feet above the

surface at Well #1.

Plant Site

Because of the poor water production history and relatively shal­

low depths to bedrock reported in the upland area, Test Well #2

to be drilled on the plant site was intended primarily to prove

firsthand that significant quantities are not available in that area.

The well also could verify the shallow depth to bedrock. In fact,

Test Well #2 was drilled to a depth of 405 feet without encounter­

ing bedrock (Table 4.2). This is deeper than bedrock was ex­

pected based on the information reported by Magoon, Adkinson

and Egbert (USGS 1978) (Figure 4.3).

Test Well #2 was located near the Congahbuna drainage so that

any shallow aquifers which may be associated with that drainage

could be detected, as well as any deeper formations. The well did

demonstrate that approximately 15 feet of good water-bearing for­

mation exists at the depth of 40 to 55 feet. However, it is ex­

pected that the production potential of that aquifer would be rela­

tively insignificant, being limited by the availability of excess

water in the Congahbuna drainage system. This water-bearing

formation was not tested. From 328 to 395 feet, a water-bearing

silty gravelly sand was encountered which has a static water level

(artesian pressure) approximately 25 feet above the surface. A

screen was installed in that formation and a 24-hour pump test

4-5

CHEMICAL & GEOLOGICAL LABORATORIES OF ALASKA, INC.

TELEPHONE (9071·279-4014 ANCHORAGE INDUSTRIAL CENTER , 27 4·3364 5633 B StrHt

ANALYTICAL REPORT

r.USTOHER DOWL Engineers SA.'1PL E LOCATION : .--~Al'-'="a'='s"""ka~--'------­FOR LAB USE ONLY

!lATE COLLECTED 6-9-81 TIME COLLECTED: 10:00 RECVD.BY lM> LAB I 7818-2

•u BY SOURCE Well #2 :.~··PLED ------- ---~-==~--------DATE R ECE IV EO _ _..::G:....-.:::..10=---=8~1 __ _

[1 EMAAKS __ __:Be=1:.::ugaz:.::....:.:~'E:=.th=an:.:o=.:1:......=6_" _::P:...:i:o=pe:=.!._, ..::F.=.i:::.1 te=·:.:.red=-.=.S.=.anp:=1::::e ___ _ DATE COMPLETED· 6-19-81

/}c /e.r'~' E;4u A-~~'-"1~'-"·~---- DATE REPORTED_--=..6--=1=-9--=8=1:-----~ B£~ .Le.fd!d"' / <

SIGNED ~~

mg/1

[]Ag,Silver

mg/1

---~~~-- []P ,Phosphorous __ __;o::..::•c:1c:...7 __ <0.05 []Cyanide _______ __

(]Al,Aluminum <0.05 __ --=:..::..:.=:....___ (] Pb, Lead ____ ___.:;<O::..::·c::co.:c5 __ (]Su 1 fa te ______ -=2-'-'. 3=---

[)As,Arsenic <0.10 ---=-:.c"'-"----- []Pt,Platinum <0.05 []Phenol _______ _

[)Au,Gold <0.05 ____ _;;_;_=---- []Sb,Antimony <0.10 []Total Dissolved __ =-:83"----Solids

[)B, Boron <0.05 _____ -=.:c.:=. ____ (]Se,Selenium <0.10 [)Total Volatile ____ _ Solids

[] Ba, Barium <O.o5. ---"""'-"-~--- (]Si ,Silicon 12 []Suspended _______ _ Solids

[)Bi ,Bismuth <0.05 ----=-=--=----- []Sn,Tin ______ <:.:o.O.:.c.0:..::5 __ []Volatile Sus-_____ _

[)Ca ,Calcium 11 pended Sol ids

___ ___,:.:::.._ ____ (]Sr,Strontium 0.08 []Hardness as ____ __,4~1 __

[)Cd,Cadmium <0.01 CaC(h

------'::0:..:..=---- []Ti, Titanium <0.05 []Alkafinity as __ ___,6:...:4 __

[)Co, Coba 1 t <0.05 CaC03

-----"'-"-"-'!..:<'----- (]W,Tungsten <1 (] _____________ _

[]Cr,Chromium <0.05 ----"'--"''-'-"--'"----- (]V ,Vanadium <0.05 [] _____________ _

[]Cu,Copper <0,05 ----"'-":.ul.oo'---- []Zn ,Zinc <0 as EJ------ _____ _

()Fe,Iron <0.05 ______ ..:.::..:..==.... ___ (]Zr,Zirconium <0.05 () _____________ _

* * * .. * .. ()Hg ,l-lercury <0.10 ---~=---- (]krnonia _______ __ []mmhos Conductivity __ =-.14:...:.0_

[JK,Potassium 1 Nitrogen-N

----=~---- [] Kjeda hl _________ [)pH Units _______ __,_7_,_,.5

(]Mg,Magnesium Nitrogen-N

3.4 ___ .....::..:'-'------ []N i tra te-N _____ <_:::0,_, • ..::1___ []Turbidity NTlJ _____ _

(]Mn ,11anganese <0.05 __ __:.::._:....:..::. ___ ~ [] N itr i te-N_________ [)Co 1 or Units ------=5'---

[]Ho ,Molybdenum <0.05 -----'""-'--'"-"'------ (]Phosphorus _________ (]T .Col iform/lOQ-nl _____ _

[]Na,Sodium ( D-tho) -P

12 -----=---- []Chloride ------=-3 __ _ [J---------[)lli ,Nickel __ <0.05 --=-:==----- [)Fluoride _____ ...o<"'-0.,_,1,_,0 __ [J ______________ _

I FIGURE 4.2 GROUNDWATER QUALITY

C'

Table 4.2

TEST WELL #2

SUMMARY OF DRILLER'S LOG

Drilled 5/20/81 to 5/29/81 • By M-W Drilling

Depth (Feet)

0.0 - 4.0

4.0 - 20.0

20.0 - 40.0

40.0 - 54.5

54.5 - 85.0

85.0 - 92.0

92.0 - 293.0

293.0 - 297.0

297.0 - 328.0

328.0 - 395.0

395.0 - 405.0

Description

Fill

Silty Gravel

Silty Gravel - Damp

Lose Gravel with Water - Blows 30gpm

Gravelly Clay - "Hardpan"

Silty, Sandy Gravel

Gravelly Clay with Some Boulders

Silty Coarse Sand with Water • Blows 3 gpm @ 293

Gravelly Clay

Silty Gravelly Sand with Water

Clay

Screen was installed from 355 to 385 feet and the well was surged for 21 hours, which was adequate to clean up the well. A 24-hour pump test at 149 gpm caused drawdown to 102± feet. The well was grouted at the surface (there was no artesian leak). The static level was calculated at 25.t feet above the surface.

4-7

FIGURE 4.3

MACARTHUR FLATS

EXPLANATION

..l:..J. UPLAND BOUNDARY- area of generally shallow minimal production wells

WELL DEPTH WHERE KNOWN

e50T WELL DEPTH TO TERTIARY

OUTCROP OF BELUGA FM

OUTCROP OF TYONEK FM

GRANITE POINT AREA

BEDROCK

4

BEDROCK OUTCROPS AND DEPTH TO BEDROCK IN WELLS

0

was performed to determine the production potential. The test

showed that the transmissivity (T) of the aquifer in the area is

quite low (2,380 gallons per day per foot [gpd/ft]) (Figure 4.4).

After 8 hours of pumping, the test also indicated that the cone

of influence encountered a major impermeable boundary, reducing

the effective T to about 840 gpd/ft. This formation could be used

for minor intermittent demands of 100 gpm or less. It is unlikely

that this water-bearing formation is extensive under the plant site

location.

Existing Uses

Small domestic wells serve the Union Oil Company and ARCO

facilities at Granite Point; the Kodiak Lumber Mill camp near the

North Foreland, and the Chugach Electric Association facility at

Beluga. None of these wells is near enough the proposed project

to be influenced by withdrawals there. Other than these wells,

the groundwater resources in the Beluga region are virtually

untapped.

SURFACE WATER

Existing Sources

0 Lakes

Numerous shallow lakes dot the landscape between the Beluga

River to the north and the Chakachatna River to the south

(Figure 4.5). Of these, the largest is Congahbuna Lake located

just north of the proposed plant site. Some consideration was

given to the possible use of Congahbuna as a source of cooling

water. A summary of the known information about the lakes of

the Beluga region is contained in Table 4. 3. Additional informa­

tion on many of these lakes is being gathered as part of an on­

going field program.

4-9

(', \, '

t=: w w lL -(.!)

z ~ u a.. g

~ w m .....1 LLJ > LLJ .....1

a:: w ~ :s:

I FIGURE 4.41

0 j5

TIME SINCE PUMPING BEGAN (MINUTES) b g Q g 1 0 o ,9 Q I I 1 I I I II I I I I I

Q 1 II I I I I 1 I It I I I II

30~--~~~~~~~~~~~~~~·+'~1 ----~~~ ~! 4!~i~:Mlri:+1 ----~·--~: ~:ri:-r' ~::H1+1 ----+'--+'-+'~·rr1 +1 TH~:~

1\ [\

90~--~~~~~~+---~--~~~~+----~---~-r1-r..~~H.+----+--+-~rr++H

'.[\-

~t.-··· IQOL----L~~~~~l_ __ _L __ L_~~~~--~--~~~~~·~·:.~~--~~~~ ..

BELUGA METHANOL PROJECT \ PUMPING RATE • 149gpm DATE• 6-29-6-30-81

T= 264Q ~s

T.= 264XI49 : I 16.5

2,384gpcl/sf

t= 261X 119 : l 47

837gpd,/sf

PUMP TEST OF WELL #2 I

0 (~ I

Table 4.3

LAKES OF THE BELUGA REGION

Chemical & Ph}::sical Characteristics Area Area Temp DO CaCO Sec chi Test

Name Localion (mi. 2) (Acres) Dale ( oc) _e!:!_ ~ mg/.e depth Netting Results Other

Ashley Lake 61°81 1 "15"1°11+1 00.07 44.8

Beluga Lake 61°24'1 151°36' 16.97 101860.8

Bishop Lal(e 61°"19'1 151°25' 00.18 115.2 6/12/75 11 6.7 17 17.1 12.5' Rainbow 3 Dollies 1

Bunl(a Lake 61°4 11 151 O·JO+I 06.06 38.4

Chuilbuna Lake 61"7'1 "15"1°91 00.18 115.2

Cindy Lake 6"1"8'1 151 °12' 00.06 38.4

Congahbuna Lake 61°4 11 151°25' 00.40 256.0 7/18/81 15.2 6.2 10.0

Denslow Lake 61"14'1 151°21' 00.03 19.2

El"in Lal(e 61°13'1 "151 °"19' 00.07 44.8 7 /"18/81 15.4 6.4 9.4 Depth 3. 2 I' eel

Fell Lake 61 °16' 1 151 °18' 00.20 128.0

Guy Lake 61 °10+'1 151°171 00.05 32.0

Jean Lake 61°17'1 "151 °21' 00.08 51.2

l<aldachbuna Lake 6"1°3 11 15"1 °14' 00.21 134.4

Lower Beluga Lake 61°21 11 "151 °2"1' 01.88 11203.2

Mad Lake 61°7+'1 151°34' 00.04 25.6

Area Name Location (mi. 2 )

Priscilla Lake 61 °20', 15"1 °27' 00.09

Rober·La Lake 6"1°5', 15'1"31' 00.12

Scott Lake 61"7' 1 151 ""12+' 00.05

Second Lake 6"1"5', 15'1"9+' 00.07

Theresa Lake 61 °10', '151°17 1 00.05

Tllir·d Lake 6'1°5 1, '15'1 °10+' 00.03

Tukallah Lake 61°8 1, 151"7' 00.14

Viapan Lal<e 6"1°7 1, '151°6 1 00.30

Vicky Lal<e 6'1"3', 151 "24' 00.13

Made lal<e 00.06

Table 4.3 Continued

LAKES OF THE BELUGA REGION

Chemical & Physical Characlerislics Area Temp DO CaCO Sec chi

(Acres) Date (OC) Jill_ ....!!!9L!_ mQ/J! depth

57.6

76.8 7/18/81 15.1 6.0 9.0

32.0

44.8

32.0

19.2

89.6

192.0

83.2 7/18/81 15.8 6.2 9.2

38.4

/~, I )

Test Netlin9 Results Olher

Depth 3. 0 feel

Deplh 5.5 feel

CAPPS GLACIER

IFIGURE 4.5 I

BELUGA

tCARLSON LAKE

4ltMARIE LAKE

COOK INLET

. LAKES OF BELUGA AREA I

0 Streams and Rivers

The most important properties of surface water are amount, chem­

ical quality, suspended sediment content, and temperature. With

few exceptions, data on surface water in the region is generally

sparse.

While it is the Chuitna River that most likely would be directly

affected by the project, the total project area includes several

drainage systems including the Beluga, Chuitna and Nikolai. As

part of the 1980-81 field program, staff gauges have been installed

at numerous locations (Figure 4. 6) and various measurements have

been taken of discharge, water chemistry, and sediment content.

Selected data on stream and river systems is shown in Table 4.4;

stream flow data is shown in Table 4.5; selected discharge mea­

surements are shown in Table 4.6; summary data on suspended

solids is shown in Table 4. 7; and selected water quality data is

shown in Tables 4.8 through 4.11.

The current field program will permit the generation of rating

curves for the various staff gauge locations and provide a first

look at overall contributions of tributaries and groundwater flows

to major stream courses. An example of such a rating curve for

one stream is shown in Figure 4. 7. Precipitation data and addi­

tional discharge measurements would be required before the

hydrology of the region can be more accurately described.

Additionally, two sites (Nikolai Creek and Upper Chuit Creek) are

being monitored for stream temperature and flows on an experi­

mental basis using portable data recorders linked to temperature

and pressure probes. If successful, this program expanded

throughout the area of interest would permit a more detailed

assessment of the hydrologic balance since simultaneous measure­

ments throughout each of the drainage areas could be available.

An example of the type of data being recovered from this program

is shown in Figure 4.8.

4-14

/ . ./

.. • / ( '· I

,. I

'· j I \j /

/

y

\

[]

jj

v~'l-Q.conu.-.

()a...,,u•

() ....... , ...

Q 0 a

[~_]

) ' j

LEGEND __.STAFF GAUGE

·- OTHER STATIONS {S USGS

STAFF GAUGE

LOCATIONS-

BELUGA REGION

FIGURE 4.6

r;,

NAM=.E ___ _

BELUGA DRAINAGE Beluga River Chichantna River Capps Cr·eek North Fork Capps Crk South Fork Capps Crk Chicllantna Creek Bishop Creel< Nonh Fori< Bishop Crk South For·k Bishop Crk Judy Cr·eel< Sue's Creek Scarp Creek Upper Scarp Creek Wobnair· Creek

CHUITNA DRAINAGE Chuitna River Lone Cr·eek East Fork Lone Creek Middle Fori< Lone Crk Upper Lone Creek Middle Creek Culvert Creek Upper· Middle Creel< Stl'ip Cr·eek Brush Creek BHW Creel< Bass Cr·eek Hunt Cr·eek Wilson Cr·eek Cole Cr·eek

Approximate Drainage Area

( sg. mi.)

Table 4.4

SELECTED DATA ON STREAM AND RIVER SYSTEMS

Approximate Length (mi.)

26.8 13.5 3.5 4.7 5.4 6.3 9.1 5.0 3.0 5.5 7.6 7.6 7.7 4.2

24.5 4.6 2.2 3.7 6.6 1.0 3.6 7.4 1.4 1.7 2.2 7.2 4.1 2.1 5.6

Estimated Annual Runoff

( 1000 acr-e fl. )

Estimated Flow

(cu. fl./sec.)

Approximate Slope

ut. /mi. )

9 23 71

410 335 167 38

190 275 137 128

79 156

83

57 43 34 89 68 75 35 51 n

162 193 125 146 298 134

Point of Discharge

Cook Inlet Beluga River Chichantna River Capps Creek Capps Creek Cl1ichantna River Beluga River Bishop Creek Bishop Creek Sue's Creek Bishop Creek Bishop Creel< Wobnair· Creek Scar·p Creek

Cook Inlet Chuitna River Lone Creel< Lone Creek Lone Creek Chuitna River Middle Creek Middle Cr·eek Upper Middle Cr-1< Upper Middle Crk Chuitna River BHW Creek Bass Creel< BHW Creek Chuitna River·

Noles

I~ i

j

NAME

.::HlJITNA DRAINAGE Cont. Chuit Creek Camp Cr·eek East Fork Chuit Creek Upper Cl1uit Creek Boll's Creek Frank Cr·eek llppe•· Chui tna River John's Creek Benno's C1·eek Wolvel"ine For·k

t411\0LAI DRAINAGE Nil<olai Cr·eek Sledalna Creek Pil Creel< Jo's c,·eel<

C•T HER DRAINAGES Old Tyonek Creek Congahbuna Creel< Muskr·at Cr·eek Tyonel< Creek Indian C1·eek lhree Mile Creek S. Fo1·k Th1·ee Mile Cr·k

Approximate Drainage Area

(sq. mi.)

Table 4. 4 Conlinued

SELECTED DATA ON STI<EAM AND RIVER SYSTEMS

Approximate Length (mi.)

8.6 4.0 6.1 4.5 1.2 3.6 6.9 1.9 3.6 6.1

27.9 4.6 4.7 5.0

9.9 4.6

.8 12.9 1.4 7.7 8.8

Estimated Annual Runoff

("I 000 acre fl. )

Estimated Flow

(cu. fl./sec.)

Approximate Slope

(ft./mi. )

94 181 "107 22

375 139 29

263 194

98

97 115 287 280

81 69 94 54

52 34

,I\ ', ~

Point of Discharge Notes

Chuitna River E. Fork Chuit Cr·k Chuit Creek Chuit Creek Chuitna River· Chuitna River Chuitna River Upper Chuitna Riv Upper· Chuitna Riv Upper Chui tna Riv

Cook Inlet Nikolai Creek Nikolai Creek Nikolai Creek

Cook Inlet Old Tyonek Creek Congabuna Creek Cook Inlet Cook Inlet Cook Inlet Thr·ee Mile Creek

(~ J ' ' /

7A/g-3

Table 4.5

STREAM FLOW DATA (SELECTED STATIONS) Point Discharge Measurement, Cubic Feet per Second (cfs)

Station No. Stream Gage Location latitude Longitude ~ ~ June ~ ~ ~ Oct.

North Capps 61 °19'05" 151°40'54" 17.3 90.9

2 Capps Creek 61°19'00" 151 °40'43" 16.4 134.7

3 Chuitna River 61°12'00" 151°39'15" 64.0 375.9 140.82 below Wolverine Fork

4 Wolverine Fork 61 °12'05" 151 °39'17" 14.8 99.3 27.25

5 Ctluilna River 61°12'03" 151 °39'28" 45.1 272.5 100.8"1 above Wolverine Fork

6 Congahbuna Creek 61°02'43" 151°20'27" 10.6 17.2 6.9 32.0 above Old Tyonek Creek

7 Old Tyonek Creek 61°02'48" 151°20'27" 21.7 70.4 15.1 79.15 above Congahbuna Cr·eek

8 Old Tyonel~ Creek 61°02'43" 151°20'21 11 33.1 88.9 17.5 "121.57 below Congahbuna Creek

9 Congahbuna Cr·eek, 61 °03'18" 151 °26'53 11 5.8 13. "I 3.8 1 9.97 below Congahbuna lake 2.85

10 SLedalna Creek at Culvert 61°04'08" 151 °30'59" 5.0 16.7 2.9 28.21

11 Nikolai Creek at Br·idge 61°05'05" 151 °35'54" 152.8 136.0 245.5 1

204.7 5

12 Upper Clluil Cr·eek 6"1 °12'44" 151°33154 11 27.3 155.3 91.17

:)

Table 4.5 Conlinued

STREAM FLOW DATA (SELECTED STATIONS) Point Discharge Measurement, Cubic Feet per Second (cfs)

Station No. Stream Gage Location Latitude Lon9ilude Nov. ~ June ~ ~ ~ _Q£!:_,_

13 Clluit Cr·eek Mouth 61 °09'18" 151°30''11" 42.0 56.4 271.9 58.40

14 Chuilna River· 61 °09'17" 151 °30'06" 116.2 163.1 209.87 below Chuit Creek

15 Clluilria River 61 °09'16" 151 °30'1"1" 72.8 100.0 500.0 167.39 above Chuil Creek (est.) (est. )

"16 BHW Creek Mouth 61°09'00" 151°26'40" 76.5 24.2 24.28

"17 Lower Lone Cr·eek 6"1 °07'5"1" 151 °17'57" 275.0 26.8 (est.)

18 Upper· Lone Creek 61°11'15" 151°18'34" 80.2 12.5 12.99

19 Cole Creek Mouth 61°08'46" 151°29'16" 58.7 9.6 59.46

20 Pit Creek 61°07'58" 151°42'25" 43.3 12.9 8.75

21 Nikolai Creek 61 °07'51 II 151 °42'30" 97.2 45.6 23.35 above Pit Creek

22 Nikolai Creek 61°07'5"1" "151 °42'17" 136.9 57.4 28.94 below Pit Creek

23 Jo's Cr·eet( 61 °08'"15" 151 °43'33" 19.9 30.3 8.32

24 Nikolai Cr·eek 61 °08'15" "151 °43'40" 73."1 "lll.O 15.99 Above Jo's Creek

25 Br·ush Cr·eel( 61°11'32" 151 °22'45" 2.5 4.15

Station No. Str·eam Gage Location

26 Str·ip Creek

27 Upper Middle Cr·eek

28 East Fork Chuil above Camp Creek

29 Camp Creek

30 East Fork Chuil below Camp Creek

31 Middle Creek near Lease Boundary

32 Scarp Cr·eek Mouth

33 Wobnair Creek

34 Scarp Creek above Wobnair Creek

35 Scar·p Creek below Wobnair Creek

36 Fran!( Creek

37 Bolls Cr·eek

(""") \ /

Table 4.5 Continued

STREAM FLOW DATA (SELECTED STATIONS) Point Discharge Measurement, Cubic Feet per Second (cfs)

Latitude !:ongitude ~ ~ June

61°11'28" '151 °22'41" 1.5

61°11'24" 15'1°22'46" 4.2

61°'10'53" 151°30'29" 68.8

61 O·IQI49 11 '15'1°30'22" 11.8

61 "10'45" 151 °30'25" 78.3

61 °09'27" 151°22'35" 11.3

61 °19'00" 151 "'19'3311 46.8

61°'16'03" 151°19'0'1 11 4.8

61 °16'03" 151 °19'12" 31.2

61 °16'07" 151 °19'06" 38.2

61°11'33" 151°38'55"

6'1°'1'1'10" 15'1°35'18"

~ ~ ~ Oct.

1.74

5.62

15.57

5.82

19.61

'16.43

106.18

18.42

66.33

86.97

67.63

5.7

Station No. Descr-iption

Chuilna River (USGS gauge near Tyonek -160 fl. above sea level)

Water Year or Date

1979

From USGS "1980: Period of r·ecord from October 1975.

()

Table 4.6

SELECTED DISCHARGE DATA Cubic Feet per Second (cfs)

Drainage Area (sg. mi.)

131

Total Discharge

(cfs)

147716

Mean Discharge

(cfs)

405

Maximum Discharge

(cfs)

2370

Minimum Discharge

(cfs)

45

Comment

('\ \

Station No. Descr·i~lion Jan.

Nor.Lh Capps Creel<

2 Capps Creek

3 Clluitna River below Wolverine Fork

4 Wolverine Fork

5 Chuitna River above Wolvel'ine For·k

6 Congahbuna Creek above Old Tyonek Creek

7 Old Tyonek Creel< above Congahbuna Cr·eek

8 Old Tyonek Creek below Congahbuna Creek

9 Congahbuna Creek below Congahbuna Lal<e

10 Stedatna Cr·eek @ Culvert

11 Nikolai Creek (d Br·idge

12 Upper· Chuit Creek

13 Chuil Creel< Mouth

SUMMARY

(""\ \ )

Table 4.7

DATA ON SUSPENDED SOLIDS

Point Sample, Single Day Observation (mg/£)

Feb. Mar. ~~ June :!.!:!!L ~ Sepl.

4'1.0

480.0

11.0 5.0

1.7 14.0 3.3

12.0 8.5

3.2 0.65 3.3

'19.0 2.1 6.3

18.0 2.2 7.3

4.0 8.5

8.4 1 . 1 2.2

19.0 5.9

8.2 2.2

3.6 '10.0

Oct. Nov.

2.5

1.0

21.3

8.4

4.7

1. 9

2.0

3.6

Dec. Notes

0 ' /

Station No. Description -------

14 Chuilna River· below Chuit Cr·eek

15 Chuitna River above

Chuit Cr·eel(

"16 BHW Creek Mouth

17 Lower Lone Creel(

13 Upper· Lone Creek

19 Cole Creek Mouth

20 Pil Creek

21 Nikolai Cr·eek above Pit Creek

22 Nikolai Cr-eek below Pil·Cr-eek

23 Jo's Creek

24 Ni kolia Creel( above Jo's Creek

25 Brush Cr·eek

26 Strip Cr-eek

()

Table 4. 7 Continued

SUMMARY DATA ON SUSPENDED SOLIDS

Point Sample, Single Day Observation (mg/.e)

"18.0

22.0 32.0

1.3 3.7

2.7 2.1

26.0 1.6 5.9

.42 "1.3

'180.0 7.5 2.6

(5/5) 36.0 11.0 8.0 (5/4) '150.0

(5/5) 36.0 13.0 9.8 (5/4) 130.0

25.0 9.4 3.0

49.0 11.0 9.6

3.1

72.0 no.o

Notes

("~ '1. j

Table 4. 7 Conlinued

SUMMARY OAT A ON SUSPENDED SOLIDS

Point Sample, Single Day Obser·valion (mg/.e)

Slalion No. ----·- ____ D=e=-sc::.:rc..:i~--- Jan. Feb. Mar. ~~June ~ ~Sept. Ocl. Nov. Dec.

27 Upper Middle Creek

28 East For'k Chuil above .8 Camp Cr·eek

29 Camp Creek 2.8 1.4

30 East For·k Chuil below 4.8 .5 Camp Creek

:.H Middle Creel{ near· 9.1 Lease Boundary

32 Scarp Creek Mouth 36.0 71.0

33 Wobnair Creek 7.7

34 Scar'p Creek. above 6.3 Wobnair Creek

35 Scarp Creek below 6.0

36 Frank Creek 8.7

37 Bolls Cr·eek 4.4

()

Noles

Station No. Descrietion

Capps Creek (South Fork)

() ' /

Table 4.8

SELECTED WATER QUALITY DATA, NOVEMBER "1980

Point Sample, Single Day Observation

Total Total Dissolved Suspended Solids Solids (mg/.e) (mg/.e)

27.0 35.0

Chuitna River (below Wolverine) 28.0 5.4

Total Dissolved Total

Iron Manganese eH (rng/.e) (rng/.e)

0.19 <0.05

ND <0.05

Station No. Description

Jo's Creel<

Cole's Creel<

Pit Creek

BHW Cr·eel<

Chuitna (below Chuit)

("\ .j

Table 4.9

SELECTED WATER QUALITY DATA, MAY 1981

Point Sample, Single Day Observation

Total Total Dissolved Suspended Solids Solids (mg/.1!) (mg/.1!)

50.0 19.0

2"1.0 16.0

44.0 46.0

29.0 6.6

33.0 25.0

Total Dissolved

Iron pH (mg/.1!)

0.38

1.10

0.46

"1.30

1.20

Total Manganese

(mg/.1!)

<0.05

0.08

<0.05

<0.05

<0.05

/\ . I

Station No. Description

Br·ush Creek

Stl'ip Creek

Scarp Creek

Beluga River

Table 4. ·10

SELECTED WATER QUALITY DATA JUNE, 1981

Point Sample, Single Day Observation

Total Total Dissolved Suspended Solids Solids (mg/.1!) (ma/.e)

63.0 2.2

94.0 45.0

54.0 7.3

72.0 34.0

Total Dissolved Total

lr'on Manganese pH (mg/.1!) (rna/ .e)

1.7 0.05

1.6 0.17

0.70 0.05

1. 9 0.06

n \.,'

Station No. Description

Chuilna Creek

Strip Creek

Brush Creek

(j

Table4.l1

SELECTED WATER QUALITY DATA JULY, 1981

Point Sample, Single Day Observation

Total Total Dissolved Suspended Solids Solids (mg/.e) (mg/£)

27.0 2.2

45.0 '15.0

51.0 7.0

pH

7.1

7.0

6.9

Total Dissolved

Iron (mg/£)

.28

.81

.77

Total Manganese

(mg/£)

<0.05

0.07

<0.05

20

- --

--------~ -~ --lLJ lLJ 10 IJ... - -~ ... J: ~

(!) 7

lLJ J: ,..

lLJ (!) ... ::::> <( (!)

3

2

I 10 20 30 40 50 so 70 eo 90 roo 200 300 400

STREAMFLOW (cfs)

FIGURE 4.7 RATING CURVE FOR NIKOLAI CREEK (BRIDGE)

~

~LUCA HYDROLOGY STUDY PAGE 1 P~EPA~ED BY DRY~EN ! LARUE FOR DOI.IL ENGINEERS 10-AUG-91

N!KOLAI Ckf.E~ STAf<T TIME 06/03/81 12!00 < HIK064 .POD)

PF<ESSUF<E:-INCliES H20 TEMPERATURE-DEC C STREAt-1 GUAGE FLOW l&ATE T I 11E AVG MIN MAX AVG HIN MAX READING (FT) ( c fs) ---·--·- ----- ---- ==-== ==== --- --- ::: --------

06/03/81 1~:oo 15.8 0.7 17.5 9.0 6.5 20.5 06/03/81 t6:oo H.-4 13.4 15.1 6.5 6.0 6.5 06/03/81 20!00 12.7 12.0 .13.4 6.0 6.() 6.0 06/03/81 2~ :.oo 11.6 11.3 12.0 6.0 6.0 6.0 13.75 205*

' {16/0~/81 04!00 11.6 11.3 12.0 6.0 6.0 6.0 06/N/81 oa:oo 12.3 12.0 12.7 6.0 6.0 6.0

I Ob/Oit/81 12!00 12.7 12.3 13.0 6.0 6.0 6.0 j 06/0V81 to:oo 11.6 11.0 12.3 6.5 6.0 6.5 c

06/04/31 20!00 10.6 9.9 11.0 6.5 6.5 6.5 06/01,/81 24!00 9.9 9.6 9.9 6.5 6.5 6.5

06/05/81 o~:oo 10.3 9.9 10,..6 6.0 6.0 6.5 C6/0S/81 oa:oo 11.0 10.3 11.3 6.0 6.0 6.0. 06/05/81 12!00 11.6 11.3 11.6 6.0 6.0 6.0 13.70 2 0 5 *' 06/05/81 16:00 11.0 10.3 11.3 6.0 6.0 6.5 06/05/81 20,!00 9.6 9.3 10.3 7.0 6.5 7 .o. ~6/05/81 24!00 9.3 8.9 9.3 7.0 7.0 7.0

* from rating curve ** measured

c - -

./

TYPICAL DATA RECOVERED FROM OATAPOO EXPERIMENT FIGURE 4.8 (NIKOLAI CREEK)

The existing field program is being expanded to include more in

situ water chemistry so that temperature, pH, dissolved oxygen,

and conductivity measurements will be made each time a discharge

measurement is taken or a stream gauge reading is made. A

typical chemical analysis for one station on one day is shown in

Figure 4.9.

Following the completion of the 1981 field program an evaluation of

the program will be made and a scope-of-work for 1982 will be

prepared. This scope-of-work will be coordinated with other field

programs including the collection of climatic data and the initial

analysis of groundwater with particular reference to the proposed

mine areas.

Water quality for existing wells has been compared to that of the

Chuitna River (Table 4. 12). Additionally, sediment samples of

numerous alluviums have been analyzed (Table 4.13).

Possible Use of Surface Waters

Congahbuna Lake has a surface area of some 256 acres with an aver­

age depth of some 6 feet (maximum depth of 16 feet). The size of

this lake suggests that some consideration could be given to using

the lake for a cooling pond to provide natural cooling of the thermal

discharge from the plant. The impact on existing fisheries would

obviously have to be carefully weighed. The lake would provide a

holding time of approximately 25 hours assuming a 330,000 gpm dis­

charge from the plant (lake volume is approximately 500 million gal­

lons). The plant discharge would be 95°F. Analysis indicates that

the surface area of the lake is not sufficient to provide cooling by

natural means comparable to that which can be achieved by cooling

towers.

Natural mechanisms that tend to dissipate heat from water surfaces

would cool the thermal discharges to only 81 °F in the colder winter

4-31

Cll£.\fiCAL & GEOLOGICAL LABORATORIES OF ALASKA, INC.

TELEPHONE 19071-279-4014 ANCHORAGE INDUSTRIAL CENTER 274·3364 5633 8 Suoet

ANALYTICAL REPORT

:usTOMER DOWL Enaineers SAHPLE LOCATION: Alas..t.-a!-------:---FOR LAB USE ONLY

lATE COLLECTED 5-5-81 TIME COLLECTED: 1315 H.rs. RECVD. BY G'f LAB 6 7432-

if.J-IPL ED BY _ __.::.EWI':..:..::.... ___ SOURCE_--=J-=c-=·~__cCr=-.:.eek=.:... _____ _ DATE RECEIVEO 5-6-81 __

lE11ARKS _ ___,D:e.:O~WL'-'-""-_E~n.gg.=i.,n'""e,_,e,_,r'""s'---------------- DATE COHPLET ED 5-18-81

Beluga Methanol Project DATE REPORTED 5-18-81

ATTN: rrd /,J 1 · ______ =..::.._ ___________ SIGNED ~......__.._,co....~

mg/1 ~

JAg, Sil ver ___ ...::<.:::.O:..:. 0~5:..__ __ [] P, Phos phorous __ -..::.<0:::.:-:...::0:.:::5 __

]Al , Al umi num __ ___,_o-=-=. 3::.::3:_ __ [) Pb, Lead _____ <...:.O::...:·:...::O:.::c5 __

]As ,Arsenic -------"<~0~. 0!.:1~-- (] Pt, Pl a t.i num ____ <.::..::0:..:·..::.0.::.5 __

·]Au, Go ld ____ <_o_._o_5 ___ [) Sb ,Ant immy ____ <_o_._1_o __

]B,Boron <0.05 [)Se,Selenium ____ <_:0:..:·..:.0.::.1 __

] Ba , Bar i um. ___ _:<:.::.O.:._. 0:.:5:...._ __ (]Si ,Sil icon ___ _.::c1:..:0 __ _

)Bi , Bi smuth, ___ <:..:.O.:._. 0:.:5 __ _ [) Sn, Ti n ______ <0--:...:·...::1:.::.0 __

)Ca,Calcium ___ ..::.2.c:..5=----- (]Sr,Strontium ___ <_O:c..; • ..c.o.::.s __

)Cd,Cadmium <0.01 (]Ti ,Titanium ____ <..:..:O:..:·...::O.::.S __

]Co,Cobalt ___ ....:<c:.O;:..;.o::..::s'--- (]W,Tungsten ____ <O=..::.·..::.o.::.s __

~il

(]Cyan ide ______ _

[)Sulfate _____ <1-=---

[]Phenol _______ _

[]Total Dissolved __ 5o __ Solids

[]Total So 1 ids

69

[)Suspended _____ 1_9 __ Solids

[]Volatile Sus-____ _ pended Sol ids

[]Hardness as ___ .-.::1:..:.7 __ Ca C O:t

[]Al kafinity as __ ....;1::..:8:..__ CaC03

[] Bezy'}lium <0.02

) Cr, Chromi um __ .::..·o.....u5·--- ( ]V, Van ad i um ___ ---"-<"'-0 ....,. 0....,5 () __________ _

]Cu ,Copper ___ _::<.:::_O.~O:=S ___ (]Zn, Zi nc _____ ..::.<0:::.:-:...::0:.::::5'---- ()------ -----

]fe,Iron 0.38 [)Zr,Zirconium ___ <....:0;..::.·..::.0=-5 __ (] __________ _

* * * * • ]Hg,Kercury <0.001 [)Amnonia _____ <..:..:O:..:·...::O~S __ []m:nhos Conductivity __ _

Nitrogen-N ]K,Potassium __ _::<:.=1 ____ []Organic 0.58 ()pH Units ______ _

Nitrogen-N ]11g,Magnesium __ _:2=..:·:...::3'------ (]Nitrate-N ____ ....:l::.::·.=ca __ (]Turbidity NTU 2.2

]11n,Manganese __ ....:<.::..0::...:.0:.:::5 ___ (]Nitrite-N <0.01 []Color Units 20

]l·lo ,Molybdenum _ ___,<"'-0_,_,.0..,5'----- (]Phosphorus <0. OS []T .Col iform/1 OCrnl ___ _ ( Cl-tho) -P

]fla,Sodium 2.4 []Chloride _____ <l-"""-'"'-"0'--- []--------

)Ni , N ic l:el ___ ..::.<0~-~0'-'!.5 ___ []Fluor ide _____ <;:.,0:..:..""10,___ (] ______________ _

FIGURE 4.9 TYPICAL SURFACE WATER QUALITY ANALYSIS

Dissolved

(' Species

"'=-'

Table 4.12

WATER QUAUTY COMPARISON

GROUNDWATER & CHUITNA RIVER

~Concentration

#1 #4 Parameter Well Pad Chuitna River

Bicarbonate 390.0 77.0

Calcium 89.0 6.4

Chloride 2.4 0.1

Copper 0.001 0.002

Fluoride 0.2 0.1

Iron 6.2 0.4

Lead 0 0.003

Magnesium 16.0 3.8

Manganese 1.1 0.09

Potassium 7.6 1.5

Silica 39.0 18.0

Sodium 13.0 15.0

Sulfate 2.2 2.9

Total Hardness 290.0 32.0

Corrosion Index* 0.02 0.05

mg/i)

#3 Beluga Station

112.0

8.9

6.3

0.004

0.2

1.5

0

4.6

0.06

2.7

54.0

27.0 8.9·

41.0

0.20

*me/.£ (C( .j. S042-), Greater than 0.1 indicates corrosive tendency.

me/! (Alkalinity as CaC0 3 )

4-33

(-'\ "-.:..:7'

1.

2.

3.

4.

s.

6.

7.

8.

9.

10.

11 .

12.

13.

14.

Table 4.13

SEDIMENT SAMPLES ANALYSES

Coarse Medium Fine Sand Sand Sand

% _L _L Alluvium, Chuitna River, below 2S 60 10 Wolverine Fork

Tertiary sediments in valley wall, 40 30 2S Chuitna River below Wolverine Fork

Alluvium, Chuit Creek, just above 40 50 7 Chuitna coal lease area

Tertiary sediments in valley wall, 20 20 so Chuit Creek just above lease area

Alluvium, Chuit Creek, near 65* 30** 4*** junction of Chuitna River

Alluvium, Capps Creek, near s so 40 junction of North Capps Creek

Sand dune, above Tertiary sediments 30 30 30 in valley wall, North Capps Creek near junction with Capps Creek

Alluvium, Stedatna Creek, in so 20 25 canyon below logging road

Unconsolidated deposits, valley 20 15 50 wall above Stedatna Creek in canyon

Alluvium, Congahbuna Creek, at 60 20 17 logging road crossing below lake

Alluvium, Congahbuna Creek, near 50 30 15 junction with Old Tyonek Creek

Alluvium, Old Tyonek Creek, near 40 25 32 junction with Congahbuna Creek

Alluvium, Nikolai Creek, at 55 30 14 logging road bridge

Beach sand, Nikolai Creek, at 10 80 logging road bridge

0.02 - 0.08 inches diameter Coarse Sand = Medium Sand =

Fine Sand = S i It =

0.01 - 0.02 inches diameter 0.0025 - 0.01 inches diameter less than 0.0025 inches diameter

Silt _L

5

s

3

10

5

10

5

15

3

5

3

10

* Mainly quartz, lesser feldspar and dark minerals, angular to subround ** Mainly quartz

*** Mainly quartz and feldspar

4-34

c months and to only 87°F in the colder winter months and to only 87°F

in the warmest months. Spray coolers to provide for additional cool­

ing do not appear to be cost effective when compared to the cooling

towers. To provide the same degree of cooling as can be achieved

by the proposed cooling towers would require a lake surface area of

approximately 1,000 acres, nearly four times the area of Congahbuna

Lake.

Further consideration should be given to developing a plant water

source from Nikolai Creek in the vicinity of its junction with Stedatna

Creek. An infiltration gallery in this location could conceivably pro­

vide adequate water to the plant without any impact on the upstream

fishery.

4-35

(

lone Creek

(

Chuitna River

BELUGA FIELD PROGRAM 1981

5.0 ECOSYSTEMS

Due to the paucity of specific information available on the Beluga

region, field investigations were undertaken in 1980 and 1981 to

begin developing adequate baseline data. The major thrust of the

field program was directed toward determining the presence or

absence of fish in the numerous small creeks and tributaries of the

region. Additional field observations of terrestrial and avian species

were undertaken and are continuing.

An understanding of the resources of the general area requires that

the study area extend well beyond the boundaries of the specific

proposed project, so the field program encompasses an area extending

from the Beluga River south to the Chakachatna River. The field

program initially was designed to concentrate on the entire project

area, and then as the season progressed more effort was placed on

those areas that would have the most potential for impacts from the

project, e.g. the mine areas and the transportation corridor. The

field parties often were accompanied by one or more persons from

state or federal resource agencies.

This chapter represents the synthesis of information derived from the

existing literature, numerous conversations and meetings with agency

personnel, and the preliminary results of the on-going field pro­

grams. No attempt has been made to narrow this synthesis to spec­

ific project-related activities due to the incompleteness of the field

investigations. However, a general overview of the resources of the

area is now possible and coupled with the continuing fall-winter

observations will provide the basis for more detailed future programs.

This general area is far from pristine. Years of oil and gas explor­

ation programs as well as logging activities and exploration related to

the determination of coal reserves have resulted in numerous ex­

amples of surface disturbance.

5-1

FRESHWATER AQUATIC ECOLOGY

Existing Habitats

0 ·Habitat Characterization

This section provides brief descriptions which characterize the

general nature of the stream reaches in each drainage area where

staff gauges and/or fish traps were located or where general field

observations were made. General locations are shown in Figure

5.1. In many cases, these observations are limited to or pertain

only to a single field excursion. This characterization of habitat

is an on-going program.

BELUGA DRAINAGE

Beluga River: This glacial fed river begins at Beluga Lake, a

7-mile-long, 3-mile-wide lake located east of the toe of the Trium­

virate Glacier and northeast of Capps Glacier. Both glaciers

originate on the slopes of Mount Torbert. From Beluga Lake,

elevation 246 feet, the river flows easterly nearly five miles before

entering Lower Beluga Lake (elevation 243 feet), a narrow 3/4-mile

wide lake nearly 2~ miles long. From this lower lake, the Beluga

continues its easterly flow across the broad lowlands another 22

miles to Cook Inlet cutting banks into the glacial tills ranging from

10 to 150 feet or more in depth. The system supports runs of

king, silver, sockeye and pink salmon. Dolly Varden also are

present, and lake trout are found in Beluga Lake.

Headwaters of Scarp Creek: This stream reach has a relatively

flat gradient meandering channel. The substrate is predominantly

cobbles and gravel with some sand, and the stream channel is

basically rectangular with vertical banks. Tall grass overhangs

stream banks and covers the floodplain. Stream top widths aver-

5-2

BEL 1/fiA LAKE

CAPPS GLACIER

COOK INLET

.. ,.-.-·....-·

LEGEND

• LOCATION SAMPLED BY

TRAPPING (AT LEAST

ONE PERIOD) 1981 FIELD

PROGRAM

A LOCATION SAMPLED BY

ANGLING (AT LEAST

ONE PERIOD) 1981 FIELD

PROGRAM

GENERAL LOCATION SAMPLED BY TRAPPING AND BY ANGLING (MAY-AUG 181)

FIGURE 5.1

c

aged from 2 to 3 feet, with average depth 0. 7 to 1 fopt. Juvenile

Dolly Varden and threespine sticklebacks were collected (1981).

Upper Scarp Creek: This reach is meandering with a moderate

gradient. Riffles comprise approximately 30% of the stream, runs

30%, and pools 40%. The channel is generally rectangular.

Stream top widths averaged 20 to 30 feet. Water depth in riffles

was about 0.5 feet, runs 1 foot, and pools ranged from 2 to 4

feet. A discharge of 38 cfs was recorded on June 4, and flow

probably ranges from 25 to 150 cfs during the ice-free season.

The substrate is gravel and small cobbles. Water is slightly peat

stained. Stream bank materials are primarily silty sand, and

banks are vertical and frequently undercut. Juvenile coho

salmon, Dolly Varden, and rainbow trout were collected. Chinook

and coho salmon fry were collected in this reach, as were adult

rainbow trout (1981). Benthos collected included snails, midges,

and blackfly, caddiesfly, and mayfly larvae.

Mouth of Scarp Creek: The stream in the lower reach is a mod­

erate gradient meandering run. Few riffles and pools were evi­

dent in the vicinity of the staff gauge. The· stream channel is

generally rectangular but is parabolic at bends where the stream

is cutting into steep banks 30 to 50 feet high. Stream banks are

composed of silty sands and clay. The bank is slumping at sev­

eral locations in the lower two miles. An active cut exposing clay

deposits is coloring the water in the lower 1~ miles of the stream.

Stream top widths were approximately 30 feet and depths averaged

1. 5 to 2 feet. A discharge of 47 cfs was measured on June 4,

and flow probably ranges from 30 to 350 cfs during the ice-free

season.

The substrate is predominantly gravel and is 100% embedded in

sand and silt. Much of the gravel was loose, indicating it was

5-4

recently deposited. The floodplain is covered with alder and

willow to water•s edge. Some log debris was present along stream

margins. Juvenile Dolly Varden, rainbow trout, and chinook sal­

mon were collected (1981).

Wobnair Creek: This stream has a relatively flat gradient and

sharp meanders near its mouth. Substrate is gravels and small

cobbles. The banks are vertical with some undercutting and are

composed of silts and sand. Predominant vegetation is willow and

tall grass. Runs comprise 60% of the stream and pools 40%. The

channel is generally rectangular. Stream top widths averaged

from 7 to 10 feet with depths of 1 to 2 feet. A discharge of 5 cfs

was measured on June 4, and flow probably ranges from less than

5 to 35 cfs during the ice-free season. Juvenile Dolly Varden and

rainbow trout, coho and chinook salmon fry, and threespine

sticklebacks were collected.

Headwaters Wobnair Creek: The headwaters of Wobnair above the

beaver activity is a flat gradient meandering stream with gravel

and cobble substrate. The floodplain and valley are relatively

narrow. Stream top widths averaged 2 feet with depths to 1 foot.

No discharge was measured, but flows are unlikely to exceed 5

cfs. Tall grass overhangs the bank and scattered spruce covers

the floodplain. No fish were found here.

Below the highest set of beaver ponds the creek has a moderate to

flat gradient. Substrate is basically gravel with some isolated

boulders. This channel is generally rectangular with vertical

banks, and this reach is predominantly a run with few pools.

Pools were generally associated with remnants of old beaver dams.

Several sets of active dams are present downstream. Stream top

widths averaged from 5 feet, and average depth was 0.5 to 1 foot.

Juvenile Dolly Varden and coho salmon were collected (1981).

Stream flow probably ranges from 1 to 15 cfs during the ice-free

season.

5-5

Chichantna River: This is a relatively large glacial stream with its

source in Capps Glacier. The river, nearly 12 miles long with

moderate to steep gradients, enters Beluga Lake over a broad

silty delta.

Capps Creek: Capps Creek and its principal tributary, North

Capps Creek, have their headwaters on a plateau at about 2,000-

feet elevation, south of the Capps Glacier and just northwest of

the upper headwaters of the Chuitna River. The creek flows

northeast into the Chichantna River, joining it about three to four

miles below Capps Glacier.

Both the south and north forks have their far upper headwaters

covered by lapilli tuff and volcanic breccia, which contribute a

small amount of volcanic sediment to the river•s alluvium. . The

streams also pick up sediment from the Quaternary deposits, which

contribute boulders, gravel, and silt to the system.

Both streams quickly become incised into the middle member of the

Tertiary Kenai Formation which contributes clay, silt, sand, gra­

vel, boulders, and coal lumps to the system. Each stream runs

through about three miles of this formation.

Capps Creek and North Capps Creek then enter a deposit formed

by landsliding and slumping of the middle member of the Kenai

Formation and the Quaternary deposits that cover it, including

sand dune deposits. These deposits contribute a variety of sedi­

ments to the river•s alluvium, including clay, silt, fine sand,

gravel, boulders, and coal lumps. Both streams run through this

slump deposit for about three miles, with North Capps Creek

joining Capps Creek about a mile before the end of the deposit.

The canyons at the confluence of Capps Creek and North Capps

Creek are narrow and steep, with sidewalls about 150 feet high at

a slope of approximately 45°. Many local slides occur on the can-

5-6

yon walls, involving the Tertiary and Quaternary sediments of the

sidewalls. Overlying sand dunes as much as 20 feet thick were

noted here. Many sites of slides were noted to also be the sites

of water seeps from the canyon walls, which may have been the

slide-triggering mechanism.

Capps Creek then enters a region of Quaternary and Recent gla­

ciofluvial deposits of sand, gravel, and boulders, continuing for

about three miles to the Chichantna River.

Capps Creek at Junction with North Capps Creek: Substrates are

composed of very coarse boulder and cobble alluvium, with some

sand and gravel. Fines appear to be predominantly sand of eolian

origin (from nearby sand dunes that overlie the Tertiary sedi­

ments). Boulders are as much as 6 feet in diameter, many com­

posed of granite. Stream gradient is moderately steep, with many

riffles. Logjams found above the normal fall water stages indicate

probable occasional flooding.

South Fork Capps Creek: Stream gradients are moderate to very

steep. Steep gradients were characterized by almost continual

waterfalls, cascades, or steep riffles; moderate gradients were

described as intermittent cascades or riffles with some pools; and

low gradients were characterized as entirely slow runs or very few

riffles among slow runs. Streambed materials within the water

course consist primarily of granite boulders and large pieces of

coal, with gravels and sands filling the interstices. These

streams consist almost entirely of riffles and rapids, but a few

pool areas can be found at the outside of stream bends and among

boulders at low flows.

Several high-water marks were observed 10 to 15 feet above the

water surface elevation of November.

5-7

c

Both Capps and North Capps creeks are already incised in nar­

row, steep-walled canyons. Vegetation is primarily grass and

devil's club with an alder brush overstory. Mass wasting is a

common natural process within these canyons.

Although no major barriers to fish migration were observed along

either stream, steep gradients may preclude passage and use by

man'y species.

Capps Creek (vicinity of USGS gauge): The gradient is gentle

throughout this stream segment. The stream meanders at a mod­

erate velocity throughout a glacial outwash type floodplain.

Stream bank vegetation consists principally of a low alder and

willow overstory with a tall grass understory. Some scattered

large birch and cottonwood trees occur adjacent to the stream,

and some moss-covered cobble and gravel banks with occasional

spruce trees can also be seen. Overhanging alder shrubs and

grassy banks occur along the lower several miles of Capps Creek.

The predominant substrate material is much smaller than that

found in the upper reaches of Capps Creek. Substrate is prin­

cipally cobbles and large gravels about SO% embedded in small

gravels and sand. Some scattered coal pieces occur throughout

the stream course, and some of the finer to medium-size gravel

substrate is cemented with a heavy clay deposition.

High-water marks are evident 3 to 5 feet above the November 6

water surface elevation.

The stream is characterized as approximately 60% riffle, 40% pool

in this section. Interspersed are numerous sandy gravel bars,

with many silty clay deposits.

A juvenile Dolly Varden was observed (1980) in a backwater area

along the left bank of the stream. Benthos, consisting primarily

5-8

c

of caddiesfly larvae, was observed beneath 8- to 10-inch cobbles.

No aquatic vegetation was observed.

Apparent signs of animal use included bear, fox, and otter

tracks. Beaver sign is extensive throughout this area as evi­

denced by active lodges, newly created dams, and freshly cut

shrubbery.

CHUITNA DRAINAGE

Chuitna River: The upper Chuitna River and its principal tribu­

tary, Wolverine Fork, both head in a plateau at about the 2,000

feet elevation south of Capps Glacier. The river system flows

southeastward into Cook Inlet. The streams initially course

through Quaternary deposits overlying the plateau area, consisting

of a discontinuous cover of glacial debris. Erosion of this cover

contributes sediments consisting of gravel, silt, and some boulders

to the streams.

Several of the upper,. western tributaries to the Chuitna River

have their far upper headwaters in an area covered by dark gray

lapilli tuff and volcanic breccia. Alluvial sediments of this origin

are found in small quantities throughout the Chuitna River.

The streams soon become incised into Tertiary sediments that

underlie the area. Near their headwaters, the streams cut

through the middle member of the Kenai Formation, consisting of a

non-marine sequence of gray and light yellow claystone, siltstone,

sandstone, and conglomerate, interbedded with sub-bituminous

coal, and occasional layers of calcareous cemented siltstone.

These sediments are poorly indurated and easily eroded, contri­

buting clay, silt, sand, gravel, boulders, and coal lumps to the

streams.

Within a few miles, the streams cross into the lower member of the

Kenai Formation, consisting of light gray to light yellow pebbly

5-9

c

sandstones and conglomerates. These sediments are also poorly

indurated and easily broken down, contributing sand, gravel, and

boulders to the streams. Both streams reenter Quaternary sedi­

ments for a few miles, then Wolverine Fork joins the Chuitna River

in this section.

About six to seven miles downstream, the Chuitna River crosses

the Castle Mountain Fault, reentering the middle member of the

Kenai Formation and remaining in it for the next 15 to 16 miles.

The Chuitna River is joined by Chuit Creek after running about

four to five miles through this section. The canyon walls of the

river in this section contain many large and small landslides and

slump deposits, composed of the overlying Quaternary sediments,

including sand dunes deposits, and the middle member of the

Kenai Formation. These continually contribute clay, silt, sand,

gravel, boulders, and coal lumps to the Chuitna River alluvium.

Many upper tributaries to the Chuitna River are blocked by

waterfalls formed on coal seams, which appear to be the hardest

strata in the area. These waterfalls may serve as barriers to fish

migration.

The Chuitna River canyon at its confluence with Wolverine Fork is

narrow and sidewall slopes average 35° to 40°. The walls are

about 150 feet high and are composed of Tertiary conglomerate of

a friable nature, consisting of sand, gravel, cobbles, and

boulders up to several feet in diameter. Many slide deposits are

found along the valley walls, composed of these Tertiary sediments

and a shallow Quaternary cover.

At the confluence with Chuit Creek, the canyon of the Chuitna

River is relatively broad, with walls about 150 feet high, and

sidewalls of 35° to 40°. The walls here are composed of sand­

stone, claystone, and sub-bituminous coal, with the sandstone

layer being somewhat conglomeratic in places, and including some

5-10

discontinuous layers of well-indurated sandstone and concretions.

Local slides, abundant in the area, are composed of these sedi­

ments. Water seeps are also common, often in conjunction with

slides.

The lower four to five miles of the Chuitna River cuts through

Quaternary sediments consisting of unconsolidated glacial outwash,

sand and gravel. Slides are less common here. The canyon walls

in the vicinity of the USGS gauging station are 60 to 70 feet high;

sidewall slopes average about 25° to 30°. The valley then

broadens and becomes gentler until reaching the Chuitna River

delta about two miles northeast of the Village of Tyonek.

Chuitna River just Below Wolverine Fork: Substrates are com-

posed of sand, gravel, cobbles, and boulders as much as 10 to

15 feet in diameter. Most boulders are composed of Tertiary

sandstone, but some are granite. The sandstone boulders are

fairly well indurated and contain some wood and coal fossils. The

stream gradient is moderate.

Lower Chuitna River (USGS gauge): Substrates are composed of

sand, gravel, cobbles, and boulders as much as 2 to 3 feet in

diameter. A large portion of the cobbles falls in the 6- to 10-inch

range. Fines consist predominantly of medium sand. The stream

gradient is low.

Lone Creek at Upper Forks: This stream reach has a moderate

gradient with a cobble/gravel substrate. The stream channel is

rectangular with vertical to undercut banks. Tall grasses are the

predominant vegetation and overhang the banks. The tributary to

Lone Creek has a steeper gradient 100 feet upstream from the

mouth, and the substrate is predominantly cobbles.

Lone Creek1s top widths averaged 5 to 7 feet, with depths ranging

from 0.5 to 1.5 feet in this reach. It was comprised of 75% pool/

5-11

run and 25% riffle. No discharge was measured in this reach.

Juvenile Dolly Varden and coho salmon were collected; Dolly

Varden fry were also observed in this reach.

Upper Lone Creek: This reach has a meandering channel with a

moderate to flat gradient. Stream banks are nearly vertical, with

some slumping into the stream channel. Stream top widths aver­

aged from 20 to 25 feet with an average depth of 1 to 1 . 5 feet. A

discharge of 13 cfs was measured on June 4, and flow probably

ranges from 5 to 200 cfs during the ice-free season.

The substrate is predominantly gravel and small cobbles partially

embedded in sand. Banks are covered primarily by alder and

willow with a grass understory. Several side channels and cutoff

meanders are present in this reach, as well as log debris in pools

and along margins.

This stream reach supports a rich benthic community, and the

stream bottom is covered with green filamentous algae. Juvenile

Dolly Varden and coho salmon, and rainbow trout and chinook

salmon fry were collected (1981). A beaver dam upstream of the

staff gauge supports juvenile Dolly Varden and coho salmon. Adult

Arctic lamprey were observed in this area (1981). A surber

sample was collected over large gravel and included water mites,

midges, and larval forms of mayflies, caddiesflies, stoneflies, and

danceflies.

Lower Middle Creek: Lower Middle Creek has a moderate gradient

and basically a riffle/run sequence. It consists of approximately

20% pool, SO% run, and 30% riffle. The channel in this portion of

the stream is basically triangular. The average stream top width

was 30 feet, with average depths ranging from 0.4 to 0. 7 feet.

Discharge was not measured at this site.

5-12

C: Substrate is composed mainly of cobbles and boulders with small,

isolated gravel and sand deposits probably associated with road

construction. Riparian vegetation consists of cottonwood trees

with an understory of alder and willow. Some log debris was

present in the pools. Juvenile Dolly Varden, coho salmon, and

chinook salmon, and pink and coho salmon fry were collected in

this reach (1981).

A moderate to steep gradient tributary {Culvert Creek) enters

Middle Creek in this reach. Dolly Varden and coho salmon juve­

niles were collected downstream of the culvert (1981).

Middle Creek (near the BHW Chuitna lease boundary): This

stream reach is characterized by a moderate to flat gradient and a

very meandering channel. It consists of approximately 50% pool,

30% riffle, and 20% run. The channel was rectangular and the

stream width averaged 10 to 15 feet in riffle areas and 15 to 20

feet in pool areas. Average depth in riffles was 0.3 to 0.6 feet,

and pools averaged from 1. 5 to 2 feet. A discharge of 1 cfs was

measured on June 3.

Gravel and sand were the predominant substrate material. The

nearly vertical banks are composed of silts and sands, and were

undercut on bends. Stream banks are covered with tall grasses

and a little log debris was present in the stream channel.

Juvenile Dolly Varden, rainbow trout, and chinook and coho

salmon were collected in this reach; an adult Arctic lamprey was

also collected (1981).

Upper Middle Creek: This reach has a moderate gradient with

approximately 30% pool, 20% riffle, and 50% run. This channel is

basically rectangular with average top widths of 10 to 15 feet.

Water depth of runs and pools averaged from 0. 5 to 1 foot and 1

to 2 feet, respectively. A discharge of 4. 2 cfs was measured on

June 3.

5-13

The substrate consists of gravels and cobbles embedded in silts

and sands. There are large deposits of silt and sand in pool

areas. Stream banks are nearly vertical with undercutting on

bends and are composed of silt and sands. Tall grasses and an

occasional willow cover the banks. Juvenile Dolly Varden and

coho salmon were collected in this reach (1981).

Strip Creek: Strip Creek is a flat gradient tributary of Middle

Creek. The stream is an incised meandering run. Pools are

present in meander bends but probably comprise only 15% of the

stream. Few riffles were noted. The top width of this small

stream averaged 3 feet, and the average depth was 1 foot. A

discharge of 1.5 cfs was measured on July 3, and flow probably

ranges from 1 to 25 cfs during the ice-free season. This system

is probably influenced by groundwater.

The substrate is primarily silts and sands. Stream banks are

composed of similar materials and were nearly vertical to undercut,

with tall grasses covering them. Juvenile Dolly Varden, coho

salmon, and coastrange sculpins were collected in this creek

(1981).

Brush Creek: Brush Creek is a moderate gradient stream which

combines with Strip Creek to form Middle Creek. It is composed·

of 30% pool, 20% run, and SO% riffle. The channel is generally

rectangular with near vertical banks. Stream top widths averaged

from 7 to 10 feet. Water depth in the pool areas was generally 1

to 1.5 feet and in riffle areas was from 0.2 to 0.7 feet. Much of

this stream probably freezes solid during the winter. A discharge

of 2.5 cfs was measured in June and flow probably ranges from 1

to 50 cfs during the ice-free season.

Substrate is primarily cobbles and boulders. Stream bank material

is a glacial till which supports a dense growth of alders. Juvenile

Dolly Varden, coho salmon, and coastrange sculpins were collected

here (1981).

5-14

(_

Chuit Creek: Chuit Creek has its headwaters on a plateau at

about 2,000 feet elevation south of the Capps Glacier, about three

miles east of the headwaters of the Chuitna River. The stream

flows southeastward about 10 miles to its confluence with the

Chuitna River. The stream initially flows through Quaternary

glacial deposits of gravel, silt, and boulders. The stream shortly

becomes incised into the middle member of the Tertiary Kenai

Formation, consisting of poorly indurated claystone, siltstone, and

conglomerate, interbedded with sub-bituminous coal and occasional

layers of cemented siltstone. These sediments contribute clay,

silt, sand, gravel, boulders, and coal lumps to the stream.

Within less than a mile the stream crosses into the lower member

of the Kenai Formation, consisting of pebbly sandstones and con­

glomerates. These contribute sand, gravel, and boulders to the

river. About six miles downstream, Chuit Creek crosses the

Castle Mountain Fault and reenters the middle member of the Kenai

Formation, remaining in it for about five more miles until its con­

fluence with the Chuitna River.

Chuit Creek canyon, within the Chuitna coal lease area, is a

relatively gentle canyon with sidewalls about 150 feet high and

averaging about 30°. Landslides occur here, but appear to be

fewer than along the Chuitna River. Just north of the lease area,

the sediments in the sidewalls consist of poorly indurated gravelly

sand, with cobbles up to 5 inches in diameter. Near the con­

fluence with the Chuitna River, the sidewalls are composed of

poorly indurated sandstone, with some lenses of well indurated

sandstone and occasional concretions. They grade downward into

claystone, which overlies thick, platy sub-bituminous coal.

Chuit Creek (just above Chuitna lease area): Substrate is sand,

gravel, and cobbles as much as 10 inches in diameter. Gradient

is moderate and very few boulders are evident.

5-15

Chuit Creek (near junction of Chuitna River): Substrate is sand,

gravel, cobbles, and many boulders, as much as 1 to 2 feet in

diameter. Stream gradient is moderate.

Chuit Creek Area: Chuit Creek stream gradients are moderate

(primarily riffles with occasional pools or runs) as this creek

meanders through a relatively wide canyon. Riparian vegetation is

predominantly low willow thickets and grass at the higher eleva­

tions. Spruce, birch, and cottonwood trees occur in the flood­

plain near the mouth of Chuit Creek. The stream is primarily

riffles and runs with some (approximately 10%) pool areas. Sev­

eral beaver ponds occur in the floodplain. The substrate mate­

rials are principally gravels and small cobbles in the upper

reaches grading toward large cobbles and isolated boulders near

the mouth. No barriers to fish migration are evident ·along this

stream.

East Fork of Chuit Creek: This stream is relatively straight and

has a moderately steep gradient. It consists primarily of riffle/

run/rapid sequences with less than 5% pools. The channel is

basically triangular with an average stream top width of 35 to 40

feet. Average water depths were 1.5 to 2 feet. A discharge of

78 Cfs was measured below the confluence of Camp Creek in June.

Stream flow probably ranges from 20 to 300 cfs during the ice-free

season.

The substrate is predominantly large cobbles and boulders. Alder

and willow thickets grow to the water•s edge, with some cotton­

woods scattered throughout the narrow floodplain. No log debris

was observed in the channel. Juvenile Dolly Varden were col­

lected in the vicinity of the staff gauges (1981).

Camp Creek: This stream has a steep gradient and consists pri­

marily of riffles/rapids. The channel is primarily triangular with

an average top width of 10 feet. Depths averaged 0.5 to 1 foot.

5-16

A discharge of 12 cfs was measured in June and flow probably

ranges from 5 to 30 cfs during the ice-free season.

The substrate is predominantly large cobbles and boulders.

Alders and willows cover the stream banks and overhang the

stream. No log debris was observed in the channel. Juvenile

Dolly Varden and rainbow trout were collected (1981).

Frank Creek: This stream reach (elevation 16,000 feet) has a

moderate gradiant with 30% pool, 30% riffle and 40% run. Top

width averaged 10 to 12 feet with average depths of 0.8 feet in

pools, 0.3 feet in riffles and 0.5 feet in runs. Substrate is com­

posed of small to medium gravels. The stream channel is rectan­

gular with nearly vertical banks approximately 3 to 4 feet high.

The stream banks were composed of sand and silt and supported

willows and tall grasses. Some mass wasting was evident farther

downstream where the stream cuts into a high bluff. One of the

few beaver dams present was located upstream. The floodplain is

covered with grasses and has several large marshy areas. High­

water marks were apparent 6. 5 feet above the stream bottom.

Upper Chuitna River (above Wolverine Fork): The stream gradi-

ent in this area is moderate, with a substrate consisting predom­

inantly of large cobbles and boulders with a gravel-sand base.

Considerably more sand- and silt-size particles occur in the

Chuitna River above the confluence with Wolverine Fork.

The water courses in this area wind through distinct canyons

where vegetation consists of grassy or muskeg meadows or patchy

low willow and alder areas. Some active landslide areas are visible

on the Chuitna above the confluence with Wolverine Fork, but the

streams are clear and contain little sediment.

No barriers to fish migration are evident in this area. The sub­

strate material appeared suitable for spawning by salmon ids.

5-17

NIKOLAI DRAINAGE

Nikolai Creek: Nikolai Creek has its headwaters on the plateau

south of Capps Glacier, in a small lake about 2'l:a miles south of the

glacier, and about a mile west of the upper headwaters of Capps

Creek and the Chuitna River. The creek flows off the plateau in

a narrow valley and then crosses a small, flat area before plung­

ing into a canyon cut through the Nikolai escarpment. The can­

yon is cut into Quaternary glacial debris consisting of gravel,

silt, and boulders.

The creek then follows a course southeastward along the foot of

the Nikolai escarpment for about 18 miles to empty into Trading

Bay. Near the logging road crossing, slightly more than a mile

west of Stedatna Creek, the creek is cutting only a few feet into

Quaternary and Recent glaciofluvial sediments of sand and gravel.

At the bridge, the creek banks are about 2 feet high, and com­

posed principally of sand. Substrate is silt, sand, gravel, and

small cobbles as much as 3 inches in diameter. Stream gradient is

low. Stream banks at this point consist of find sand.

Nikolai Creek (vicinity of logging road bridge): The gradie~t of

Nikolai Creek is very slight. The river meanders extensively

through a muskeg floodplain, and banks are alternately char­

acterized by thick muddy banks or grass-covered clayey banks.

Clumps of alder and some individual spruce trees are scattered

along the stream course. Substrate is principally clayey sand in

the low-energy deposition areas; in other areas with higher

velocities, considerably larger materials, specifically small to

medium cobbles, are predominant. Considerable quantities of

branches and twigs are found lying on or embedded in the clayey

banks along the stream. Beaver sign is extensive in this area, as

evidenced by the newly cut willow branches. Some man-made

pollution enters this stream in the form of suspended silts and

clays, as well as log debris, from upstream logging operations.

5-18

c

Stedatna Creek: Stedatna Creek begins in a muskeg flat about

two miles northwest of Congahbuna Lake and flows southwest to

its confluence with Nikolai Creek. The creek flows over the

Nikolai escarpment, cutting a canyon about 50 feet deep into

Quaternary deposits in the escarpment, consisting of gravelly sand

with boulders up to 8 feet in diameter. Substrate is sand,

gravel, cobbles, and boulders as much as 6 feet in diameter.

The stream gradient just above the logging road is moderate, and

large boulders and cobbles are scattered throughout the stream

course. Although this stream reach had been channelized in

association with construction of the logging road, some grass lines

the banks. Most of the riparian shrubbery and trees have been

removed. The substrate is a heterogeneous mix ranging from

sands through large boulders. Habitats upstream and downstream

consist principally of a meandering stream cascading over cobbles

and boulders. The stream passes through a cottonwood/birch/

spruce forest with an alder and grass understory. This segment

is approximately 20% pool, 80% riffle. No suitable salmonid spawn­

ing sites are apparent in the area.

Steep cascades downstream from the logging road crossing, as well

as the culverts beneath the road, may create definite fish migra­

tion barriers. However, an adult rainbow trout was captured

upstream from the culvert in 1981.

Pit Creek: This stream has clear water and the lower quarter

mile has a moderate gradient with approximately 10% pools, 20%

riffles, and 70% runs. The channel is rectangular with very steep

banks. Few scour holes or undercut banks are apparent. Stream

top widths averaged from 10 to 12 feet with an average depth of 1

foot. A discharge of 13 cfs was measured on June 1, and flow

probably ranges from 10 to 50 cfs during the ice-free season.

5-19

(~' The substrate is predominantly gravels and cobbles embedded in

silts and sands. The substrate is tightly packed and has the

appearance of being cemented together. Tall grass overhangs the

banks and scattered alders and cottonwoods cover the floodplain.

Dolly Varden and coho salmon juveniles and chinook salmon fry

were collected in this reach (1981).

Upstream of River Mile 0.25 the gradient steepens and the stream

is predominantly riffles. The substrate contains larger material,

including large cobbles and boulders. A surber sample collected

over large cobbles included water mites, midges, and larval forms

of mayflies, caddiesflies, stoneflies, blackflies, snipeflies, and

false craneflies.

Jo's Creek: This stream has clear water and the lower half mile

has a moderate to flat gradient with 40% pools, 50% runs, and 10%

riffles. The channel is rectangular with almost vertical banks.

Several scour holes are present along the banks. Stream top

widths averaged from 15 to 20 feet with an average depth of 1 . 5

feet. A discharge of 30 cfs was measured on June 1, and flow

probably ranges from 5 to 60 cfs during the ice-free season.

The substrate is predominantly gravels and small cobbles with

some fines. The substrate appeared cleaner and was composed of

smaller particle sizes than those present in Pitt Creek. Tall grass

overhangs the stream banks, and scattered alders and cottonwoods

cover the floodplain. Little log debris was present in the stream.

Juvenile Dolly Varden and coho salmon and Dolly Varden fry were

collected (1981). A surber sample collected over small cobbles

included larval forms of mayflies, stoneflies, caddiesflies, crane­

flies, and false craneflies.

Above River Mile 0. 5 the gradient steepens and the stream be­

comes riffle/run/rapids. Substrate particle sizes increase to large

cobbles and boulders.

5-20

CONGAHBUNA

Congahbuna Creek: Congahbuna Creek is a small creek that

begins in Congahbuna Lake and flows southeast and north to its

confluence with Old Tyonek Creek about one to two miles above

Beshta Bay: The creek runs principally through a region of

peaty soils and muskegs, underlain by Quaternary sands and

gravels. The substrate near the stream junction is silty fine

sand, but upstream a few hundred yards the substrate is

gravelly. The stream gradient is low. At the junction of

Congahbuna Creek and Old Tyonek Creek, the substrate is sand,

gravel, and some cobbles as large as 2 inches in diameter. The

stream gradient is low. Stream bank materials at this site consist

of silt and fine sand.

Muskrat Creek: Muskrat Creek is a small creek that begins in a

small lake just north of Granite Point and flows north for slightly

more than a mile to its confluence with Congahbuna Creek. Its

course is predominantly across muskeg flats underlain by Quater­

nary sand and gravel. The substrate is silty fine sand with

organic material and is stained red. The stream gradient is low

(almost imperceptible).

Both Muskrat Creek and Congahbuna Creek meander slowly

through a muskeg bog. Stream bank vegetation is principally tall

grass, which overhangs the stream providing extensive cover.

Muskrat Creek, which originates in a small lake about three­

quarters of a mile to the south is a tea-colored stream with a

bottom comprised of organic silty-sand material. The entire

course of this tributary appears to be one long slow run, with no

true riffles or pools. However, the uppermost section of this

stream near the lake from which it originates was not observed.

Congahbuna Creek is also tea-colored and is characterized by a

long slow run, and an organic silty-sand substrate. Submerged

5-21

0

grass is also visible. Downstream from the confluence with Musk­

rat Creek, Congahbuna Creek develops a series of riffles and

pools in a near 50:50 ratio.

Old Tyonek Creek: Old Tyonek Creek begins in a small lake,

about two miles southeast of the confluence of Chuit Creek and

the Chuitna River, and runs about nine miles to Cook Inlet,

emptying into the sea at Beshta Bay. The creek1s entire course

is through Quaternary glaciofluvial deposits of sand, gravel, and

boulders. The creek valley is relatively flat with low banks 6 to

10 feet in height. Substrate is sand, gravel, and cobbles as much

as 3 inches in diameter. The stream gradient is low.

Tall grass extensively overhangs the stream banks. Small patches

of willow and alder thickets with scattered birch, cottonwood, and

spruce trees provide the primary overstory. The substrate type

is a medium to fine gravel embedded in sand. Isolated patches of

armored substrate are present. Flooding is evidenced by a water

mark about 5 to 8 feet above the water surface. Stream banks

are deeply undercut, and some sloughing of bank materials was

observed. With the slight gradient present throughout the stretch

below Congahbuna Creek, the river exhibits a ratio of about 60%

run/pool to 40% riffle providing excellent spawning habitat.

Fishes

A comprehensive survey of the seasonal use, distribution and

abundance of fish in the Beluga region has not been performed.

Four species of Pacific salmon are known to inhabit the Chuitna

River system and the mainstream of the Chuitna is an important

king salmon spawning stream. The occurrence of the fifth

species, the sockeye, is questionable though it may be found near

the mouth of the Chuitna. Figure 5.2 displays a preliminary

overview of the species distribution and spawning areas. The

5-22

, ..

AEIDC Nov. 1980

FIGURE 5.2

~ UPSTREAM DISTRIBUTION

L SPECIES MAY BE PRES'ENT

SPAWNING AREA \'---''

PS- PINK SALMON

CS- CHUM SALMON

WF-WHITE FISH

DV- DOLLY VARDEN

KS-KING SALMON BB-BURBOT

SS-COHO SALMON RT- RAINBOW

RS- SOCKEYE SALMON TROUT

AG-ARCTIC GRAYLING

SPECIES DISTRIBUTION AND SPAWNING AREAS

completion of the 1981 field program will provide further insight

into both distribution and habitat utilization.

Chuit Creek is a known king salmon spawning area, and both pink

and chum salmon spawn in the Chuitna from Lone Creek to the

mouth of the river. Estimates of the abundance of the annual

return to the Chuitna system are:

Pinks 100,000 even years

Chums 20,000 odd years

Coho few

Kings 5,000

Rainbow Trout ?

Dolly Varden ?

Nikolai Creek provides spawning for king, coho, and pink salmon

and pink salmon also spawn in Old Tyonek Creek. Nikolai Creek

is known for its rainbow trout and Congahbuna Lake supports a

resident rainbow population.

The various Pacific salmon of Cook Inlet are discussed in some

detail later in this section under Marine Species, and Table 5.1

provides a summary of selected life history data.

Table 5. 2 illustrates the type of data being obtained from the 1981

field program relative to determining the presence or absence of

species. Emphasis during this period was to determine the pres­

ence or absence of juveniles and observe the return of adult fish

to the system. No outmigration or preemergent work was accom­

plished in 1981.

Table 5. 3 is a checklist of the probable freshwater species of the

Beluga region (not all species have been confirmed by this pro­

gram).

5-24

()

Table 5.1

LIFE HISTORY DATA FOR FIVE SPECIES OF PACIFIC SALMON*

Freshwater habitat

Length of time young stay in fresh water

Length of ocean life

Year of life at maturity (years)

Average length at maturity (inches)

Range of length at maturity (inches)

Average weight at maturity (pounds)

Range of weight at maturity (pounds)

Principal spawning months

Fecundity (number of eggs)

Principal spawning habitats

Principal rearing habitat

Chinook (King)

Large Rivers

3 to 12 mos.

1 to 5 yrs.

2 to 8

36

16 to 60

22

2~ to 125

Aug - Sept

5,000

Sands & gravels (coarse)

Cool, clear streams

Pink

Short Streams

1 day or less

1-1/3 yrs.

2

20

14 to 30

4

2 to 9

July - Sept

2,000

Silts & small gravel

Estuarine

Sockeye (Red)

Short Streams & Lakes

1 to 3 yrs.

~ to 4 yrs.

3 to 7

25

15 to 33

6

1\ to 10

July - Sept

4,000

Fine to large gravels

Lakes & ponds

* Exceptions to these general descriptions occur frequently.

Coho (Silver)

Short Streams & Lakes

to 2 yrs.

1 to 2 yrs.

2 to 4

24

17 to 36

10

3 to 30

Sept - Dec

3,500

Fine to coarse gravels (5 em)

Pools in streams

Chum (Dog)

Short & Long Streams

Less than 1 mo.

\ to 4 yrs.

2 to 5

25

17 to 38

9

3 to 45

Sept - Nov

3,000

Fine gravels (2.5 em)

Streams

Location

Nikolai Creek

{; '--.__/

Jo's Creek

Pitt Creek

Stedatna Creek

c

Table 5.2

SELECTED FISH TRAPPING DATA

NIKOLAI DRAINAGE (JUNE 1981)

Date Species Captured

6/6 Adult Chinook Salmon

6/2 Juvenile Chinook Salmon

6/2 Juvenile Coho Salmon

6/2 Coho Salmon Fry

6/6 Adult Rainbow Trout

6/2 Juvenile Rainbow Trout

6/2 Juvenile Dolly Varden

6/2 Coastrange Sculpin

6/2 Threespine Stickleback

6/2 Chinook Salmon Fry

6/2 Juvenile Coho Salmon

6/2 Juvenile Dolly Varden

6/2 Coastrange Sculpin

6/2 Chinook Salmon Fry

6/2 Juvenile Coho Salmon

6/2 Juvenile Dolly Varden

6/2 Juvenile Chinook Salmon

6/2 Juvenile Coho Salmon

6/2 Juvenile Dolly Varden

*by angler (hook & line)

5-26

(8)*

(4)

(24)

(2)

(10)*

(3)

(25)

(13)

(1)

(1)

(2)

(3)

(2)

(2)

(2)

(3)

(1)

(4)

(4)

Table 5.3

CHECKLIST OF THE FRESHWATER FISH OF BELUGA AREA"'

Pacific Lamprey

Arctic Lamprey

Green Sturgen

Pacific Herring

American Shad

Pygmy Whitefish

Round Whitefish

Rainbow Trout

Lake Trout

Dolly Varden

Sockeye Salmon (red or blue back)

Coho Salmon (silver)

King Salmon (chinook)

Chum Salmon (dog)

Pink Salmon (humpy)

Arctic Grayling

Pond Smelt

Surf Smelt

Eulachon (hooligan)

Longrose Sucker

Burbot

Saffron Cod

Threespine Stickleback

Ninespine Stickleback

Slimy Sculpin

Coastrange Sculpin

Pacific Staghorn Sculpin

Starry Flounder

Entosphenus tridentatus

Lampetra japonica

Acipenser medirostris

Clupea harengue pallasi

~ sapidissima

Prosopium coulteri

~ cylindraceum

~ · gairdneri

Saivelinus namaycush

~~

Oncorhynchus nerka

2.:.. kisutch

2.:_ tshawytscha

2.:.. keta

2.:_ gorbuscha

Thymallus arcticus

Hypomesus olidus

.!::!..;. pretiosus

Thaieichthys pacificus

Catostomus catostomus

~~

Eleqimus graccilis

Gasterosteus aculeatus

Pungiltius pungitius

~cognatus

c. aleuticus

Clinocottus acuticeps

Platichthys stellatus

"' Including anadromous species and the marine species of brackish estuaries.

5-27

0

Figure 5.2 shows the location of all reaches sampled by trapping

and angling during the period May to early August 1981. In

addition, aerial observations were made on numerous streams at

various times during the field season (Table 5. 4 is an example)

and all of the streams within the study area, with the exception of

those in the Bishop Creek System, have been examined in part

both from the air and the ground. Figure 5. 3 shows those areas . where adult king salmon wre observed in July and August 1981.

Invertebrates

Only preliminary studies of the benthic invertebrate community

have been undertaken by the USGS and only general sampling of

these communities is part of the 1981 field· program. Table 5.5

illustrates the results from basket samples taken at two stations of

the Chuitna River by the USGS.

TERRESTRIAL ECOLOGY

Existing Vegetation

A generalized vegetation map adapted from the map, 11 Major Eco­

systems of Alaska 11 prepared by the Federal-State Land Use Planning

Commission in 1973, is shown in Figure 5.4. Terrestrial vegetation

in the region includes four general vegetative types:

0

0

0

0

upland spruce - hardwood forest

high brush

wet tundra

alpine tundra

The upland spruce - hardwood forest is a fairly dense, mixed forest

of white spruce, paper birch, quaking aspen, black cottonwood and

balsam poplar occupying major portions of the benchland in the re-

5-28

BELl/SA LAKE

CAPPS GLACIER

COOK INLET

LEGEND

AERIAL OBSERVATIONS OF

AOUL T KING SALMON

AREAS WHERE ADULT KING SALMON WERE OBSERVED

(JULY-AUGUST, •al)

FIGURE 5.3

('\ ~/

Table 5.4

CHINOOK SALMON AERIAL SURVEY

August 3, 1981*

LOCATION NUMBER

Chuitna River below mouth of 71 Lone Creek

Lone Creek 207

Middle Creek 26

Cote Creek 2

Frank Creek 2

East Fork of Chuit Creek 32

Nikolai Creek above Jo's Creek 0

Jo's Creek 0

Pitt Creek 0

Camp Creek 3

* By helicopter; observers JB, JT and RD.

5-30

c

Table 5.5

BENTHIC INVERTEBRATE COMMUNITY

Analysis of Basket Samples Chuitna River Near Tyonek

10/18/77 3/29/78 Sampling Dates

INSECTS Ephemeroptera nymphs (May Flies)

Baetis sp Ephemerella doddsi Ephemerella inermis Ephemerella sp

Plecoptera nymphs (Stone Flies)

Capnia sp Hastaperta brevis lsoperla ebria lsoperta sp Pteronarcetfa badia Taenionema nigripenne Taenionema sp Zapada cintipes Zapada frigida

Trichoptera larva (Caddis Flies)

Apatania sp Arctopsyche ladogensis Brachycentrus sp Ecclisomyia sp Glossosoma sp Homophylax sp Molanna sp Onocosmoecus sp Psychoglypha subbarealis Rhyacophila sp

Diptera larva (True Flies) Tipulidae larva (Crane Flies)

Dicranota sp Hexatoma sp Limnophila sp Ormosia sp

5-31

#SO if60 Station Number

2

2

4

6 2 6

3 6 3

2 4

1/1P 7

Table 5.5 (Continued)

BENTHIC INVERTEBRATE COMMUNITY

10/18/n 3/29/78 Sampling Dates #50 #60 Station Number

Simuliidae larva (Black Flies)

. Prosimulium sp Slmilium sp --

Chironomidae larva (midges) Areta or Conchapelopia sp Brillia sp Cladotanytarsus sp Conchapelopis sp Cricotopus sp 3 Diamesa sp 1 Diamesa sp 2 Eukiefferiella sp Micropsectra sp Orthocladius sp Potypedilum sp Potthastia sp Procladius sp Rheotanytarsus sp Tanytarsus sp Trissocladius sp Thienemanniella sp

Ceratopogonidae larva (Biting Midges)

Palpomyia sp

Empididae larva (Dance Flies)

Psychodidae larva (Moth Flies)

Pericoma sp

MISCELLANEOUS ORGANISMS Acari (Water Mites)

Limnesia sp Sperchon sp 1

3

1

7 3 1

17

2

8

6

2

Total Number of Organisms 25 80 Total Number of Taxa 10 19 Number of Taxa - Insects Only 10 19 Total Number of Insects 25 80 Diversity Index - Insects Only 3.00 3. 79 Pooled: Total Number of Insects 105

Diversity Index - Insects Only 3.92

P Indicates pupa stage. 5-32

gion extending from sea level to more than 1,000 feet in elevation.

Black spruce generally occupies areas of poor drainage; pure stands

of white spurce and mixed stands of cottonwood and poplar often

occur along stream courses. Successional stages following fire are

birch on the east- and west-facing slopes with aspen following willow

on south-facing slopes. Either of these stages provides good browse

for moose. Some Sitka spruce occur as far north as the southern

slopes of Mt. Susitna and some small stands are found near Tyonek.

Sitka spruce hybridize with white spruce making identification diffi­

cult. Some mountain hemlock is also found in the vicinity of Tyonek.

The endemic spruce beetle, Dendroctonus rufipennis, has destroyed

thousands of acres of forest in the Beluga region. Principal species

include:

White spruce

Black spruce

Quaking aspen

Paper birch

Black cottonwood

Balsam popular

Willow

Alder

Rose

High-bush cranberry

Lingenberry

Raspberry

Currant

Picea glauca

Picea mariana

Populus tremuloides

Betula papyrifera

Populus balsamifera trichocarpa

Populus balsamifera balsamifera

Salix

Alnus

Rosa

Viburnum edule

Vaccinium vitis-idaea minus

Rubus

Ribes

The dominant species in the high brush vegetative type range from

dense willows to dense alder. This type occupies a wide variety of

soil types and often occurs as pure thickets in coastal lowlands and

floodplains. Occasional trees including aspen, birch, and spruce may

be present but are generally widely scattered. Principal species

include:

5-34

(--, ' ~ Sitka alder Alnus crisea sinuata

Green alder Alnus crisea

Thinleaf alder Alnus incana tenuifolia

Devil's club Echinoeanax horridum

Willow Salix

Currant Ribes

Blueberry Vaccinium

Raspberry Rubus

Soap berry Sheeherdia canadenus

Lingenberry Vaccinium vitis-idaea minus

Spirea seirea beauverdiana

Thimbleberry Rubus earviflorus

Salmonberry Rubus seectabilis

Dogwood Corn us

The wet tundra vegetative type is generally a mat of vegetation

occurring along tidal flats and other flat areas near sea level. This

vegetative mat is dominated by sedges and cottongrass with scat­

tered woody and herbaceous plants occurring on drier sites above

the water table. Principal species include:

Sedges Carex

Cottongrass Erioehorum

Lyme grass Elymus arenarius

Pendant grass

Bur reed

Mare's tail

Rushes

Willow

Dwarf birch

Labrador tea

Cinquefoil

Lingenberry

Bog cranberry

5-35

Arctoehila fulva

searganium

Hieeuris

Juncus

Salix

Betula nana exilis

Ledum ealustre groenlandicum

Potentilla fruiticosa

Vaccinium vitis-idaea minus

Oxycocus microcareus

c-, Alpine tundra is generally found at the higher elevations and is com­

prised primarily of low mat plants, both shrubby and herbaceous.

Principal species include:

Resin birch

Dwarf birch

Arctic willow

Crowberry

Labrador tea

Mountain heather

Rhododendron

Dwarf blueberry

Alpine blueberry

Alpine bearberry

Mountain avens

Moss campion

Arctic sandwort

Cassiope

Alpine azalea

Sedges

Lichens

Mosses

Betula glandulosa

Betula nana exilis

Salix arctica

Empetrum nigrum

Ledum palustre groenlandicum

Phyllodoce

Rohododend ron I appon icum

Vaccinium caespitosum

Vaccinium uliginosum alpinum

Arctostaphylos alpina

Dryas

Silene acaulis

Minuartia arctica

Cassiope

Loiseluria procumbens

Juncus

A more detailed vegetation map of the region is currently being pre­

pared by the U.S. Forest Service Laboratory of the Pacific Northwest

Experiment Station as part of the Susitna Basin Project. It is anti­

cipated that this map will be available in 1982. The classification

system being utilized is unique for the project and is based on

Viereck and Dyrness's 1980 11 A Preliminary Classification System for

Vegetation of Alaska 11• A modified vegetation map based primarily on

the laboratory's preliminary photo-mapping is shown in Figure 5.5.

This system classifies existing, not potential, vegetation and begins

with four formations for terrestrial vegetation - forest, tundra,

shrub, and herbaceous vegetation.

5-36

E:;:;:;:;J BOG

llmJ INFESTED SPRUCE

0 OLD MEDIUM MIXED DECIDUOUS

B WATER OR RIVERBED

1\::.q TALL WHITE SPRUCE

IJIIDD TALL BLACK SPRUCE

~ MIXED DECIDUOUS AND TALL SHRUB

FIGURE 5.5 PRELIMINARY PHOTO INTERPRETATION VEGETATION MAP

Based on Murray•s 1980 list of 11 Threatened and Endangered Plants of

Alaska 11, only one species, the pale poppy Papaver alboroseum which

is often found in alpine tundra, is known to occur in the region.

The plant communities described above will ultimately be related to

successional stages and such regulating factors as altitude, soil and

groundwater conditions, wildlife, and man•s activities, as part of a

continuing characterization of terrestrial habitats. Much of the

necessary baseline data will result from the 1981 field activities of the

SCS. It is anticipated that surficial soils data and ground-truth

confirmation of photo vegetation types will be available in 1982.

Wetlands

Wetlands constitute a large portion of the general area. The COE

(Regulatory Program, July 19, 1977, Part 323, Section 323.2) pro­

vides the following definition:

c) The term 11 wetlands 11 means those areas that are inundated or

saturated by surface or groundwater at a frequency and dura­

tion sufficient to support, and that under normal circumstances

do support, a prevalence of vegetation typically adapted for

life in saturated soil conditions. Wetlands generally include

swamps, marshes, bogs, and similar areas.

The U.S. Fish and Wildlife Service has mapped portions of western

Cook Inlet at a scale of one inch to the mile as part of the National

Wetlands Inventory. This inventory has been curtailed by budgetary

constraints and it is not known when such information for the general

project area will become available.

The COE has made a preliminary wetlands determination in the Beluga

area and that determination is shown in Figure 5.6.

5-38

()

rm WETLANDS

TRADING BAY

FIGURE 5.6 PRELIMINARY DETERMINATION OF WETLANDS

The above wetland classifications or determinations will not of them­

selves portray wetland resources in sufficient detail to assess envi­

ronmental impacts of site specific activities. Different types of

wetlands vary in value, extent, and associated use by wildlife and

this will be assessed on a site specific basis.

Existing Mammal Populations

The brown bear ( Ursus arctos), the black bear (Ursus americanus),

and the moose ( Alces alces) are the principal species of large mam­

mals found within the general project area. All three species can be

considered common and widespread throughout the area. Moose are

often locally abundant; most bears are transient using the area on a

seasonal basis. Seasonal concentrations of moose are shown in Figure

5. 7; known seasonal feeding areas along salmon streams for bears are

shown in Figure 5.8 as are primary denning areas. Other denning

areas most likely occur within the region, as do other feeding areas

along streams supporting seasonal runs of Pacific salmon. The wolf

(Canis lupus) is not common within this area but has been observed

in the Trading Bay State Game Refuge. Three wolves were also

observed in the Capps area in August 1981 above the headwaters of

Wolverine Fork.

Brown bears reach minimum breeding age at 4~ to 6~ years of age;

most males reach sexual maturity at 4 to 6 years (average 5~). The

bears mate in May or June and cubs are born the following February

or March. Denning in the study area probably begins in November,

with younger and pregnant female bears denning earlier. Most bears

remain in their dens until May, although they may emerge for brief

periods if disturbed or during stretches of mild weather. The cubs

remain with the sow for two years and are then abandoned in the

third year before the sow breeds again. Litters of cubs and year­

lings contain, on the average, slightly more than two cubs. A

postnatal mortality differential between cubs and yearlings makes this 11 average 11 somewhat questionable.

5-40

c-

(_

... _ \ ....... ·············"·--.:"'ii::~...::~

CAPPS GLACIER ...

... ·· r·?·····

FIGURE 5.7

............. Granite

Point

BELUGA

~WINTER

~SUMMER

COOK INLET

BASED ON 1980-81 FIELD OBSERVATIONS

SEASONAL CONCENTRATION OF MOOSE

~

\ .. L5~;

·-ITEL.UGA LAKE

CAPPS GLACIER

COOK INLET

LEGEND

El BROWN BEAR DENNING

(IIJ BLACK BEAR DENNING

I BROWN BEAR SEASONAL FEEDING AREA (SALMON); BASED ON OBSERVATIONS AND/OR TRACKS

BEAR FEEDING AND PRIMARY DENNING AREA

FIGURE 5.8

c Brown bears usually leave their dens in May and may move to the

lower elevations or even onto the beaches, feeding on animal car­

casses cast up during the winter storms. More typically, the bears

remain at mid-elevations for various reasons both sociological and

physiological. Inland bears may opportunistically utilize 11 moose

yards 11 for winter kills and prey on moose calves at the calving

grounds. As spring progresses, green vegetation becomes the

principal diet, and as the snow retreats, the bears follow the spring

growth to higher ground. Green vegetation, with occasional small

mammals, carrion, roots, and other plant materials, form the mainstay

of the diet until berries and salmon become available during the

summer. Soon after they reach the spawning streams, salmon become

the primary component of their diet, and the bears remain near the

streams throughout the summer, supplementing their diet with plants

and berries. After the salmon runs are complete, brown bears feed

largely on berries, roots, and green vegetation, and occasional small

mammals and carrion.

0 Brown Bear Denning

Brown bears prepare dens by digging into hillsides usually at an

altitudinal range of 300 to 750 meters (m) (1,000 to 2,500 feet).

This zone provides certain environmental conditions favorable to

winter denning including moderate, ambient temperatures during

cold intervals, a relatively stable snowpack that insulates the den

cavity, and an interwoven complex of vegetation that supports the

snowpack (drifting) and den cavity (soil binding by root sys­

tems).

Dens generally have a single entrance, a chamber, and in some

cases, a connecting tunnel. They are occupied from October or

November until April or May and when abandoned, thawing and

erosion soon cause them to collapse. Rocky caves and natural

cavities may be appropriated or modified for use and reuse as

winter dens.

5-43

c

c

Denning habitat of brown bears may be delineated by subjectively

evaluating the principal criteria leading to site selection: elevation

and slope, soil/rock substrate, and vegetation. The best snow

conditions during the denning period are generally at intermediate

elevations. Higher levels above the vegetation zone (635 m or

2, 000 ft plus) tend to have erratic and unstable snow conditions

characterized by massive drifting, wind scouring, icing, heavy

crusting and avalanches 1 and provide marginal denning oppor­

tunities. Sea level temperatures are above freezing later in the

winter and snow cover may not be sustained at lower elevations.

Temperatures at the 300 m (1,000 ft) level may average lower than

at sea level and, therefore, permit the snowpack to increase in

depth. Later, during spring, lower temperatures at higher ele­

vations permit snow cover to remain longer than at lower eleva­

tions. The insulating property of snow has been recognized as an

essential element of successful denning of polar and brown bears

(Craighead and Craighead 1972; Lentfer and Hensel 1978, Lentfer

et al. 1972). Intermediate levels also provide a warmer air

stratum compared to lower and higher elevations since temperature

inversions prevail during midwinter cold snaps in calm conditions.

Site preference probably is also a function of slope as an incline

aids in excavation--soil material can be easily deposited downhill

from the den entrance. An incline also provides site drainage

during thaws and spring snowmelt.

Suitable soil condition is a major criterion for den site selection.

Generally of shallow depth, alpine soils are easily pulverized and

lack the cohesive properties of soils found at lower elevations. At

upper elevations dens supported by subsurface freezing are likely

to collapse during warm periods and be abandoned prematurely.

Although suitable soil conditions occur at lower elevations 1 site

selection at this level may be precluded by colder temperatures

during midwinter cold snaps, reduced insulation qualities of snow,

and insufficient drainage during snowmelt.

5-44

c

c

c

Den site selection appears to be related to the subalpine ecotone

delineated by the upper limit of woody vegetation types, notably

alder, willow, and dwarf birch. Root penetration by these and

large herbaceous plants bind the soil and provide added support

to the den cavity. At intermediate elevations vegetation affords

concealment and enhances security. Standing vegetation also re­

tains and stabilizes the snowpack by retarding wind erosion.

Snow accumulation on semi-brushy sites seals the den entrance,

inhibiting air transfer, and provides an insulative layer covering

the entire den. Usable and marginal denning habitats in the

Beluga area were delineated through direct aerial observation of

bears, dens, and related signs, together with the site selection

criteria described by Spencer and Hensel (1980). Three possible

den sites were located in the upper reaches of the Wolverine Fork

and the Chichantna drainages and in the Chuitna drainage.

Actual occupancy of these sites was not verified by ground in­

spection. Distribution of tracks and bear sightings noted late in

the period of den emergence indicated that denning activity is

remarkably more intensive in the headwaters of the Chichantna

River, and in hilly areas of North Capps Creek, and the mainstem

of upper Capps Creek where the gentle relief the the plateau

slopes abruptly and drainage systems form intervening gullies and

steep-walled canyons. Considerable post-denning activity was

noted in the upper Chuitna drainage, to a lesser degree in the

upper Chuit drainage, and along the upper edge of the Nikolai

escarpment. Most brown bear activity in the Beluga area is prob­

ably associated with this escarpment and steep slopes paralleling

the upper Chuitna and its major tributaries where elevation ex­

ceeds 300 m (1,000 ft). At this altitude the snowpack is probably

of sufficient depth, composition and duration to accommodate most

of the brown bear denning occurring in the Beluga area. Can­

yons and tributary slopes provide good drainage and adequate

shrub/herbaceous coverage are an added inducement for brown

bear denning in these areas. Slopes and drainages near the

Capps Glacier lack suitable soil and vegetation condition to be

considered usable denning habitat. Rocky land outcroppings and

5-45

c

c

large boulders along the bottom edges of tributary canyons may

provide natural den sites for brown bears, but these situations

appear to be limited in number.

Much of the Beluga area, because of its elevated plateau character

and lowland tree cover, is unusable or marginal denning habitat for

brown bears. That portion of the plateau stretching from Nikolai

escarpment to Lone Ridge north to the Capps Glacier is of such

gentle grade, sparse vegetation cover and gravelly sandy soils to

virtually preclude denning. Approximately 20% of the delineated

brown bear habitat is situated in the North Capps Creek lease area.

0 Brown Bear Movement and Activity Patterns

The locations of established bear trails were noted on topo­

graphic maps from aerial and field observations. When there is no

snow cover, such trails are prominent features on the landscape,

patterns of which indicate the level and direction of movements to

and from activity areas. Depending upon biological needs and

habitat conditions, brown bears utilize two or more activity areas,

which can be viewed merely as different portions of an all-encom­

passing range. Distances between activity areas also vary, since

one or several drainages may be part of a year-around range of

an individual bear.

The location of principal trail systems relates to topographic

obstacles and cross country distance and/or access to activity

areas, particularly those associated with seasonal food gathering.

In the Beluga area, topography limits movements to and from

adjacent areas. The high glaciated mountains preclude movements

north of the moraine plateau. The extensive lowland marsh

between Nikolai and the Chakachatna drainges deter westward

movement because brown bears traveling across lowland areas have

a proclivity to avoid open terrain. Logging operations in and

around this sector also affect movement in this area. The absence

of any established trails or recent signs indicative of traveling

5-46

c

0

bears in this area supports this observation. To the east, the

relatively large and fast-flowing Beluga River probably restricts

brown bear movements parallel to the mountain range or Cook

Inlet. The region•s geomorphology limits the degree of inter­

change between brown bear subpopulations resident to the north

side of Cook Inlet. Brown bears may, therefore, be considered in

the Beluga area as a relatively discrete population with minimum

interchange between adjacent subpopulations.

Feeding and socializing (breeding behaviorism) as distinct activ­

ities greatly influence the extent to which brown bears move. In­

dividual tracks and bear sightings made during the post-denning

(breeding) period indicated bears traverse the upper reaches of

the plateau at an altitudinal range of 350 to 700 m (1 ,200 to

2,300 ft). Considerable movement activity of an exploratory na­

ture was noted to occur along the eastward edge of the plateau in

the headwaters of Bishop and Scarp creeks, and headwaters of the

Chuitna and Wolverine Fork.

In the Nikolai area, a major travel route (Pit Creek) was found to

connect the upper Chuitna and Nikolai drainages. The absence of

any permanent bear trails across the marshy areas west of Nikolai

Creek supports the supposition of limited population interchange.

Black Bears

Black bears are generally considered open forest animals which

tend to avoid both the denser forest and large open areas; this

may not be typical of the southcentral portion of ~he range where

black bears are found throughout the study area along principal

stream courses. Primary denning habitat for black bears occurs

along the Nikolai escarpment and forested portions of the upper

Chuitna and Lone Creek drainages. It is estimated that less than

15% of the primary habitat for black bear denning occurs within

the overall project area and even less in specific site locations.

5-47

c

0

c

Black bear usually reach maturity in their third year, although

some females may not breed until they are 5 or 6 years of age.

They mate in June or July and the cubs, usually two to three per

litter, are born in the den in midwinter. Black bears in the

study area generally emerge from their dens in May, though

females with their cubs may emerge later and den earlier than

others. Cubs are genera II y weaned by the next September after

their birth, but may remain with a lactating sow for another

winter.

Black bears eat a wide variety of plant and animal material. Dur­

ing the spring, grasses, sedges, and horsetail ( Eguisetum) make

up the bulk of their diet. During the summer and early autumn,

berries make up the larger portion of the diet. Black bears in

general are less dependent on salmon runs than brown bears, but

in the study area, concentrations along salmon streams indicate

that salmon is an important component of the summer diet. In the

fall, vegetation again becomes more important in the diet as salmon

and berries become less and less available.

Moose

Moose range throughout the study area and calve during the

spring in areas of muskeg or swamps. One or two calves are the

norm. Bulls and cows with calves from previous years usually

summer on higher ground, and in early to mid fall move down the

hills to lower elevations. Wintering grounds usually are in the

lowlands and river valleys and may hold dense aggregations of

moose in 11 moose yards 11•

11 Yarding 11 occurs primarily in response

to heavy snow cover and difficult feeding conditions.

Moose eat a variety of vegetable matter including browse (woody

plant stems, buds, leaves, bark, and twigs), lichens, fungi,

grasses, and forbs (non-woody annual and perennial plants other

than grasses). The percentage of each of these components in

5-48

c

0

the diet is determined for the most part by its seasonal availabil­

ity. Birch, which constitutes a large percentage of the diet, does

not provide sufficient nutrition to support the moose for sustained

periods.

Moose reportedly eat alder and willow preferentially throughout the

year, but the quantity of these plants available to the moose is

usually less than sufficient to comprise the bulk of the diet. Low

browse, forbs, and other plant material are essential to moose

diets. Typically, vegetation on the best moose range is in the

earlier sera! stages (i.e., 5 to 25 years old) of plant succession.

Much of the area logged in recent years is now in excel.lent

browse condition, particularly along the Nikolai escarpment.

Aerial observation of big game is continuing· as part of the on­

going 1981 field program. Table 5.6 shows the results of a 2-day

observation period in ear.ly June. Table 5. 7 shows the results of

the 1980 moose survey conducted by ADF&G.

Seasonal distribution of bears, moose, and other mammals can only

be generally described considering the limits of the past and on­

going field studies. A more comprehensive mapping effort will be

required to quantify the impacts on habitat of the project. The

status and discreteness of both the moose and bear populations

require additional field evaluation. Predator-prey relationships for

big game and other species have not been described.

Other Mammals

Other mammals known or considered to be present within the

study area are:

Red Fox

Mink

River of Land Otter

5-49

Vulpes fulva

Mustela vison

Lutra canadensis

()

Table 5.6

MOOSE/BEAR OBSERVATIONS (AERIAL) JUNE 1-4, 1981

Dale Obs. Brown Black Sub- Uniden- Females Females Females Uniden-1981 No. Obs. Location Altitude ~ Bear Adult adult tified w/cubs w/Year-lin9 Males Females w/calves tit'ied

6/'1 H Lower Chuitna 3DO 6/2 lA T Lower Capps Crk 500 6/2 1B H Lower· Chuitna 300 1(2) 6/3 2H H Mid-Chuitna 1,000 6/3 3H H Mid-Chuitna 500 6/3 4H H Lower Chuitna 150 6/3 5H H 3 Mile Creek 250 6/3 6H H East Fork Chuitna 600 6/3 7C H s. Side Chichantna 300

8C H Wolv. Crk E. Side 1,500 2 9C H Upper Chichantna 1,000 1

·we H Upper Chuitna 1,300 1 11C H Lower Chuitna 800 1 ·12c H Lower Chuitna 200 13C H Upper Chakachatna 1,900 3 1(2) 14C H Straight Creek 500 15C H Straight Creek 300 2 2 "16C H Upper Nikolai 2,000 17C H Upper Chuit 1,600 "18C H Mid-Chuitna 800 19C H Mid-Chuitna 800 20C H Lower Chuitna 200 2"1C H Upper Wolverine 1,700 1

22H H Mid-Chuitna 375 1 23C H Nikolai Creek 900 3 1(2) 24C H East Chuilna 350 1

Table 5. 7

1980 MOOSE SURVEY

~: Lone Ridge, Beluga Drainage, Chuitna Drainage

Observer: J. Didrickson, ADF&G (Palmer)

Total Moose: 151 (139 adults, 12 calves)

Age-Sex Ratios: Bulls - 33 large, Cows 1.1. yearlings

44 Total

Period of Observation: December

5-51

85 w/o calves 8 w/calves ~ w/2 calves

95 Total

c

c:

Red Squirrel

Lynx

Snowshoe or Varying Hare

Flying Squirrel

Muskrat

Beaver

Wolverine

Porcupine

Least Weasel

Ermine or Shorttail Weasel

Mouse Weasel

Marten

Coyote

Ground Squirrel

Collared Pika

Hoary Marmot

Brown Lemming

Northern Bog Lemming

Red-backed Vole

Tundra Vole

House Mouse

Meadow Jumping Mouse

Masked Shrew

Dusky Shrew

Water Shrew

Little Brown Bat

Tamiasciurus hudsonicus

Lynx canadensis

Lepus americanus

Glaucomys sabrinus

Ondatra zibethica

Castor canadensis

Gulo luscus

Erethizon dorsatum

Mustela rixosa

Mustela erminea

Mustela nivalis

Martes americana

Canis latrans

Citellus undulatus

Ochotna collaris

Marmota caligata

Lemmus trimucronatus

Synaptomys borealis

Clethrionomys rutilus

Microtus oeconomus

Mus musculus

Zapus hudsonius

Sorex cinereus

Sorex obscurus

Sorex palustris

Myotis lucifugus

Population estimates for the above are not available, however the

area has historically supported a relatively large harvest of fur­

bearers, particularly beaver and wolverine. Beavers are active

throughout the region and have a significant impact on the head­

waters of nearly every stream within the system. An aerial count

of active lodges is anticipated as part of an on-going field pro­

gram to be conducted in the fall of 1981.

5-52

c 0 General Sensitivity to Changed Conditions

Populations of large mammals change in response to natural bio­

logic, geologic, and climatic events and in response to human

activities. Pressures from human activities are generally related

to economic development. Direct pressures also occur when hab­

itats are altered or their uses are denied by segmentation or other

means. Habitat may be altered or destroyed by fire, clearing,

logging, road building, or other construction and resource extrac­

tion activities. Segmentation divides a habitat into tracts too small

to be used effectively by a population. The noise and activity

associated with development also may prevent utilization of a

habitat. Many diverse habitat types within the range of a species

may be occupied at least occasionally by a particular species. One

or more of these types termed "critical habitats 11 may be of par­

ticular importance and their extent may limit the population.

Critical habitats may be areas used for denning 1 wintering 1 calv­

ing, or feeding. Use of a critical habitat may vary widely from

year to year depending on a variety of factors. Critical habitats

for many species have been defined.

Denning areas, spring feeding areas, and salmon streams are

probably the most critical habitats for brown bears. Most of the

salmon streams support brown bear concentrations and may be

considered critical habitat during the salmon runs. The future of

the brown bear inevitably will be determined by human encroach­

ment into bear habitat. Within the study area, brown bears prob­

ably are more vulnerable to the secondary effects of development,

especially increased access by hunters and increased incidental

confrontations, than to the more direct modifications of habitat

associated with resource development.

Factors determining black bear mortality are well known, and

hunting and other human activities generally become the major

limiting factors in accessible areas. Loss of habitat to develop-

5-53

(~ ment, loss of access to salmon streams and berry patches, harass­

ment (both intentional and inadvertent) by outdoor recreation and

transportation activities, and the incidence of nuisance bears that

must be destroyed will increase as human populations and bear

populations interface more frequently. Small, discrete black bear

populations may be especially vulnerable to over-harvest. In the

study area, where black bear populations infrequently are isolated

from one another, the bears are less vulnerable to the effects of

human activities. Black bears usually inhabit open woodlands,

avoiding extensive open areas and the larger tracts of dense

forest. Where human contact has not been encouraged, habitat

preference and native wariness permit black bears to withstand

considerable human pressure.

Winter mortality of moose, including deaths associated with star­

vation and losses to predators caused by the weakened condition

of the moose and loss of mobility in deep snow, are the major

factors limiting natural moose populations. Winter mortality is

determined primarily by food availability, which in turn is deter­

mined by competition for the food resources and by the depth,

duration, and hardness of the snow. Adverse winter conditions

first affect the calves, then the cows, and finally the bulls.

Mortality in extremely harsh years may be nearly 100%. Predation

by bears, wolves, and human hunters also may affect populations.

Accidental kills by automobiles may be important locally, and traf­

fic mortality increases when roads and railroads are constructed

through prime ranges or across migration routes. Secondary

effects of development, particularly increased access for hunters,

would have the greatest impact on existing moose populations.

Existing Avian Populations

Little information is available on terrestrial avian populations for the

Beluga area. Ornithological records primarily reflect lists published

by various observers. Year-round populations of terrestrial birds

5-54

c

are represented by relatively few species, including raven, chicka­

dee, redpoll, Canada and Steller•s Jay, magpie, and several wood­

peckers. Species diversity and abundance increase markedly in the

summer. Table 5.8 represents a list of birds which can be expected

to be found in the Beluga region. The list includes year-round resi­

dents, migratory species (excluding waterfowl, shorebirds and sea­

birds) and accidental or occasional sightings. Known nesting sites

(cranes, eagles, swans) based on 1981 field observations are shown

in Figure 5.9. Included in Figure 5.9 are swan and eagle nests

sighted during a June 2, 1981 flight of the Upper Cook Inlet Oil and

Gas Lease Units by personnel of ADF&G.

Nesting habitat (current and potential) will be mapped eventually as

part of an overall habitat mapping scheme. The relationship between

project development and operation relative to adjacent refuge lands

must be carefully considered particularly if the DF&G were to under­

take any enhancement programs to encourage additional summer utili­

zation of the lands.

Amphibians

The. only amphibians known from the region are the rough-skinned

newt, Taricha granulosa, and the wood frog, Ran a sylvatica. The

rough-skinned newt is a relatively large brown salamander (up to 6

inches in length) found near small ponds and lakes throughout the

spruce forests near the coast. The wood frog is a small (up to 3

inches) light brown or gray frog, with a prominent dark eye mask,

found in or near the shallow ponds of both the lowland forest and

wet tundra. Both the rough-skinned newt and the wood frog are

active during daytime (diurnal).

5-55

(\ "-----'-·

Table S.8

TERRESTRIAL BIRDS

Common Name Scientific Name

Goshawk Accieiter gentilis

Sharp-shinned Hawk Accieiter striatus

Red-tailed Hawk ~ jamaicensis

Rough-legged Hawk ~ lagoeus

Golden Eagle Aguila chrysaetos

Bald Eagle Haliaeetus leucoceehalus

Marsh Hawk ~ syaneus

Osprey Pandion haliaetus

Gyrfalcon ~ rusticolus

Peregrine Falcon ~ peregrinus

Merlin ~ columbarius

American ·Kestrel ~ searverius

Spruce Grouse Canachites canadensis

Willow Ptarmigan Lagoeus lagopus

Rock Ptarmigan Lagoeus ~ White-tailed Ptarmigan !..agoeus leucurus

Sandhill Crane ~canadensis

Rock Dove Columba~

Great Horned Owl ~ virginianus

Snowy Owl Nyctea scandiaca

Hawk Owl ~ulula

S/S/F /W = Summer, Spring, Fall, Winter

C = Common U = Uncommon R = Rare + = Casual or accidental

= Not known to occur * = Known or probable breeder

s-ss

Occurrence

S/S/F/W

U/U/U/U * C/U/C/U * R/R/R/+ * R/+/R/+

R/R/R/R * C/C/C/C * C/U/C/R * R/R/R/- * R/R/R/R * U/R/U/R * R/R/R/R "' R/-/R/+

U/U/U/U * U/U/U/U * C/C/C/C * R/R/R/R * C/R/C/- * C/C/C/C * CICICIC * R/+/R/U

U/U/U/C *

c

Common Name

Great Gray Owl

Short-eared Owl

Boreal Owl

Saw-Whet Owl

Rufous Hummingbird

Belted Kingfisher

Common Flicker

Yellow-bellied Sapsucker

Hairy Woodpecker

(\ Downy Woodpecker

Black-backed Three-toed "'-.-~'

Woodpecker

Northern Three-toed

Woodpecker

Eastern Kingbird

Alder Flycatcher

Western Wood Pewee

Olive-sided Flycatcher

Horned Lark

Violet-green Swallow

Tree Swallow

Bank Swallow

Rough-winged Swallow

Barn Swallow

Cliff Swallow

Gray Jay

Steller's Jay

Black-billed Magpie

c~

Table 5.8

Continued

TERRESTRIAL BIRDS

Scientific Name

~ nebulosa

~ flammeus

Aegolius funereus

Aegolius acadicus

Selasphorus rufus

Megaceryle alcyon

Colaptes auratus

Sphyrapicus ~

Picoides villosus

Picoides pubescens

Picoides arcticus

Picoides tridactylus

Tyrannus tyrannus

Empidonax alnorum

Contopus sordidulus

Nuttallornis borealis

Eremophila alpestris

Tachycineta thalassina

I ridoprocne bicolor

Riparia riparia

Stelgidopteryx ruficollis

Hirundo ~

Petrochelidon pyrrhonota

Perisoreus canadensis

Cyanocitta ili!!!!:l Pica pica

5-57

Occurrence

S/S/F/W

R/R/R/R * C/C/C/R * U/U/U/U * R/R/R/R * C/C/C/- * U/U/U/U * +/R/U/·

+/-!+/-U/U/U/U * U/U/U/U *

+1-1-1- *

R/R/R/R * ·/+/+/-

U/U/U/- * ·/R/R/· * R/R/R/· * R/R/R/·

C/C/C/· * C/C/C/- * U/U/U/· * +/+!-!-C/C/C/- * U/U/U/· * R/R/R/R * C/C/C/C * C/C/C/C *

Common Name

Common Raven

Northwestern Crow

Black-capped Chickadee

Boreal Chickadee

Chestnut-backed

Chickadee

Red-breasted Nuthatch

Brown Creeper

Dipper

Winter Wren

American Robin

Varied Thrush

Hermit Thrush

Swainson's Thrush

Gray-cheeked Thrush

Wheatear

Townsend's Solitaire

Golden-crowned Kinglet

Ruby-crowned Kinglet

Water Pipit

Bohemian Waxwing

Northern Shrike

Starling

Tennessee Warbler

Orange-crowned Warbler

Yellow Warbler

Yellow-rumped Warbler

Townsend's Warbler

Blackpoll Warbler

Table 5.8

Continued

TERRESTRIAL BIRDS

Scientific Name

~~

~ caurinus

~ atricapillus

~ hudsonicus

Parus rufescens

~ canadensis

~ familiaris

Cinclus mexicanus

Troglodytes troglodytes

~ mi.gratorius

lxoreus naevius

Catharus guttatus

Catharus ustulatus

Catharus minimus

Oenanthe oenanthe

Myadestes townsendi

Regulus satrapa

Regulus calendula

~ spinoletta

Bombycilla garrulus

Lanius excubitor

Sturnus vulgaris

Vermivora peregrina

Vermivora celata

Dendroica petechia

Dendroica coronata

Dendroica townsendi

Dendroica ~

5-58

Occurrence

S/S/F/W

C/C/C/C * C/C/C/C * U/U/U/U * R/R/R/R *

C/C/C/C * R/R/U/R * U/U/U/U * C/C!C/C * U/U/U/U * C/C/C/R * C/C/C/U * C/C/CI- * U/U/U/- * U/U/U/- * R/R/R/- * R/R/R/- * U/U/U/U * C/C/C/+ * C/CICI- * U/U/U/R * U/U/U/U * R/-/R/R

+/-1-1-

C/C/C/- * U/U/U/- * U/U/U/- * U/U/U/- * R/R/R/- *

c

c

Common Name

Northern Waterthrush

Wilson's Warbler

Red-winged Blackbird

Rusty Blackbird

Brambling

Bullfinch

Pine Grosbeak

Gray-crowned Rosy Finch

Hoary Redpoll

Common Redpoll

Pine Siskin

Red Crossbill

White-winged Crossbill

Savannah Sparrow

Dark-eyed Junco

Tree Sparrow

Chipping Sparrow

Harris' Sparrow

White-crowned Sparrow

Golden-crowned Sparrow

White-throated Sparrow

Fox Sparrow

Lincoln's Sparrow

Song Sparrow

Lapland Longspur

Snow Bunting

Table 5.8

Continued

TERRESTRIAL BIRDS

Scientific Name

Seiurus noveboracensis

Wilsonia pusilla

Agelaius phoeniceus

Euphagus carolinus

Fringilla montifringilla

Pyrrhula pyrrhula

Pinicola enucleator

Leucosticte tephrocotis

Carduelis hornemanni

CardueHs flammea

Carduelis pinus

Loxia curvirostra

Loxia leucoptera

Passerculus sandwichensis

~ hyemalis

Spizella arborea

Spizella passerina

Zonotrichia guerula

Zonotrichia leucophrys

Zonotricha atricapilla

Zonotricha albicollis

Passerella ~

Melospiza lincolnii

Melospiza Melodia

Calcarius lapponicus

Plectrophenax ~

5-59

Occurrence

S/S/F/W

R/R/R/- * C/C/C/- * R/R/R/- "'

U/R/U/R * -1-1+/+

-!-/+/+

U/U/U/U "'

U/U/U/R * R/-/-/R

C/U/U/C * C/C/C/U * R/R/R/R * U/U/U/U * C/C/C/- * U/U/U/U * U/R/U/R * +1-1+1-

+1-1+/­

U/R/U/R * C/C/C/R "'

-!-/+/+

C/C/C/R * C/C/C/+ * C/C/C/C * U/R/U/+ * U/R/U/R "'

IELllfiA LAKE

CAPPS GLACIER

COOK INLET

LEGEND

• BALD EAGLE NEST

• TRUMPETER SWAN NEST

e SANDHILL CRANE NEST

KNONN NESTING SITES (ACTIVE, 1981)

FIGURE 5.9

MARINE ECOLOGY

Intertidal and Shallow Subtidal Habitats

The intertidal and shallow subtidal environments present in upper

Cook Inlet vary significantly from area to area. Figure 5.10 illus­

trates the diverse habitats present along the northwest shore of Cook

Inlet near the proposed project. The intertidal area from the Beluga

River south through Trading Bay contains broad expanses of gravel

and sand as well as extensive mud flats. From the sandy reaches

just south of the Beluga River, the intertidal zone becomes mud to

below Three-mile Creek. Gravel exists at the delta of the Chuitna

River, however mud flats are present north of Tyonek. The gravel

returns south of Tyonek through North Foreland. Mud flats are

again present to just north of Granite Point (Beshta Bay), gravel

with mixed boulders exist at Granite River, and then the area

becomes broad mud tidal flats (Trading Bay) disected by the flow of

Nikolai Creek.

The oceanographic conditions vary significantly on each side of the

inlet, and to a lesser extent on a site specific basis anywhere along

the west side of the inlet. This is a major reason for variations in

diversity of intertidal and shallow subtidal habitats.

0 Mud Flats

The productivity and species diversity on the broad mud flats of

upper Cook Inlet are generally low. In addition, the subtidal

species density and diversity in these areas are also low. The

limiting factors to productivity in areas dominated by mud flats

are the high suspended sediment levels, low light penetration,

and climatic variables. In winter months the surface sediments

freeze during low tide.

5-61

WEST FORELAND

FIGURE 5.10

KEY []J] SAND

~MUD

r:&WIU GRAVEL

.. BOULDER

HABITAT TYPES, COOK INLET SHORELINE

The fauna within the intertidal/shallow subtidal area of mud flats

is dominated by pelecypods (clams), primarily Macoma balthica and

Mya sp., and polychaete worms (Nephtys, Etcone, Potamilla, Spio)

of minor importance, and the clams Clinocardium, the basket

cockle, and Pseudopythina, the common clam. There is substantial

vertical distribution of the faunal assemblages in the mud flats.

Figure 5.11 shows the distribution of the major organisms in the

mud flats.

Predation is strong, with diving ducks, gulls and shorebirds

being the major predators. A number of transient predators also

depend on the infauna. These predators include crab, flatfish,

cottids, and some Pacific salmon. Several migratory bird species

utilize the mud flats, including the western Sandpiper and Dunlins

during spring migratio!l. The Greater Scaup, Old squaw, Surf

seater and Black seater feed extensively on the mud flats in the

winter. A generalized food web for mud flat environments is

shown in Figure 5.12.

Gravel arid Cobble Substrate

The gravel and cobble intertidal and subtidal areas support moderate

densities of gammaride amphipods (Anisogammarus confervicolus) and

the isopod Gnorimosphaeroma oregonensis.

In addition, barnacles (Balanus sp.) and mussels (Mytilus edulis) are

present during spring, summer and fall. They are preyed upon by

nudibranch ( Onchidoris balamellata) and snails (nucella emarginata).

The barnacles and mussels seldom survive the winter and thus are

replaced yearly.

Other important predators include the rock sandpiper, a winter

predator; dungeness crab (lancer magister); helmet crab (Telmessus

cheiragonus); gray shrimp ( Crangon alaskensis ; sand lance

(Ammoclytes hexapterus); Pacific staghorn Sculpin (Leptocotuss

5-63

0

CLINOCARDIUM

FIGURE 5.11 Dl STRIBUTION OF ORGANISMS IN MUD FLATS J

Platichthya

(

Western sandpipers Semi- palmated plovers

c.. ~

()

c=. ~

POLYCHAETES '\ ~~ Nephtya 7i •.,.

Phyllodoce ------

\ POLYCHAEU:S

Pot ami lla Spio

Polydora Eteone

ell

Mya spp

Bacteria

+ Organic Debris

' Plant Materials

C llnocardlum

nuttollil

Zooplankton

. t Phytoplankton

FIGURE 5.12 GENERALIZED FOOD WEB FOR MUD FLAT

Dolly Varden

Juvenile Salmon ids

1

~\ I i

armatus); starry flounder ( Platichthys stellatus); and flathead sole

(Hippoglosgoides classodon).

Granite Point Intertidal and Shallow Subtidal Investigation

A July 1981 investigation of the shallow subtidal and intertidal area

in the vicinity of Granite Point revealed that the benthic community

at all the sampled stations was dominated by the pink clam ( Macoma

balthica). Three transects with three intertidal stations (high, low

and midtide) and one subtidal station were established. The inter­

tidal flats from the airport to Granite Point grades from a fine,

muddy clay near the airstrip to gravelly sand toward Granite Point,

and grades to coarse sand and gravel at increasing distances from

the shoreline. The results of this investigation are summarized in

graphic form in Figure 5.13

Marine Species

0 Fisheries

Fish populations in upper Cook Inlet in clo~e proximity to the

Trading Bay/Beluga River area include anadromous species (salmon

and eulachon), resident species (flounder and sculpin), migratory

species (halibut), and shellfish. Of commercial importance in

upper Cook Inlet are four of the the five species of Pacific sal­

mon. These salmon are also important sport fish.

The five Pacific salmon species found in upper Cook Inlet are:

King (chinook) salmon

Sockeye (red) salmon

Silver (coho) salmon

Chum (dog) salmon

Pink (humpback) salmon

5-66 '

Oncorhynchus tshawytscha

0. nerka

0. kisutch

0. keta

2..:_ gorbuscha

FIGURE 5.13

(\ \ .. )

Transect Transect li'ansect I 2 3

286?7 33'P'"34

GRANITE POINT INTERTIDAL AND SHALLOW SUBTIDAL SPECIES ASSEMBLAGES

The general life histories of the five species of Pacific salmon in

Cook Inlet is summarized in Table 5. 9, as well as under Fresh­

water Fishes and in Table 5.1. Exceptions to these general

features occur frequently. The relationship between salmon and

the freshwater streams in the Beluga area is important in that the

fish use the freshwater streams only to carry on reproductive and

early life stage functions. Adult fish migrate from the marine

environment to spawn and then die. Young salmon (fry) inhabit

the freshwater streams for a short time, migrate to the sea where

they grow rapidly into adults, and return to natal streams to

spawn. Early development may also occur there. Some salmon

remain in fresh water for 2 to 3 years; Dolly Varden may remain

for as long as 4 years.

The different salmon species remain in fresh water varying lengths

of time and also return to spawn at different times of the year.

The general timing of the life history stages for each of the five

species is shown in Table 5. 10. The adult fish migrate to fresh

water, then the female prepares the nest (redd) and generally

spawns with only one male. Several males may be in attendance

but usually only the dominant male will spawn with the female. It

is estimated that early-run spawners deposit approximately 3, 700

eggs each, while late-run spawners deposit approximately 4, 100.

The eggs are covered with upstream gravel, and the females

guard the nest as long as possible but die soon after spawning.

Hatching usually occurs in February to March, depending pri­

marily on water temperature. The alevins (yolk sak fry) remain

in the gravel for 2 to 3 weeks and then emerge as free-swimming,

actively feeding fry. Some fry migrate immediately to the sea,

however, most remain in the gravel areas near stream banks. Few

lakes in the Beluga area are accessible to salmon. Most remain in

fresh water for at least one year before moving out to sea. The

life cycle of the king and silver salmon are illustrated in Figures

5.14 and 5.15.

5-68

Table 5.9

PACIFIC SALMON IN ALASKA-LIFE FEATURES

Time Spent in Fresh Average Average

Water after Time Age at Weight Eggs per Emergence at Sea Spawning of Adults Female

SJ:!ecies of Salmon From Gravel Years Years Pounds Thousands

Chum (dog) Less than 2-4 3-5 8 3.0 1 month

Pink (humpback) Usually less 2 4 2.0 than 1 month

(-', Silver (coho) 12-36 months 3-4 9 3.5

"-----·· Red (sockeye) 12-36 months 1-4 3-6 6 3.5

King (chinook) 3-12 months 1-6 3-7 20 8.0

5-69

(~

Table 5.10

GENERAL SALMON RUN TIMING INFORMATION

FOR NORTHERN COOK INLET STREAMS

Life History seecies Stage* Activit~ Dates

Chinook Adults Enter fresh water May 15 - July 15 Salmon Spawning June 20 - Aug. 15

Juveniles Outmigration Apr. 15 - July 15

Sockeye Adults Enter fresh water May 20 - Aug. 15** Salmon Spawning Aug. 1 - Nov. 15

Juveniles Outmigration Apr. 15 -Aug. 1

Coho Adults Enter fresh water July 10 - Nov. 1*** Salmon Spawning Aug. 1 - Feb. 1

Juveniles Outmigration Apr. 15 - July 15

Pink Adults Enter fresh water June 20 -Aug. 15*** Salmon Spawning July 10 - Sept. 1

Juveniles Outmigration Apr. 15 - June 10

Chum Adults Enter fresh water July 1 - Sept. 1*** Salmon Spawning Aug. 1 - Oct. 1

Juveniles Outmigration Apr. 15 - July 10

* Juvenile chinook, sockeye, and coho salmon are present in streams or lakes. year round.

** Even numbered years.

*** Odd numbered years.

5-70

KING (CHINOOK) SALMON Oncorhync.hus tshawytscha

(WALBAUM)

IFIGURE 5.14 I

5iJI

ADULT MIGRATION TO SPAWNING GROUND MAY-AUG

·.·: ..

t

ewe~ : ......

.···

f'Wiii'i:'"U'&';~~....-:;;:::;~ ~,(,/''' ~~:~c ::~~f.'::.'.":::~::., •• ·····.·.·:

·:.~:;\::':),~~1,::.=:;-::-::·:·: ::.::·::::::::}:!.:{/)::;,'.:··

LIFE CYCLE OF KtNG SALMON I

SILVER (COHO) SALMON Oncorhynchus klsutch (WALBAUM)

FIGURE 5.15

..IUV~NIL~ FISH IN FRESH WATER ITO 2 YEARS

LIFE CYCLE OF THE SILVER SALMON

c: The spawning substrate for these salmon varies somewhat by

species. Silver (coho), pink (humpback) and chum (dog) prefer

a substrate of medium-size gravel, while red (sockeye) prefer fine

gravel or sand and king salmon (chinook) prefer coarse gravel.

Young chinooks and cohos feed mainly on insects, including fly

and beetle larvae and juveniles (dipterous larvae, trichopteran,

and coleopteran juveniles). Other species of salmon fry also serve

as an important food source for the coho. Sockeye feed on zoo­

plankton.

Several factors relative to incubation are important. to the survival

of local salmon populations:

Access to Spawning Sites: Most basic to hatch success is the

ability of migrating salmon to reach the spawning sites.

Freedom from Disturbance: Once the redds are established and

eggs are deposited, disturbance may increase egg mortality.

Predation by Other Animals - Invertebrate organisms that in­

vade the redds or other fish which feed on dislodged eggs are

the major predators.

Diseases: Infection by aquatic fungi increases egg mortality.

Water Quality and Quantity: If the water contains deleterious

chemicals and is not adequately oxygenated, is of unsuitable

temperature, or does not flow properly around the eggs or

larvae, significant mortality results. Proper stream flow,

permeability of gravel, and dissolved oxygen concentrations are

critical to salmon survival. Foreign substances in the water

including siltation of streams has been demonstrated to severely

diminish productivity.

5-73

Other factors such as adequate rearing habitat, food sources,·

holding areas, and spawning habitat are also important.

Dolly Varden (char) are widely distributed throughout Cook Inlet.

They also migrate from the marine environment to fresh water to

spawn. Upstream movement usually begins in late July or August

and continues through November. Spawning usually occurs in

gravelly streams with a fairly stong current. Unlike the Pacific

salmon, Dolly Varden do not die after spawning. Development to

hatching requires about 130 days, and the young remain in the

gravel for 60 to 70 days. Dolly Varden usually spend three to

four years in the creek before going to sea.

Eulachon (hooligan), a small anadromous smelt, is found in abun­

dance in upper Cook Inlet. However, the only known run of

eulachon in the Beluga area is at the Beluga River. Eulachon

runs begin about May 15 and peak toward the end of May. The

eggs hatch in 2 to 3 weeks and the young move downstream

immediately.

Resident marine fish found in upper Cook Inlet are primarily

flounder, sculpin, and cod. Their distribution is widespread,

however their population densities are unknown. They are of

little commercial or subsistence importance.

Migratory marine fish include the halibut, which are primarily

found in lower Cook Inlet ( Kalgin Island and south). Most halibut

winter offshore in the Gulf of Alaska. Herring also can be found

in fairly large numbers in lower Cook Inlet, and are very rarely

found in upper Cook Inlet.

Shellfish, including king crab, dungeness crab, tanner crab,

several species of shrimp, clams, oysters, and scallops are all

found in commercial quantities in Cook Inlet. Most of these shell­

fish are found predominantly in lower Cook Inlet, south of the

5-74

Forelands. Clams, however, are common in tidal flats in upper

Cook Inlet, including Trading Bay.

Commercial Fisheries: Commercially important species of fish in

Cook Inlet include salmon, halibut, herring, shrimp and crab.

The commercial fishing industry (harvesting and processing) is

an important source of income and employment. The yearly and

mean catches for the period 1973 to 1977 of 'the various fish­

eries in Cook Inlet are shown in Table 5.11.

Salmon: The salmon fishery in Cook Inlet is the most important

commercial fishery. There are three distinct Cook Inlet salmon

fisheries, defined by gear type (purse seine, drift gill net,

and set gill net). Upper Cook Inlet areas support primarily

gill net fishing. The salmon harvest in recent years has in­

creased substantially due to improved fishery management,

enhancement and rehabilitation programs. Annual harvest

weight for 1980 was estimated to be 20.4 million pounds (0.224

metric tons), with a real value of $18 million. Harvest projec­

tions for the year 2000 are for approximately- 28.2 million

pounds (12,778 metric tons) with a value of $30.5 million.

The beach area from the northern end of Trading Bay in the

vicinity of Shirleyville to the Beluga River is heavily utilized

by set net fishermen including many residents of Tyonek.

Based on the experience of set net fishermen on the eastern

side of Cook Inlet, construction and operation of dock facilities

has little impact on set net fishing.

Herring: The Cook Inlet herring fishery is primarily a roe

herring fishery. The herring fleet is dominated by purse

seiners whose principal employment is in other fisheries. The

season is concentrated in a few days between May and mid-June

because the roe is of marketable quality for only a very brief

period. The average annual catch is approximately 6. 4 million

5-75

Table 5.11

COOK INLET FISHERIES

1973-19n

Catch in 1,000 Pounds

King Tanner Dungeness !!!!: Salmon Herring Halibut Crab ~ Crab Shrimp

1973 14,418 3,184 3,972 4,349 8,509 330 4,897

1974 10,341 5,389 1,930 4,602 7,661 721 5,749

(-~ 1975 18,045 8,298 3,935 2,886 4,952 363 4,752

'-~' 1976 23,298 9,696 3,418 4,954 5,935 119 6,208

19n 36,012 6,435 3,249 2,027 5,650 76 5,144

Mean 20,443 6,600 3,300 3,764 6,541 322 5,350

5-76

pounds (2,919 metric tons) with a real harvest value of approx­

imately $1.3 million.

Halibut: The Cook Inlet halibut fishery is dominated by a

small fleet which consists of boats that are often primarily

participants in other fisheries, and which fish in protected

waters. Many of these boats are less than 35 feet (10.7

meters) in length. The season is between May and August,

and is broken into several 2-week periods. Harvest weight and

real harvest value of halibut for 1980 are approximately 0.6

million pounds (254 metric tons) and $400,000.

King Crab: The Cook Inlet king crab fishery is dominated by

boats smaller than in many other Alaska crab fleets. The

typical boat lengths are between 25 and 45 feet (7. 6 and 13.7

meters). They generally have a crew of three or four and

participate in the fishery from August through March. The

harvest for 1980 was approximately 3. 7 million pounds (1,667

metric tons) with a real market value of $4.6 million.

Tanner Crab: The tanner crab season is from December

through May, and many of the boats participate in both king

and tanner crab fishing because of the succession of seasons.

The 1980 catch weight was approximately 5.2 million pounds

(2,350 metric tons) with a real market value of $1.9 million.

Dungeness Crab: The Cook Inlet dungeness crab fleet consists

of boats that typically are 26 to 35 feet (7. 9 to 10.7 meters) in

length, and have a crew of two. They participate in the

dungeness crab fishery from May through December. The

annual harvest has fluctuated significantly in recent years,

however, more favorable market conditions are expected to

stabilize the fishery in the future. Catch statistics and real

market value for 1980 are 500,000 pounds (204 metric tons) and

$300,000.

5-77

(' Shrimp: There are two shrimp fisheries in Cook Inlet, a trawl

fishery and a pot fishery. The trawlers range in length from

less than 25 feet to more than 80 feet (7 .6 meters to 24.4

meters), and have a crew of three. They participate in the

fishery from June through March. Although several times as

many boats participate in the pot fishery as in the trawl fish­

ery, the trawl fleet harvests the majority of the annual catch.

The pot boats range in length from less than 25 to 45 feet (7 .6

meters to 13.7 meters). They generally have a crew of two,

and are active throughout the year.

The shrimp fisheries are well developed and have well defined

resources. The 1980 harvest of all species amounted to ap­

proximately 5.6 million pounds (2,540 metric tons) with a real

market value of $1.7 million.

Razor Clams: The Cook Inlet razor clam fishery has been small

and sporadic for a number of years. The latest large harvest

occurred in 1962 when just less than 200,000 pounds (91 metric

tons) were taken. During the five years the fishery was

active between 1969 and 1977, the annual harvest averaged less

than 24,000 pounds (11 metric tons) and the number of boats

in the fishery typically did not exceed three. With the excep­

tion of 1972 when a dredge was also used, the hand shovel has

been the sole gear type. Although increases in resource

abundance, increasingly favorable market conditions, the

development of more efficient types of gear, and improved

programs for the certification of beaches as a source of clams

for human consumption are expected to stimulate renewed

activity in this fishery, the razor clam fishery is expected to

remain an almost insignificant portion of the Cook Inlet com­

mercial fishing industry.

Sport Fishery: The Cook Inlet area supports a diverse and

important sport/recreational fishery. Most sportfishing is for

5-78

(~'

~J

the five Pacific salmon species. The east side of Cook Inlet

(Kenai Peninsula) is the most intense sport fishery, however,

the west side of the inlet also supports a lucrative sport fish­

ery. The primary streams utilized for this purpose are in the

Susitna drainage.

The major streams in the Beluga area capable of supporting a

sport fishery are Nikolai Creek, Chuitna River and the Beluga

River. However, there are no catch statistics concerning sport

fish harvests from any of the streams or rivers in the Beluga

area. Access to these streams would be primarily by float

plane or limited wheel plane traffic. Fish harvested for sport/

recreation are the five species of Pacific salmon, rainbow trout,

Arctic grayling, Dolly Varden, and eulachon.

Sport fish regulations administered through the state Depart­

ment of Fish and Game restrict the number of fish taken within

a 24-hour period. The bag limit for any combination of salmon,

trout, grayling and char under 16 inches in length (or 20

inches for king salmon) is 10 per day. Taking king salmon

longer than 20 inches is limited to one per day with a maximum

of only two in possession. Taking any combination of the other

salmon species more than 16 inches in length is limited to three

per day.

Subsistence Fisher:t: Subsistence fishing is of importance to

the local residents of the Beluga area (Tyonek). Local Natives

use the shoreline of Cook Inlet in the summer and fall to

gather a large portion of the food in their diets. The marine

resources gathered include clams, cockles, and bottomfish. Of

primary importance during the summer months, however, is the

harvesting of spawning salmon and smelts.

Methods of harvesting salmon vary. The primary harvest

methods utilize drift gill net fishing, beach set nets, and seine

5-79

0

net fishing. The drift gill net floats on the water•s surface

and drifts with the tide, intercepting salmon traveling toward

the freshwater streams. Set nets are fished from the beach

and are comprised of a small mesh lead net attached to the gill

net. Salmon encounter the lead net as they swim along the

beach and are led out to the gill net where they become en­

trapped. Leads are permanently anchored to shore. Seine

fishing, although seldom used in upper Cook Inlet, utilizes a

length of net to encircle and trap schools of fish.

Subsistence catch records are not generally available and very

little specific data concerning subsistence fisheries is available

for the Beluga region.

Current marine resource utilization in Cook Inlet is shown in

Figure 5.16.

Birds

Marine birds or seabirds have been defined as birds which,

during some part of their life cycle, come in contact with the

marine environment. This broad definition includes the migratory

waterfowl as well as pelagic species. Primary marine bird habitat

within upper Cook Inlet includes offshore waters (more than three

nautical miles from land), inshore waters (within three nautical

miles of land), steep rock or rubble beaches, sea cliffs, intertidal

beaches, and coastal floodplains such as wetlands.

Approximately 180 species of birds are known to inhabit the Cook

Inlet region. About 105 to 110 of these species are regarded as

being associated with the marine or coastal environment. There is

very little qualitative or quantitative information available for

pelagic and coastal birds inhabiting Cook Inlet, especially in the

Trading Bay to Beluga River region. Non-site-specific information

which is available refers to environment types as described above.

5-80

()

FIGURE 5.16 RESOURCE USE IN THE COOK INLET AREA

.~)

[;::.:._:.~! SALMON DRIFT FISHING

nn SPORT 8 COMMERCIAL CLAM BEACHES

= MAJOR SHIPPING LANE

MAJOR PORTS • OIL PLATFORMS

c

Cook Inlet is a geographical funnel for migrating birds moving to

and from the interior, North Slope, and west coast Alaska breed­

ing areas. The highest bird populations occur in Cook lnlet•s

wetlands during the spring migration period when the area is used

by more than 1.25 million ducks and geese (primarily lesser

Canada and snow), about 25,000 whistling and trumpeter swans,

several thousand cranes, and millions of shorebirds.

Pelagic areas in the upper inlet receive less bird use than areas

closer to the mouth of the inlet. During migration and summer

periods it appears that selected nearshore areas, estuaries, wet­

lands, and bays . receive significant use by waterfowl and shore­

birds.

Coastal wetland areas are important as nesting, resting, and

feeding habitat to several species of birds. Trading Bay is a

prime wetlands area and supports a diverse waterfowl population.

Highest waterfowl populations occur in Cook I nlet•s wetlands in

spring when they are used by several thousand lesser Canada and

snow geese, ducks, and occasional swans and cranes. The fall

build-up of waterfowl in the inlet•s wetlands begins in early

August and peaks in late September. During the fall migration

period about 0. 75 million ducks and geese utilize wetland areas in

Cook Inlet. The fall buildup of waterfowl in the inlet•s wetlands

begins in early August and peaks in late September.

Sea ducks, shearwaters, murres, gulls, puffins, guillemots, mur­

relets, and cormorants are the principal seabirds in offshore

waters. These birds also inhabit inshore waters, where they nest

on sea cliffs or rocky shores. Many of the sea ducks and gulls

nest and feed in the sea beach tidal flat and coastal floodplain

habitats. Geese and dabbling ducks (puddle ducks), and shore­

birds, including black oystercatchers, plovers, snipe, trunstones,

sandpipers, yellowlegs, dunlin, dowitchers, surfbirds, and others,

also nest and feed in these two wetland habitats.

5-82

0

Pelagic areas in Cook Inlet during the winter months appear to

receive comparatively little bird use. During winter months icing

conditions in the inlet, in part, regulate the distrubution of win­

tering birds, i.e., there are fewer birds in areas of moderate to

heavy ice cover. Since icing conditions are usually more severe

on the west side of the inlet comparatively fewer birds would be

present on the west side than on the east side. The most abun­

dant coastal wintering birds were sea ducks, larids, and shore­

birds, with very few alcids present.

Seabirds, sea ducks, and shorebirds generally feed on marine

animals such as molluscs (gastropods, pelecypods, and cephalo­

pods), crustacea (amphipods, schizopods, and copepods) and

several species of fish. Carrion, birds, other marine inverte­

brates and plants are also utilized by several species of birds.

The largest seabird colony in close proximity to the study area is

located in Tuxedni Bay on Chisik and Duck islands about 120

miles (182 km) south of Anchorage and on the west side of Cook

Inlet. Together the bay and islands comprise the Tuxedni

National Wildlife Refuge which was established in 1909 by Execu­

tive Order. Approximately six seabird colonies are located in

Tuxedni Bay, four are located on Chisik Island, one is on Duck

Island, and two are on the adjacent mainland. Black-legged

kittiwakes and murres are particularly numerous in Tuxedni Bay.

Table 5.12 is a list of migratory waterfowl, shorebirds, and sea­

birds which can be expected to be found in the Trading Bay/

Beluga region.

Mammals

Numerous marine mammals inhabit or have been reported in Cook

Inlet, but only a few species inhabit upper Cook Inlet. Harbor

seals (Phoca vitulina) move up and down the west side of the inlet

5-83

Table 5.12

WATERFOWL, SHOREBIRDS AND SEABIRDS

Waterfowl and Shorebirds

Common Name

Common Loon

Yellow-billed Loon

Arctic Loon

Red-throated Loon

Red-necked Grebe

Horned Grebe

Pied-billed Grebe

Great Blue Heron

Whistling Swan

Trumpeter Swan

Canada Goose

Brant

Emperor Goose

White-fronted Goose

Snow Goose

Mallard

Gadwall

Pintail

Green-winged Teal

Blue-winged Teal

Scientific Name

. Gavia immer

Gavia~

Gavia arctica

~ stellata

Podiceps grisegena

Podiceps ~

Podilymbus podiceps

Ardea herodias

Olor columbianus

.Q!2.!: buccinator

Branta canadensis

Branta bernicla

Philacte canagica

~ albifrons

Chen caerulescens

~ platyrhynchos

~ strepera

~ acuta

~£!:!ill.

~~

S/S/F /W = Summer r Spring I Fall I Winter

C = Common U = Uncommon R = Rare + = Casual or accidental

= Not known to occur * = Known or probable breeder

5-84

Occurrence

S/S/F/W

C/U/C/U * U/R/R/U

C/U/C/C * C/C/C/U * C/U/C/C * C/U/C/C * +/+/+/+ * U/U/U/U * C/R/C/R

C/C/C/U * C/C/C/U * C/R/R/+

R/+/R/U

C/R/C/+ * C/-/C/­

C/C/C/C * C/U/C/U * C/C/C/U * C/C/C/R * R/R/R/+ *

Table 5.12

Continued

Waterfowl and Shorebirds

Common Name Scientific Name Occurrence

S/S/F/W

Northern Shoveler ~ clypeata C/C/C/U * American Wigeon ~americana C/C/C/U * Redhead Aythya americana R/R/R/+ * Ring-necked Duck ~~ R/R/R/R

Greater Scaup Aythya marila C/C/C/C * Lesser Scaup Aythya affinis R/+/R/R

Common Goldeneye Buceehala clangula C/U/C/C * Barrow's Goldeneye Buceehala islandica C/C/C/C * Bufflehead Buceehala albeola C/R/C/C * Oldsquaw Clangula hyemalis C/U/C/C *

r Harlequin Duck Histrionicus histrionicus C/C/C/C * ~- Steller's Eider Polysticta stelleri C/+/U/C

Common Eider Somateria mollissima U/U/U/U

King Eider Somateria seectabi lis U/-/U/U

White-winged Scoter Melanitta deglandi C/C/C/C * Surf Scoter Melanitta eerseicillata C/C/C/C

Black Scoter Melanitta nigra C/U/C/C

Common Merganser Mergus merganser C/C/C/C * Red-breasted Merganser Mergus serrator C/C/C/C * Semipalmated Plover Charadrius semiealmatus C/C/C/- * Killdeer Charadrius vociferus R/R/R/- * American Golden Plover Ptuvialis dominica C/+ICI-

Black-bellied Plover Pluvialis sguatarola C/U/C/-

Hudsonian Godwit Limosa haemastica U/U/U/- * Bar-tailed Godwit ~ laeeonica R/-/R/-

Marbled Godwit Limosa fedoa R/-/+/-

Whimbrel Numenius phaeopus C/U/C/-

Bristle-thighed Curlew Numenius tahitiensis +/-/+/-

Upland Sandpiper Bartramia longicauda +1-1+1-

5-85

Table 5.12

Continued

Waterfowl and Shorebirds

Waterfowl and Shorebirds

Common Name Scientific Name Occurrence

S/S/F/W

Greater Yellowlegs Tringa melanoleuca C/C/C/- * Lesser Yellowlegs Tringa flavipes C/CICI- * Solitary Sandpiper Tringa solitaria U/R/U/- * Spotted Sandpiper Actitis macularia C/C/C/+ * Wandering Tattler Heteroscelus incanus C/U/C/- * Ruddy Turnstone Arenaria interpres C/R/U/-

Black Turnstone Arenaria melanocephala C/U/C/R

Northern Phalarope Phalaropus ~ C/C/C/+ *

('' Red Phalarope Phalaropus fulicarius C/R/C/-

Common Sni'pe Gallinago gallinago C/C/C/R "' "'----/ Short-billed Dowitcher Limnodromus griseus C/C/CI- * Long-billed Dowitcher Limnodromus scolopaceus C/-/C/-

Surfb1ird Aphriza virgata C/U/C/U *

Red Knot Calidris canutus C/-/R/-

Sanderling Calidris alba U/U/U/R

Semi pal mated Sandpiper Calidris pusilla U/R/U/-

Western Sandpiper Calidris mauri C/U/C/-

Least Sandpiper Calidris minutilla C/C/CI- * White-rumped Sandpiper Calidris fuscicollis +/-/+/-

Baird's Sandpiper Calidris ~ U/-/U/-

Pectoral Sandpiper Calidris melanotos C/-/C/-

Sharp-tailed Sandpiper Calidris acuminata -1-/RI-

Rock Sandpiper Calidris ptilocnemis C/-/C/C

Dunlin Calidris alp ina C/R/C/U * Pomarine Jaeger Stercorarius pomarinus C/R/C/-

Parasitic Jaeger Stercorarius parasiticus U/C/C/- "' Long-tailed Jaeger Stercorarius longicaudus R/R/R/+

South Polar Skua Catharacta maccormicki -/R/R/-

5-86

(~'

Table 5.12

Continued

Seabirds

Common Name Scientific Name Occurrence

S/S/F/W

Black Oyster-catcher Haematopus bachmani C/C/C/U * Glaucous Gull ~ hyperboreus R/R/R/R

Glaucous-winged Gull ~ glaucescens C/C/C/C * Herring Gull ~ argentatus C/U/C/U * Thayer's Gull· ~ thayeri R/R/R/R

Ring-billed Gull ~ delawarensis R/R/R/R

Mew Gull ~~ C/C/C/C * Bonaparte's Gull ~ philadelphia C/C/C/+ * Black-legged Kittiwake ~ tridactyla C/C/C/U * Sabine's Gull ~ sabini U/R/U/-

r-~. Arctic Tern ~ paradisaea C/C/C/- * (

"------ Aleutian Tern ~ aleutica U/U/U/- * Common Murre Uria aalge C/C/C/C * Thick-billed Murre Uria lomvia R/R/R/R * Pigeon Guillemot Cepphus calumba C/C/C/C * Marbled Murrelet Brachyramphus marmoratus C/C/C/C * Kittlitz's Murrelet Brachyramphus brevirostris C/C/C/U * Ancient Murrelet Synthliboramphus antiguus U/U/U/U * Cassin's Auklet Ptchoramphus aleuticus R/R/R/-

Parakeet Auklet Cyclorrhynchus psittacula U/U/U/- * Rhinoceros Auklet Cerorhinca monocerata R/R/R/- * Horned Puffin Fratercula corniculata U/U/U/R * Tufted Puffin ~ cirrhata C/C/C/R *

5-87

c

(,

as far as and often up the Susitna River. Of the 13 species of

whales reported from Cook Inlet, only the beluga (or white) whale

( Delphinapterus leucas) is found in upper Cook Inlet. While the

sea otter ( Enhydra lutris) populations are reported to be increas­

ing within the inlet, no sea otters have been reported within the

specific area of interest though they have been observed in the

vicinity of Trading Bay and at Ninilchik on the eastern shore of

the inlet.

The following marine mammals have been reported for lower Cook

Inlet in addition to those indicated above:

Northern Fur Seal

Steller Sea Lion

Dall Porpoise

Harbor Porpoise

Sperm Whale

Minke Whale

Callorhinus ursinus

Eumetopias jubuta

Phocoenoides dalli

Phocoena phocoena

Physeter catodon

Balaenoptera acutorostrata

Gray Whale Eschrichtius robustus

Humpback Whale Megaptera novaeangliae

Fin Whale Babenoptera physalus

Pacific Right Whale Balaena glacialis

Sea Whale Balaenoptera boraelis

Stejneger•s Beaked Whale Mescoplodon stejnegeri

Goose Beaked Whale Ziphius cavirostris

Giant Bottlenose Whale Berardius bairdi

Blue Whale Balaenoptera musculus

Northern Pacific White-sided Lagenorhynchus acutus Dolphin

The beluga whale in upper Cook Inlet feed primarily on salmon, both

adults and smelt. The Cook Inlet population of beluga has been esti­

mated to be on the order of 300 to 500 animals and is believed to be

a discrete population. These whales generally feed from the bottom

to mid-water levels and are known to move into the mouths and often

up the mainstem of major rivers (including the Beluga River) to feed

5-88

(~

'--- on outward migrating salmon. In addition to salmon, belugas are

known to eat smelt, flounder, sole, sculpin, lamprey, squid, shrimp,

and mussel. In Cook Inlet, belugas have been reported as far north

as Ship Creek (Anchorage) and the vicinity of Girdwood, pursuing

runs of hooligan.

Reproduction in belugas probably takes place in late May or June

with a 12-month gestation period. The calf generally remains with

the mother for several years following an eight-month lactation period.

In recent years, both the Minke whale and the beaked whale have

been observed in Kenai and Anchorage where, for unknown reasons,

individuals have been beached at low tides.

Trading Bay State Game Refuge

The Trading Bay refuge (Figure 5.17) was established in 1976 to

protect and perpetuate waterfowl and big game habitat. The refuge

is approximately 169,000 acres in size including tidal and submerged

lands as well as uplands. The refuge boundaries border on the

project area in the vicinity of both the proposed town and plant sites

and includes the main stem of Nikolai Creek.

The refuge has been the scene of exploration activities for oil and

gas; is crossed by the Cook Inlet Pipe Line; and portions of the

refuge have been logged by Tyonek Lumber Company. The latter

activity has resulted in bridge crossings of Nikolai Creek and the

Chakachatna River and numerous gravel roads that are still utilized

by the lumber company. The eastern shore of Chakachatna River is

a primary gravel source for commercial development in the area. In

addition, one test water well has been drilled as part of the 1981

field program in the vicinity of the Nikolai Creek bridge crossing.

The DF&G has recently completed (1981) a waterfowl survey of the

Trading Bay area. Nikolai Creek is an important fishery, and the

5-89

FIGURE 5.17 TRADING BAY STATE

·P.. t I -·..: • , .... ~ .~: ~

(1) T~Jwr.ship 9 ~~orth. it.IIHJe 13 '.lest. Sfw.lrd M~rid1.J.n

Sections. f. .. 7 (·:!) !o .. n-,tdp 9 •:or·th, Range 14 '.;e-o;t, St!ward ~l!'rhii.ln

Sc!cthms ! .. 4, E'l 5, d ... Jz. w~ u. 14 ... 11, E'l 19, £\J~22,

·.-L.:t 23, ~"" 27. zs ... Jo (3} 7aw~!Sh1D 9 "tOrth, ~J.nt}e ~5 '..c'it, S~w.lrd !"',~ridilln

~~~t.icn'i ',.'-, 1, 2-4, 9 ... 11, '.fl. 12 Jfld lJ, 14·16, ~9-23,

•• , 14, ::6-28, 31-35 (4} ':"ownshlp 10 •torth, ~J.nge 13 '.;t:st, S~w.1rd Meridi<ln

s.-cions 1-12, 14-12. 28-32 (5) ~C' .. r.o:anip 10 'iorth, '=Jnge U ·.:est, S.t!\oldrf.! f"erldian

s~c:tuns 1·18, E~ 19. 20-21J, 32·36 (6) Tawnsnip 10 .'iorth, C:Jnge 15 West, Scwdrd ~eddian

Soctions 1-12, 1~-23, 25-35 (7) ra .. nship 11 ~lorth, :::Jnge 13 '.;e!at, St!w.J.rd ~!erld;an

Sections S'.."',. 3, 4-10, S'A 11, il1i Sri~• 13, l~-23. ·~. S'..~~ .... ,...,.2 NE~. SE;.,. :t£~ 24, 25~ 36

(9} Ta .... nship 11 North, ::l:an·Jt! ~~-15 \oi~st, S\!wdrd ~~ridian Sections 1-36

(9) T.;wnsh~p !2 ·~orth, ;(ange 13 West, S~wdrd r-'.eridian ~~ctiOr1S 19, 29·33

{10) :a ... nship 12 ::crth, ~'nge 14 'riest, St!ward ~1eridian ~ecticns 23·26. 31-Jj, 36

GAME REFUGE

c area between the Chakachatna River and Nikolai Creek is an impor­

tant moose wintering area. It would appear from the available browse

that the current moose population is far below the carrying capacity

of the land. Swans, sandhill cranes, and eagles nest along the

general stream course of Nikolai Creek. Road access to the Nikolai

drainage makes this area accessible to and important to local resi­

dents of the area.

5-91

upper Capps

c

John's Creek

BELUGA FJELD PROGRAM 1981

rn >­Q)

> ... ::l rn

E «< Q) ... -rn

...... 01 c:

a. a. «< ... -.c rn -

OJ c

\u 0.

!> E ~ - <U

(/)

(1j

"0 ... I

.0 :J (/)

0

Rl=l 11~11 1=11=1 1"'1 POf'"'I0.0/111.A 10~1

(

(/)

>-Q)

> ....

c Cl :J c: (/)

0. E 0. ell I ell

.... Q)

..... .... .....

.r::. (/)

(/)

....

I ...

. :. ~ ~

• ' r ~r "".\

.h •

·- -~ -..- . . -W< ~~- ~-~~

.···: :: :-· .. ' · ~ .. . :~ : .. • .. , __ ~

_, .

c 6.0 CLIMATOLOGY AND AIR QUALITY

CLIMATIC CONDITIONS

The took Inlet area in general is in a transitional climate zone

between the continental climate of the Interior and the maritime cli­

mate more common to the coastal areas farther south. The Aleutian

and Alaska mountain ranges to the northeast of the project area are

effective in preventing the large, extremely cold air masses that

typically settle in the Interior Basin from causing comparably frigid

conditions along the inlet during winters. The Kenai and Chugach

ranges which run in a northeastern direction to the south of the

project area protect the inlet from advection of moist air from the

Gulf of Alaska, and from potentially heavy precipitation. The higher

elevations experience colder temperatures, more precipitation and

stronger winds than the low-lying coastal areas.

The four seasons are not well defined in the region. Winter gener­

ally begins mid-October and lasts until mid-April. Monthly average

temperatures vary between 10° and 30°F during this season. How­

ever, temperatures fall well below freezing, with the possibility of

some inland locations reaching -50°F. The total annual snowfall

ranges between 70 and 100 inches with December, the coldest month,

receiving the greatest snowfall. The difference in expected snowfall

between the inlet shore and the higher elevations of the Capps Field

is probably reflected by the above stated range in total snowfall.

Springtime occurs from mid-April to June when the average daily

temperatures rise from 30°F in April to near 50°F in June. Precipi­

tation is lowest in the spring with monthly averages around 1 inch.

During the summer precipitation increases rapidly. About 40% of the

total annual precipitation falls between mid-July and the end of sum­

mer. July is also the warmest month of the year with the average

daily temperature near 55°F. Autumn is brief, accompanied by a

decrease in precipitation. Most precipitation occurs as rain early in

the season and snow later, although snow may predominate through-

6-1

out the season at the higher elevations. Temperatures also fall

rapidly during this short season; monthly average temperatures for

September· and October differ by 15 ° F.

The bar charts on Figure 6.1 summarize monthly variations in aver­

age daily temperatures, average daily temperature ranges, and pre­

cipitation for the part of the Cook Inlet Basin in which the proposed

project is located. The average values shown should be considered

as generally occurring for the entire area from the plant site to the

coal fields.

These charts are based on isopleth maps prepared by the U.S.

Environmental Data Service from data taken at weather stations asso­

ciated with the National Oceanic and Atmospheric Administration.

Figure 6.2 shows the locations and activities of these stations.

Stations represented by double circles monitor wind speed and

direction, sky cover and cloud ceiling heights in addition to mea­

suring temperatures and precipitation. Knowing these parameters

would make it possible to calculate how much dilution of air pollution

concentrations occurs as a function of the meteorology or atmospheric

conditions. Wind profiles for the Kenai and Anchorage stations indi­

cate that a general wind pattern exists for the entire inlet region.

However, local variations in wind profiles and turbulent diffusion are

expected in the project area due to the effects of terrain roughness.

The rough surface should increase mechanical turbulence allowing for

the atmosphere to be well mixed during periods of high winds. Dur­

ing the winter, winds from the north/northeast are dominant and as

summer approaches the prevailing winds are from the south/south­

west. The annual average wind speed at both Kenai and Anchorage

is approximately 7 mph. Monthly average wind speeds range from 4

to 9 mph at Anchorage. Figure 6.3 illustrates wind roses for Kenai,

Anchorage, and the Phillips Petroleum•s Platform 11 A11 located approx­

imately 5 miles due east of Tyonek.

6-2

AVERAGE DAILY TEMPERATURE

20 ~ ~

15 1-~

10 1-

5 -F0 0

Jan Feb Mar Apr May Jun Jul Aug Sep Oct Nov Dec

AVERAGE DAILY TEMPERATURE RANGE

AVERAGE TOTAL PRECIPITATION

FIGURE 6.1 REPRESENTATIVE CLIMATIC CONDITIONS FOR PROJECT AREA

• e25 DRIFT RIVER TERMIAL

FIGURE 6.2

el6 A

el7 c

• 20 • DILLON EAs-t:·

FORELANo\l

LOCATlONS OF WEATHER MONITORlNG STATIONS

FREQUENCY OF

CALM= PHILLIPS <1°/o ANCHORAGE 13°/o KENAI 10°/o

LOCATION

PHILLIPS PLATFORM

ANCHORAGE

KENAI

OCCURRENCE, N% ~

----~--~25% NNE

ssw s

SYMBOL SEASON

ANNUAL

------ ANNUA.L

ANNUAL

SSE

NUMBER OF OBSERVATION

DATA PERIOD DAYS

74-79 2

51 -60 24

64-70 8

NOTE• KENAI ROSE HAS CALMS DISTRIBUTION BETWEEN THE I- 3 a 4-6 KNOT GROUPINGS.

WIND ROSE I

Observations from the Kenai and Anchorage stations are used to

describe the turbulent structure of the atmosphere. Wind speed,

time of day, cloud cover and cloud ceiling height data are combined

with estimates of the intensity of solar radiation to classify the

atmosphere into one of six atmospheric stability categories designated

by the letters A through F. Stability Class A represents the most

turbulent conditions and is associated with strong solar radiation

input and dominating convective currents. Stability Class F de­

scribes very stable air absent of convection currents. For Kenai,

the annual frequencies of occurrence of the various stability classes

are: Class A - 0%, Class B - 1%, Class C - 10%, Class D - 62%,

Class E - 9%, Class F - 18%. This distribution reflects the rather

common occurrence of cloudy skies (Class D). It also suggests that

the dispersion of contaminants released into the atmosphere will be

controlled most of the year by wind speed and roughness of the

ground surface. This is discussed in more detail in Section 15.0 AIR

QUALITY.

Other aspects of the climatology that should be noted are:

0

0

0

0

0

0

0

Possible sunshine

Sky (cloud) cover (sunrise to sunset)

Mean daily solar radiation

Precipitation greater than 0. 01 inches

Shortest day

Longest day

Heating degree days (base 65°F)

EXISTING AMBIENT AIR QUALITY

Less than 50%, annual average

70% annual average occurrence, 40% annual average full coverage

225 Langleys, annual average

Less than 120 days, annual

5lz hours

191z hours

10,864, annual average total (Anchorage)

National and Alaska Ambient Air Quality Standards set maximum levels

of several pollutants: Ozone, carbon monoxide, surfur dioxide, total

6-6

suspended particulates, hydrocarbons, nitrogen dioxide and lead.

The Clean Air Act as Amended August 7, 1977 (PL 95-95) defines

three classifications for areas which meet these standards: Class 1

areas are considered to have pristine air quality with the allowance

for minimal introduction of additional air pollutants; Class II areas, in

which pollution will be allowed to increase to accommodate moderate

industrial growth; and Class Ill areas which are the most heavily

industrialized. Some areas are specifically defined in the regulations

as mandatory Class Areas (40 CFR 81 Subpart D). The Cook Inlet

Air Quality Control Region is designated a Class II Attainment Area

for all criteria pollutants. The Tuxedni National Wildlife Refuge,

about 80 miles southwest of the project area, is a mandatory Class I

Area ( 40 CFR 81. 402). Anchorage, approximately 75 miles east/

northeast of the proposed plant site, is one of two areas of Alaska in

nonattainment with the ambient air quality standards for carbon

monoxide. The Prevention of Significant Deterioration (PSD) permit

program administered by EPA limits the amount of controlled pollu­

tants which can be emitted by a new source in order to ensure that

the ambient air quality standards are not violated in any area which

could be affected by the new source.

ATMOSPHERIC EMISSION SOURCES

The actual air quality on the western shore of Cook Inlet near

Tyonek is not known. Several sources of emissions of particulate

matter, sulfur oxides, carbon monoxide, nitrogen oxides and hydro­

carbons are scattered throughout the onshore area, with a number of

offshore oil and gas platforms concentrated in the Nikishka/Kenai

area. Nitrogen dioxide emissions are greatest, with products of

combustion representing the majority from both offshore and onshore

pollutant emission sources. The impact of these existing sources on

ambient air quality tends to be very localized with the highest

regional concentrations occurring where source congestion is great­

est. The most congested areas include Trading Bay and Salamatof,

and even in these areas separation between individual sources is good

6-7

(Dames and Moore, 1978). For these reasons, air quality within the

area is expected to be well within the National and Alaska Ambient

Air Quality Standards. These existing sources will have to be con­

sidered in evaluating the impact that new sources would have on

ambient air quality, especially if the new sources are expected to

have their maximum impact to the immediate south of the site.

Visibility is occasionally a problem throughout the inlet area. At

Anchorage, the visibility is one-half mile or less 5% of the time

during December and January, primarily due to fog. The Alaska

Department of Environmental Conservation may, in its discretion,

require any person proposing to build or operate an industrial pro­

cess, fuel burning equipment, or incinerator in areas of potential ice

fog to obtain a permit to operate and to reduce water emissions ( 18

AAC 50. 090). In addition, snowfalls frequently decrease visibility to

less than 3 miles.

6-8

7.0

c/

OCEANOGRAPHY

PHYSICAL OCEANOGRAPHY OF COOK INLET

Cook Inlet is a large tidal estuary in Southcentral Alaska which flows

into the Gulf of Alaska. The estuary lies between latitudes 50° and

61° 30 1 north and longitudes 149° and 154° west. The inlet is more

than 150 nautical miles long and 50 nautical miles wide at the mouth.

At its northern tip Cook Inlet divides into Turnagain Arm ( 43 nauti­

cal miles long) and Knik Arm (45 nautical miles long).

The inlet is bordered by more than 100 square miles of tidal marsh,

found primarily in the Susitna flats at the northwest end and in

Trading and Redoubt bays on the northwest side of upper Cook

Inlet.

For discussion purposes, the inlet is divided into lower, central, and

upper regions (Figure 7.1). The lower division extends from the

mouth to an east-west line from Chinitna Bay to Anchor Point. The

upper region lies north of an east-west line from East Forelands to

West Forelands. Granite Point, the site for the proposed methanol

plant, lies just north of Trading Bay in upper Cook Inlet; the Drift

River Terminal is in Redoubt Bay on the west side of central Cook

Inlet.

The Cook Inlet environment is diverse, and water quality varies

greatly from the mouth of the inlet to the head. The tidal range in

Cook Inlet is one of the largest in the world. The upper portion of

the inlet is a shallow silt-laden basin. At the Forelands the maximum

depth is approximately 75 fathoms ( 450 feet). Below the Forelands,

the bottom slopes to a depth of more than 100 fathoms (600 feet) at

the mouth.

7-1

(FIGURE 7.1 I

LOWER COOK INLET

~~ 'BARREN

ISLANDS

MILES

0 10 20 30 40 50 ---- --- --

(Modified from Peterson and Associates 1971)

DIVISIONS OF COOK INLET I

Tides and Currents

The tides in Cook Inlet are semidiurnal with a marked inequality be­

tween successive low waters. At the mouth of the inlet the mean

diurnal tidal range is 13.7 feet. The range increases to 19.8 feet at

Kenai and 29 feet at Anchorage. At the ends of both Knik .and

Turnagain arms, the tidal range exceeds 35 feet. These mean ranges

·can be exceeded during the spring and fall equinox periods by more

·than 5 feet. The time lag between high water at the mouth and at

Anchorage is about 4.5 hours. It has been estimated that the time

lag at Drift River is approximately 2 hours at low tide and 1. 7 hours

at high tide.

The following tidal ranges are applicable for the central and upper

portions of the inlet. These ranges vary slightly for the Tyonek/

Beluga area.

Table 7.1

COOK INLET TIDAL RANGES

Estimated Highest Tide

Mean Higher High Water

Mean High Water

Mean Tide Level

Mean Low Water

Mean Lower Low Water

Estimated Lowest Tide

KENAI (ft.)

27.0

20.7

20.0

11.1

2.1

0.0

-6.0

ANCHORAGE (ft.)

36.0

30.0

29.0

15.5

2.2

0.0

-4.9

BELUGA (ft.)

21.00

20.40

11.25

2.10

0.0

The extreme tides in the inlet create strong currents. The average

maximum tidal currents range from 1 to 2 knots in lower Cook Inlet,

4 to 6 knots between the Forelands, and 2 to 3 knots near Anch-

7-3

orage. Current direction is determined by bathymetry. Higher

velocities for currents vary within the inlet; however, the high

velocities are associated with flood tides. In the Tyonek area, cur­

rent velocities have an estimated range from 3 to 6 knots.

CIRCULATION

The circulation of waters within Cook Inlet has been extensively

studied. Generally waters from the Gulf of Alaska flow into Cook

Inlet through the Kennedy Entrance between the Chugach Islands and

Cape Douglas. The waters must pass a steep entrance ramp into the

inlet, causing upwelling. The nutrients and plankton from the Gulf

of Alaska are carried into the inlet creating an area of high produc­

tivity in the lower inlet/Kachemak Bay region.

The waters from the gulf move northward along the east side of the

inlet and across the inlet at Anchor Point. Waters also flow into

Kachemak Bay, and eddies are created at the mouth of the bay.

Minor quantities of water move northward past the forelands and into

the upper inlet. Turbid water from the upper inlet mixes with the

clear water from the gulf north of Anchor Point. Because of the

vast difference in the density between waters of the upper inlet and

those from the Gulf of Alaska, lateral mixing is slow. However, the

rapid currents and tidal action keep the waters of the inlet well

mixed vertically. Lateral mixing produces convergence zones in

which denser saline waters flow under less saline waters and produce

rip tides. These rip tides produce considerable horizontal shear.

Circulation patterns and main rip tide locations are illustrated in

Figure 7 .2.

Upper Cook Inlet

The waters of upper Cook Inlet mix with each tidal cycle. This is

due to the large tidal fluctuations and the shallow sea bottom. In

7-4

(

\

' _F_l--1 ---

MAIN RIPTIDE NET SU RFACE CIRCULATION

0

NET SURFACE CIRCULATION

the spring and summer a large amount of fresh water flows into the

upper inlet from major tributaries including the Beluga, Susitna,

Little Susitna, Matanuska, Knik, Eagle, Twenty-mile, Placer, Resur­

rection, and Swanson rivers. The increase in fresh water volumes

causes a net outward movement of upper inlet waters of as much as a

mile each tidal cycle. In the winter, however, when runoff is great­

ly reduced, there is practically no net outflow from the upper inlet.

Middle Cook Inlet

The middle inlet is characterized by saline oceanic water moving

northward along the eastern shore, and the outward movement of

fresh runoff water from the upper inlet along the western shore.

Lateral separation of these waters is maintained.

Lower Cook Inlet

In the lower inlet a vertical stratification of the water masses occurs.

The denser, colder, more saline oceanic waters underlie the warmer,

less saline waters of the inlet. As the inlet becomes shallower to the

north the dense oceanic waters are forced upward and mix with the

inlet waters.

WATER CHEMISTRY

The waters of Cook Inlet change chemical make-up seasonally, due

primarily to variations in the volume of freshwater inflow. During

summer, large quantities of nitrate, nitrite, silicate, and suspended

sediments are carried into the inlet from rivers, streams and other

runoff sources. During the winter, with decreased freshwater in­

flow, there is an increased intrusion of oceanic water, and salinity,

phosphate and ammonia concentrations increase.

7-6

Salinity

The salinity of Cook Inlet varies with the season due to increased

freshwater runoff in summer. During May through September the

increased discharge from rivers and streams and other runoff sources

decreases the salinity of the upper inlet. At Anchorage salinity

·varies from 6 to 15 parts per million (ppm) during the summer. In

the winter, freshwater inflow is reduced and the intrusion of more

saline oceanic waters is evidenced by an increase in salinity. The

salinity of waters near Anchorage in the winter usually is approxi­

mately 20 ppm. At the mouth of the inlet, however, the salinity

values remain relatively constant at 32 ppm. The salinity in the

Beluga/Tyonek area varies between 10 and 20 ppm in the summer

months.

As a result of the increased freshwater inflow, the Alaska current

and the Corio lis effect, the water on the eastern side of Cook Inlet

tends to be more saline than on the western side.

Temperature

The temperature of waters varies with season from below 32° to 60°F

(0° to 15°C) in the upper inlet. The lower inlet is affected by the

intrusion of warmer waters from the Gulf of Alaska and thus the

waters range in temperature from 48° to 50°F (9° to 10°C). During

the winter, the upper inlet loses enough heat to form ice on the

water•s surface and also loses heat throughout the vertical column.

However, during spring, freshwater inflow and warm air temperatures

melt the ice and the water temperature rises.

Suspended Sediments

Discharges of fresh water from the major rivers which flow into Cook

Inlet carry large amounts of suspended sediment. The Susitna River

and other rivers flowing into Knik Arm represent 70 to 80% of the

7-7

total sediment flow into the inlet. As with temperature and salinity,

suspended sediment loads vary seasonally. This is due to the large

amount of glacially derived sediments which combine with sediments in

the summer and fall runoff waters.

In the upper inlet the small-size particles, clays and silt-size par­

ticles are kept in suspension by strong tidal action. The heavier

particles are deposited at the mouths of the streams and rivers. The

distribution of sediments within the inlet is shown on Figure 7. 3.

Concentration of suspended sediments varies within the inlet from

negligible at the mouth to 3,000 micrograms per liter (!Jg/.2) in Knik

Arm. In the Beluga/Tyonek area the concentration varies from 250

to 1,000 !Jg/.2.

Nutrients

Nutrients are introduced into the estuarine environment of Cook Inlet

through both natural and man-made sources. Total concentration of

nutrients is found to gradually increase with distance toward the

mouth of the inlet. Nutrients of importance include ammonia, nitrite,

nitrate, phosphate and silicate. The increase of these nutrients in

the southern portion of the inlet causes an increase in productivity.

Marine biological resources increase dramatically. Low levels of

nutrients associated with high turbidity in the upper inlet are re­

sponsible for the near absence of plankton.

Ammonia concentration decreases northward toward Knik and Turna­

gain Arms, however, ammonia concentrations do not fluctuate season­

ally. Sources of ammonia input to Cook Inlet include oceanic en­

trainment, freshwater inflow, precipitation and man-made sources.

Of these, oceanic entrainment provides more than 80% of the ammonia

in the inlet. Ammonia is used by phytoplankton and is one of the

first elements decomposed by bacteria. Concentration of ammonia in

the upper inlet ranges from 0.5 to 2.0 !Jg/.2.

7-8

FIGURE 7.3

~ ~ ·~ , . . .. ;,

lm:mll GRAVELLY SAND WITH MINOR SILT AND ~ CLAY COMPONENTS

•• SANOY GRAVEL AND GRAVEL

~SAND

BOTTOM SEDIMENTS IN COOK INLET

Nitrite concentration in the inlet varies from 0.02 to 0.52 j.JQ/.2.

There is a gradual increase in concentration seaward.

Nitrate concentration increases from below detectable limits at the

mouth to 23.5 j.lg/.2 near the head of the inlet. The increase in con­

centration can be attributed to higher freshwater inflow, lower bio­

logical activity, and higher municipal waste inputs.

Phosphate-phosphorus concentration ranges from 1 1-Jg/.2 at the ocean

entrance to approximately 2. 3 j.lg/.2 between Anchor Point and Kalgin

Island, then decreases to about 0. 7 j.lg/.2 in Knik Arm. The high

amounts of freshwater inflow at the head of the inlet reduce the

phosphate concentration.

Silicate concentration is directly related to the concentration of sus­

pended sediments and thus decreases in concentration toward the

mouth of Cook Inlet. Concentration ranges from 82 j.lg/.2 near Knik

Arm to 9 j.lg/.2 at the ocean entrance.

Dissolved oxygen saturation levels for Cook Inlet range from 6. 5 to

9. 5 j.lg/.2. These levels may decrease slightly during winter months

in upper Cook Inlet when there is an ice cover. Dissolved oxygen is

necessary for aerobic marine life. Dissolved oxygen saturation value

increases with decreasing temperature and salinity and decreases with

suspended sediment concentration. The high suspended sediment

concentration in the upper inlet also may cause a slight decrease in

the dissolved oxygen saturation level. The high level of turbulence

and strong currents throughout the inlet, however, help maintain the

dissolved oxygen level at or near saturation.

pH values in Cook Inlet vary seasonally and with location. The pH

can vary from 7.7 near the head of the inlet to 8.4 at the mouth.

7-10

(--·--,, ~~j

SEA ICE

Heavy ice normally accumulates in upper Cook Inlet around mid­

December, exists in greatest quantities during the colder months of

December and January, and remnants may be present through mid to

late April. Sea ice in Cook Inlet is found primarily north of the

Forelands and generally moves with the currents southward toward

warmer waters. The extent of the ice coverage depends on the

severity of the winter and the prevailing winds.

Temperature and snow cover control ice growth in the inlet. When

air temperatures are extremely low and snow cover marginal for ex­

tended periods of time, the ice cover will be thicker and more ex­

tensive than usual.

Ice in the inlet takes many forms. Usually the ice is floe ice, which

in periods of extreme I y low ambient temperature and I itt I e or no snow

cover can increase in thickness by as much as 1 inch per day,

forming cakes or pans of ice. The pans have a normal thickness of 2

to 4 feet but may attain thicknesses of 6 to 8 feet under uncommonly

severe conditions. Tidal action moves the pans of ice back and forth

in the upper inlet causing small pieces to break off and form indi­

vidual pieces of stranded ice, called 11 Stamukhi 11• Shorefast ice forms .

in shallow intertidal areas such as tidal flats. Tidal action deposits

large blocks of ice on the beach or along the shoreline. The blocks

of ice then freeze to the underlying mud. These blocks of ice are

exposed to air and submerged with water during the tidal cycle and

build mats of ice, 6 to 10 feet in thickness. Piles of ice may break

off and go adrift during periods of extreme high tide and enter other

ice floes in the inlet. Ice piles such as these can be dangerous to

the smaller ships, tugs, and barges which operate within northern

Cook Inlet.

Sea ice tends to accumulate along the western shoreline of Cook Inlet

due to prevailing winds and currents. Ice formed in upper Cook

7-11

Inlet has a· lower salinity due to freshwater discharges into the inlet,

and would tend to be harder than ice found in lower Cook Inlet and

the Gulf of Alaska. These freshwater discharges also carry large

amounts of suspended sediments of which a large part is glacial

flour. The ice which contains these sediments would tend to break

more easily than ice which doesn•t. This would in part mitigate the

ice hardness due to the lower salinity of upper Cook Inlet.

Ice occasionally causes difficulties with shipping within Cook Inlet.

With the decrease in demand for freight to be shipped during the

winter and the possibility of sustaining damage to the vessel as a

result of impacts with ice flows, most tug and barge operations gen­

erally terminate in upper Cook Inlet from mid-November to late

March. The average tug length in Cook Inlet is approximately 120

feet, and none of the tugs or barges is strengthened for ice condi­

tions.

Though ice must be acknowledged as a factor important to navigation

and berthing of ships in Cook Inlet, it has not caused significant

difficulties to the large vessel trade. Anchorage, at the head of

Cook Inlet where ice accumulation is greatest, is the port of call for

an average of two to three Totem Ocean Trailer Express and Sea­

Land Service Company ships weekly throughout the year, with 15 to

20 Chevron USA ships using the port facilities yearly. These ships

have extra plating to prevent damage due to the ice, with the excep­

tion of the two ships operated by Totem. Totem•s marine manager

feels their fine-line ships have a greater tendency to cut through the

sea ice than do the wider ships. Totem•s vessels have not sustained

damage due to ice floes which has required repair ahead of the

regular maintenance schedule.

Servicing of the many oil platforms within Cook Inlet also continues

throughout the winter months without significant difficulties due to

the sea ice. The Alaska Husky, a 182-foot ship operated by Amoco

Production Company, transports fuel, water, and miscellaneous sup-

7-12

plies to and from two of the three oil platforms nearest Granite Point,

the Bruce and the Anna, twice weekly with little difficulty and with­

out an accelerated maintenance schedule. None of the above com­

panies has ever had a ship cancelled due to the ice in Cook Inlet.

An occasional short delay has been experienced, waiting for the tidal

action to wash the ice from the berthing area for a more facile entry.

Past experience indicates tankers transporting methanol from Drift

River should have no significant trouble with ice in Cook Inlet.

PORTS

There are 6 ports or terminal facilities within the inlet. These in­

clude Seldovia, Homer, Kenai/Nikiski, Ninilchik, Drift River, and

Anchorage. Anchorage, at the head of Cook Inlet, is the most ice­

affected location within the inlet. Anchorage is also the largest of

the ports and is a modern, year-round facility that handles more

than one million short tons of cargo per year. The Nikiski port

handles primarily out-bound petroleum products including crude,

residuum, finished products and liquified natural gas (LNG).

Another major product is urea, which is shipped primarily to Japan.

The ports of Kenai, Homer, Seldovia and Ninilchik are primarily small

boat harbors and support the fishing industry in lower Cook Inlet.

The Drift River Terminal is a single-berth fixed-platform offshore

loading facility which transfers crude oil from the offshore platforms

aboard tankers for transport to refineries.

7-13

8.0 ARCHAEOLOGIC & HISTORIC SITES

A paucity of archaeological investigations in the area requires that an

understanding of the history and prehistory be gleaned from regional

sources of information.

ETHNOHISTORY AND SETTLEMENT PATTERNS

Settlement Patterns

The area is currently inhabited by the Tanaina Athapaskan Indians,

speakers of the Upper Inlet dialect of the Dena 'ina language of the

Na-Dene speech family. Archaeological evidence indicates that the

ancestral Na-Dene moved across the Bering Strait into the present

State of Alaska by the tenth millenium B.C., near the end of the

final great glacial period. They continued to spread east and south

during the period of deglaciation, and diversification of the Pacific

Athapaskan subfamily is considered to have been completed by about

1000 A.D. It is further considered that the earlier inhabitants of the

Cook Inlet area were Pacific Eskimo or their direct ancestors, and

they were occupying the area at least seasonally beginning before

and lasting until after 1000 A. D., with the Tanaina moving into Knik

Arm, specifically, between 1650 and 1780 A.D.

A complex relationship between the people and the land can be de­

scribed for the inhabitants of Cook Inlet. Location along the food­

rich sea coast enabled the fairly settled way of life known as Cen­

tral-Based Wandering: A community that spends part of each year

wandering in the performance of subsistence activities, and the

remainder of the year at a settlement, or central-base. The settle­

ment patterns of the Northern Athapaskans, as well as of the Pacific

Eskimos, also can be characterized by a sedentary seasonal settle-

ments-complex. This is one in which the year is divided into a

winter season during which little resource exploitation occurs and the

8-1

people gather at their winter settlements, and a hunting and fishing

season from the spring to the fall when people are scattered in small

hunting, sealing or fishing camps. In the case of the Tanaina on

Cook Inlet, it is probable that people gathered at the seashore or

riverbanks in concentrated settlements during the fishing seasons or

sea mammal hunting seasons, and in the intermittent seasons task

groups moved about to hunt wild game, trap, etc.

The socio-territorial relationships of historic and prehistoric inhabi­

tants of Cook Inlet can be broken down into three segments. The

local band was a community body resident in one locale, and struc­

tured around family ties. The regional band was oriented toward an

extensive exploitive territory with regard to its biotic resources.

The sites of these resources and routes of access to the sites deter­

mine the stations and movements of various groupings. The task

groups were short-term groupings of people specifically created for

exploitive activities. Task groups formed in the Cook Inlet area

could have been a male trapping pair or trio, a trapping party of a

few families, a moose hunting party or camp, a fish camp, a berry

gathering party, or a trading party. It is apparent that the settle­

ment patterns were determined by and changed according to the

ecological potentiality of the locale, combined with the exploitive

ability of the human occupants.

Dwellings

Aboriginal Tanaina dwellings were characteristic of those of the

Pacific Eskimo, and were also built on Kodiak Island, the Aleutian

Islands, and Prince William Sound. The winter house, known as a 11 barabara 11 in Russian and 11 nichiJI' in Dena 'ina was rectangular, and

semi -subterranean, excavated to a depth of two to four feet. It fits

in the category of the Third Period of Kachemak Bay. The dwelling

which extended 11 five trees long 11 was constructed with split vertical

logs, and had four or five fireplaces and a smoke hole at the top.

To the main part of the barabara, or winter house, one or more

8-2

secondary rooms were added, for sleeping rooms (depending on the

number of families sharing the dwelling), a sweat house, and possibly

a menstrual lodge. These were excavated to the depth of the main

lodge. Floors of the sweat house and sleeping rooms were rough

hewn planks and the remaining floors were spread with grass. A

narrow, semi-subterranean shed served as an entrance way. The

summer houses, used also for fish smoking, were simplified versions

of the winter houses. Excavation was to two feet, length was a

maximum of 20 feet, and three corner posts sufficed.

Petroff (1880) and Porter (1890) report that by 1880 house construc­

tion had changed and a log dwelling erected entirely above ground

replaced the barabara. The dwelling was divided into an outer room

for cooking and rough labor, and an inner room for sleeping.

Secondary dwellings, constructed for short-term use such as on

hunting expeditions, were of various types. The semi-spherical 11 beaver house 11 made of bent alders covered with birch bark or skins

was common. Another type was the lean-to, or one-sided lodge.

This was also constructed from covered alder poles.

Caches

The Tanaina in the Tyonek Upper Inlet area constructed two types of

storage caches. One was an underground cache constructed siffi'i-~!Y­

to the winter house, however the roof was lower and the whole house

was sunken and covered with earth. The caches were generally sit­

uated some distance from the village and the main advantage of this

type was that they could not easily be detected and therefore were

protected from Eskimo raids. At the Kiji k site on the west shore of

Lake Clark west of Cook Inlet, 29 small, deep depressions thought to

have been caches were noted. Storage pit depressions were also

found on the northwestern Kenai Peninsula. The more common log

building, situated on a platform and raised on poles, was also utilized

in the Tyonek area.

8-3

Burial

According to Osgood (1937), the dead, along with their essential

possessions, were disposed of by cremation in the Tyonek area. The

ashes were then wrapped in birch bark and hung in a tree. A

method known to have been used by the Eskimo in Alaska south of

the Bering Strait was box burial. In Tyonek, the dead were also

known to have been cremated and placed, with possessions, in a box

on posts. By 1805 only the rich were cremated, and by the late

1800s, due to Russian influence, cremation was no longer practiced.

Grave offerings continued, however, and burials were frequently in

structures resembling miniature houses.

Hieromonk Nikita visited in 1881 a grave of a former local chief at

Tyonek. A small house in the shape of a chapel, equipped with a

door and a window, had been constructed over· the grave. Inside

the structure was a table, food, clothes, a gun, a razor and other

items, many of European descent, that a wealthy Tanaina would

value. Petroff (1880) also witnessed a burial house at Tyonek filled

with Russian samovars, rifles, blankets and other costly items.

Material Culture

Osgood (1937) states that it is probable that metal working, to the

extent of pounding crude copper into useful shapes, was a custom of

the Upper Inlet Tanaina. Dumond and Mace (1968) concurred that at

least in late prehistoric times copper was used by the Natives in

Southcentral Alaska. Copper objects were attributed to the late

prehistoric sequence at Kachemak Bay, and Captain James Cook re­

ported that the Cook Inlet Natives had spears and knives with copper

blades. Prince William Sound and the Copper River were the nearest

sources of native copper. The Athapaskans of Cook Inlet used to

travel the Matanuska River and cross the 12-day portage to the

Tazlina River where they traded with the Copper River Indians.

8-4

(··~

7

It is a point of conflict whether the Tanaina were producers of pot­

tery. Osgood (1937) reports that the pottery sherds discovered by

Jacobsen at an abandoned village called Soonroodna, on the south

shore of Kachemak Bay, are evidence that the Tanaina had pottery,

and he concludes that they made it themselves. He states, however,

that his informants have no memory of the Tanaina ever having made

pottery. It is considered that pottery users in the Naknek drainage

and on the Pacific were Eskimos. In addition, two gravel-tempered

sherds excavated by Delaguna at Kachemak Bay are thought to

represent the last of the Pacific Eskimos residing there before the

arrival of the Tanaina. In addition, pottery sherds recovered in

1966 at Fish Creek on Knik Arm, which were associated with Pacific

Eskimo occupation were of relatively thick, gravel tempered ware,

globular form, with a rim identical to those from the Naknek drainage

from a time between 1000 and 1500 A. D. Therefore, it can be ex­

pected that there is at least a sporadic occurrence of later pebble

tempered pottery along the shores of Cook Inlet (Dumond 1969), and

it can be concluded that there is stronger evidence in favor of pot­

tery representing the Eskimo culture, than its replacement Tanaina

culture.

The uncovering of a coal labret (lip ornament) at the same Fish

Creek site substantiates the evidence of Eskimo occupation of the

area. Captain James Cook stated that the Tanaina of Tyonek in 1778

used fewer lip ornaments and more nose ornaments than the Eskimo of

Prince William Sound. Nose and ear ornaments were made of beads

and carved bone.

A simple pointed harpoon with blades attached, nine feet one inch

long, was collected at Tyonek. This was utilized for sea otters,

seals and porpoises. A spear-thrower with a hook on the end is

thought to have been used in the area. The bow had a guard and

no sinew backing. Roughly hewn pieces of wood, slightly curved at

the striking end, were used as clubs to kill seals and for dispatching

sea otters after they were drawn alongside the kaiaks with harpoons.

8-5

The aboriginal man•s knife was generally made of stone, two inches

wide, eight inches long, and pointed. The handle was narrowed for

grasping. The woman•s knife was fashioned after the Eskimo ulu 1 a

semi-ovaloid blade of stone set lengthwise in a handle. Adzes were

made from hard stone, and scrapers from beaver teeth, mussel

shells, and stone. No saw-like implements are known.

The foregoing list describes some of those tools used by the Tanaina

Athapaskans of the Tyonek area. Frederica Delaguna•s exhaustive

archaeological investigation in Cook Inlet, particularly in Kachemak

Bay, can offer clues as to what cultural remains might be found in

the study area. Her collection contains a large proportion of stone

objects due to their resistence to decay. Bone and wood objects are

highly susceptible to destruction by salt water. The stone industry

of the early Kachemak Bay culture is characterized by the importance

of chipping. This emphasis subsides as polished slate takes its

place. Notched stones appear in the second period, as do grooved

stones. Stone types commonly found in the later stages are the slate

awl 1 slate mirror and decorated stone lamp.

In the bone _industry, the Thule Type I harpoon head is most impor-

tant in the First Period. In later periods the barbed dart head

replaces it in importance, and incised decorations on bone objects

become more common. The lab ret is found even from the earliest

periods, and the double pointed bird bone awl, bone scrapers, red

shale beads and rectangular bone and shell beads appear in the later

stages.

Pottery and copper are uncommon, and are restricted to the last

stage of the Third Period.

European Contact and Trade

The first documented contact between Pacific Drainage Athapaskans

and Europeans occurred in 1778 when, searching for the northwest

8-6

passage, Captain James Cook sailed into the inlet that now bears his

name. Toward the close of that century other English navigators

visited and traded with the coastal Tanaina.

In 1786 the Russians settled at St. George on the Kenai Peninsula

and 13 years of struggle between various trading companies ensued.

Finally, in 1799 the Russian American Company was formed and

maintained a monoploy. Trade with the Russians was merely an

elaborated form of trade patterns that had been occurring between

the Indians and Eskimos before contact with the Russians. From the

Russians the Tanaina received iron, beads, clothing and furnishings

in exchange for furs.

At the time of the sale of Alaska to the United States, the assets of

the Russian American Company were purchased and the Alaska

Commercial Company was founded. A trading station was established

at Tyonek at that time. The Western Fur and Trading Company also

opened a post north of Tyonek at Ladd near the mouth of the

Chuitna River. Tyonek is considered the earliest permanent settle­

ment on upper Cook Inlet. Petroff reported 117 inhabitants in the

town in his 1880 census report. A post office was opened in 1897.

Gold fever drew hundreds of prospectors to upper Cook Inlet, and

in May 1898, 300 prospectors were reported camping on the beach at

Tyonek. Large boats would go up the inlet in the summer, and

touch at Tyonek. There, people would change to small boats and

dories to reach Turnagain Arm. The Indians were used as guides

and for manual labor.

In 1899, Captain Edward F. Glenn of the Twenty-fifth Infantry com­

manded the Cook Inlet Exploring Expedition which was based in

Tyonek. The goal was to explore, survey, establish, and mark the

trail from Tyonek to various locations. The routes were to be even­

tually made available to the public, and information was gathered

regarding topographical features, feasible routes for railroad con-

8-7

struction, sites for military reservations, the location and condition

of natives encountered, etc. Expeditions were dispatched in the

directions of the mouth of the Tanana River, Sushitna station, Circle

City, and Eagle City.

According to the register of accounts for the Alaska Commercial

Company, 16 types of skins were traded in 1884. The trading sta­

tion's clerks kept a daily diary of events in the town and reported

that there was much travel between towns by the inhabitants, and

game was particularly scarce.

Historic and Prehistoric Sites

DeLaguna (1934) notes four archaeological sites near the study area

(Figure 8.1). The modern·village of Ladd is situated on the ancient

site, Ts'ui ~tna, from which the name of the river Chuit is probably

derived. The town has been called Ladd since 1895, when it was a

trading post and fishing station. Near the current site of Tyonek is

the old village site, Qa ~qesle. In the woods at the top of the hill

behind the village site are the houses where the Tanaina lived for

fear of raids by the Kodiak Eskimo. Old Tyonek is called Ta'naq and

the site of Tsila ~xna is at a small stream south of Granite Point. In

addition, the site of Tobona, meaning 11 people of the beach, 11 is

located two miles south of Tyonek. Californsky's Fish Camp is along

the beach 5~ miles southwest of Tyonek. Located about two miles

southeast along the beach from the Kodiak Lumber Mills camp at

North Foreland is a native cemetary, and on the bluff in front of

McCord's cabin is evidence of prehistoric habitation. One-and-a­

quarter miles inland on a road near the mouth of Tyonek Creek is

Lake Batunglyashi. The lake, according to oral tradition, is the site

of the last Indian war. Located within the modern town of Tyonek

are many historic sites.

Proposed construction would avoid the land located within the bound­

aries formerly designated as the Moquawkie Reservation. The only

8-8

CAPPS GLACIER

/

' ' ' I I

I

FIGURE 8.1

CIRI LANDS

LAKE BATUNGLYASHI

1 1/4 mile inland on a road

CALIFORNSKY'S FISH CAMP

5 1/2 miles SW of Tyonek

NATIVE CEMETRY

(Evidence of prehistoric habitation

f Tyonek Creek

2 miles SE along beach from N. F<U-li~~--------M?-----1

B.H.W. LEASES

TYONEK NATIVE CORP. LANDS·

ARCHAEOLOGIC 8 HISTORIC SITES

c, site that lies outside these boundaries and within the study area is

the Village of Ladd.

ARCHAEOLOGIC SITES

The area of study has been inhabited by two distinct cultures, the

Pacific Eskimo, and more recently, the Tanaina Athapaskan Indian.

Any major excavation in the proposed town or plant sites should be

preceeded by an archaeological reconnaissance to determine the pres­

ence or absence of historic or prehistoric sites.

Dr. James Kari, of the Alaska Native Language Center at the Uni­

versity of Alaska, Fairbanks, has accumulated a vast knowledge of

placenames for the Tanaina territory, many of them located away from

the coastline. It would appear that the Tanaina may have been more

than just coastal dwellers. More than 75 placenames have been iden­

tified in the Tyonek area, thus indicating that there exists a whole

range of sites that are significant either mythologically or historically

to the Tyonek people that cannot be evidenced archaeologically.

Two factors have placed a limit on the possibility of survival of

prehistoric and historic sites in the study area. It has been ascer­

tained archaeologically that the Tanaina Athapaskans were predomin­

antly coastal dwelling people. It is also evident that the violent tidal

action of the inlet has been constantly eroding the shoreline. It is

possible, therefore, that artifacts, or even entire prehistoric settle­

ments situated on the extreme coastline, may have been washed away

by now. This phenomenon has been encountered on the northwestern

Kenai Peninsula. It has been estimated that between 1953 and 1974

the bluff in areas between the North Foreland and Tyonek and be­

tween Ladd and Three Mile Creek had retreated two feet per year.

In addition, the bluff around Granite Point is characteristic of a zone

highly susceptible to erosion. Also, the study area has been crossed

with numerous lumber roads and seismic investigation trails, thus

8-10

· pe.m:>sqo ueaq a/\ell Aew SJ!e.,q :>!JOlS!Ll

pue peAo.nsep ueeq e/\ell Aew sellS lelll Al!J!qeqo.Jd 9l.ll Bu!see.J:>U!

9.0 OTHER FRAGILE LANDS

The Surface Mining Control and Reclamation Act (SMCRA) of 1977

directed the Secretary of the Interior to establish a permanent regu­

latory procedure for surface coal mining and reclamation operations.

The regulatory program is intended to control adverse environmental

impacts stemming from activity in and around surface coal mines.

Although neither the federal program nor state program has been

instituted in the State of Alaska at this time, a surface mining regu­

latory program is imminent and it is assumed it would resemble the

present federal regulatory program. An integral part of the present

federal program is the establishment of criteria for the evaluation of

permit applications to determine if a proposed mine area should be

declared suitable or unsuitable for surface coal mining operations.

None of the criteria deals with the determination as to whether recla­

mation is technologically and economically feasible under the Act.

This is discussed further in the volume of this report dealing with

mining plans. The other criteria deal with compatibility of the pro­

posed mining operation with the following outlined environmental ele­

ments. The remainder of this section discusses each of these ele­

ments with reference to key land management criteria presented in

the federal program.

FRAGILE OR HISTORIC LANDS

Fragile lands, according to SMCRA, are geographic areas containing

natural, ecologic, scientific or aesthetic resources that could be

damaged or destroyed by surface coal mining operations:

Examples of fragile lands include valuable habitat for fish or wildlife, critical habitats for endangered or threatened species of animals or plants, uncommon geologic formations, National Natural Landmark sites, areas where mining may cause flooding, environmental corridors containing a con­centration of ecologic and aesthetic features, areas of recreational value due to high environmental quality, and buffer zones adjacent to the boundaries of areas where

9-1

surface coal mmmg operations are prohibited under Section 522(e) of the Act and 30 CFR 761.

Within these proposed mining areas there are no critical wildlife

habitat areas or endangered or threatened plant species. There

would, however, be a general loss of noncritical vegetation and wild­

life habitat. There are valuable fish habitats in the areas adjoining

the proposed mining locations, however, with proper precautions and

controlled mining activities effects on these streams could be mini­

mized. Due primarily to its inaccessibility, this land currently re­

ceives essentially no recreational use. The local Native population

constitutes the only significant hunting and fishing activities. It is

expected that the proposed mining activities could be conducted

acceptably as envisioned by the federal regulatory program.

NATURAL HAZARD LANDS

Natural hazard lands according to SMCRA means:

geographic areas in which natural conditions exist which pose or, as a result of surface coal mining operations, may pose a threat to the health, safety or welfare to people, property or the en,vironment 1 including areas subject to landslides 1 cave-ins, large or encroaching sanddunes, severe wind or soil erosion 1 frequent flooding, avalanches in areas of unstable geology.

No lands of this type exist within the proposed mine area which

would render a mining operation incompatible with this criteria. The

nearest lands representing this definition would be the unstable

bluffs of the Chuitna River Gorge. Due to natural erosion there are

bluff areas that are subject to periodic slides but the area is suffi­

ciently removed from the mine areas as to not be impacted by mining

activities.

9-2

(' \, '

RENEWABLE RESOURCE LANDS

These are lands in which 11 the mining operations could inflict a sub­

stantial loss or reduction of long-range productivity of water supply

or of food or fiber products . 11 This area is not known as or utilized

for a watershed or a water source. It also would fall outside of the

timber harvest area, as it is at or above tree-line in nearly all loca­

tions. A mine site would not be incompatible with this criteria.

LAND PLANNING

The contemplated mining activity is compatible with existing land use

plans or programs. The proposed mine sites are located in the

second most extensive untapped coal reserve in Alaska. The area

has largely been controlled by the State of Alaska under a leasing

policy encouraging energy development. A portion of the area now is

owned by C I R I Native corporation, which encourages energy devel­

opment through resource oriented policies. Mining operations in the

Chuitna and Capps coal field areas are considered consistent with the

intended land use and industrial development in this area.

9-3

10.0 EXISTING SOCIAL AND ECONOMIC ENVIRONMENT

WEST COOK INLET DEVELOPMENT

Employment Activities and Population

Currently, employment is created by three commercial developments

on the west side of Cook Inlet. These are the crude oil processing

and transportation facilities that serve offshore fields in Cook Inlet,

the Kodiak Lumber Mills (KLM) Tyonek Timber Division chip mill,

and the Chugach Electric Association ( CEA) gas-fired generator sta­

tion at the Beluga gas field. Total regular on-site employment from

these sources is now about 100, although seasonal construction and

maintenance work can increase the work force to two or three times

that number.

There is only a minor residential population outside the Village of

Tyonek, mostly at the Three Mile Creek subdivision near the CEA

power plant and near Granite Point.

In addition to employment associated with the above commercial

development, a few nonlocal fishermen work commercial set net sites

along the west Cook Inlet coast during the six-week salmon season in

midsummer. Also, occasional geophysical work and exploratory drill­

Ing in the area create sporadic local employment.

Granite Point and Trading Bay are landfall sites for submarine crude

oil pipelines that serve several production platforms in Cook Inlet.

At these sites the crude oil undergoes initial processing and meter­

ing. It is then transported by pipeline to the marine terminal at

Drift River where it is stored and loaded aboard tankers for trans­

port to U.S. refineries. The two processing plants and the marine

terminal require a total of about 55 operators. However, summer

maintenance and repair work involve additional temporary labor at

the sites. The work force I ives in dormitories and rotates regularly

10-1

between the facilities and Anchorage. Families do not live at the

processing plants or the terminal.

The KLM chip mill was built in 1975 on land leased from the Tyonek

Indians to process a large volume of timber infested with spruce

bark beetle. At the height of operations, the mill employed 200

people. Currently, however, it is operating year-round with fewer

than 20 people because of a decline in the Japanese chip market.

The work force lives in dormitory and single-family housing at the

plant site. It does not rotate at regular intervals to Anchorage or

Kenai.

The Chugach Electric Association operates a large natural gas-fired

generation facility approximately 16 miles from the Village of Tyonek.

This facility provides the base load generating capacity for the

Anchorage area. It has a regular operations and maintenance work

force of approximately 30 people, but construction and special main­

tenance and repair work cause significant fluctuation in the local

labor force (the dining room capacity is approximately 250).

Land Ownership, Status and Use Restrictions

Land ownership in Alaska is complicated and continuing to evolve.

Land conveyances under the Alaska Native Claims Settlement Act

(ANCSA) and the Statehood Act are not yet complete; and disputes

remain over land rights of the state, boroughs and Natives. How­

ever, these issues have been resolved in the vicinity of the pro­

posed project.

Since ownership is integral with land use development rights, land

use planning questions are also discussed in this section. The De­

partment of Natural Resources, Planning Section, has the authority

to be the lead state agency in preparing an overall land use plan for

the area. The Kenai Peninsula Borough likely would assist in devel­

oping the plan and policies to guide specific actions proposed by

10-2

industry, particularly in regard to land it owns in the vicinity of

the proposed plant and town sites. The land management policies of

C I R I will also be of significant influence on the area because of its

substantial land holding in and adjacent to the project area.

Land Ownership and Status

Major land holdings in the area include ownership of both the sur­

face and subsurface estates. In some cases both rights are held by

the same owner and in others, by different owners. The latter case

produces potential conflicts where revenues obtained from sale of

mining rights are not conferred to owners of surface rights.

Key ownerships in the area are vested in the following state and

private organizations:

State of Alaska

Cook Inlet Region, Incorporated

Tyonek Native Corporation

Kenai Peninsula Borough

Other smaller holdings such as Native Allotments, the Native Village

of Tyonek, Inc., and other Native lands subject to reconveyance

under Section 14(c) of ANCSA are not discussed here.

Blocks of land owned by these organizations are shown in Figure

10. 1, along with subsurface mining leases.

0 State of Alaska

A substantial portion of the Beluga coal district is patented state

land, excluding the Capps Field area that would be developed by

this proposal. These lands were transferred by the federal gov­

ernment under the 1958 Statehood Act (General Grant Lands),

and the 1956 Mental Health Enabling Act (Mental Health Lands,

10-3

(:, 'I,, ()

FIG. 10.1

:\ ' /

EXISTING LAND STATUS

I • I

_j,l, I Cook Inlet Region~ Inc. (CIRU I

~---.---.---,----,.----,--,f--1--- - --.---.-----.---..---.-----.--r---'--r-- "+---·- _..,.._ - -~- --..-~--+-----t--1 _-- --t

--4--f---t--l-- =-C+Ih __ l_ --+-

Trading Bey 4 a

0

providing a State General Fund revenue base on which to meet

needs of the Mental Health Program). In 1978 the state redesig­

nated Mental Health Lands to General Grant Lands, to allow mun­

icipalities to select land, of which not less than 30% is to be dis­

posed for private ownership. This redesignation does not affect

any prior leases, permits, or easements. The redesignation also

allows the state to dispose of lands to private parties more easily

than was possible under its status as Mental Health Lands. The

third major category of state lands on the west edge of the dis­

trict is the Trading Bay State Game Refuge, established in 1976.

The state Department of Natural Resources (DNR) classifies Gen­

eral Grant Lands and tidelands in this vicinity into one of four

categories: Resource Management Lands, Industrial Lands, Re­

served Use Lands, and Material Lands. This system describes a

capacity for use or multiple use which can be modified for the

public interest. Once lands have been classified, they may be

disposed (by lease, sale, grant or exchange) to municipalities or

private parties.

Resource Management Lands

Most of the state land in the Beluga coal district is classified as

Resource Management Lands, portions of which are in the follow­

ing uses: coal prospecting and leasing, mining permits, timber

sales, and oil and gas leasing. Two Placer Amex leases and the

Bass-Hunt-Wilson (BHW) lease are located on Resource Manage­

ment Lands (the Capps Field is located on land owned by CIRI).

Kodiak Lumber Mills is authorized to harvest timber from 223,000

acres until August 1983. About 6 million board feet of spruce­

beetle-infested trees are to be harvested. Numerous primary and

secondary logging roads have been built on state, C I R I, and TNC

land in the area in association with these activities under author­

ity of 20-year leases between Kodiak Lumber Mills, C I R I, and

10-5

0

0

0

C-

Tyonek Native Corporation and the state. No public rights-of­

way are associated with these logging roads.

The Trading Bay State Game Refuge is a separate category from

Resource Management Lands. Established by the state legislature

in 1976, this refuge and the Susitna Flats Game Refuge east of

the Beluga coal district are managed by the state Department of

Fish and Game (DF&G). Pre-existing rights-of-way for roads and

pipelines are excluded from the refuges, and will become part of

the refuges when permits or applications expire.

Industrial Lands

Specific facilities such as the CEA power plant near Tyonek are

operated as Industrial Lands, subject to Kenai Peninsula Borough

building and zoning codes. These sites may only be used for the

designated purposes. Most of Sections 27 through 30, T11N

R12W, including tidelands along Trading Bay are also classified as

Industrial Lands.

Reserved Use Lands

Reserved Use Lands are set aside for such public uses as expan­

sion of town sites and new town sites. Small sites in the Beluga

area are being used for creek access, barge landing sites (e.g.,

Beluga River), ard other DF&G requests.

Material Lands

Material Lands are administered by the DN R to sell sand, gravel

and other materials located on state-owned tidelands and uplands.

The Department of Natural Resources can influence the location of

coal port and transshipment facilities through its ownership of

tidelands. The state land in the Beluga area which was trans­

ferred to C I R I or TNC includes sand, gravel and other materials

as part of their estate.

10-6

c)

0

0

The DN R will have an important role in guiding coal-related de­

velopment because of its management responsibilities for extensive

state holdings in the area. In addition to its aforementioned con­

trol of tidelands and surface minerals, DNR also regulates tem­

porary access and rights-of-way across state land and the appro­

priation and use of surface water and groundwater. It will ulti­

mately prepare a land use plan to guide the department in reclas­

sifying state land for the proposed project.

Cook Inlet Region, Inc. (CIRI)

The regional Native corporation holds both surface and subsurface

title to much of the inland area of the Beluga coal district. The

Placer Amex Capps lease is within this area. Cl Rl also owns

approximately 3,000 acres adjoining and including a portion of the

proposed plant site. As a profit-oriented corporation, C I R I is

encouraging coal development in the area. It was granted a 300-

foot wide, unspecified location right-of-way easement to connect

its holdings in the Capps Field to the beach at the eastern edge

of Trading Bay. The corporation also holds subsurface rights to

the land whose surface rights are held by the Tyonek Native

Corporation.

Revenues from subsurface development rights are distributed to

stockholders of C I R I, TNC, and other Native corporations.

Tyonek Native Corporation (TNC)

Tyonek Native Corporation, the village corporation created under

ANCSA, has surface title to the 27 ,000-acre former Moquawkie

Indian Reservation, as well as other lands north of the Chuitna

River. Its claim to about 11 sections of state land north and

west of the Chuitna River (known as the Moquawkie Reserve

Lands) is in litigation.

10-7

0

Potential developers in the area negotiate with TNC for surface

use and with Cl Rl for subsurface use of the TNC lands. TNC

has leased land to Kodiak Lumber Mills for the chip mill.

Tyonek Native Corporation is opposed to rights-of-way and ease­

ments across its lands (DCED - Land Tenure, 1978). After pas­

sage of the ANCSA in 1971, the village corporation attempted to

obtain title to its former Moquawkie Reservation lands, but ob­

jected to the number of public easements proposed by the federal

government. Easements are discussed later in this section under

Transportation and Power Infrastructure.

Kenai Peninsula Borough

The borough owns eight sections of land that include most of

Congahbuna Lake (with the exception of State Special Use Lands

immediately around the lake, and a smaller lake to the east).

The proposed construction camp site and a portion of the pro­

posed transportation corridor are located on borough land. This

area also has been considered as a possible alternative town site

for a permanent community. The borough has not yet developed

policies on lease of its land for industrial or community develop­

ment (Battelle, 1979).

Land Development Planning Authority

In addition to the management responsibilities associated with land

ownership described above, other governmental and private corpora­

tions have jurisdiction over land use in the area. This section dis­

cusses these responsibilities with particular reference to control of

land use and transportation access.

Agencies and organizations which will guide development in the

Beluga coal district, in addition to those discussed above include:

10-8

0

0

0

Governor•s Coal Policy Group

State Beluga Interagency Task Force

Kenai Peninsula Borough

Village of Tyonek, Inc.

Governor•s Coal Policy Group

This cabinet-level group will provide the governor•s office with

recommendations in three areas: possible royalty and severance

taxes on mining (none exist at present); state response to indus­

try requests to provide infrastructure; and land reclamation.

The governor will review coal policies with industry before adop­

tion. Legislation may not be required. For example, the Alaska

Industrial Development Authority may be a logical state instrument

for provision of certain infrastructure. This public corporation

assists in providing low-interest loans for industrial projects.

Beluga Interagency Task Force

This technical group is responsible for assisting the governor•s

policy group on energy development in the Beluga area. At

present it is primarily an interagency informational forum. It is

chaired by the Department of Commerce and Economic Development

(supported by its own Division of Energy and Power Development)

and includes departments of Environmental Conservation, Natural

Resources, Community and Regional Affairs, and Fish and Game,

as well as the Office of the Governor Division of Policy Develop­

ment and Planning (DPDP). The Department of Community and

Regional Affairs will address issues of public facilities and serv­

ices with respect to possible town site development.

Kenai Peninsula Borough

Overall planning and zoning responsibility for the Beluga area

rests with the Kenai Peninsula Borough. Although no specific

10-9

0

land use plan has been developed, its Draft Coastal Management

Plan (September 1978) proposes a special management district and

recommendations for the area. Development within this district,

or Area Meriting Special Attention (AMSA), could be governed by

a comprehensive development program. The proposed program

would be coordinated with state and other agencies and approved

by the Alaska Office of Coastal Management. At this time, how­

ever, the status of the coastal development planning for the bor­

ough is in doubt. The borough assembly adopted a resolution to

rescind the state act on which the plan is based, and there is no

apparent schedule for finalization of the draft plan.

Eventually, borough involvement would include reviewing plans

for town site development including zoning, subdivisions, schools,

solid waste and other permits. Only subdivision review is now

required in the Beluga area, entirely designated as 11 unrestricted 11

use in its Comprehensive Plan. The Tyonek Village Council be­

lieves borough planning, zoning and subdivision authority does

not extend over any activities in the vicinity of its land (Battelle,

1979).

Tyonek Village Council (Native Village of Tyonek, Inc.)

The village tribal council is the federally chartered local govern­

ment of Tyonek. Its influence over development on Native lands,

however, extends beyond the village itself.

With passage of ANCSA, the Moquawkie Indian Reservation was

extinguished. Tyonek Native Corporation now has surface rights

and Cook Inlet Region, Inc. has subsurface rights within the

former reservation. Generally, the council represents residents

of the village when they feel that policies of TNC and C I R I don•t

necessarily represent the interests of the people of Tyonek. In

particular, the village council believes it still can control access

to lands within the former reservation which TNC and Cl Rl might

10-10

want to see developed for profit. Regardless of legal authority,

TNC has deferred to the village council on local land management

questions, particularly in the immediate vicinity of the village.

Additional discussions of community governance, life-style and

attitudes on industrial development are provided later in this sec­

tion under TYONEK VILLAGE.

Transportation and Power Infrastructure

Some existing roads in the area would be improved to serve a por­

tion of the project, with some extensions required to the mine and

dock· locations. The existing airstrip at Granite Point probably would

not be used except during very early stages of project start-up.

The existing KLM chip mill dock at the North Foreland is too distant

to conveniently receive heavy cargo, and probably would not be

available for general use.

0 Existing Roads and Easements

A network of gravel-surface logging roads crisscrosses the area

between the Capps Glacier and the coast. Of the approximately

100 miles of primary and secondary roads, the main logging roads

extend about 16 miles northwest of Congahbuna Lake, to within

eight miles of the Capps Field (Figure 10.2).

These roads were built to serve K LM timber harvest agreements.

No public right-of-way is allowed on these roads. Agreements

exist between KLM and the state for use of logging roads on

state land west of TNC land. The timber harvest agreements

on TNC land expire in 1983, when timber harvests are expected

to terminate altogether (DCED - Transportation, 1978).

A 27~-mile, 300-foot wide unspecified location transportation cor­

ridor easement between the Capps Field and the eastern edge of

Trading Bay has been granted by the State Department of Natural

10-11

() ···~

() \''' ,~/

()

FIG. 10.2 EXISTING ROADS AND EASEMENTS

Cappe Field Main Road•

1111111111111111 300 tt Floating Tranaportatlon Eaaement

Road and Utllltl•• Eaaemenh and Pipeline•

--+--1---- --1---1--1---+--1 ---l----1----l---- ---

Mil .. ~ Trading Blil'lf N

0

Resources, on land obtained by CIRI. Portions of the existing

logging roads may fall within this easement.

Other road rights-of-way include section line easements on all

state land or land transferred to others by the state. Although

section line easements do not necessarily allow for access due to

topographic constraints, they do allow for public right-of-way

access across the land. These easements allow for a 100-foot

right-of-way between sections.

At the request of TNC, no section line easements or other ease­

ments for transmission lines, rail lines, or roads exist on TNC

land. Thus any new road, rail or power line proposed between

the project area and the Beluga area or east to developed por­

tions of the Matanuska-Susitna Borough which passed through

TNC land would probably be very difficult to obtain, given the

present position of the corporation. Plans for the C I R I /Placer

Amex project do not anticipate a need for any such easements. A

65-mile road connection between the coal district and Wasilla, and

an equally long rail connection between the district and the

Alaska Railroad near Houston, have been discussed, although

neither is anticipated for this project.

A 200-foot development setback and a 1 00-foot recreation easement

are in effect along the Chuitna River and other streams (outside

of TNC land). These easements were established by the state

DNR, Division of Lands.

With respect to obtaining access across C I R I or state land in the

project area, no difficulties are anticipated. The DN R reviews

right-of-way applications on state land.

Airports

There are no airports with a capacity to handle landings of heavy

cargo planes in the immediate project vicinity. Airstrips which

10-13

0

c

could be used in early stages of project development include the

beach strip at Granite Point and two 900-foot strips at Capps

Field. The Granite Point airstrip is about 3,500 feet in length,

with a gravel surface.

The closest airport with a good surface and landing lights is the

3,500-foot Tyonek Airport. Like other privately owned airstrips

in the vicinity, the Tyonek Airport is restricted to planes with

prior landing privileges. The village tribal council in Tyonek

wishes to control visits by planes to the village in the same way

the village corporation, TNC, wishes to restrict road access

across its lands.

Docks

The only dock near the proposed project with the potential for

use during early stages of project development is owned by

Kodiak Lumber Mills and is located 7 miles northeast of Granite

Point at the North Foreland. This dock is 1, 466 feet long, with

685 feet of berthing space at a mean low water depth of 36 feet.

The largest ship to dock at North Foreland was 601 feet long and

45,000 metric tons (Battelle, 1979). Use of the dock would re­

quire permission, not only from Kodiak Lumber Mills, but also

from Tyonek Native Corporation for use of the existing road

across TNC land to the project area.

The dock that is proposed to receive and ship the methanol is

located approximately 40 miles southwest of the proposed project

area on the west side of Cook Inlet near Drift River. This facil­

ity, the Cook Inlet Pipeline Drift River Terminal, includes a

single-berth fixed-platform offshore loading facility that will

accommodate up to 70,000 DWT tankers. This facility will accom­

modate a maximum 810-foot LOA vessel. This facility is further

described in Volume II of this report in the section on pipe

transportation and ship loading.

10-14

0 Power

The closest power source to the proposed plant and town sites is

about 16 miles northeast at Beluga. This gas-fired plant owned

by Chugach Electric Association supplies power to the Village of

Tyonek, the KLM chip mill and others, via a transmission line

near the coast.

Kenai Peninsula Borough Services

The entire project area lies within the Kenai Peninsula Borough, but

is isolated from the other borough settlements by Cook Inlet.

Under state law, boroughs exercise powers within their jurisdictional

boundaries, both inside and outside of home rule and general law

cities. Borough powers extending to the project area include educa­

tion, planning, platting and land use regulation, and air and water

pollution control. Borough service areas can be established for un­

incorporated areas to provide public safety, solid waste or other

services.

The only existing school serving the area is the Bob Bartlett School

in Tyonek (discussed later in this section under Community Facilities

and Infrastructure). The borough builds schools, establishes cur­

riculum (with local input) and hires teachers. Although the school

operating budget is a local responsibility, 50% of operating costs

were paid by the state last year. It is not known if state funding

will continue. Under a bill likely to pass the 1981 Legislature, all

local school construction debt (rather than the current 80%) would be

paid by the state. The borough would continue to bond for school

construction and would be reimbursed by the state. The proposed

legislation forbids 100% reimbursement for such special facilities as

swimming pools, hockey rinks and teacher housing.

10-15

Planning and zoning and subdivision powers are provided on an

areawide basis. The borough establishes a planning commission

which prepares a comprehensive plan and/or plans for incorporated

cities. Theoretically, the borough could prepare the comprehensive

plan for a new town at Beluga if the town became an incorporated

first- or second-class city. In practice, this is unlikely because the

Kenai Peninsula Borough intends to transfer planning and zoning

powers to cities, while retaining control of platting, subdivision

approval and transportation facilities.

The borough may collect property, sales and use taxes levied within

its boundaries. Taxes levied by an incorporated city shall be col­

lected by the borough and returned entirely to the city. The Kenai

Peninsula Borough is proposing a July 1981 - July 1982 budget with

a 2.5 mill rate. If increased state funding of schools is not forth­

coming, the borough mayor estimates that a 1 mill increase could be

required (Atkinson, 1981). At the same time, municipal assistance

grants of $1.4 million authorized by the state for next year would

allow the borough to end personal property tax (on boats, cars, air­

planes, etc.) and reduce real property tax.

Other West Cook Inlet Coal Development

Another coal development project in the Beluga area is coal export

from leases held in the Chuitna. Field by the Bass-Hunt-Wilson (BHW)

venture. The BHW leases are shown in Figure 10.1. Development

plans prepared in April l980 (Bechtel, 1980) suggest production of

7. 7 million short tons of coal per year, shipped via a deepwater port

at Granite Point to Far East and West Coast destinations. Associated

facilities include a town site within the lease area for 1,300 personnel

and a conveyor or rail system to carry the coal to a tidewater stock­

pile.

A 7, 700-foot wharf would be built to channel depth for 100,000 DWT

carriers. Alternatives to the Granite Point location include a new

10-16

8,000-foot wharf near the village of Ladd, about 12 miles southeast

across TNC land, or use of the existing 3,500-foot wharf owned by

Kodiak Lumber Mills, Inc.

A six-year time frame from engineering to commencement of mining

operations was envisaged in the April 1980 feasibility report, al­

though its schedule for development may be adjusted in light of an

agreement establishing a joint venture to develop the BHW lease. In

an agreement approved by the state DNR in August 1981, the Dia­

mond Shamrock Corporation joined with BHW leaseholders for the

purpose of developing engineering, marketing and mining plans for

the coal field. The venture is to be managed through Diamond

Alaska Coal Company, a wholly owned subsidiary of Diamond Sham­

rock.

The BHW operations are largely independent of those planned by

Cl RI/Piacer Amex. Town site, dock and transportation concepts

currently are completely separate. As these projects reach advanced

planning stages, it is expected that the owners will explore ways

these infrastructure facilities can be shared to reduce capital costs.

TYONEK VILLAGE

Background

Tyonek is the only settlement on the west coast of Cook Inlet. It is

a long-standing community of about 270 Tanaina (Athapaskan)

Indians. The village and 27,000 acres surrounding it were with­

drawn as an Indian reservation in 1915. However, the residents of

the village voluntarily surrendered the reservation status of their

land to participate in the land selection benefits of the Alaska Native

Claims Settlement Act of 1971.

10-17

Like other Indian villages, Tyonek was a traditional community ori­

ented to seasonal subsistence pursuits. When opportunities for

commercial trapping and fishing developed in the twentieth century,

villagers participated in them to the extent the local resource base

would permit. Thus, the fortunes of the village were tied to the

cyclic fluctuations of fish and game. Poverty and the threat of

starvation were ever-present. In the winter of 1955, an emergency

airlift of food was necessary to save the villagers from famine.

Housing and living conditions generally were substandard, like. those

of numerous other remote Native villages in Alaska.

The life-style of Tyonek was radically altered in 1964 when the vil­

lage received $12.9 million in bonus bids for the competitive sale of

oil and gas leases on its land. The money was used to upgrade vil­

lage housing and community facilities, and to invest in Anchorage

real estate and other commercial ventures.

Tyonek•s sudden prosperity did much to improve the living condi­

tions of village residents, but it caused new stresses within the

community and did nothing to solve familiar problems of culture

change faced by Tyonek residents. The oi I revenue replaced the

remaining physical vestiges of traditional village life, but provided

no new spiritual or cultural substance.

Thus, the 11 identity crisis 11 of the Tyonek villagers, caught in a con­

flict between the values and life-styles of traditional Indian and

modern white societies, was exacerbated by the oil lease windfall.

The history of Tyonek 1s investment activities is long and often un­

happy. Exploratory drilling failed to discover oil in commercial

quantities, so a steady stream of royalty income has not supple­

mented the one-time bonus bid lease payments. Financial setbacks

and reversals have plagued the Tyoneks, so that early investments

do not now provide a continuous source of direct support or indirect

subsidy to village residents.

10-18

Both Braund and Behnke (1980) and Battelle (1979) report that the

Tyonek village residents are suspicious of outsiders and prefer to

have non-Natives avoid the village. The presence of non-Natives in

the vicinity of the village is discouraged, especially if it involves the

attendance of non-Native children at the Tyonek school, which

occurred during the height of the chip mill operation.

Community Facilities and Infrastructure

Tyonek 1s facilities adequately serve the needs of its approximately

270 residents. Compared with many Native villages in Alaska,

Tyonek has good housing, water and sewer systems and educational

and health facilities. A substantial portion of the $12.9 million lease

sale revenue was used to improve village living conditions (Battelle,

1979).

0 Housing and Utilities

Lease revenue was used to provide a new house for each family in

Tyonek. Fifty-nine prefabricated, one- to five-bedroom units

were barged from Seattle. Today there are about 60 frame dwell­

ings and six mobile homes. All homes are owned by the Native

Village of Tyonek, Inc. Many of the ranch-style prefabricated

units have not stood up well to Alaska conditions and are in need

of new insulation and rehabilitation. Twenty-seven HUD-financed

houses were planned for construction in 1979, but additional

housing for those wanting their own homes is still needed.

Village homes are heated by electricity, which is provided free by

Chugach Electric Association under an agreement which will expire

when the village has used a total of 50 million kilovolt hours

(about 1982-1984). Then homes will be converted to oil-fired

furnaces to use fuel purchased from Kodiak Lumber Mills (Bat­

telle, 1979). Because of past power failures and fuel shortages,

some residents wish for a return to wood heat.

10-19

0

The Kodiak Lumber Mills camp, located about two miles from the

village, has six 20-person bunkhouses, five 3-bedroom modular

homes, about 12 trailers and six duplexes -- capable of accommo­

dating a total of about 200 people.

Oil lease money also provided funding for new gravel roads in

Tyonek and a village water system. Roads are laid out in an

orderly fashion to accommodate additional housing development. A

lake water source was developed in 1976 after a high iron content

was found in well water. The new system has apparent problems

with chlorination, and a low lake level in winter. The Public

Health Service is investigating alternative water sources.

Wastewater disposal is by septic tanks and cesspools. Some of

the steel septic tanks installed in 1965 are rusting. Soils are

gravel base and are adequate for subsurface disposal.

The village has a community building which houses a store, shop

facility, guest house, medical center, and the village offices.

The town also has a gas station.

Education

The village school is the one facility which some village residents

feel they have the least control over. They fear that children of

coal field and plant workers might attend their school in large

enough numbers to make Native children a minority in the school.

The Bob Bartlett School, serving grades K -12, is financed and

managed by the Kenai Peninsula Borough School District. Enroll­

ment is about 100 students, and capacity is about 240 students.

The school has four regular classrooms, a home economics unit,

and a portable classroom. There are 10 full-time teachers, who

move in to teach temporarily. Two local residents provide sup­

plementary education in cultural affairs, funded by the federal

10-20

0

Johnson-0 1Malley program. The amount of funding is keyed to

the number (not proportion) of Native students in the school.

The Native Village of Tyonek oversees the program.

The borough school board would determine whether students from

families employed by this proposed project would attend the

Tyonek school. When the KLM chip mill was in full operation,

about 20 students were bussed to the village to attend the school.

In deciding how best to meet the educational needs of all stu­

dents, the board wou.ld consider the wishes of Tyonek residents

in light of districtwide program requirements and funding.

Public Safety

The Alaska State Troopers provide public services outside of

incorporated cities. A constable serves Tyonek, the chip mill,

and the oil and gas facilities at Trading Bay. He is based at the

Beluga power station. Tyonek has no plans to incorporate as a

second-class city.

The addition of a full-time officer is not expected until population

increases justify it in another 10 or 20 years. Additional staff

can be added on a short-term basis to meet seasonal needs. In­

dustry can also be expected to provide its own internal security.

There is no publicly provided fire protection in the area. It is

not known what firefighting equipment is available at Tyonek.

Industry would, however, provide its own firefighting equipment

and capability.

Health care is available at a small clinic in the community building

at Tyonek. The facility is staffed by a resident Licensed Prac­

tical Nurse who provides medical and dental care. The U.S.

Public Health Service also provides a community health aide (and

alternate). Emergency medical care is received at the Alaska

Native Medical Center in Anchorage.

10-21

(J

Emergency services and hospital care from the health aide are

available to non .. Natives on an emergency basis only. Emergency

evacuations are handled by the state troopers using private

charter planes. The U.S. Air Force also handles some emergency

evacuations. The Kenai Peninsula Borough provides service to

the area from a 32-bed hospital in Soldotna.

Employment

Employment in Tyonek is scarce. With the exception of a few per­

manent jobs associated with the operation of the school, work in the

village is part-time and seasonal. In recent years, a significant

amount of work has been derived from government activities and

programs. Thus, Tranter (1972) observed: 11 Tyonek, even with its

good fortune of the 1960s, does not significantly differ from the

prevailing employment patterns found in Alaska's Native village

society found elsewhere in the state. 11

A survey of employment in Tyonek in the spring of 1979 revealed

that 54 people had a full-time or part-time job. Seventy percent of

them worked in government-related programs, including state and

federal education and health programs and the federal Comprehensive

Employment and Training Act (CETA) program. In addition, eight

people worked at the KLM chip mill, four worked with a petroleum

exploration crew drilling for natural gas on village lands, and four

worked in Anchorage on the construction of modular houses that

would be brought to the village (Braund & Behnke, 1980). Little of

this employment represents permanent full-time jobs. Most is tem­

porary, and the government-related work is dependent upon annual

program appropriations.

Thirty-three limited entry fishing permits are held by Tyonek resi­

dents (three salmon drift gill net permits and 30 salmon set gill net

permits). The Cook Inlet salmon season is open for two days per

week for a six-week period from July to mid-August. Salmon stocks

10-22

in Cook Inlet have been rebuilding slowly after long years of de­

cline, and the fishery is increasingly lucrative to purse seiners and

drift gill net fishermen. However, because Tyonek villagers are

predominantly set-net fishermen, and because the runs in the vicin­

ity of the village are not especially strong, commercial fishing is still

a marginal enterprise for many residents who participate in it.

The record of village employment in the nearby chip mill is informa­

tive for what it suggests about the prospects of villagers benefiting

from employment opportunities created by development in the Beluga

coal fields. This record is summarized by Braund and Behnke

(1980):

When Tyonek Timber Company, a subsidiary of Kodiak Lumber Mills, constructed a chip mill near the village, many residents hoped the plant would provide permanent jobs for villagers after production began in 1975. The chip mill is located on former reservation land once owned by the village but now owned by the village corporation (Tyonek Native Corporation). From time to time, Tyonek Timber Company employs villagers, but the majority of the workers are transients housed near the facility. Appar­ently, Tyonek Timber Company did not intend to hire a high percentage of non-Native transients, but many prob­lems developed between the mill and the villagers.

From the industry point of view, the main difficulty was keeping employees who would report to work each day. Flexible work hours were arranged, but apparently absenteeism and drinking problems plagued production, and with a $30 million investment which was losing money each year, Tyonek Timber Company needed a crew of dependable loggers and mill operators. The villagers, who required specialized training for the jobs, often became disillusioned with the training program. Also, they felt that work schedules were constraining and inter­fered with more traditional and acceptable activities such as hunting and fishing. The growing presence of out­siders near their village was viewed with suspicion and concern. Some vi !lagers complained that they were har­rassed by non-Natives at the plant. Others felt the pay was too low when compared to union jobs. A shortage of gas in the village made it difficult to get to and from the timber mill. Possibly one villager summed up the problem when he said, 11 Natives aren't loggers. 11 The net result is that in a village where unemployment is of primary concern

10-23

industry builds a lumber mill within a few miles, and for various reasons, unemployment remains a problem.

Thus, it apparent! y cannot be assumed that the creation of local

employment opportunity will necessarily result in substantial village

employment. Many of the same factors that affected village employ­

ment in the chip mill could also affect employment in a nearby coal

mining and industrial plant operations.

Community Attitudes Toward Development

Attitudes of Tyonek residents toward major new commercial develop­

ment in the vicinity of their village are discussed in Braund and

Behnke (1980) and Battelle (1979). In general, there seems to be

little enthusiasm for local deveJopment that will result in an increase

of the non-Native population of the area. New employment oppor­

tunity has general appeal among the villagers, of course, but even

this attraction of development is tempered by the realization that

full-time employment entails sacrifice of the slower-paced traditional

life-style of commercial fishing, seasonal subsistence pursuits, and

occasional wage employment.

There is nothing unusual about ambivalence on the part of a small

rural town toward the prospect of dramatic change by a major re­

source development project; but in most cases, the promise of eco­

nomic prosperity is stronger than the urge to protect traditional

life-styles. In the case of Tyonek, however, the villagers may per­

ceive that the disadvantages of development seem to outweigh the

hope of benefits. Available data suggest that a majority of village

residents would oppose creation of a major new town on the west

side of Cook Inlet. A community profile and community attitudes

survey are being prepared by a consultant to the Alaska Department

of Community and Regional Affairs.

10-24

CONSTRUCTION AND OPERATIONS REQUIREMENTS

Background

The Beluga Methanol Project is comprised of the following basic com­

ponents: a coal mining operation; a rail and road linkage to a coal­

to-methanol plant; a pipeline for the methanol to an existing trans­

shipment point; a separate cargo dock; an airport; construction

camp; and permanent new town. Assumptions about project man­

power requirements and the ultimate projected population of the town

were derived by CIRI/Piacer Amex in consultation with CIRI/Holmes

and Narver, Inc. Separate estimates are provided for construction

and operations/maintenance manpower requirements for the mining

operation, construction camp, methanol plant, airport, and permanent

town.

These figures should be taken as general estimates sufficient for

preliminary facility planning and cost estimating. Because of its

remote location, the project would require a high degree of self-suf­

ficiency. Since few public facilities or services would be required or

impacted, there was only limited consultation with governmental

agencies regarding facility requirements. Nevertheless, experience

with other remote community and support facilities in Alaska sug­

gests that the proposed project realistically meets known require­

ments at this time.

Direct Labor Force Requirements

Assuming the start of construction in 1984, a peak construction work

force of approximately 3,200 (direct manpower requirements) would

occur in the beginning of the second quarter of 1986 and last until

the end of the year. Operation of the mines would require approx­

imately 470 people, and the methanol plant approximately 450. In

addition, it is estimated by Holmes and Narver that approximately

115 people would be required for the day-to-day operation and main-

10-25

c tenance (0/M) of the camp, town site, and airport. Therefore, a

total of approximately 1,242 regular 0/M personnel would be required

after start-up of the facility and completion of the town.

Indirect Employment and Total Population

The concept design for the project town site calls for a highly self­

sufficient community with schools, recreational facilities, retail goods

and services, and other basic urban amenities. Thus, a quantity of

indirect, or secondary, employment would be necessary in the com­

munity to support the basic work force, as in any other small town

in Alaska. This is in addition to the operation and maintenance

work force associated with the airport, camp and town site. The

amount of this indirect employment is estimated to be approximately

200. This represents an employment multiplier of about 1.2, which

is typical for a town of this size in Southcentral Alaska (Kramer, et

al., 1979).

Thus, total employment at the project site is estimated at 1,242.

The total population of the town would therefore be about 2,600, as

an average of approximately one nonworking dependent for each

member of the labor force is expected (a labor force participation

factor of 2. 0).

The town site development concept plan discussed in this report has

been scaled to a community size of approximately 2, 600 residents

with the capacity to increase to more than 4,200 persons (Holmes and

Narver, 1981). Table 10.1 summarizes employment and population

assumptions for the project.

OVERALL PROJECT DEVELOPMENT

The project is located about 75 miles northwest of Anchorage across

Cook Inlet, in an area within the Kenai Peninsula Borough. The

project extends upslope from Trading Bay a distance of about 25

miles to the Placer Amex Capps coal field.

10-26

Table 10.1

ANTICIPATED CONSTRUCTION AND OPERATION WORK FORCE

BELUGA METHANOL PROJECT

Project Phase

Construction

(1Q 1983 to 1Q 1986)

Operations

(Beginning 1Q 1986)

Work Activity

Coal Mine

Methanol Plant

Camp and Permanent Townsite

Camp and Airport 0/M

Total

Coal Mine

Methanol Plant

50-Person Camp, Airport, and Townsite 0/M

Total

Indirect Employment @ 0.2

Total

Total Estimated Town Population at

Approximately 1 Dependent per Employee

Source: CIRI/Holmes and Narver, September 1981.

10-27

Peak Number of Workers

550

450

2,000

~ 3,200

470

450

~ 1,035

207

1,242

2,600

Figure 10.3 shows the general locations of key components of the

project. These locations are not precise, however, there is suffi­

cient land within the project area with moderate slope and reasonable

foundation conditions to allow for a great deal of latitude in final site

planning. Adjustments can be expected based upon further site

studies, consultation with government agencies and evaluation of

property ownerships.

The Capps mine and methanol plant currently are envisioned on land

owned by C I R I; the proposed camp is located on borough land; and

the proposed town site, airport and Chuitna West mine are located on

state lands. The transportation corridor between the Capps Field

and the plant traverses C I R I, state and borough lands within an

existing 300-foot wide easement which runs in an unspecified align­

ment on state land over a distance of 2T~ miles from the Capps Field

to Trading Bay. The easement was granted by the state ON R.

Descriptions of the proposed construction camp, airport and town

site in the following sections are based almost entirely upon the work

by CIRI/Holmes and Narver (Conceptual Camp, Airport and Townsite

Development Plan, Beluga Methanol Project, September 1981).

Construction Camp

0 Concept

At peak construction, the project would require housing for about

3,200 people. Due to the remoteness of the project, all of these

personnel would have to be housed in a newly constructed work

camp. The camp would have to be built quickly in increments

which could accommodate fluctuations in the work force.

The most appropriate method of camp development for the support

of the project is the use of prefabricated and preinstalled build­

ing modules which are readily available from contractors and

10-28

("! '·J '

I i i I I

() '' .J

Trading B•r

FIG.I0.3 OVERALL SITE PLAN

.. - [ r

- I ! I

I

Mila a ............... 0 1 2 3 4 IS

0

0

manufacturers in Alaska and other states. Because these modules

require a minimum of field construction, the camp could be ex­

panded or reduced in size at modest cost. The modules would be

barged, or air-lifted by Lockheed Hercules aircraft. Trucks,

helicopters or CATCO Rolligons could transport the units to their

final site destination.

Camp Facilities

The building modules would be arranged to serve a variety of

camp uses. Approximately 62 dormitory-style barracks would be

grouped in four quadrants each with its own dining, recrea­

tion, and laundry facilities. Administrative offices, warehouses,

shops, a first-aid station, fuel storage, water and sewage treat­

ment, access road, helipad and similar facilities would be built in

the initial phase.

The camp 1s location in relation to other project facilities is shown

in Figure 10.4. Its general location is close enough to the plant

(within about a mile) to allow for a short bus ride, but not so

close as to be affected by plant construction noise. Power and

water are brought in above the camp, with road access, helipad,

and sewage facilities located downhill.

Figure 10.5 shows the proposed configuration of camp facilities.

Dormitories are arranged along a spine with the support dining,

recreation, and laundry facilities at the mid-point. This config­

uration allows for efficiency of construction and operation, but

could be modified based upon terrain features and requirements of

camp 0/M subcontractors.

Housing and Support Facilities

Housing and support functions would necessitate dormitory,

kitchen/dining, recreation, first-aid, and central laundry facil­

ities.

10-30

() ', __ ~·/

FIG.I0.4 CAMP SITE CONSIDERATIONS

n ()

1 Bull Fuel Storage and Dispensing Firat Aiel S tatlon

2 Offices 500 Man Laundry

3 Shop I Sewage Treatment Faclltle~;

4 Warehouses Flow Control Management Reservoir

5 Hellpad Five Day Holding Pond

6 Security Office Water Treatment FaciNtlea

7 52 Man Dormitories Camp Fuel Tank

8 Elec1rlcal FaciNtlea

9

19 20 21 22 23

FIG.I0.5 CAMP PLAN

Field Toilet

Enclosed Loading Area

Vehicle Equipment Shop

1000 Man Kitchen/Diner

1000 Man Recreation HaN ..

.H

~@ SCALE t4 FEET

100 0 100 100

••••• •••• -I

0

Each dormitory module would accommodate 52 persons in two-man

rooms. The one-story structures would be about 35 feet wide

and 144 feet long. In addition to the 26 rooms, each sleeper

module would contain group washroom, shower and toilet facilities,

clothes washers and dryers, and other amenities.

Four standard prefabricated and preinstalled kitchen/diner mod­

ules would be built. Assuming incremental development of four

quadrants of dormitory modules, two 1 ,000-person kitchen/ dining

halls, and two 500-person halls would be required.

The recreation hall is a vital component in any remote camp be­

cause of its influence on the morale of the construction and 0/M

work force. Assuming at least two work shifts, two 1 ,000-person

recreation halls would be adequate to provide a full variety of

recreational pursuits. A commissary and post office would be

located in one of the halls.

A centrally located first-aid station would allow medical personnel

to assess and stabilize medical emergencies before air evacuation

to Anchorage; coordinate on-site injury assessment and treatment

methods with Anchorage medical specialists; and provide selected

out-patient services.

Utilities

Camp utility systems would consist of water supply, treatment and

distribution; sewage collection, treatment and effluent disposal;

power supply and distribution; solid waste collection, reduction

and disposal; and fuel storage. Potable water would be needed

for domestic use and fire protection. The probable source would

be groundwater obtained from wells.

Water would be stored in a ground-level or elevated tank. The

storage requirement for potable water would be based upon the

10-33

sum of fire demand and one-half daily domestic demand, or

344,000 gallons. Fire flow criteria established by the National

Board of Fire Underwriters . suggests that . approximately 1 ,800

gallons per minute for two hours be provided, or a total storage

of 216,000 gallons. Domestic demand is based upon a daily con­

sumption of 80 gallons for approximately 3,200 persons, or about

256,000 gallons per day (gpd). Well pumps and booster pumps

could be sized to provide approximately 445 gallons per minute

(gpm) to serve a peak daily load equal to 2.5 times average flow

requirements.

Sewage flows which would be generated by the camp are estimated

at 60 gallons per person per day or a total of about 192,000 gpd.

Treatment would consist of four 50,000-gallon package plants

(e.g. extended aeration) preinstalled and prefabricated. These

modules could be relocated to the town site as camp population

declined. Tertiary treated effluent would flow via Arctic pipe

down a drainage channel, then would be absorbed into substrata

and eventually discharged into Nikolai Creek.

Power requirements probably would be met initially by on-site

diesel generators and/or by the existing Chugach Electric Asso­

ciation power plant at Beluga, approximately 20 miles from the

project site. Another possible source would be natural gas ob­

t~ined from nearby Cook Inlet offshore wells.

Ultimately, a power plant would be included as part of the Beluga

methanol project. The plant would serve overall needs of the

methanol plant and other facilities, while the above-described

power sources could provide emergency power.

Solid waste initially would be hauled to a landfill. For longer­

range needs, a solid waste management facility should be con­

structed at the town site to serve later construction and operation

phases of the project. Wastes would then be reduced, incinerated

and deposited in the landfill.

10-34

Diesel oil and other oil-based products would be stored in a spe­

cial, lined POL (petroleum, oil and lubricants) berm. The facility

would be located away from the camp and town sites to reduce

risks associated with possible fire or explosion.

Airport

0

0

Concept

A general transport airport is proposed to serve the construction

and operation phases of the project. The airport would be sized

to serve the Lockheed Hercules aircraft, in common usage in the

state for heavy cargo as well as for carrying personnel and pas­

sengers and for medical evacuations.

The airport would be located northeast of the plant on land owned

by the state. Given the large areas of poorly drained soils and

swamp in the project area, a choice of good airport sites is lim­

ited. The recommended site best meets requirements for level

terrain, adequate soils drainage and orientation to prevailing

winds (Figure 10.6). Final design could require adjustments

based upon closer evaluation of these requirements.

Facilities

The airport is designed to provide adequate runway area, air con­

trol, lighting, storage and ancilliary facilities necessary to accom­

modate Lockheed Hercules aircraft during prevailing northerly and

crosswind conditions. Figure 10.7 shows the preliminary design

for the airport. It is believed that development of only a north­

south runway is necessary for the construction phase of the

project.

Runway length required for the Hercules is about one mile, while

width should be about 300 feet. FAA criteria for a general trans-

10-35

CIRI/H&N ANCHORAGE, ALASKA

(~ '· j

FIG. 10.6 ()

AIRPORT SITING CONSIDERATION

{'; ' '

,,

r::::_~ -- __ ., __ ~----

-;)----

OVERRUN OVERRUN

SECTION A-A PROFILE AT CENTERLINE OF RUNWAY

CIRI/H&N ANCHORAGE, ALASKA

FIG.I0.7 AIRPORT PLAN

SECTION B-B RUNWAY CROSS SECTION

.,

18" AGGREGATE BASE COURSE AT 95'1> COMPACTION (FUTURE)

~ NOT TO SCALE

port, nonprecision runway require a safety area at each end of

300 feet. An additional 200 feet is proposed at each end for ade­

quate protection from potential obstructions. It is recommended

that FAA clear zone slopes of 50:1 be established (instead of the

normal 40:1 slope necessary for non precision runways) because of

the likelihood that the runway would eventually serve Boeing 737

aircraft. If commercial jet service were instituted, the runway

probably would have to be lengthened to 6,000 feet and widened

to about 500 feet.

Other airport facilities would include a two-story air control/ter­

minal building adjoining enclosed warehouse storage area. A fire

station would be located adjacent to the air terminal, and would

also provide fire suppression equipment for the nearby campsite.

Fire suppression would utilize dry chemicals with backup from a

fire truck pumper loaded with water. Water, sewage, power and

solid waste requirements are expected to be small. Since domestic

water requirements would be small, treated water would be

trucked on a weekly basis from the camp or town to an insulated

water storage tank near the terminal. Sewage effluent would be

treated in a 500-gallon package treatment plant with effluent dis­

charged into a small subsurface soil absorption system. Power

would be provided by the same source which is selected to serve

the construction camp. Initially, two 20 kv diesel generators

would be used. Solid waste would be stored in a dumpster to be

transported to the solid waste management facility at the proposed

new town.

Permanent New Town

0 Concept

A relatively self-sufficient new community would be developed for

the people who would be employed at the mine, methanol plant,

and related facilities, and for their families. The town•s esti­

mated population would be about 2,600.

10-38

0

(_/

Cl RI/Piacer Amex would manage the development process, provid­

ing certain initial infrastructure to facilitate efficient development

eventually having a full range of community services. Initial

community development would provide the basic core of public

infrastructure and housing. Private ·developers would provide

additional housing, commercial and other facilities on a free-mar­

ket basis within the broad guidelines of the overall town site

plan. Schools would be built and operated by the Kenai Peninsula

Borough.

The community might become an incorporated city, levying taxes

and bonding for certain facilities (options discussed previously in

this section under Kenai Peninsula Borough Services).

One option to the development of a permanent town site would be

continued use of the construction camp beyond the construction

phase. Rotating crews (without families) working seven days on/

seven days off could be transported to Anchorage or Kenai. In

any event, some of the camp•s facilities could be adapted for use

in the town site. Some camp housing could be designed for relo­

cation and reconstruction as permanent housing. Water, sewer

and power would be coordinated between the camp and town sites.

Camp recreation halls might be relocated to the town site.

The preliminary land use plan for the proposed new town is

shown in Figure 10.8. It was chosen from an analysis of alter­

native sites which considered such criteria as slope, drainage,

land ownership, and proximity to the camp, plant and other facil­

ities. The town site would be oriented along a high, well-drained

bluff overlooking Nikolai Creek, about three miles from the plant.

Housing, Education and Commercial Facilities

A variety of housing types including single-family homes and

multi-family units would be provided by private builders. Some

10-39

Residential: SF 16 to 24 single family units In six acre

neighborhoods. average density: 3.3 units/acre

MF

FSF

50 townhouse an·d apartment units In five acre neighborhoods.

average density: 10.0 units/acre Potential six acre expansion area for single family neighborhood development.

Educational: EDUCATIONAL High school and K-8 facility

COMPLEX on sixty acres.

Potential twenty acre expansion area for additional K-8 facility

··\\ ... i ..

· ... ·;·

CIIRI/H&N ANCHORAGE, ALASKA

() /

Utilities: UTILITY Water treatment, solid waste

COMPLEX management, and power substation facilities on approx. 3.7 acre•.

STP Sewage treatment plant on approximately 4.6 acres.

FSTP ~:.~~~~~ns!~~g.::n:::.Sra'.:r.~ '::::'~hborhood

MC -expansion on approximately 4.6 acres.

Motor vehicle maintenance and storage complex on 3.7 acres.

Improved road Potential Improved road for single

family expansion area.

Fl6.10.8 TOWN LAND USE PLAN

Commercial: COMMERCIAL Combined shopping and

COMPLEX entertainment, community services, offices, governmental administration, and residential apartment units on 30.0 acres.

FUTURE Potential ten acre commercial expansion area

i'e··,

c

0

c

mobile homes could be installed, but cost estimates have assumed

all wood-frame housing. Using an average household size of

about 2.5, approximately 1,020 units would be required. The

tentative mix of units is about 400 single-family units, 125 town­

houses, and 495 rental apartments (a reduction in the number of

rental units is possible, depending upon employment agreements

established by CIRI/Piacer Amex). Development densities would

be about 3. 3 units per acre for single-family and 10 units per

acre for townshouses/apartments, with higher densities for about

200 apartment units in the town center. Total residential land

requirements and land costs have not been estimated.

Schools in the new community would function as both education

and community recreation centers. Assuming a range of 25 to 35%

school-age children, schools would have to be built for 650 to 910

students. Perhaps all of these students could be accommodated in

one K-12 school. However, the Kenai Peninsula Borough has esti­

mated the need for a K-8 school for 500 students and a high

school for 800 students, so these conservative estimates have

been used for cost estimating purposes. The borough estimated

that a 20-acre site would be required for the K -8 school and a

40-acre site for the high school. It is anticipated the borough

would build and operate the schools.

Commercial space would be needed for retail grocery and depart­

ment stores, a medical clinic, bank, offices, restaurants, movie

theater, and future government offices. A hotel and church

site(s) may also be necessary. It is suggested that most of these

services be conveniently grouped within a single energy-efficient

structure -- perhaps along the lines of an enclosed shopping

center mall.

Transportation

Travel within the project area would be generally restricted to

home-to-plant or mine trips, shopping trips, and less frequent

10-41

0

trips within the community or to nearby fishing or recreation

areas. Trips onto nearby Native lands would be greatly discour­

aged by Tyonek Native Corporation.

These trip-making characteristics provide the opportunity for the

use of buses as the primary means of transportation in the area

-- during both the construction and operations phases. Since

roads are not developed outside of the area, and new roads would

be developed primarily for truck use, the initial use of private

automobiles should be discouraged. Buses could circulate

throughout the project area on narrow roadways, while saving

land and development costs usually required for wider roads and

parking areas. Emergency vehicles, delivery trucks, and snow

removal equipment would also use the roads.

Circulation throughout the town would be by 20- and 45-passen­

ger buses, and a separate network of bicycle/cross-country ski

trails. Approximately 20 45-passenger buses and six 20-passen­

ger buses or 9-passenger vans would be used during the con­

struction phase. All of these vehicles would be used during the

operations phase for home-to-work trips, home-to-school trips,

and trips to recreational areas such as Congahbuna Lake and

Nikolai Creek. The smaller vehicles would be used within the

town site on a 24-foot-wide one-way loop road, served by 12-

foot-wide residential access streets. A 4-acre bus storage and

maintenance facility is planned near the town center. At some

point further into the development, private automobiles may be

permitted.

Utilities

The same types of utility services provided for the camp would be

needed for the town. Possibilities exist to integrate some of the

facilities (water supply, sewage treatment, solid waste disposal).

Domestic and fire flow water requirements are estimated at 354,000

10-42

gpd (one-half daily domestic demand of 120 gallons per person

plus 1,650 gpm for two hours of fire flow). Storage and treat­

ment would be the same as described for the construction camp.

Distribution would be by approximately 8-inch main and smaller

diameter feeder lines.

Sewage flows gen~rated by the town are estimated at 208,000 gpd

(80 gallons per person). The four 50,000-gallon package treat­

ment plants used at the construction site, plus a new 10,000-

gallon package plant would be installed on an incremental basis.

The plants would be sited downslope from the town with treated

effluent discharged into Nikolai Creek.

Minimum power requirements for the town would be about 25 kv.

It is assumed that initial power requirements could be met using

the source which served the construction camp until the perman­

ent power plant were built.

Solid waste equal to about 24,000 pounds per day of burnable

material and 1,440 pounds per day of noncombustible material

would be hauled to a solid waste management facility. After

reduction, remaining solid waste would be disposed in the sani­

tary landfill.

10-43

11.0 ACOUSTIC ENVIRONMENT

INTRODUCTION

Sound is radiant mechanical energy transmitted by longitudinal pres­

sure waves in a material medium. Sound can be transmitted through

gases, liquids or solids. The number of times a sound wave reaches

its maximum and minimum pressures in a unit of time is referred to

as its frequency, and frequency is expressed in Hertz (Hz), which

refers to the number of cycles per second. Sounds with frequencies

from about 16 to 20,000 Hz are in the range of human hearing.

Sound level or loudness usually is described using a dimensionless

unit of pressure, the decibel (dB), and environmental noise generally

is expressed using the A-weighted sound level in units of dB called

dB( A). The A-weighting is an adjustment based on human hearing

sensitivity at various frequencies. It is customary to call any un­

desirable sound 11 noise. 11 Figure 11.1 illustrates various levels of

noise in terms of A-weighted sound levels.

The result of combining two sound levels is not additive. Generally

when two sounds are combined the resulting sound level is not more

than 3 dB greater than the louder component. In terms of human

hearing, a sound level difference of 1 to 2 dB is barely perceptible;

3 to 5 dB is clearly per~ceptible; and 7 to 10 dB is an effective dou­

bling or halving of loudness.

Ambient background noise levels of 55 dB or less generally are

acceptable. Residential areas near large cities generally have a

background level of about 60 dB. Increases of up to 5 dB over

ambient levels are generally considered to have a slight impact; in­

creases of 5 to 10 dB would have a significant impact; and increases

of 10 dB or more would have serious impacts.

11-1

FIGURE 11.1

(~ /

NORMAL CONVERSATION

DRILL PRESS

PAIN BEGINS

0 10 20 30 40 50 60 70 80 90 100 110 120 130 140 150 160 170 180 190

I 194

SOUND LEVEL dB(A)

QUIET BEDROOM I ~~A~~~E~~UND L"bu~~TE/.

MANUAL TRAINING

~OARSE GRINDING

POWER SAW

SPRAY PAINTING

AIF COOLED ELECTRIC MOTOR 50KW

IN THE VICINITY OF A JET PLANE TAKING OFF

HIGHEST SOUND LEVEL THAT CAN OCCUR

LEVELS OF NOISE IN TERMS OF A-WEIGHTED SOUND LEVELS, dB (A)

[ /~.

"'-·· .· GENERAL OVERVIEW

The Chuitna Center Ridge and Capps mine areas which would provide

coal feedstock for this project are located in an uninhabited wilder­

ness area between the elevations of 1,500 and 2,100 feet. There are

essentially no man-induced noise sources in these areas other than

occasional overflights by light aircraft. The ambient noise levels in

these areas would probably vary between 20 and 35 dB(A).

The methanol plant site is located near the shore of Cook Inlet in a

generally uninhabited area, although it is the location of ongoing tim­

ber harvest and. oil industry activities. There are regular timber

hauling activities with slow-moving heavy trucks producing noise in

the 60 to 70 dB range at a distance of 400 feet. Although general

vehicular traffic is sparce by rural standards, pickup and automobile

traffic is generated by Granite Point fishing activities, the onshore

oil receiving facility, and general recreational and hunting excur­

sions. Overhead small aircraft traffic also is frequent. The present

noise inducing activities near the plant site still produce an insignif­

icant level of background noise. It is assumed the base ambient

sound levels for the general methanol project site are between 30 and

40 dB(A).

NOISE SENSITIVE LAND USES

There are no noise sensitive land uses within the project area other

than the expected responses to higher levels of induced noise by the

resident wildlife and bird populations.

11-3

12.0

ENVIRONMENTAL IMPACT

GEOLOGY AND SOILS

CONSTRUCTION EFFECTS

Construction effects from this project on geology and soils would be

the result of numerous activities ranging from the surveying of the

land surface to the construction and operation of sedimentation ponds

(Table 12.1). The primary concern during construction would be the

control of erosion (primarily by surface water) to prevent the. degra­

dation of surface waters and the potential impact on the fishes util­

izing these surface waters. Also of concern would be the general

impact of such construction activities on generally unstable soils with

particular concern for areas that could possibly fail due to high

water contents and inherent slope instability. The former can be

controlled by careful planning and operator training with close

supervision; the latter can be controlled by detailed soil analysis and

sound engineering design.

LONG-TERM EFFECTS

Long-term effects from construction and operation of this project in

terms of geology and soils would relate primarily to:

0

0

0

0

0

0

0

0

0

Competency as Structural Foundation

Erosion Potential

Clays for Impermeable Sealers

Aggregate Sources

Seismic (Faulting)

Geophysical Hazards

Soil Suitability for Wastewater Disposal

Slope Stability

Permafrost

12-1

1.

2.

3.

4.

5.

6.

7.

C; 8.

9.

10.

11.

12.

13.

14.

15.

16.

17.

18.

19.

20.

Table 12.1

PRELIMINARY LIST OF CONSTRUCTION ACTIVITIES

ASSOCIATED WITH DEVELOPMENT IN THE BELUGA REGION

Survey land surface 21. Build bridges

Operate drill rigs 22. Cut and fill

Remove surface features 23. Haul material

Store topsoil materials 24. Prepare surfaces and roadbeds

Dewater (by pumping) 25. Store material

Blast 26. Crush material

Remove overburden 27. Load material

Dispose of overburden 28. Operate railroads

Extract material 29. Operate access roads

Replace topsoil and revegetate 30. Operate haul roads

Divert surface waters 31. Store fuel and chemicals

Operate machinery and 32. Operate maintenance yards and equipment parking lots

Clear and grade 33. Operate electric transmission

Excavate 34. Operate water supply

Backfill and grade 35. Operate sewage treatment plant

Construct stream crossings 36. Operate septic tanks

Construct dikes and dams 37. Operate runoff controls

Install culverts 38. Operate waste rock dumps

Assemble structures 39. Operate sediment ponds

Pave surfaces 40. Construct docks

12-2

Nearly all of these effects (or concerns) relate to the operation of

the mines supporting the methanol plant. Stability of the material in

the waste dumps would be of some concern due to the overall weak

and water-sensitive nature of the material. The extensive distribu­

tion and depth of glacial tills will determine the overall slope of pit

walls. Slide areas adjacent to the northeast side of the Capps pit

area would most likely be susceptible to additional water. The finer­

grain mud stones have very poor trafficability. The transportation

corridor past the Chuitna west pit area may encounter siltstone and

claystone slopes susceptible to instability without design precautions

(e.g., flatting the slope). Drainage from open slopes would require

interception to avoid progressive erosion. The transportation corri­

dor crossing extensive areas of tundra may require excavation of the

organic layer. The extent of granular borrow material available in

the pit areas to support long-term operations has not yet been de­

termined. Final plant location determinations may require the exten­

sive removal of deep organic layers.

MAJOR REGULATORY REQUIREMENTS

Regulations relative to impacts on geology and soils would be pri­

marily through the permanent regulatory program of the Office of

Surface Mining Reclamation and Enforcement. It is anticipated that

the State of Alaska will enact regulations similar to those of OSMRE.

ENVIRONMENTAL ACCEPTABILITY OF PROPOSED ACTION

While some degree of uncertainty remains as to the nature and perm­

eability of the overburden in the pit areas and along the transporta­

tion corridor, there is nothing to suggest that the project as pro­

posed would cause any unacceptable environmental impacts during

either construction or the operation phases. Modification of the

landscape within the mining areas would be unavoidable but should be

12-3

environmentally acceptable assuming a proper mine design and careful

monitoring to insure that proper construction and operation techni­

ques are being applied.

12-4

13.0 HYDROLOGY

CONSTRUCTION EFFECTS

Groundwater

0

0

0

Construction Water Source

The only likely use of groundwater during the construction phase

of the project would be as a potable water supply and possibly for

concrete mix water. The test water well drilled in May 1981 near

the proposed plant site indicated a presence of a deep ground­

water source that could provide up to 100 gpm on a regular basis.

The water is of reasonably good quality with possibly only chlor-

ination required for treatment. It is assumed that the potable

water supply would be used primarily to operate the construction

camp. It is likely the groundwater supply would feed a storage

reserve near the camp facility to meet peak water demands.

Effects on Water Table

It is probable that if groundwater were used it would be drawn

from a deep source similar to that in the above-mentioned test

well. Virtually nothing is known about groundwater movement in

this area, but the abundance of surface sources suggests a system

of aquifer feed-water that would preclude any detrimental effects

on the water table based on the anticipated potable water require­

ments for this project.

Appropriation of Water Rights

Alaska Statutes Title 46 Water, Air, and Environmental Conserva­

tion reserves the waters of Alaska for the people of the state for

common use. Waters may be appropriated with permit authority

for beneficial uses which comply with standards for the protection

13-1

of public health and safety, protection of previous permitted

appropriations, and preservation of anadromous fish streams and

public recreational opportunities, Any entity desiring to appro­

priate waters of the state must obtain a water appropriation permit

from the director of the Division of Forest, Land and Water Man­

agement, Department of Natural Resources prior to developing the

water source. This permit authorizes the holder to conduct the

necessary work for appropriating water and to commence his

appropriation; however, it does not secure rights to the water.

When the permit holder has commenced use of tne water, he must

again notify the director, who will issue a 11 Certificate of Appro­

priation11 upon demonstration that the means for taking the water

have been developed and the permit holder has complied with all

permit conditions. The certificate secures the holder's rights to

the water. It is not anticipated that any difficulties would be

encountered in C I R 1/Piacer Amex obtaining a 11 Certificate of

Appropriation 11 for groundwater use.

Surface Water

0 Siltation During Construction

Construction of the coal handling and plant facilities would occur

over a period of several years. During this period and prior to

initiation of processing activities, the only significant wastewaters

generated on-site would be runoff waters. Because of construc­

tion work such as site grading, road building and other civil­

associated activities, that precipitation runoff during this period

would contain quantities of silt.

As an initial site activity, the facility's design proposes construc­

tion of two large earthen ponds to collect and detain runoff from

the construction site. These would enable any silt contained in

the runoff waters to settle prior to release of the runoff to

natural channels. Runoff flows would be intercepted by the em-

13-2

0

bankment forming the foundation of the southerly site access road,

and would be directed through a channel under the roadway to

the settling pond sites.

Because of physical conditions at the currently proposed proces­

sing site, two runoff control systems are anticipated. One would

serve the coal handling area, approximately 100 acres, and the

other would serve the methanol production area, approximately 220

acres. Each system•s design is based on the Universal ·Soil Loss

Equation. Each settling pond is sized to accommodate a 24-hour

rainfall on the area served, with a frequency of return of once in

10 years, in addition to a sizable volume of settled silt. An alum

feeding capability proportioned to the influent flow would enhance

agglomeration and settling of turbidity-causing fines anticipated in

the raw runoff. This system of runoff control should maintain

sediment discharges at an acceptable level.

Accidental Petroleum and Hazardous Substance ~

As with any construction project, there likely would· be small

accidental spills of gasoline and diesel fuels, hydraulic fluids or

other petroleum by-products. Minor accidental spills of materials

such as solvents also would be expected, and these likely would

qualify as hazardous substances. If such spills occurred in minor

amounts on the plant site, they would be sufficiently removed from

the nearest lakes, anadromous fish streams, and coastal waters to

prevent impact. Such minor spills most likely would occur in the

plant workpad area, a location which would also preclude direct

contamination of adjacent wetlands.

The most detrimental place for a spill to occur would be near a

stream crossing on the road system or near dock construction and

material handling activities in the intertidal area. Such spills

would be beyond the category of small accidental material handling

spills discussed above. A spill there likely would involve a more

13-3

r--1 . \___.'

0

serious accident, and would have a very low chance of occur­

rence. To protect against adverse impacts from such an accident,

a cooperative and coordinated plan of response to oil and hazard­

ous substances pollution emergencies would be forthcoming from an

interagency group headed by the Alaska Department of Environ­

mental Conservation, in accordance with state policies. This

would represent an extreme sequence of events not unlike those

possible during any large industrial construction project. Any

accidental spills from routine construction activities are not antici­

pated to cause adverse environmental effects.

As a Water Source for Construction

Surface water would be used during construction primarily for

concrete batching, earthwork compaction and dust control. This

water would be required in relatively low quantities and likely

sources would be adjacent streams or ponds such as Congahbuna

Creek, Congahbuna Lake or one of the other adjacent small ponds.

Groundwater might also supply some of the concrete mix water.

Due to the intermittent nature of the water requirement and the

relatively small quantites that would be withdrawn, any effects on

these water courses would be very temporary.

LONG-TERM EFFECTS

Groundwater

0 Plant Water Source

The methanol plant and coal handling and processing facilities

have a variety of water requirements, however, the largest

requirement is make-up water for the plant cooling system. The

highest water requirement cooling alternative reviewed in this

project necessitated an excess of 300,000 gpm of once-through

13-4

0

cooling water. This design scenario was favorable to capital cost

but was discarded because of insufficient local water sources to

meet this extraordinarily high demand. The present cooling con­

cept is a recirculating system requiring about 15,000 gpm to re­

place the evaporation and other losses. The two exploratory

water wells drilled as part of this study confirmed that deep

groundwater sources would not be sufficient to meet the water

requirements at the plant. Approximately 100 gpm on a regular

basis may be available from a well in the plant site but this would

be insufficient to meet much more than routine potable water

needs. The only apparent alternative at this time is the installa­

tion of an extensive infiltration gallery system in the lower

reaches of Nikolai Creek. This is discussed further later in this

Section under Effects to Surface Waters. It is expected that there

would be some well water used for domestic purposes whether at

the plant or construction camp. Because there are no significant

uses of groundwater in the Granite Point area at this time, there

would not be any significant impact from the use of these wells for

a potable water source. Based on the available information, a

single well could provide between 100,000 and 150,000 gpd. It

may also be possible to have two or three wells in close proximity

near the plant without significant overlapping of the cones of

depression of the drawdown curve of each well.

Effects on Water Table and Marshes

It seems evident that any deep groundwater withdrawal for this

project would come from the upland area of the Nikolai escarp­

ment. This area is two to four miles from the Trading Bay State

Game Refuge, so groundwater withdrawal should have no impact on

the marshes in the refuge. Virtually no use is being made of the

groundwater resources in this region. Consequently groundwater

withdrawal of domestic quanities for this facility and its support­

ing construction activities should have only minor effects on the

water table. Between uses or if withdrawal is later discontinued,

13-5

0

the static water level should rapidly be restored to its present

level.

Appropriation of Water Rights

A permit to withdraw groundwater would have to be obtained from

the state Department of Natural Resources. The details of this

procedure are further explained earlier in this section under

Appropriation of Water Rights. It is not anticipated that any

difficulties would be encountered in C I R !/Placer Amex obtaining a

Certificate of Appropriation for groundwater use.

Surface Water

0 Wastewater Discharges and Treatment

Wastewater discharges would result from water treatment facilities,

processing and non-processing operations, blowdowns from boilers

and cooling towers, repair shop associated with the servicing of

locomotive engines, runoffs from coal storage and processing

areas, and from infrequent cleaning of steam boilers. All of these

wastewater streams are treatable using conventional technology and

could be discharged to Cook Inlet in compliance with state Water

Quality Standards.

Wastewater discharges from the proposed gasification/methanol

plant complex would occur continuously and/or intermittently from

several sources, which are summarized and discussed in the re­

mainder of this section. It appears that each of these discharges

is treatable using conventional technology and that discharge

permits could be obtained. It is beyond the level of available data

and scope of this study to analyze the environmental effects of

each component of the discharge stream in detail.

The continuous discharges include:

13-6

Water Treatment Slowdowns

Char Filtrate

Methanol Bottoms

Pump Seal Waters

Railroad Service Shop Wastewaters

Sanitary Wastewaters

Boiler Slowdown

Cooling Tower Slowdown

The intermittent discharges include:

Coal Storage Area Run-off

Boiler Cleaning Wastewaters

Process Area Runoff 11 Ciean 11 Area Runoff

All treated effluents would be stored in a final treated effluent

pond, and discharged through an effluent diffuser to Cook Inlet

during ebb tide only. A portion of the treated effluent would be

utilized for the conditioning of dry ash to minimize dust problems

during load-out from ash silos. Stored treated effluent also would

serve to meet the plant fire water demand.

The wastewaters generated in the proposed methanol plant accord­

ing to the above listed categories, including estimated flows and

characterization are described in this section. This information is

the basis for the conceptual development of wastewater treatment

facilities, and for estimating the characteristics of treated effluent

proposed to be discharged to Cook Inlet.

Water Treatment Slowdowns (Continuous Discharge): Well water

for general plant uses would be softened using the Cold Lime

process to remove alkalinity and hardness, then would be neu­

tralized and chlorinated before distribution. Due to the pres-

13-7

ence of high concentrations of silica in the well water, make-up

water for boiler use would first be softened using the Warm

Lime process for partial removal of silica, and then would be

demineralized using a combination of cation and anion exchange

beds.

Wastewater discharges from the water treatment facilities would

result from the combined dewatering of sludges resulting from

cold and warm lime 'softening, and from the regeneration of

ion-exhange beds. Sludge dewatering would result in a dis­

charge of 123 gpm of centrate, and ion exchange regeneration

would result in a wastewater discharge of 185 gpm. These

wastewater discharges contain only inorganic impurities. Since

ion-exchange regenertion wastes are expected to be highly

acidic, they would be neutralized. These wastewaters then

would be combined with treated process wastewaters for dis­

charge to Cook Inlet.

Char Filtrate (Continuous Discharge): Significant quantities of

char are carried with the hot raw gas from the gasifiers. The

major portion of the char is removed in cyclones prior to cool­

ing of the raw gas. The gas is cooled by direct contact with

water in scrubbers, which removes the remaining char, and

also removes any 11 condensible 11 impurities. Wastewater result­

ing from gas scrubbing is clarified and cooled, and then is

recycled to the scrubber. The underflow sludge from the

clarifiers is dewatered in pressure filters. These pressure

filters also dewater sludges from the clarifiers which handle

wastewater discharges resulting from scrubbing of coal dryer

gas. Char filtrate thus represents combined blowdowns from

the dewatering of sludges resulting from gas cooling and from

coal dryer gas scrubbing. The estimated flow of char filtrate

is 878 gpm, and it would contain impurities condensed from the

gas. The estimated concentration of contaminants in the char

filtrate is shown in Table 13.1.

13-8

()

Table 13.1

SUMMARY OF ESTIMATED FLOWS AND CHARACTERISTICS

OF PROCESS - RELATED AND SANITARY WASTEWATER DISCHARGES

Pretreated Pretreated Pump Effluent Contaminated Sanitary

Char Methanol Seal Railroad Process Area Wastewater Total Parameters ~ Bottoms Water Sho~ Runoff Discharges Wastewater

Flow, GPM

AVG 878 190 175 50 11 1304

MAX 80 340 1674

BOD 5 , mg/.e 685 5 30 50 100 477 (373) 1

TOC, mg/.e 380 3 20 30 50 265 (208)

COD, mg/.e 1360 10 60 100 200 947 (741)

Sus. Solids, mg/.e 100 20 50 75 100 93 (73)

TDS, mg/.e 1500 200 200 350 1073 (842)

Phenol, mg/.e 5 3.4 (2.7)

Chloride, mg/.e 760 512 (400)

Thiocyanate, mg/.e 5 3.4 (2.7)

Cyanide, mg/.e 46 3.1 (24)

Ammania-N, mg/.e 17 11.5 (9)

1 Concentr-ations indicated for maximum flow conditions.

Methanol Bottoms (Continuous Discharge): An estimated dis­

charge of 190 gpm would result from the methanol distillation

columns. This discharge is anticipated to contain approximately

5 ppm of methanol and 1 ppm of higher alcohols. The charac­

teristics estimated for this discharge are shown in Table 13. 1.

Pump Seal Water (Continuous Discharge): Water used to cool

pump seals would be discharged to the process area sewers.

An estimated discharge of 175 gpm would result from the use of

water for pump seal cooling.

anticipated in these discharges.

Insignificant contaminants are

Railroad Service Shop Wastewaters (Continuous Discharge): A

shop to service and repair locomotive engines would be pro­

vided. Wastewater discharges would occur from washing cars.

prior to repairs, as well as from runoff from the railroad

tracks associated with the shop. It is proposed that waste­

water discharges from the shop and runoff be pretreated to

remove oil and settleable solid materials, and that the effluent

be discharged to the process sewers. The average and maxi­

mum rates of flow of discharges from the railroad shop area are

estimated at 30 and 50 gpm, respectively. The characteristics

of pretreated effluent from the railroad shop are shown in

Table 13.1.

Sanitary Wastewaters (Continuous Discharge): Sanitary facil­

ities would be scattered throughout the plant area. To avoid

problems of conveying relatively small volumes of sanitary

wastes to a central location for treatment, it is envisioned that

minor sanitary discharges from remote locations would be

treated in individual septic tanks. Overflow from the septic

tanks would be chlorinated using chlorine tablets, and dis­

charged to the nearest process sewer. Centrally located pack­

age treatment plants providing secondary treatment and chlor­

ination would be provided to serve major sanitary discharges.

13-10

Treated effluents from these package systems would also be

discharged to the process sewer.

An estimated total quantity of 16,000 gpd (11 gpm) would be

discharged from the various sanitary treatment facilities. The

estimated characteristics of the pretreated sanitary wastewater

discharges are:

BOD 5

TOC

COD

Suspended Solids

Total Dissolved Solids

100 mg/Q

50 mg/Q

200 mg/Q

100 mg/Q

350 mg/Q

The estimated flows and characteristics of process wastewaters,

pretreated effluent from the railroad shop, pretreated sanitary

wastewaters and controlled discharges of process area runoff

are shown in Table 13.1. It is proposed to treat these waste­

waters in on-site biological treatment facilities.

Boiler Slowdown (Continuous Discharge): There would be

three classes of boilers in the coal gasification/methanol com­

plex: high pressure steam boilers; Winkler waste heat recov­

ery boiler; and Reformer waste heat recovery boiler. The

estimated normal rate of flow of blowdown from the high pres­

sure boilers is 135 gpm. The estimated normal rates of flow of

blowdowns from the Winkler and Reformer waste heat recovery

boilers are 37 and 15 gpm respectively. The principal contam­

inants are suspended and dissolved solids. The estimated

suspended and dissolved solids concentrations are 30 and 350

mg/Q, respectively.

Cooling Tower Slowdown (Continuous Discharge): Waste heat

is recover·ed from the condensing turbines and other processing

areas using recirculated cooling water. This waste heat is

13-11

c removed from the cooling water in cooling towers. The esti­

mated flow of water in the recirculating cooling system is

approximately 330,000 gpm. The cooling tower is designed to

operate at three cycles of concentration. The estimated aver­

ages are: evaporation 9,980 gpm; drift 333 gpm, and blowdown

4,660 gpm. The characteristics of cooling tower blowdown are

estimated based on using well water as make-up to the cooling

towers. The cooling tower blowdown characteristics are:

Suspended Solids

Dissolved Solids

Iron

100 mg/.Q.

1,800 mg/Q.

2 mg/Q.

Coal Storage Area Runoff (Intermittent Discharge): During nor­

mal operation of the production facilities the only significant

wastewaters generated within the approximately 1 00-acre coal

storage and handling area would be from periodic washdown of

certain coal handling equipment operating areas, and from pre­

cipitation runoff. It is estimated that the washdown waste­

waters could amount to approximately 54,000 gpd. Precipitation

runoff would, of course, be varia.ble, both in quantity and

frequency of occurrence, and Is further dependent on the

coefficient of runoff, a function of the type of surface on

which the precipitation falls. In this case, a 24-hour rainfall

with a frequency of return of once in 10 years is expected to

result in a total quantity of runoff of approximately 3.9 million

gallons from the coal storage and handling area.

All clean-up and precipitation runoff waters occurring in the

coal storage and handling area would be collected and stored in

the coal handling area stormwater storage pond prior to ulti­

mate disposition. The storage pond is designed to retain pre­

cipitation runoff from a 10-year, 24-hour storm, plus 10 days

of accumulated clean-up water.

13-12

It is anticipated that clean-up and precipitation runoff waste­

waters which come into direct contact with the low sulfur coal

could become somewhat contaminated with low concentrations of

leached acid and miscellaneous heavy metals, although they

would be diluted substantially by runoff which has not been in

contact with coal. The estimated characteristics of these

wastewaters, based on the EPA Development Document for the

Steam Electric Point Source Category, are presented in Table

13.2.

These wastewaters would be pumped to pretreatment facilities at

a controlled rate (up to 320 gpm) and, combined with boiler

cleaning wastewaters, would be treated for the removal of

heavy metals and residual suspended solids. At this pumping

rate, coal handling area stormwater runoff from a 10-year,

24-hour storm would be treated over a period of 10 days. The

treated effluent would be combined with biologically treated

process wastewaters prior to discharge to Cook Inlet through

the effluent diffuser.

Boiler Cleaning Wastewaters ( 1 ntermittent Discharge): Periodic

cleaning of boiler tubes and boiler tubes fireside is necessary

to maintain efficient heat transfer capability of the boiler.

Similarly, the air preheaters require periodic cleaning to re­

move soot and fly ash accumulations on the air preheater sur­

faces. The quantities of cleaning wastewaters would depend

upon the cleaning frequency and the amount of water used for

cleaning, and are estimated for this project from information

presented in the EPA Development Document for the Steam

Electric Point Source Category.

There are three high-pressure boilers, each capable of gener­

ating 900,000 pounds per hour of steam. Each boiler is cable

of producing an 11 equivalent power 11 of 150 mw (based on 6,000

13-13

('\ '-._ .. ·

Table 13.2

SUMMARY OF COAL AREA WASTEWATER CHARACTERISTICS 1

Parameter Concentration2

pH 3.0

Acidity, as CaCo3 600.0

Sulfate 1,000.0

Dissolved Solids 1,500.0

Suspended Solids 300.0

Iron 180.0

Manganese 5.0

Copper 0.2

Zinc 1.2

Aluminum 40.0

Nickel 0.4

Based on EPA Development Document for the Steam Electric Point Source Category

2 All Units except pH are expressed in mg/.2.

13-14

(_

pounds per hour steam per mw). Thus, the estimated volumes

of boiler cleaning wastewater discharges are:

Boiler Tube Boiler Fireside Air Preheater

Cleaning Frequency

1/Year 2/Year 6/Year

Water Use Gals/

MW/Cieaning

1,800 800 700

TOTAL

Total Cleaning Waste

Gals/Year

810,000 720,000

1,890,000

3,420,000

The estimated characteristics of boiler cleaning wastewaters are

shown in Table 13.3. These wastewaters have high concentra­

tions of various metals, and suspended and dissolved solids.

The boiler cleaning wastewaters would be collected in a storage

pond sized to handle the total discharge from one boiler clean­

ing. The cleaning wastewaters would be pumped to the pre­

treatement facilities at a controlled rate (up to 25 gpm) and,

combined with coal handling area storm water runoff, would be

treated for the removal of heavy metals and suspended solids.

At this pumping rate, the boiler cleaning wastewater would be

treated over a period of 15 days. The pretreated effluent

would be combined with the biologically treated process waste­

waters prior to discharge to Cook Inlet through the effluent

diffuser.

Process Area Runoff (Intermittent Discharge): A substantial

portion of the overall processing area (non-coal-handling) is

occupied by process facilities and operations from which it is

possible that minor drips, leaks or spills might occur. Thus,

precipitation falling on these operating areas could inadvert­

ently become slightly contaminated with miscellaneous organic

constituents. Therefore, precipitation runoff from these oper­

ating areas would be collected and stored in a stormwater

storage pond, and pumped at a reduced rate (0 to 340 gpm) to

the process wastewater biological treatment facilities for treat­

ment with the process wastewaters.

13-15

(" '~/

Table 13.3

SUMMARY OF BOILER CLEANING WASTEWATER CHARACTERISTICS 1

Total Boiler Boiler Air Cleaning

Parameters Tube Fireside Preheater Wastes 2

Total Solids, mg/£ 11,000.0 13,400.00 12,075.0 11,695

Dissolved Solids, mg/! 9,200.0 10,430.00 8.850.0 9,330

Suspended Solids, mg/! 80.0 616.00 1,990.0 615

Chromium, mg/! 4.4 2.50 6.0 4

Copper, mg/! 166.0 1.25 3.4 90

Iron, mg/! 1,077.0 150.00 974.0 820

Nickel, mg/! 76.0 5.00 61.0 55

Zinc, mg/! 36.0 7.50 7.0 22

Based on information from the EPA Development Document for Steam

Electric Power Generating Point Source Category

2 Characteristics of combined cleaning wastewaters are based on esti­

mated flow and characteristics of individual discharges

13-16

The stormwater storage pond is designed to retain potentially

contaminated runoff associated with a 24-hour storm with a

frequency of return of once in 10 years, a volume of approxi­

mately 5 million gallons. For purposes of establishing a con­

servative design basis, it is assumed that contaminated process

area runoff has characteristics listed in Table 13.4.

Table 13.4

ESTIMATED CONTAMINATED PROCESS

AREA RUNOFF CHARACTERISTICS

Parameter Concentration,

BOD 50

TOC 30

COD 100

Suspended Solids 75

Total Dissolved Solids 200

mg/.e.

11 Ciean 11 Area Runoff (Intermittent Discharge): A significant

portion of the total land area nominally classed as the process

area (non-coal-handling area) would be essentially unused.

Consequently, precipitation runoff from this unused area is

expected to be essentially uncontaminated, and it should be

possible to allow this runoff to occur without treatment. How­

ever, as a measure of insurance against the unforeseen, clean

runoff waters would first be directed to a primary stormwater

basin, which would serve as a primary separator, before being

discharged to existing runoff drainage channels.

Treatment Requirements: Estimated requirements for treatment

of anticipated industrial wastewater discharges are generally

based on: 1) Effluent guidelines established by the EPA for

several process-related major industrial manufacturing cate-

13-17

gories; and 2) the receiving water quality standards estab­

lished by the Alaska Department of Environmental Conservation.

Since synthetic fuel manufacturing is a relatively new industry,

specific effluent guidelines have not yet been developed by

EPA. As a result the approach to wastewater treatment would

necessarily be technology based. Since the process waste­

waters from the proposed coal gasification/methanol plant con­

tain significant quantities of organic material, it is reasonable

that these wastewaters should at least be treated to the secon­

dary treatment level.

The remaining wastewaters anticipated from the proposed plant,

such as blowdowns from cooling tower and boilers, coal storage

area runoff and boiler cleaning wastes, are similar to those

encountered in power generation plants. Therefore, treatment

required for these wastewaters would be similar to that prac­

ticed by the power generating point source category.

Specific numerical limits for effluent discharges from the pro­

posed wastewater treatment facilities would be included in the

NPDES permit, which must be obtained from the EPA prior to

the start-up and operation of the treatment facilities.

Additionally, effluent discharges would have to meet the state

water quality standards, which regulate man-made alternations

to waters of the state. Cook Inlet, at the point of proposed

discharge, is classified as marine waters suitable for the

growth and propagation of fish, shellfjsh, other aquatic life,

and wildlife including seabirds, waterfowl and furbearers (18

AAC 70 .020). Water quality parameters which are regulated for

waters so classified are dissolved gas; pH; turbidity; tempera­

ture; dissolved inorganic substances; sediment; toxic and other

deleterious organic and inorganic substances; color; petroleum

hydrocarbons, oils and grease; radioactivity; total residual

chlorine; and residues, floating solids, debris, sludge deposits,

13-18

(' "--· foam and scum (18 AAC 70.020). The criteria to be met are

also covered in 18 AAC 70.020.

Since the treated effluents are to be diffused into the waters of

Cook Inlet, the requirements of 18 AAC 70.032 also apply.

Compliance involves establishment of a mixing zone for which a

permit must be obtained from the Alaska Department of Envi­

ronmental Conservation. The mixing zone should be determined

at the same time the NPDES permit and the Section 401 certifi­

cation under the Clean Water Act are being prepared.

Wastewater discharges from the proposed gasification/methanol

plant can be classified into one of the following categories:

0 Wastewaters principally containing organic materials 0 Wastewaters principally containing inorganics & heavy metals 0 Wastewaters containing inorganic materials only

The treatment approach consists of segregating wastewaters

according to the contaminants known to be present, and treat­

ing them individually prior to combining all effluents for final

discharge to Cook Inlet.

Wastewaters containing principally organic materials would be

generated in the char filtration area, methanol distillation col­

umns, pump seal cooling waters, railroad shop, contaminated

runoff from processing areas, and sanitary wastewaters. Al­

though pump seal cooling water discharges should not require

treatment, they are included in this category because they

would be discharged to the process sewer. To protect the

process wastewater treatment facilities from oil and dirt that

may be present in discharges from the railroad shop, these

wastewaters would be pretreated before discharge to the pro-

cess sewer.

13-19

The characteristics estimated for wastewater discharges from

processing operations (Table 13.1) indicate the need for treat­

ment to reduce the BODs· Biological treatment using the acti­

vated sludge process would be utilized to provide greater than

90% BODs removal. Biological treatment also would be expected

to remove essentially all of the phenol and thiocyanates present

in the wastewaters. Based on experiences of biological treat­

ment of coke-oven wastewaters as practiced in the iron and

steel industry, significant removal of cyanide (60 to 80%) is

expected in the proposed biological treatment facilities. How­

ever, a conservative cyanide removal estimate of only 55% is

projected for this biological treatment facility.

Wastewaters containing principally inorganic impurities and

heavy metals would be those resulting from coal storage area

runoff and boiler cleaning operations. These wastewaters

would be provided with physical/chemical treatment using lime

addition to remove heavy metals and suspended solids. Physi­

cal/chemical treatment using lime addition is a proven method

which is expected to provide a very high degree of heavy

metals removal.

Wastewaters containing predominantly inorganic impurities would

be those resulting from water treatment, boiler blowdown and

cooling tower blowdown. These discharges would not require

treatment other than blending with the treated effluents from

biological and physical/chemical treatment facilities.

The above approaches are selected as the basis of treating the

various wastewaters generated by the proposed coal gasifica­

tion/methanol plant. These approaches would be expected to

provide a sufficient degree of treatment to ensure that the

combined total treated effluent would be suitable for discharge

to Cook Inlet.

13-20

0

To further ensure that the total treated effluent adequately

mixes with the waters of Cook Inlet, it is proposed to dis­

charge treated wastewaters through a multiple port diffuser

located several thousand feet from shore, and thus in an area

with a water depth of at least several fathoms even at mean low

tide.

Studies have been conducted incident to similar diffuser dis­

charges of municipal effluents from the City of Anchorage into

Cook Inlet. Based upon these studies, it is anticipated that

multiple port diffuser discharge of effluents from the C I R I I Placer Amex wastewater treatment facilities would receive an

adequate dilution in the waters of Cook Inlet.

The effluent diffuser would be approximately 1, 300 feet long,

varying in diameter 'from 30 to 42 inches. The ports would be

double nozzles on 25-foot spacings, with a nozzle diameter

equal to or less than 4 inches. The diffuser would be served

by approximately a 42-inch-diameter effluent sewer connecting

it to the effluent storage pond.

Projected Effluent Characteristics

The estimated characteristics of effluents proposed to be dis­

charged to Cook Inlet are shown in Table 13.5. The characteris­

tics of process wastewaters and inorganics containing wastewaters

which would be treated by biological and physical/chemical treat­

ment methods are based on the capabilities and performance

expected to result from these treatment methods. Characteristics

of other wastewaters (boiler blowdown, cooling tower blowdown,

ion-exchange regenerant wastes, and water treatment plant sludge

centrate) are estimated based on the system operating character­

istics. The total effluent proposed to be discharged is a sum­

mation of these individual effluents.

13-21

() r') , I

Table 13.5

SUMMARY OF PROJECTED EFFLUENT CHARACTERISTICS

Treated Coal Pile Runoff lon-Exhange Treatment Cooling

Treated Bio Boiler and Boiler Regenerant Plant Sludge Tower Total Plant3 Parameters I Effluent Slowdown Cleaning Wastes Wastes Centrale Slowdown Effluent

Flow, gpm - AVG 1304 187 298 185 123 3660 5757

MAX 1674 321 4660 7150

BODs 40 9

TOC 25 6

COD 200 45 (47)2

Suspended Solids 25 30 75 500 100 84

TDS 1073 (845)2 350 2000 (2550)2 7000 1000 1800 1750 (1700)

Phenol 0.001 Neg

Chloride 512 (400) 8 125 (102)

Thiocyanate 0.5 0.12

Cyanide, mg/.lt 14 (11) 3

Ammonia Nitrogen 5

Total Heavy Metals 6 0.5 (0.7) 0.03

Iron 9 2 1.75 (1.70)

Aluminum 0.06 (0.05)

pH 7-7.5 9'1- 9'1- 5-6 9'1- 7-7.5 7-8

I All contaminant concentrations are expressed as mg/.t except pH 2 Concentration dur·ing maximum flow condition 3 Proposed to be discharged to Cook Inlet 4 Estimated to be present as complex cyanide 5 Includes copper, nickel and zinc

0 Effects to Surface Water

The preferred receiving water for the treated industrial waste­

water discharge would be Cook Inlet. The currents are swift and

the exchange rate is high in Cook Inlet, which would facilitate

rapid dilution of the discharge. Compliance with water quality

standards in Cook Inlet would primarily be a function of the level

of treatment employed. In applying the State of Alaska water

quality criteria to surface waters, the Department of Environmental

Conservation will, in its discretion, prescribe in wastewater dis­

posal permits a volume of dilution for the effluent within the

receiving water. Water quality standards may be violated within

this mixing zone; however, the standard must be met at every

point outside its boundaries. Meeting the water quality criteria at

the mixing zone boundary essentially would be a function of the

level of treatment employed.

Construction of an outfall line a sufficient distance across the

shallow intertidal area of Cook Inlet to waters deep enough to

provide adequate dispersion would produce significant impacts,

although on a very short-term basis. The general biological

nature of the northern half of Cook Inlet is impoverished. It is a

transient zone for substantial parts of the north Cook Inlet salmon

run migrating particularly to the Chuitna, Beluga and Susitna

river systems. The fish spend a very short time in this portion

of Cook Inlet, and consequently, no detrimental effects on the

salmon runs would be expected. The resident population in the

intertidal zone of Cook Inlet near this project consists almost

exclusively of the clam, macoma. This is not a productive har­

vestable shellfish area. Consequently, effects on the intertidal

community would probably be inconsequential.

Any surface runoff from the construction of the methanol plant

and adjacent facilities would be directed almost exclusively in a

southeasterly direction by the topography. There is only one

13-23

small, unnamed creek with its headwaters near the point of runoff

discharge from plant construction activities. This is a very short

stream and it discharges at the mouth of Nikolai Creek. Reason­

able containment of runoff from plant construction should avoid

heavy sediment discharges near this creek, however, should sedi­

mentation occur, there are no significant fish populations to be

affected.

Water for construction activities such as dust control and earth­

work compaction may be drawn from Congahbuna Lake or Con­

gahbuna Creek, immediately adjacent to the construction site.

The use would be intermittent and the volume relatively low to

preclude any noticeable impact on either source. Congahbuna

Lake and Creek would be the preferred sources of non-potable

water during the construction phase of the project.

The proposed town site located on the Nikolai escarpment bluff

would most likely utilize Nikolai Creek as a receiving water for

treated effluent from the sanitary sewer treatment facility. With

secondary or tertiary treatment, a high quality effluent could be

produced that would have a very minimal effect on Nikolai Creek.

An alternative would be to pipe the discharge to the plant site

and release it to Cook Inlet with the treated industrial wastewater

effluent from the methanol plant treatment facility. There would

be no significant impacts to Cook Inlet from this alternative.

The more significant area of surface water impact would be from

the mining operation and activities in the transportation corridor.

In the transportation corridor erosion and sedimentation, particu­

larly during construction 1 would be the primary source of contam­

ination to about nine different drainages crossing the corridor.

Revegetation after construction and proper handling of runoff can

minimize the additional sediment loads to an acceptable short-term

level. In the mining operation 1 the runoff of surface waters in

the discharge of heavily sediment laden water from the mine pit

13-24

( would be the single largest water quality control problem in the

overall project. In the initial stages of mine operation there would

be large volumes of highly organic overburden to be disposed of

before there would be large volumes of underlying non-organic

material which could be utilized to build containment dikes and

retention ponds. The mine plan would provide a control for this

runoff which, if left unrestrained, could produce highly sediment

laden discharges. Such discharges, particularly in the Chuitna

drainage system, would exceed the volume the system could as­

similate. Due to the higher quality of water and diversity of fish

species present, the Chuitna River system would be the most ser­

iously affected by a highly sediment-laden discharge.

The mine plan would provide for the trapping of most surface

drainage waters before they get to the mining operation and would

direct them back into the natural drainage systems, relatively

untouched and with no increase in sediment load. The surface

waters that get into the mining operation and the groundwater

contribution within the mining operation would be highly sediment

laden waters which would be retained in a series of sediment

ponds before being released back into the natural drainage sys­

tems. Considerably more information must be known about the

potential sediment load of the discharges and the chemistry of the

water before reasonable assessments can be made of the impacts

from the release of these waters into the river systems. Water I

from the sediment ponds at the Capps Mine would all end up in

Capps Creek and flow into the already sediment-laden Beluga

drainage system. The Capps Mine plan specifically excludes any

drainage discharge to the Nikolai Creek system. Discharge from

the sediment ponds in the Chuitna Center Ridge Mine area most

likely would end up in some portion of the Chuitna River drainage

system. Other alternatives more remote at this time are a possible

discharge to the Nikolai drainage system or the Chakachatna

drainage system, both of which would require more distant trans­

portation of the discharge water. The Chuitna Mine area probably

13-25

c:o

would require a greater dewatering effort than the Capps Mine

area and, consequently, there would be a larger discharge from

the sediment control system. This is due to the Capps Mine being

located at a higher altitude near the recharge area of the sur­

rounding groundwater system, while the Chuitna Mine is at a

lower elevation, receives more surface drainage, and is in a more

productive area of the groundwater regime.

In summary, effects to the surface waters in Cook Inlet and adja­

cent to the plant should be negligible. There is a greater poten­

tial for perturbations to Nikolai Creek primarily due to its value

as a fishery, however, if handled properly the impacts are antici­

pated to be minimal. The greatest potential for effects to the

surface waters would be from the mining activities and construc­

tion in the transportation corridor. The following table provides a

general overview of the project activities and surface water sys­

tems potentially affected by the proposed project.

Table 13.6

POSSIBLE INTERACTION OF PROJECT ACTIVITIES

WITH SURFACE WATERS

En vi ron menta I Cook Chuitna Nikolai Beluga Perturbation Inlet sx:stem sx:stem sx:stem

Alter Surface Runoff p M P, T M

Alter Peak Flows M p M

Alter Sedimentation p M P,T M

Alter Downstream Flows M p M

Alter Stream Channels M M M

Alter Water Chemistry p M T M

p = Potential effects from Plant activities

T = Potential effects from Town Site

M = Potential effects from Mines & Transportation Corridor

13-26

MAJOR REGULATORY REQUIREMENTS

A permit to appropriate water would be required from the Alaska

Department of Natural Resources to withdraw and use groundwater

resources. The authority for this requirement is Alaska Statute

46.15.030-185 "Appropriation and Use of Water" and 11 AAC 72 Water

Use. Generally, it is not a complicated procedure to obtain this

permit, but it could take a period of six to nine months. The permit

should be applied for well in advance of the requirement.

If a direct surface source of water or an infiltration gallery near a

stream is used, the same water rights permit would be required from

the DNR except that if the application concerns use of a surface

source of water, DNR asks the departments of Fish and Game and

Environmental Conservation to review and comment on the proposed

permit issuance. It is possible that under certain circumstances the

Department of Fish and Game would require the applicant to also

obtain an anadromous fish permit (Alaska Statute 16.05.870 "Protec­

tion of Fish and Game 11), or that the DF&G would attach stipulations

to the issuance of the DN R water rights permit.

ENVIRONMENTAL ACCEPTABILITY OF PROPOSED ACTION

There is no indication that groundwater could not be used for the

purposes and in the quantities described above in a totally acceptable

manner. It should also be possible to acceptably use water from the

surface systems In the vicinity of the plant, but it likely would be

necessary to demonstrate to the reviewing agencies that the water

used is excess to the minimum amount required to sustain the exist­

ing fishery. The use of water from Congahbuna Lake or any of its

drainages for intermittent construction requirements should be less

controversial than obtaining permit approval to construct an infil­

tration gallery system near Nikolai Creek. Although there is still

a lack of low winter season flow data for Nikolai Creek, indications

13-27

are that there is a sufficient reserve of water that could be inter­

cepted before it reaches the creek and that the withdrawal could be

permitted and done in an environmentally acceptable manner.

13-28

C-

14.0 ECOSYSTEMS

The Office of Surface Mining Reclamation and Enforcement (OSMRE)

regulations require all surface mining operations to minimize, to the

extent possible, any adverse effects on fish, wildlife and related

environmental values in the permit and adjacent areas (it is assumed

that state regulations will require the same perspective). EPA has

prepared "assessment guidelines" for New Source Coal Gasification

Facilities ( EPA-130/6-80-001). An outline of potential environmental

impacts and relevant pollutants resulting from site preparation and

construction practices has been previously prepared by others (Table

14.1) that provides the basis for individual project evaluation.

Similarly, a perturbation matrix can be developed relating activities

during the construction and operation phases to environmental per­

turbations (biologic, geologic, edaphic, topographic, hydrologic, and

meteorologic). A preliminary framework for the development of such

a matrix is illustrated in Figure 14.1. Note that the development

activities in this framework are essentially the same as those provided

in Table 12.1 (Geology and Soils).

Many of the impacts associated with the exploration phase of the

development of a coal mining project have already occurred in the

general area due to activities of the oil, gas and logging industries.

The area is crossed with many roads and seismic trails and dotted

with barrow pits and abandoned drilling locations. Numerous air

strip locations and old camp sites are also found throughout the

region. Human activity, in the form of subsistence hunting and

fishing, recreation and permanent residency occurs throughout the

area.

CONSTRUCTION AND LONG-TERM EFFECTS

This section summarizes by project activity both the potential con­

struction and long term effects of this project on the terrestrial,

14-1

(~

'---··

Table 14.1

OUTLINE OF POTENTIAL ENVIRONMENTAL

IMPACTS AND RELEVANT POLLUTANTS RESULTING

FROM SITE PREPARATION AND CONSTRUCTION PRACTICES

Construction practice

1. Pr~construction

a. Site inventory (1) Vehi~ular traffic (2) Test pits

. b. Environmental monitoring

c. Te~;:>orary controls

(1) Sedimentation ponds

(2) Dikes and be~s

(J) Vegct~tion (4) Dust control

2. Site l;'ork

a. Clearing and dP."lolition

(1) Clearing

(2) Dernoli t ion

b, Tem;:>orary facilities (1) Shops and storage

sheds

(2) Access roads and parking lots

Potential environmental imoacts

Short term and nominal Dust, sediment, tree injury Tree root injury, sediment

Negligible if properly done

Short term and nominal

Vegetation destroyed, vater qlJali ty improved

Veg~tation destroyed, vater quality improved

Fertilizers in excess Negligible if properly done

Short term

Decreased area of protective tree, shrub, ground covers; stripping of topsoil; in­creased soil erosion, sedi­mentation, stonn~Jater runoff; increased stream water tem­peratures; modification of stream banks and channels, water quality

Increased dust, noise, solid wastes

Long term

Increased surface areas impervious to water infiltration, increased water runoff, petroleum products

Increased surface areas impervious to vater infiltration, increased water runoff, generation of dust on unpaved areas

14-2

Primary pollutants

Dust, noise, sediment

Visual

Sediment spoil, nutri. ents, solid ~aste

Dust, sediment, noise solid wcstes, wood vastes

Cases, odors, fumes particulates, dust. deicing chemicals, noise, petroleum products, waste­water, solid ~astes aerosols, pesticide

Table 14.1

Continued

OUTLINE OF POTENTIAL ENVIRONMENTAL

IMPACTS AND RELEVANT POLLUTANTS RESULTING

FROM SITE PREPARATION AND CONSTRUCTION PRACTICES

Construction practice

(3) Utility trenches and backfills

(4) Sanitary facili-ties

(5) Fences (6) Laydo~ areas (7) Concrete batch

plant

(8) Temporary and permanent pest control (ter­mites, veeds, insects)

c. EarthHork (1) Excavation (2) Grading (3) Trenching (4) Soil trea~ •. 1ent

d. Site drainage (1) Foundation

drainage (2) De"atering (3) Well points (4) Stream channel

relocation

e. Landscaping (1) Temporary seeding (2) Permunent seeding

and sodding

Potential environmental impacts

Increased visual impacts,· soil erosion, sedimentation for short periods

Increased visual impacts, solid vastes

Barriers to animal migration Visual impacts, increased runoff Increased visuul impacts; dispo-

sal of wastewater, increased dust and noise

Nondegradable or slovly degradable pesticides are accumulated by plants and animals, then passed up the food chain to man. De­grLdable pesticides having short bi~logical half-lives are pre­ferred for use

Long tenn Stripping, soil stockpiling,

and site grading; increased erosion, sedimentation, and runoff; soil compaction; in­creased in-soil levels of potentially hazardous materials; side effects on living plants and animals, and the incorporu­tion of decomposition products into food chains, vater quality

Long term Decreased volume of underground ~ater for short and long time periods, increased stream flow volumes and velocities, do~~­stream damages, water quality

Decreased soil erosion and over­land flov of stormwater, stabilization of exposed cut and fill slopes, increased water infiltration and under­ground storage of vater, minimized visual impacts

14-3

Prit>ary pollutants

Dust, noise, sedir.er.t debris, wood wastes solid wastes, pests cides, partic\llate'> bituminous products soil conditioner chemicals

Sediment

Nutrients, pesticides

{ ~

Table 14.1

Continued

OUTLINE OF POTENTIAL ENVIRONMENTAL

IMPACTS AND RELEVANT POLLUTANTS RESULTING

FROM SITE PREPARATION AND CONSTRUCTION PRACTICES

Construction practice

3. Permanent facilities

a. Coal gasification plant and heavy traffic areas (1) Parking lots

(2) Svitchyard (3) Railroad spur

line

b. Other buildings (1) Warehouses

(2) Sanitary vaste treatment

c. Possible ancillary facilities (1) Intake and dis­

charge channel

(2) Water supply and

(3)

(4)

(5)

(6)

(7)

.(8)

{9)

(10)

treatment Storm<1ater drain-age Wasteuater treat-ment. Dams and imj:>oundoent.s Breakwaters, jet­ties, etc. Fuel handling equipment Seed storage areas and prepa­ration facilities Oxygen plant and gas upgrading plant Cooling towers, power transmis­sion lines, pipelines, sub­stations

Potential envirorunental impacts

Long term

Stormvater runoff, petroleum products

Visual impacts, sediment, runoff Stormvater runoff and sedimenta­

tion

Long term Impervious surfaces, stormvater

runoff, solid vastes, spillages Odors, discharges, bacteria,

viruses

Long term

Shoreline changes, bottom topog­raphy changes, fish migration, benthic fauna changes

Waste discharges, vater quality

Sediment, water quality

Sediment, water quality

Dredging, shoreline e~osion

Circulation patterns in the watervay

Spillages, f±re, and visual im­pacts

Visual impacts, vaste discharges

Sediment runoff, landscape alter­ation, waste discharges

Visual impacts, sediUlentation and erosion

14-4

Primary pollutants

Sediment, dust, noise particulates

Solid "'astes

Sediment, trace ele­ments, noise, caustic chemical wastes, spoil, flo culants, particule fumes, solid ~aste nutrients.

Table 14.1

Continued

OUTLINE OF POTENTIAL ENVIRONMENTAL

IMPACTS AND RELEVANT POLLUTANTS RESULTING

FROM SITE PREPARATION AND CONSTRUCTION PRACTICES

Construction practice

(11) Conveying systems (cranes, hoists, chutes)

(12) Cooling lakes and ponds

(13) Solid waste handling .equipment (incinerators, trash compactors)

d. Security fencing (1) Access road (2) Fencing

Potential environmental impacts

Visual impacts

Conversion of terrestrial and free flo~ing stream environment to a lake environment(land use trade­offs); hydrological changes, habitat changes, sedimentation, water quality

Noise, visual impacts

Long term Increased runoff Barriers to animal movements

Primary pollutants

Particulates, dust, solid wastes

Sediments, wood wastes

Source: Hitt~an Associates, Inc. 1974. General environmental gujdelines for evaluating and reporting the effects of nuclear paver plant site prep­aration, plant and transmission facility constructjon. Modified from: Atomic Industrial Forum, Inc. Washington DC.

14-5

.... « (.)

a g 0 a: g .... w ::;

.... ~

§ 0 a: 0 ,.. J:

Fl GURE 14.1 A POSSIBLE PERTURBATION MATRIX FOR CONSIDERING ENVIRONMENTAL IM~CTS OF THE METHANOL PROJECT

aquatic and marine ecosystems.

Overburden Removal

0

0

0

0

Loss of vegetation

Soil disturbance

Loss of physical shelter

Changes in surface drainage

(All existing habitats above the coal would be lost permanently.)

Overburden Storage and Disposal

0

0

0

0

Loss of habitat (by burial)

Spoil piles could result in:

increased semimentation wind-blow erosion of soil particles Leaching of mineral

Modification of topography

Modification of surface drainage

Dewatering

0

0

Drawdown of water table

Disposal of pumped water (with high dissolved solids content, high acidity, and high metallic ion concentrations)

Among the long term effects to be considered from the project, most

are related to the mining operation and transportation of the feed

stock.

Aquifer Changes

0

0

0

0

Elementation of shallow aquifers

Alterations of percolation properties

Interruption of groundwater flow

Drawdown of deep aquifers

14-7

c

Acid Mine Drainage

0 Low sulfur characteristics of Beluga coal may mmrmrze acidifica­tion (some general conditions to be expected from dewatering include low pH, high specific conductance, high concentration of metallic ions including iron, aluminum and manganese, and a high sulfate concentration).

Sedimentation and Erosion

0

0

0

0

Sedimentation would result from removal of overburden, trans­portation, stream diversions, stream crossings and mine restor­ation.

Dewater discharges may contain fine coal particles, black shale and assorted minerals.

Coal washing would result in the suspension of fine particles of coal.

Solid residues would need to be landfilled.

Surface Water Contamination

0

0

Potential sources of water contamination are acid mine drainage, surface runoff, thermal effluent, various water and coal treat­ment chemicals, dust, leacheates from blasting residues, spoil piles, fuel spillage, ash, toxic strata and industrial wastes.

Introduction of these contaminants would include charges in the dissolved oxygen content of the water, altered rates of photo­symthesis, reduced light penetration, temperature change, pH changes, metallic ion changes and a deterioration of the color and odor of water.

Groundwater Contamination

0

0

Replacement of overburden in mine could have long-term effects on groundwater.

Fuel spills.

Site Restoration

0

0

New vegetation types (monoculture)

Increased soil permeability (acceleration of mass wasting pro­cesses)

14-8

Surface Water Changes

0 Changes in groundwater levels and/or stream flows

Methanol Production

0

0

0

0

0

Groundwater and surface water depletion

Thermal pollution

Potential acid rainfall

Methanol spills

Surface water from contamination from sludge disposal 1 gas purification 1 and wastewater disposal

Increased Harvest and Utilization of Fish and Wildlife Resources

0 Increased harvest of limited populations (due to increased pop­

ulation and ease of access)

Of the above possible impacts 1 the greatest concern focuses on the

impacts related to possible harm to the fishery resource by:

0

0

0

0

Destruction or removal of habitat

Increased sedimentation

Disruption or depletion of flows

Changes in water quality

The final analysis of impacts from this project on fish 1 wildlife and

related environmental values will require the completion of the requi­

site baseline studies and the completion of mine plans and final

design of the project.

MAJOR REGULATORY REQUIREMENTS

Regulations for construction and operation of this facility relative to

impacts on ecosystems would be enforced through the EPA 1 DEC 1

14-9

c

NMFS, FWS and DF&G. This regulation would most likely be in the

form of stipulations concerning both construction and operation that

became a part of either a COE permit for "Discharge of Dredged or

Fill Material into U.S. Waters" or an EPA "Permit to Discharge into

Water" (NPDES). In addition, stipulations related to the issuance of

DF&G's "Anadromous Fish Protection Permit" would provide the state's

primary method for protecting and preserving fish and game of

anadromous waters.

ENVIRONMENTAL ACCEPTABILITY OF PROPOSED ACTION

The vast majority of the potential impacts associated with the pro­

posed project can be mitigated by proper design, construction and

operational procedures. However, impacts on the headwaters of many

of the smaller streams within the system would be unavoidable due to

the very nature of mining operations. The loss of habitat created by

the mines should not, of itself, constitute a substantial impact on the

terrestrial ecosystems; and the reclamation plans provide for the

restoration of such habitat as is lost in the initial mining stages.

Loss of some wetland habitat on the Nikolai escarpment would be

inevitable with the construction of the facility.

Many of the potential impacts indicated will be considered in greater

depth as field investigations continue and more adequate baseline

. information becomes available. This additional information will pro­

vide the basis for the development of adequate mitigative measures.

14-10

c

15.0 AIR QUALITY

Atmospheric pollutant emissions are associated with virtually every

aspect of the proposed project from the mining of coal to the synthe­

sis and shipping of product methanol. Sulfur oxides, particulate

matter, nitrogen oxides, carbon monoxide, and hydrocarbons repre­

sent the bulk of these emissions. The means by which pollutants are

introduced to the atmosphere vary according to the operations creat­

ing the pollutants. Contaminated gas streams are directed to ele­

vated stacks where possible; however, significant emissions are

expected from diffuse, low-level sources such as vehicular traffic,

wind-blown storage piles, and leaks in equipment fittings.

Once a particular pollutant reaches the atmosphere, the likelihood

that it would adversely affect the environment depends on the

ambient concentrations that result and the sensitivities of receptors

that are present. Reasonable predictions of ambient air concentra­

tions (::!: 25%) require detailed descriptions of existing conditions

(pollutant monitoring), all important sources of air pollution, and the

processes that will govern the transport and diffusion of pollutants

(meteorological monitoring). An inventory of receptors in the area

should consider sensitivities of animal and plant life, the possibility

of altering soils and water systems, and other concerns such as

inadvertent weather modification, changes in precipitation chemistry,

deterioration of man-made materials, and visibility impairment. The

existing data base is not sufficient to support a detailed analysis of

the air quality impact of this project. There have been no previous

efforts to collect meteorological or air quality data in the project

area. The nearest National Weather Service stations are at Kenai and

Anchorage, 35 and 75 miles away. Meteorological data also have been

collected at the oil platforms in Cook Inlet, and at the Beluga power

plant to ·the north and the Big River weather station to the south.

The goals of this impact analysis therefore are limited to identification

of the major sources of atmospheric pollutants, determination of

the temporal and spacial scales over which significant impacts would

15-1

(',

occur, and recommendations on how to perform a more detailed analy­

sis capable of satisfying the technical documentation requirements of

a permit to operate a source of air pollution in the State of Alaska.

In the remainder of this section both construction and longer term

effects are discussed with regard to the above objectives. An emis­

sions inventory is presented for each case, and for situations when

estimates of ambient air concentrations were possible the results of

these calculations are discussed. Since the applicability of ambient

air concentration estimates is limited to well defined sources of pol­

lutants, the air quality impacts of construction and mining activities

are described largely in qualitative terms.

CONSTRUCTION EFFECTS

Pollutants of concern which would be associated with the construction

phase of this project are particulate matter, nitrogen oxides, carbon

monoxide, hydrocarbons, and sulfur oxides. Emission rates would

vary seasonally depending on the amount of construction activity and

the frequency of precipitation. Total annual emissions of pollutants

would also vary during the anticipated 38-month construction period,

reaching a peak in 1986.

The two largest classes of air pollutant sources during plant con­

struction would be land disturbances and vehicular exhausts.

Particulate matter would be generated by site clearing and prepara­

tion, the action of wind on exposed surfaces, gravel extraction and

preparation, concrete batching operations, the burning of tree and

brush cover, and diesel and gasoline powered equipment. Combustion

of diesel fuel, gasoline, and vegetative cover also would produce

carbon monoxide and hydrocarbons. Nitrogen oxides and sulfur

oxides would be associated with diesel fuel and gasoline combustion,

and to a lesser extent tree and brush burning. Significant ambient

air impacts from the various pollutants emitted could affect an area of

40 square kilometers around this concentration of sources.

15-2

("\

Pollution control measures would focus on the largest source of pollu­

tants, vehicular traffic. Roadways, once built, would receive regular

maintenance and would be sprayed with chemically treated water

during dry spells. To the maximum extent possible, traffic would be

confined to these roads. Vehicular exhaust emissions would be min­

imized through a regular inspection and maintenance program. To

insure that the above practices would be implemented throughout the

entire construction phase, they could be incorporated in construction

contracts along with the other usual construction specifications.

EMISSIONS AND LONG TERM EFFECTS

Process Plant Area Emissions

0 Coal Preparation

Coal arriving at the methanol plant would require a considerable

amount of handling before use. Dust is generated during unload­

ing; stacking and reclaiming of storage; and conveying, crushing,

and screening operations. For the most part, this dust can be

collected and passed through bag-type filters capable of 99.9%

recovery. All operations except unloading, stacking and reclaim­

ing can be controlled in this manner. A spray suppression system

would control dust at the coal unloading station. Stacking and

reclaiming of coal would be done with a bucket wheel stacker/

reclaimer. When this piece of equipment is operated properly,

dust emissions can be reduced significantly compared to conven­

tional methods of storage addition and recovery. Also, vehicular

traffic around the storage pile, which can contribute up to 40% of

the total fugitive particulate matter emissions associated with raw

material storage facilities, is virtually eliminated by this method.

15-3

0

0

Process Coal

Process coal must be dried before gasification, and this would be

accomplished with coal-fired thermal dryers. Particulate matter,

sulfur oxides, nitrogen oxides, carbon monoxide, and hydrocar­

bons would be emitted during this operation. The contaminated

exhaust gases would be scrubbed of particulate matter, then

vented to the atmosphere. Ash and char would be conveyed

pneumatically from the boilers and gasifiers to the coal preparation

area before being loaded aboard trains bound for the mine. The

nitrogen gas used as a transport medium would be vented to the

atmosphere after. a baghouse removed particulate matter. Carbon

monoxide and a small amount of hydrogen sulfide would be present

in this exhaust.

Coal Gasification

The major, distinct sources of pollutants in this section would be

related to the acid gas removal and sulfur recovery processes.

Excess carbon dioxide would be removed selectively from the syn­

thesis gas in the acid gas removal process and then released to

the atmosphere. This carbon dioxide exhaust would be contamin­

ated with hydrogen sulfide, carbonyl sulfide and carbon monoxide.

Synthesis gas also would be stripped of hydrogen sulfide, result­

ing in a contaminated gas stream that requires further processing.

A Stretford sulfur recovery system would remove 99.5% of the

hydrogen sulfide from this stream. Cleaned gas which contains a

small amount of hydrogen sulfide, carbonyl sulfide and carbon

monoxide then would be vented to the atmosphere.

In the area where methanol is produced from synthesis gas, a

reformer furnace would be used which burns purge gases from

downstream methanol synthesis operations. Combustion products

containing nitrogen oxides would be exhausted to the atmosphere.

The gasifier coal-feed system would require nitrogen purging to

15-4

0

remove gases that escape from the gasifiers during charging.

These purge streams would be directed to a continuously operating

elevated flare. Vapor recovery systems on synthesis gas scrubber

wastewater treatment and compression equipment also would be

directed to this flare. Particulate scrubbing would be performed

before the coal-feed system and wastewater treating vents were

flared.

Fugitive Emissions

Associated with synthesis gas processing would be fugitive emis­

sions from leaks in pipeline valves and flanges, relief and sam­

pling valves, pump and compressor seals, and fuel and product

storage tanks. Product storage losses and compressor seal losses

would be controlled by vapor recovery systems. This is also true

for losses associated with shiploading of methanol. The remaining

sources of fugitive emissions must be controlled through regular

monitoring and maintenance. These fugitive emissions would

include hydrocarbons, carbon monoxide and h}ldrogen sulfide.

A single water cooling system using mechanical draft cooling

towers would serve various heat exchanging equipment throughout

the plant. Water tosses to the atmosphere would only be contamin­

ated by leaks that develop in any of these heat exchangers.

Possible contaminants include gaseous compounds such as carbon

monoxide and hydrogen sulfide, hydrocarbons (mostly methanol),

and dissolved solids that are not removed in make-up water treat­

ment.

Power Plant

The majority of steam and all power requirements would be supplied

by coal and gasifier char fired boilers. Combustion products would

be vented directly to the atmosphere after approximately 99.9% par­

ticulate removal by a bag-type dust collector. This exhaust stream

15-5

c

would contain residual particulate matter, nitrogen oxides, sulfur

oxides, carbon monoxide and hydrocarbons. Particulate matter emis­

sions would have a composition similar to the ash produced. With a

few notable exceptions, trace elements would appear in the same con­

centrations both in bottom ash and fly ash. Very efficient particu­

late removal is, therefore, an effective way of minimizing trace ele­

ment emissions. Certain emissions of mercury and selenium may be

volatile in the boiler exhaust gas and could not be captured by a bag

filter. Elements such as lead and cadmium tend to be concentrated in

the fly ash, thus decreasing the effectiveness with which a bag house

can reduce their emission. Other trace elements of concern that have

been detected in Alaska coals are beryllium and fluorine.

0 Start-up and Shutdown

Pollutant emissions during start-up would differ from normal oper­

ating emissions for two important reasons: Initial heat require­

ments would be supplied by natural gas combustion, and off­

specification synthesis gas would require disposal. One low­

pressure flare system would be necessary to burn off-specification

synthesis gas produced in the gasification start-up sequence.

This gas would be scrubbed of particulate matter before flaring.

It would not pass through sulfur removal equipment, so sulfur

oxides would be emitted, as well as nitrogen oxides and particulate

matter. Natural gas burned for initial equipment heating would

create nitrogen oxides, sulfur oxides, carbon monoxide, particu­

late matter and hydrocarbons. In the coal preparation area a

small increase in fugitive particulate matter emissions would be

expected due to the increased activity around storage piles as

they are brought up to the required size.

Process equipment must be shut down for inspection, maintenance

and cleaning, causing changes in emissions similar to those exper­

ienced during start-up. Particulate matter, sulfur oxides and

nitrogen oxides would be emitted from the low pressure flare sys-

15-6

0

tern until gasification stops. The initial purge of shutdown equip­

ment also requires flaring.

Emergencies

Diverted synthesis gas would be directed to either the high or low

pressure flare system in the event of process upsets that cause or

require equipment shutdowns in any of the three methanol produc­

tion trains. Nitrogen oxides, sulfur oxides, particulate matter,

carbon monoxide and hydrocarbons would result from flaring the

diverted gas streams.

Mining Area Emissions

The largest emissions of air pollution which would be associated with

the surface mining activities arise from major equipment operation and

haul road traffic. Minor sources include the coal handling facilities,

and blasting, drilling, and ash unloading operations. The diesel­

electric railroad which would transport coal from the mine to the

plant and ash from the plant to the mine would be a significant

source of pollutants. Most of the total emissions from all of the

above sources would be comprised of particulate matter; however,

diesel fuel combustion also produces nitrogen oxides, carbon mon­

oxide, sulfur oxides and hydrocarbons.

Air pollution control measures for mining and coal transportation

address both major and minor sources. Water trucks would be used

to wet haul roads in dry weather. Emissions from diesel fuel com­

bustion can be minimized by an aggressive repair and maintenance

program. Dust collection would be possible for coal handling opera­

tions (screening, crushing, conveying). Coal storage piles, normally

one of the largest sources of particulate matter, would be enclosed,

and recovery of coal would be from the bottom of the heap. Tempor­

ary stabilization of spoil piles before recycling and of ash soil cover

before revegetation would minimize wind-generated dust.

15-7

Air Emission Effects

Emission rates for the various pollutants were related to ambient air

concentrations by means of computer-based atmospheric dispersion

models. These dispersion models are generally classified as the

Gaussian type and are considered to be state-of-the-art techniques

for estimating the impact of non-reactive pollutants. Some basic

assumptions inherent in these algorithms are:

1. The emission rate is constant and continuous over the time period

of interest.

2. All meteorological variables are constant over the time period of

interest.

3. The wind speed is constant throughout the height of the plume.

4. Concentration profiles in the crosswind and verticle directions are

described by Gaussian distributions.

5. Adsorption 1 deposition 1 and possible chemical changes within the

plume are not considered.

6. The effects of terrain on wind currents are not considered.

The procedures used to make dispersion estimates were: All plant

emissions were quantified and points of release were described;

meteorological conditions leading to high ambient air concentrations

were identified for each source type; and finally 1 calculations were

made of the maximum ambient air concentrations which could result.

The values obtained were compared to applicable air quality stan­

dards.

15-8

(~

Models Used

Two EPA recommended dispersion models were used in this screening

analysis. The PTMAX model, a single source model capable of esti­

mating maximum ambient air impacts and the distance downwind that

they will occur, was used for evaluating the impact of point sources

in neutral/unstable atmospheric conditions for averaging periods 24

hours or less. The VALLEY model was used for estimating 24-hour

average concentrations due to all sources for which stable atmos­

pheric conditions and impaction of plumes on elevated terrain was a

concern. VALLEY was also used for calculating annual average con­

centrations for S02 , N02 , and particulate matter.

Since estimates of pollutant concentrations are required for various

averaging times ranging from 1 hour to a day, and the PTMAX model

only calculates concentrations appropriate for a 1 hour average, fac­

tors relating concentrations averaged over different time periods were

used. In this way multiple hourly average concentrations could be

estimated from 1 hour average concentrations. These factors were

applied independent of stability classification and in the following

manner:

X (3-hour) = 0.8X(1-hour)

X (8-hour) = 0.6X(1-hour)

X(24-hour) = 0.3X(1-hour)

Table 15.1 summarizes New Source Performance Standards (NSPS)

emission requirements and expected emission rates based on a meth­

anol production rate of 54,000 barrels per day.

The Clean Air Act created regulatory requirements to prevent sig­

nificant deterioration (PSD) of air quality both in attainment areas,

or areas of the country currently cleaner than the National Ambient

Air Quality Standards (NAAQS). The Beluga-Tyonek areas currently

have ambient air quality cleaner than defined in the NAAQS for cri­

teria pollutants, and has been designated a Class II attainment area.

15-9

~~ \ ' '._ ,./

Table 15.1

NEW SOURCE PERFORMANCE STANDARDS AND ANTICIPATED EMISSION RATES

NSPS EMISSION LIMITATIONS EXPECTED EMISSIONS (l:!g/dscm unless SE!ecified) Source 502 N02 Particulate Opacity 502 N02 Particulate co Reduced s

Boilers 1.2 lbs 0. 70 lbs 0.10 lbs 20% 0.53 lbs 0.70 lbs 0.10 lbs 0.08 lbs MMBtu MMBtu MMBtu MMBtu MMBtu MMBtu MMBtu

Coal Dryers 1Q....H9 20% 44 82.1 24.2 27 dscm

Coal 1.Q....H9 10% Preparation dscm

Ash Loading 0.2 gm/sec

Coal Storage 4. 4 gm/sec

Flare 18.3 23

Sulfer 50 28 Recovery

Ash & Char 1.6 547.3 5.5 Transport

Reformer 78.7

PSD review is required when a criteria pollutant in an attainment

area for that pollutant is emitted in excess of 100 to 250 tons per

year after the use of pollution control equipment. Acceptable and

expected emissions levels for applicable criteria and non-criteria pol­

lutants are given in Table 15.2.

Table 15.3 summarizes the yearly emissions of particulate matter,

sulfur oxides, nitrogen oxides, carbon monoxide, reduced sulfur

compounds, and hydrocarbons that would be associated with the coa)

gasification plant and the mine. The emissions rates are based on a

methanol production rate of 54,000 barrels per day.

The procedures for estimating maximum concentration increases due to

the new source were designed to describe worst case situations with

a factor of safety. When it was determined that allowable increases

or concentration ceilings would be threatened, it was concluded that

the disperson of emissions creating these conditions should be

analyzed in more detail.

The models used are subject to limitations not only due to assump­

tions inherent in their use but also because the input data are not

necessarily truly representative of conditions at the proposed site.

The primary concerns about the applicability of this analysis and

their impact on a preconstruction monitoring program are discussed

below.

1. PTMAX and VALLEY models use vertical and horizontal dispersion

parameters (az and cry in the calculations) that were developed for

releases over open, flat terrain and short (a few kilometers) dis­

tances of travel. Dispersion in complex terrain is better de­

scribed by site-specific parameters that can be developed from

measurements of wind speed fluctuations. Since the diffusion of

pollutants is sensitive to these measurements of turbulence, a

monitoring program that would provide enough data to calculate

15-11

n (~ \ /

(~ /

Table 15.2

ACCEPTED AND ANTICIPATED EMISSION LEVELS

Air PSD Maximum Significant Significant Area of

s~:n~~rdsa Class It b Impact of Distance

A:~~~~/ir Monitoring d Significant Increment all Sources of Maximum Concentrations Impact

Pollutant (p9/M3) (1:!g/M3) (l:!g/M3) (KM) (1:!g/M3l (!;!g/M3) (Km2 ) Comments

Sulfur Oxides 1. No monitoring exemption. 3 hr. 1300 512 25 2. Area of significant impact

24 hr. 365 91 100 10 5 13 entirely north/northwest of Annual plant site.

Nitrogen Oxides 24 hr. 14 (See Sulfur Oxides) Annual 100 6 10 100+

Particulate 1. No monitoring exemption. Matter 2. Area of significant impact to 24 hr. 150 37 40 7 5 10 the immediate northwest of Annual 60 19 1 4 plant site (3 l<m).

Car·bon 1. Possible monitoring exemption. Monoxide However, all sources have not

I hr. 40000 2000 been considered. 8 hr·. 40000 200 3.5 500 575

Reduced Sulfur· (See Carbon Monoxide) 30 min. 50 10 (1 hr) 3.5-7.0 .04 (H2S)

a. 18 aal 50.10. b. 40 CFR 51.24. c. "Ambient Monitoring Guidelines for Prevention of Significant Deterioration (PSD), " USEPA, November, 1980.

~~ I ;

Table 15.3

EMISSION INVENTORY

LONG TERM EMISSIONS (TN/YR) Reduced

Sulfur Nitrogen Sulfur Particulate Oxides Oxides Carbon Compounds*

Source Matter (AS S02) (AS S02) Monoxide (AS S02) Hydrocarbons

1. Boilers 1720 8935 12000 1314 263

2. Dryers 613 1112 2090 280 44

3. Continuous Flaring N.E. 140 180 N.E. N.E.

4. Acid Gas Removal 2800 48 C02 Vent

5. Sulfur Recovery 302 102

6. Coal Preparation 47 Area Dust Collection

7. Coal Storage 175

8. Railroad 30 70 390 190 33

9. Reformers 13a 25a 814 31a 6a

10. Ash & Char Transport 9 1000 6

11. Storage Tanks X X

12. Process Plant Fugitive N.E. N.E. N.E. N.E.

n1

1 \ ,/

Source

13. Mining

a. Fugitive

b. Heavy Equipm~nt

Startup Emissions (lb/hr)

1. Gasifiers (10 hrs.)

2. Boilers (2 hrs.)

3. Flaring (2 hrs.)

Emergency Emissions ( lb/hr)

1. Low Pressure Flaring (10 min.)

2. High Pressure Flaring (10 min.)

X = later

Particulate Matter

N.E.

X

() ' /

Table 15.3 Continued

EMISSION INVENTORY

LONG TERM EMISSIONS (TN/YR) Reduced

Sulfur Nitrogen Sulfur Oxides Oxides Carbon Compounds*

(AS S02) (AS S02) Monoxide (AS S02) Hydrocat·bons

X X X X

the dispersion parameters appropriate for the proposed plant site

is necessary.

2. Background concentrations used in this analysis were necessarily

conservative. In some cases they represent a significant portion

of the ambient air concentration ceiling. A monitoring program to

measure the actual concentrations of S02 , N02 , and TSP would

greatly improve estimates of maximum impacts. In addition, mon­

itoring data for N02 taken by others south of the plant site and

across Cook Inlet, where most of the industrial development is

located, would help to determine whether pristine conditions are

present in that area also.

3. Meteorological data used for input to the annual average analysis

was collected at a National Weather Service Station near Kenai.

These data must be assumed to vary somewhat from actual condi­

tions in the project area, but are considered sufficiently repre­

sentative for use in this preliminary feasibility analysis.

MAJOR REGULATORY REQUIREMENTS

The federal Clean Air Act Prevention of Significant Deterioration

(PSD) program and the State of Alaska Air Quality Control Permit to

Operate program are the two significant regulatory frameworks that

would impose major permit requirements on this project. The PSD

program requires preconstruction approval of plants that have sig­

nificant emissions potentials. A plant is subject to PSD regulations if

potential emissions of any regulated pollutant exceed 100 tons per

year for plants within 28 specified industrial categories or if potential

emissions exceed 250 tons per year for any other plant. Coal gasifi­

cation or methanol plants are not listed among the 28 source types.

However, the proposed plant would generate the pollutant emissions

estimated to exceed 250 tons per year, so PSD preconstruction review

would be required. The review is an extensive procedure involving

15-15

baseline meteorological and

analysis and an intensive

Protection Agency (EPA).

air quality monitoring, rigorous data

permit review by the Environmental

The Region 10 office of the EPA would

review this project and issue the PSD permit. PSD permits typically

stipulate compliance monitoring and reporting. A lead time of 24 to

30 months should be allowed to complete the permitting process.

The State of Alaska Air Quality Control permit program is adminis­

tered under the authority of 18 AAC 50 by the Alaska Department of

Environmental Conservation. This program involves a permit to

operate, compared to the preconstruction review concept on which the

PSD program is based. Permit applications should be filed with the

DEC 30 days or more prior to the commencement of operations, and

must be accompanied with a specified set of information and operating

documents. The DEC may require the permit applicant to install and

maintain monitoring equipment, and to provide source test reports,

emission data and periodic reports. The Air Quality Control Permit

to Operate is issued for a period not to exceed 5 years, at which

time a permit application must be filed anew.

ENVIRONMENTAL ACCEPTABILITY OF PROPOSED ACTION

A review of existing data concerning meteorological and ambient air

quality background conditions and the screening review of the anti­

cipated emissions from the plant indicate that the proposed facility

could be built well within the limits of present air quality laws using

current technology. There would be measurable deterioration of the

ambient air quality surrounding the immediate project area, but it

would be well within the allowable increments set forth in the federal

environmental regulations. This feasibility study indicates that both

the state and federal permits could be obtained, although in the case

of the PSD permit it could be an expensive and time consuming

process.

15-16

c) 16.0 OCEANOGRAPHY

CONSTRUCTION EFFECTS

Oceanographic conditions within the Beluga/Trading Bay/Drift River

area probably would be only slightly and temporarily affected by

construction of the proposed facilities including the construction

dock. The primary impact would be relatively small increases in the

amounts of sediment and turbidity in the marine environment.

The ocean floor would be disturbed temporarily by the driving of

piles for the construction dock facilities. Fill material utilized in the

construction of the dock would be clean, well graded sands and

gravels to minimize the impact on water quality. The estimated sus­

pended sediment which would be created by all the construction

activities is very small relative to the normal amount of sediment

naturally present in upper Cook Inlet waters.

LONG-TERM EFFECTS

The effects of accidental spills of methanol into the marine environ­

ment are considered later in Section 21.0 METHANOL IN THE ENV I­

RONMENT. This discussion considers the source and transport of

those potential spills. The most likely opportunity for an accidental

spill would be at the Drift River terminal, either during maneuvering

or load transfer operations. Spills also could occur in transit, most

commonly due to equipment failure, human error, ballast discharges,

structural failures or vessel casualities. Hazards to navigation in

Cook Inlet and ice conditions are considered in Section 7.0 OCEAN-

OGRAPHY.

The two main factors which affect transport of spills are currents

and wind. Generally the speed of pollutant transport due to current

and wind is 3% of the wind speed plus the current speed. Detailed

16-1

c

current measurements along the west side of upper Cook Inlet are

lacking, therefore, specific pollutant transport determinations cannot

be made. Generally, currents move north along the west side of the

inlet, mixing with freshwater sources which flow in from the major

tributaries, and then move easterly near Fire Island, and south along

the Kenai Peninsula. Bathymetry, tidal ranges, and currents are

being studied in this general area as part of another project study

related to the development of the Beluga coal fields.

MAJOR REGULATORY REQUIREMENTS

During construction, fill material would be dredged out of and/or

placed into upper Cook Inlet -- a navigable waterway. In addition,

the construction operation would place a structure in a navigable

waterway. These operations would require two permits, to be ob­

tained from the U.S. Department of Defense, Department of the

Army, Corps of Engineers.

The discharge of dredge or fill material into U.S. waters, including

tidelands and wetlands, must be authorized by the Corps of Engi­

neers. This permit is mandated primarily by Section 404 of the Clean

Water Act, as Amended. The other major federal permit concerns the

placement of any structure in or over the navigable waters of the

United States; or the excavation of material in such; or the accomp­

lishment of any other work affecting the course, location, condition

or capacity of such waters. This permit requirement originates from

Section 10 of the River and Harbor Act of 1899.

In addition to the above federal programs, state regulations affecting

the proposed project are concerned primarily with discharges to the

marine environment and adherence to pertinent coastal zone manage­

ment regulations.

16-2

ENVIRONMENTAL ACCEPTABILITY OF PROPOSED ACTION

The anticipated short-term construction effects on the marine envi­

ronment are considered to be nominal due primarily to the size of

Cook Inlet and the heavy natural sediment load. With adequate

safeguards, the long-term impacts should also be negligible.

16-3

17.0 ARCHAEOLOGIC AND HISTORIC SITES

CONSTRUCTION EFFECTS

A literature survey of historical and archaeological sites indicates

that there are eight sites besides the many within the present Village

of Tyonek that are near the study area. Only the site at the Village

of Ladd lies outside of the former Moquawkie Reservation boundaries

in the lower Chuitna River vicinity. The possibility that undiscov­

ered sites might be found or impacted during construction activities

is always present.

An on-the-ground survey would be necessary to determine the prob­

able location and significance of any sites in the area. Probable sites

would include aboriginal hunting trails; remains of structures and

artifacts situated along those trails; seasonal camp sites, particularly

in fishing areas; storage cache pits; and military trails.

Greatest potential impact to unidentified archaeologic and historic

sites would arise during opening of and production from a surface

coal mine. Any site not identified before production begins probably

would not be recognized during production. Indirect impacts to the

sites could arise from exposure to the influx of additional people to

the previously remote area.

LONG-TERM EFFECTS

Long-term effects of the proposed development regarding preservation

of archaeologic and historic sites could result from the increased use

of the area, particularly if visitors included amateur artifact collec­

tors.

17-1

MAJOR REGULATORY REQUIREMENTS

Prior to commencement of construction 1 a letter detailing the proposed

construction and a map outlining the impacted area must be sent to

the chief of the State Office of History and Archaeology. A review

of the application will be made by the state, and a determination will

be made concerning whether an on-the-ground survey of the area is

necessary. The guidelines for such a survey can be found at 36

CFR 800, Protection of Historic and Cultural Properties.

ENVIRONMENTAL ACCEPTABILITY OF PROPOSED ACTION

There are no known archaeologic or historic sites in the immediate

project area. Although research indicates a potential for various

cultural remains in the general vicinity 1 careful construction practices

and a preconstruction archaeological survey would prevent adverse

effects on potential archaeologic or historic sites.

17-2

18.0 SOLID WASTE

CONSTRUCTION EFFECTS

Clearing Debris

Vegetation consisting of brush and moderate tree cover would be

cleared from approximately a 1 ,000-acre plant site area. In addition,

vegetation would be cleared from a transportation corridor to the the

mine areas. Material would be stacked and burned. Air quality

would be temporarily impacted adversely in the surrounding area but

rapid dispersion in a clean air shed should quickly alleviate the

effects.

Construction Refuse

Solid waste refuse produced during construction would consist pri­

marily of construction rubble including boxes, cans, wrapping

paper, hardware, broken and leftover materials, etc. Construction

workers would generate additional refuse (Table 18.1), at a rate of

about 7 lbs. per worker per day. This refuse would be compacted

and disposed of in an environmentally acceptable landfill.

Manpower (Date)

500 Construction

(1984-85)

3,500 Construction

(1986)

Table 18.1

CONSTRUCTION REFUSE

Compacted Refuse Lbs. /Day Cu. Ft. /Day

3,500 88

24,500 612

Bulky Lbs./Day

3,500

24,500

Refuse Cu. Ft. /Day

605

4,235

Basis: 7 lbs/day generated per man. (Anderson 1972) Bulky Refuse: 162 lb./cu.yd. (Jackson 1979) Compacted Refuse: 40 lb./cu.ft. (Kroneburger 1977)

18-1

LONG-TERM EFFECTS

Ash and 51 udge

Ash and char would account for the largest amount of solid waste.

There also would be some sludge, which would be predominantly ash

that has been scrubbed from the raw gas, then concentrated.

Ash and sludge streams would be generated from coal storage and

preparation, gasification, raw gas cleaning, and cooling processes.

Precipitation would be the major problem in the coal storage and

preparation area. Runoff water would contain suspended particulate

matter. This water would be collected in a retention pond lined to

prevent groundwater seepage, and would have a residence time of

significant duration to allow solids to settle and to promote biological

action.

Retained solids would result from stockpiled coal, which is not a

solid waste as defined by 40 CFR 261 (A) and, therefore, not sub­

ject to Resource Conservation and Recovery Act (RCRA) regulations.

The largest amounts of ash and char would be produced by the gas­

ification of coal in the Winkler gasifiers and the subsequent gas cool­

ing and char recovery. Ash and char also would be generated in

the coal receiving, storage and preparation areas. Char from the

waste heat recovery system would be removed by dry cyclones and

used as fuel in the offsite boilers and therefore is not a waste

stream, but a fuel material. Ash would be produced from the power

plant boilers. The combined solid waste that must be disposed of is

described in Table 18.2.

Ash would be produced by the power plant boilers. The combined

solid waste that must be disposed of is described in Table 18.2.

The ash and char solid waste is not a hazardous waste as described

in 40 CFR 261.3. The preferred method of handling would be to

18-2

Table 18.2

COMBINED SOLID WASTE

Tons per Day (TPD)/Cubic Yards per Day (Cy/d)

Coal/Char Water Total Dry Wet

TPD Ash TPD TPD TPD Cy/ d Cy/d Cy/d

181.0 689.1 2,917.6 2,917.6 3;974 1,544 2,430

132.5 4,595.9 945.2 5,673.6 9,831 8!709 1 '122

313.5 5,285.0 2,992.7 8,591.2 13,805 10,253 3,552

return it to the mine pit as part of the surface mining reclamation

program. . Two trains each utilizing 11 special side-dump ash cars

would operate three trips per day to dispose of a total 66 carloads of

ash. Two trains utilizing 12 special side-dump sludge cars would

make three trips daily to dispose of a total 72 carloads of sludge per

day. The combined ash and car would contribute a total dry volume

of 10,253 cubic yards per day of solid waste toward filling the mine

pit. Although this volume would be easily accommodated in the mine

pit, a substantial committment of real estate would be required to

dispose of the same quantity in a sanitary landfill.

Any solids remammg in the raw gas would be removed in the raw

gas cleaning and cooling sections by Quench Venturi type scrubbing.

The spent water would be withdrawn to settlers where the particle­

laden water would be concentrated to 15% solids content, then sent

to a rotary filter system it would be concentrated to 70% solids. The

filtrate would be sent to wastewater treatment. Further evaluation

of the cake is necessary to determine an environmentally suitable

method of disposal.

18-3

Methanol Process Solid Wastes

Solid process wastes consist of spent catalysts from various process

sections including CO shift and COS hydrolysis, acid gas removal,

sulfur recovery system, guard vessels, and methanol synthesis. It

must be emphasized that catalysts are only disposed of periodically.

Expected normal catalyst lives are given in Table 18.3.

Table 18.3

EXPECTED LIVES OF CATALYSTS

Catalysts

CO Shift COS Hydrolysis Sulfur Guard (ZnO) Chlorine Guard (Proprietary) Methanol Synthesis (Cu Based, Proprietary)

Normal Life

3 years 3 years

1.5 years 1.5 years

5 years

Further evaluation of each spent catalyst will be needed to determine

methods of disposal which are environmentally acceptable. Spent

catalysts in solvents generally would be regenerated, but those

which must eventually be thrown away are sufficiently benign that

they can safely be disposed in a landfill. Several spent catalysts

may have a marketable value for recovery of metals. These include

ZnS from spent ZnO and spent copper-based catalyst from methanol

synthesis.

Further evaluation of purge solution from the acid gas recovery unit

is also needed. However, sodium sulfate, sodium thiosulfate and

sodium carbonate are not on the hazardous materials list (40 CFR

261 [D]).

Approximately 22 tons per day of by-product sulfur would be pro­

duced from the Stretford sulfur recovery unit. This would be a

chemically inert material most likely in the form of molten sulfur. It

is nonhazardous. The preferred method of handling the material

would be to return it to the mine pit as part of the surface mining

reclamation program.

18-4

Hazardous Substances

The solid waste materials anticipated to be produced from the gasi­

fication/methanol plant operation were reviewed, and at this time

there are no materials known which are considered to be hazardous

per the Subpart D list of materials in the Hazardous Waste Manage­

ment System (40 CFR 261[D]). After the plant commences operation,

a testing program would be required to confirm that hazardous mate­

rials are not being produced. If it is discovered that any of the

materials are hazardous, they would be subject to the 11 cradle-to­

grave11 control as defined in RCRA.

Fugitive Coal Dust

Although coal dust is a solid waste by-product from plant operation,

the discussion of its impacts is presented in Section 15.0 AIR

QUALITY since it is an airborne contaminant.

Refuse

Operation of the plant and mine would generate refuse in amounts

estimated as:

Manpower Basis 1,000

Compacted Refuse 175 cu.ft./day (7,000 lbs/day)

Bulky Refuse 1,210 cu.ft./day (7,000 lbs/day)

This material either would be incinerated or disposed of in an envi­

ronmentally acceptable landfill. An incinerator would be subject to

environmental controls under Alaska Solid Waste Management Regula­

tions (18 AAC 60) which control particulate emissions to the atmos­

phere. A landfill would be subject to regulations under the same

program to control possible leachate contamination of surface and

groundwater systems.

18-5

(~

c

Sanitary Waste Solids

Sanitary wastes would be processed in a treatment plant at the

secondary level such that the effluent can be discharged either to

Cook Inlet or Nikolai Creek in a manner that does not cause violation

of Alaska Water Quality Standards. The sludges would be disposed

of in a landfill.

MAJOR REGULATORY REQUIREMENTS

RCRA of 1976 (Federal)

The Resource Conservation and Recovery Act of 1976 (RCRA) re­

quires the Environmental Protection Agency to establish a national

Hazardous Waste Management Program to regulate all aspects of haz­

ardous waste from the time it is generated to the time it is properly

disposed of. This gives the EPA important regulatory authorities

with respect to hazardous waste.

On May 2, 1980 the EPA instituted a 11 cradle-to-grave11 management

system which was promulgated in the May 19, 1980 Federal Register.

These regulations are expected to have a major effect on the methods

used for hazardous waste disposal.

The new regulations require previous land-based disposal and com­

bustion management techniques to exhibit more efficient disposal

technologies. Land-based disposal facilities are required to demon­

strate more effective containment of waste. This containment should

prevent the leaching of contaminants into groundwater sources.

Ambient groundwater monitoring of surface impoundments, landfills

and land-treatment facilities containing hazardous wastes will be

implemented to evaluate containment efficiency. Ambient groundwater

monitoring must be initiated by November 19, 1981 unless it can be

shown that the hazardous waste has a low potential for migration.

18-6

Combustion technologies will also be required to show improved per­

formance standards for emission control, destruction efficiency and

residual management.

A solid waste is classified hazardous if it exhibits any one of the

four characteristics of ignitability, corrosivity, reactivity and toxi­

city (40 CFR 261 [C]) or is included on the list developed by EPA

(40 CFR 261 [D]). Persons who generate, transport, treat, store or

dispose of such hazardous wastes must comply with all applicable

requirements of 40 CFR 122, 124 and 262 through 265 of Chapter 1

and the notification requirements of Section 3010 of RCRA. 40 CFR

261 (A) establishes special requirements for small-quantity genera­

tors (less than 1,000 kg/mo). It also contains the EPA definitions of

solid and hazardous wastes plus a list of materials which are either

wholly or partially excluded from the requirements in 40 CFR Parts

262 through 265, 122 and 124.

18 AAC 60 (State of Alaska)

Under the Alaska Administrative Code (ACC), a Solid Waste Manage­

ment program is administered by the Alaska Department of Environ­

mental Conservation. The program institutes a permitting procedure

to control landfill operations and incinerators with greater capacity

than 200 pounds per hour. The disposal methods selected for this

project would require permitting under 18 AAC 60.

ENVIRONMENTAL ACCEPTABILITY OF PROPOSED ACTION

All known solid wastes from this project should be safely disposable

either in a landfill or by incineration. There are some methods of

disposal for certain sludges that are yet to be defined. If any of

these materials turn out to be hazardous or otherwise unsafe to dis­

pose of either in a sanitary landfill or in the mine reclamation oper­

ations, other environmentally acceptable alternatives such as inciner­

ation or removal to a hazardous waste depository would be employed.

18-7

19.0 SHORT- AND LONG-TERM SOCIOECONOMIC EFFECTS

COOK INLET IMPACTS

Population and Employment

In the long term, it is expected that the project would create some

1,300 direct·. and indirect jobs at the project site, and a local popu­

lation of approximately 2,600. Much of this employment likely would

originate from Anchorage and the Kenai Peninsula. It is unlikely

that additional employment and population would result directly from

this project on the west side of Cook Inlet (discussed further in the

following section). However, it is expected that the project would

generate additional employment in Anchorage and the Kenai-Soldotna

area. These off-site employment effects would result from the pur­

chases of goods and services by the plant and its work force, and

from the expenditure of property tax revenue by the Kenai Peninsula

Borough.

As the commercial transportation and communications center of

Alaska, Anchorage is affected to some extent by resource develop­

ment throughout the state. The secondary economic impact on

Anchorage would be significant with this project because it is located

only 75 air miles from the city. It is likely that the plant operator

would locate its administrative headqu;wters in Anchor·age, Lhus

creating direct project employment in the municipality. However, it

is indirect employment and income created by the plant which would

be most important to Anchorage. Substantial quantities of opera­

tion and maintenance supplies would be purchased in Anchorage or

through Anchorage dealers, as would construction, engineering,

transportation, and other services. Material and labor for specialty

fabrication and construction associated with ongoing capital improve­

ments would also be purchased in Anchorage and, to a lesser extent,

in the Kenai area.

19-1

c

In addition to goods and services purchased by the plant operator

and its contractors, Anchorage would also provide goods and serv­

ices to the residents of the new west Cook Inlet community. Anch­

orage wholesalers would supply local retailers with the bulk of

groceries and durable goods .that they would market in the new

town.

Public sector expenditures from property tax revenues derived from

the project may also be expected to create employment, in this case

for the Kenai-Soldotna area. Predictions of future property tax

revenues to the Kenai Peninsula Borough from the project have not

been attempted, but they likely would be substantial. Much of the

property tax revenue generated by the project likely would be used

to provide local services to the new town residents. However, the

plant would represent a significant taxing asset to the entire bor­

ough (it would substantially increase the per capita valuation of the

borough), and revenue derived from it would be used to expand

borough services and facilities on the peninsula, as well as in the

west Cook Inlet project area. Thus, the project would result in an

expansion of borough employment and borough-related employment

(construction and maintenance work, etc.) in Soldotna and elsewhere

in the borough. Also, the scope of routine administrative tasks of

the borough (planning and zoning, for example) would expand as a

result of the existence of the plant and new town, necessitating some

increase in borough staff.

Growth-1 nducing Effects

Apart from the secondary employment effects in the Anchorage and

Kenai areas discussed above, this project would not be expected to

stimulate 11 downstream 11 industrial development or other sizable com­

mercial or resource development ventures locally or elsewhere in the

state.

19-2

Methanol produced by this project would be used primarily as a sup­

plemental fuel source. Its primary market would be the west coast

of the United States. Its high cost relative to other energy sources

in Alaska does not make it attractive as a source of energy for new

industry or feedstock for local petrochemical manufacture.

Construction and operation of the mine, plant, and town sites should

not affect the economic feasibility of other resource ventures in the

west side of Cook Inlet, such as gas and oil exploration, logging and

timber processing, hard rock mining, fish processing, or manufactur­

ing ventures. These types of projects stand or fall on the basis of

economic factors and forces that are largely external to the region ..

Facilities used in the, operation of this coal-methanol project do not

have direct application to development projects that are not coal re­

lated.

The feasibility of other coal development projects could be enhanced

if certain infrastructure could be shared between projects: The air­

port; segments of the transportation corridor between the mine areas

and the plant; the new town; telecommunications towers; dock,

and/or other facilities. Savings realized through cost sharing and

economies of scale from joint use of infrastructure could result in

significant reductions in capital costs.

Joint use of infrastructure would require a great deal of planning by

the ventures involved, including consideration of the location of

facilities, their design, and financing.

Land Use, Transportation and Ownership Changes

In terms of land use, changes would tend to accelerate a process

begun with the timber sale to Kodiak Lumber Mills in 1975. That is,

most of the area proposed for development of the plant, camp, new

town and airport is now crisscrossed by logging roads, and most of

the spruce trees have been cut. Timber cutting and sporadic oil,

19-3

c:

gas and coal exploration activities in recent years have already in­

troduced some permanent changes to an area formerly used only for

subsistence hunting and fishing.

Despite these recent areawide activities, the project would affect

land ownership and management practices of the state, borough,

C I R I, and possibly the Tyonek Native Corporation.

0 State Lands

The new town and airport would be located on state land. The

methanol plant likely would be on CIRI land. The state already

has granted a 300-foot-wide easement for the mine-to-dock trans­

portation corridor. The state Department of Natural Resources

likely would lease land for the town, whose developers would in

turn sublease properties for housing, commercial and other devel­

opment. The DNR would oversee siting of the town, camp, air­

port and plant, giving particular attention to issues of sanitation,

potential for stream degradation, availability of water, and other

land management and classification criteria (AS 38. 04.900, AS

38.05.020, AS 38.05.300). Ultimately, the Kenai Peninsula Bor­

ough would be responsible for town zoning, subdivisions, and

miscellaneous permits.

The normal mechanism for ON R disposal of land for project facil­

ities requires that land first be classified for specific purposes.

Most of the state land in the project area is classified for Re­

source Management, the broadest of 17 management categories

(coastal sections are mostly designated Industrial Lands). DNR's

Planning Section could (under present statutes) develop an area

land use plan to determine more specific classifications better

suited to the proposed uses. For example, the methanol plant

could be designated as Industrial Land (as were the Kodiak Lum­

ber Mill dock at North Foreland and the Chugach Electric power

plant north of Tyonek). The town site could be designated as

19-4

(~'\

c

Commercial Land or Residential Land, or conceivably the entire

project could be classified as Industrial Land. Each of the state

departments which would take part in preparation of the plan

(such as Fish and Game, Community and Regional Affairs, Trans­

poration and Public Facilities, Environmental Conservation, Com­

merce and Economic Development, and the DNR Division of Parks)

presumably would wish to establish land classifications specific to

their concerns. Native corporations, the borough and industry

also would participate in preparing the plan.

Additional likely areas of concern to the state would be Material

Land classification for appropriate gravel extraction sites, and

possible Wildlife Habitat Land for certain streams. Dual or mul­

tiple-use classifications are possible, if uses are compatible (11

AAC 55. 040).

Once the land use plan for state lands had been approved, the

DN R Division of Forest, Land and Water Management could exe­

cute land disposal (lease, sale, grant or exchange) agreements

for sites or proposed project facilities. If lease arrangements

were executed, special prov1s1ons (such as restrictions on airport

use to approved aircraft, and/or eventual public use and main­

tenance of the airport) could be included. DN R could also grant

miscellaneous road and power easements.

The preparation of an areawide plan utilizing public hearings can

be a very time-consuming task (2-3 years). The Governor's Coal

Policy Group and the Beluga Interagency Task Force could help

expedite the process by assisting in identifying critical issues and

appropriate land use planning responses.

However the plan is prepared, it should consider not only the

C I R I /Placer Amex project, but also the Bass-Hunt-Wilson coal

mine and port, and other possible power generation projects in

the vicinity. Extension of a new road or rail line from the Matan-

19-5

0

0

uska Valley and construction of new power lines to serve these

projects have been discussed in the past. The Alaska Power

Authority will soon be studying the feasibility of hydroelectric

power generation at Lake Chakachamna, about 25 miles west of

the project site. These projects all have implications for growth

in the Matanuska-Susitna and Kenai Peninsula boroughs. How

these projects fit into regional patterns of growth and energy

facilities siting has not been investigated.

Thus, a land use plan should not only consider state lands, but

other ownerships as well, to guide the development of west Cook

Inlet. Such a plan might seek to minimize the duplication of

transportation and utility corridors, or to consolidate development

of the proposed Cl RI/Piacer Amex and Bass-Hunt-Wilson town

sites. It might also consider the kind and location of port facil­

ities which are being studied for the entire state by the Depart­

ment of Transportation and Public Facilities (report due Septem­

ber 1981).

Borough Lands

The proposed camp site and a portion of the transportation cor­

ridor cross Kenai Peninsula Borough land west of Congahbuna

Lake. CIRI/Piacer Amex would have to negotiate with the bor­

ough for right-of-way and lease of about 175 acres for the camp.

Although the camp would be dismantled, some road and utility

lines could remain in place. A small 50-man camp could remain

for visitors after the plant is in operation.

Cook Inlet Region, Inc. Lands (CIRI)

Cl R I is an active participant in the venture and would seek to

expedite project development on its lands. Most of the methanol

plant likely would be located on land whose surface estate is

owned by C I R I. C I R l's ownership allows for gravel removal.

19-6

c

c\

0

There do not appear to be significant pre-existing leases which

would preclude plant development at this site.

Tyonek Native Corporation Lands

No facilities are planned on land owned by the Tyonek Native

Corporation, and Tyonek Native Corporation has stated its oppo­

sition to any easements across its land.

Borough Services Impacts

Development of a town near the plant could require the provision of

some services from the Kenai Peninsula Borough. These services

would include education, planning, and regulation of land use. The

level of planning, zoning and subdivision services provided by the

borough would depend on whether the community functions as a 11 company town 11 or becomes an incorporated city. Education would

be the responsibility of the borough in either a company town or an

incorporated city.

Actual impacts upon the borough would be expected to be small.

The cost of education is borne almost entirely by the state; and

even if the new town became an incorporated city, the borough

would be expected to delegate most of its planning and land use

regulation powers to the city. Also, although the borough can

establish local service districts in unincorporated areas to provide

such services as sewer, water, roads, and solid waste, this is con­

sidered unlikely. Rather, industry would choose to develop these

facilities under its own needs and timetable.

The borough should be affected only if significant growth takes

place outside the town, on the Kenai Peninsula itself. Under these

circumstances, expansion· of streets, utilities and subdivisions could

make demands upon the borough which might require some form of

short-term impact funding assistance.

19-7

0

c

Options for Town Management and Governance

The choice between a company town or an incorporated city in­

volves questions of development control and cost-sharing for the

provision of services. A decision by industry to build and main­

tain all of the town•s facilities and services would allow for

greater control than would be possible if it became an incorpor­

ated city. Involvement of borough government in a company town

would be largely restricted to the development and operation of

schools.

On the other hand, if the city. were to incorporate, it would be

eligible for state revenue sharing funds; however, costs of muni­

cipal administration would also be created. A second-class city

may be formed ·upon petition to the Local Boundary Commission.

Requirements include: Designation of city limits within which

municipal services are to be provided; demonstration that the

community includes sufficient human and financial resources to

support services; demonstration of a need for city government.

The degree of difficulty for the Kenai borough to provide some

services to the remote site would play a part in this decision.

When the community reached a permanent population of 400, it

could incorporate as a first-class city which could levy and collect

special charges, property and sales taxes or assessments to amor­

tize bonded indebtedness for sewage collection and water distribu­

tion systems, streets and other facilities. The municipality would

be eligible for other state and federal aid not available to a pri­

vate community.

Bills now in the state legislature (SB 180, HB 170) propose

changes to the Municipal Code. Under the proposals, a city

incorporated after July 1, 1981 is entitled to an 11 organizational

grant11 of $50,000 for the first year of transition to city govern­

ment. A city eligible for the first-year grant would be eligible

for a second year grant of $25,000.

19-8

0

0

·The bills also abolish 11 Development Cities 11 legislation enacted

some years ago to facilitate energy-related new town development

(AS 29.18.230-450). Part of the argument to drop the legislation

stems from a state policy which discourages funding for special

private interest projects, such as a company new town, where

broad public benefits are negligible. On the other hand, incor­

poration would make a community eligible for a variety of state­

funded programs. The legislation is expected to be enacted in

the 1982 legislative session.

Borough Planning of the Town Site

Under state law, boroughs have responsibilities for planning, plat­

ting and land use regulation on an areawide basis. However, the

borough assembly may delegate any of its powers and responsibil­

ities to a general law city in the borough, if the city first con­

sents by ordinance to this delegation. The emerging policy of

the Kenai Peninsula Borough is to pass on zoning and platting

powers to towns, while retaining an overall planning function.

Thus, if the town became an incorporated city, it could have

many of the planning powers it would have as a company town,

albeit in a somewhat different form. The borough has no formal

policy on town site development associated with the proposed

methanol plant.

Impacts if Growth Occurs in the Kenai Peninsula

Because the town would be isolated, impacts upon the borough

might be negligible. However, the situation could change if only

a small town were ultimately developed, with a sizable number of

people living on the Kenai Peninsula. There could be a need for

greater fire and police protection, more planning and administra­

tive responsibilities and other new services associated with an

expanded population in Kenai.

19-9

c~:

Experience from other areas of the country, notably Montana and

North Dakota, indicates that the areawide economic benefits of

energy projects lag for several years after project start-up.

During early years of project mobilization and construction, local

jurisdictions may be called upon to increase their planning staffs,

expand schools, widen roads and install new utilities. This may

occur during a period when little, if any, revenues flow to these

jurisdictions. In the worst case, jurisdictions may be incapable

of adequately responding to the project until it is too late and

disruption is severe. Resentment for the project by local resi­

dents may be only partly lessened by the large property tax

revenues received at a later time.

If rapid growth occurred on the Kenai Peninsula, some form of

short-term impact assistance funding might be considered for the

Kenai Peninsula Borough.

The key to any funding assistance agreement would be the iden­

tification and quantification of short-term project impacts in con­

trast to those associated with areawide growth.

TYONEK VILLAGE IMPACTS

Potential effects of the project on the Village of Tyonek are the most

significant socioeconomic impact issue raised by this project. The

nature and extent of actual impacts on Tyonek would depend upon

the success of planning and mitigation measures undertaken by the

project sponsors, the state and borough governments, the Cook Inlet

Native Association, the Tyonek Native Corporation, and the villagers

themselves. Certain village impacts seem inevitable, such as in­

creased contact with non-Native people and institutions, and conflicts

with non-Native sportfishing and hunting. The project would create

substantial opportunities for economic benefit to the community; but

the extent to which these would be realized depends on the re-

19-10

sponses of the village residents, and the village and regional Native

corporations.

Village Impacts

Planning by the Tyoneks should be able to adequately protect the

village and its institutions from direct impact by the project. That

is, there is no reason why the project should have direct physical

intrusions into the community from automobile traffic, sightseers,

non local school children, shoppers, and so on. The traditional vil­

lage council and the Tyonek Native Corporation can legally control

access to the village by nonresidents. The Tyonek School is too

small and too far from the project town site to be a practical alter­

native to construction of a new school at the community.

Once the mine, plant, and new community were developed and opera­

ting, the village and its new neighbors probably would adjust to a

mutually acceptable pattern of coexistence that would not require

formal restrictions on movement. However, the village could prohibit

access across its land if problems were to occur.

Culture and Life-style Changes

In contrast to the physical penetration of daily village life by the

project, defenses against intrusions on the village culture and life­

style are less readily available to the Tyoneks. It is here that

impacts seem inevitable, although the severity and long-term signifi­

cance cannot be foreseen.

A nearby new town with movies, recreational activities, restaurants

and so forth would be an irresistable attraction to village residents,

especially younger people. Tyonek youth are familiar with the

modern white world (Anchorage is an inexpensive plane flight away,

and the village receives direct line-of-sight television signals from

Anchorage); but now this life-style would be at their doorsteps.

19-11

c

Interaction between vi I lagers and the new town would doubtless

hasten the process of acculturation which has been under way in

Tyonek for a century, and the cultural cohesion of the community

would be weakened further.

The presence of the new project community and interaction with

Tyonek residents could result in problems of a social-psychological

nature. The Battelle study (1979) speculates at length about the

potential for this type of problem:

Although Tyonek residents have had considerable contact with the dominant American lifestyle, this contact would be greatly expanded by coal development. Under those circum­stances, a variety of interpersonal and intergroup conflicts would likely surface . . . Coal development would also mean that, for the first time in their long history, Tyonek resi­dents would be in the minority in their own region. Minor­ity status usually is a breeding ground for racism and dis­crimination. Status and cultural differences therefore can be factors in intensifying unfriendly and perhaps hostile rela­tionships.

With the potential for social conflict comes a potential for social deviancy such as vandalism, larceny, alcoholism, and drug abuse. All of these forms of deviancy contribute to one another and in many cases can be emphasized by pre­vailing differences of opm1ons, intergroup relations, and feelings of inferiority, especially on the part of the group relegated to a minority status. Intergroup conflict can also affect employment, job productivity, learning in the class­room, and can disrupt a community•s total way of life.

Proximity of the new town to Tyonek would also seem likely to create

conflicts between village subsistence hunters and fishermen and non­

Native sportsmen. Many of the new town•s residents would be out­

doorsmen (indeed, the population of this remote Alaska setting could

tend to be self-selected for this interest). The Tyoneks have tra­

ditionally hunted and fished over a wide geographical area -- wider,

certainly, than the limits of the land they now control through sel­

ections made under the Alaska Native Claims Settlement Act. Even if

the project work force did not have automobiles, hunters and fisher­

men would have mobility by snowmachine, motor bikes, small all-

19-12

terrain vehicles, airplanes, and boats. Preferential treatment of the

Tyoneks under the state•s subsistence law seems unlikely, since

management distinctions are based on place of residence rather than

race or length of residency. Therefore, the stage is set for conflict

and competition between the villagers and newcomers over increas­

ingly scarce fish and game resources on the west side of Cook Inlet.

Erosion of the Tyoneks 1 subsistence resource base poses a potentially

serious threat to the traditional village life-style and cultural values.

Seasonal subsistence pursuits are an important source of food, focus

of village life, and spiritual link with the past. Further decline of

the· fish and wildlife population that supports this activity could con­

tribute to the emergency of social-psychological problems discussed

above.

Economic Impacts

The project would create employment and business opportunities for

individual Tyonek residents and the village as a whole. The villag­

ers themselves must act to realize the potential benefits of this eco­

nomic opportunity, although the project sponsor could enhance the

opportunities through such methods as job training, flexible hours

and work schedules, and preferential contracting and purchasing

policies.

During the construction phase, there would be high demand for lab­

orers, equipment operators, mechanics and other craft workmen.

Also, there would be demand for food service and housekeeping

labor in the construction camp. These jobs would be filled by the

respective unions, which probably would be obligated to minimum

Equal Employment Opportunity (EEO) goals by the project labor

agreement. There would also be demand for office and clerical help

at the site, which is typically non-union.

19-13

After the mines, plant, town, and airport were developed and oper­

ating, the range of employment opportunities would expand and the

complications of union dispatch would be lessened or eliminated.

Numerous skilled and unskilled jobs in the mine, plant, and mainte­

nance shops would be available. The town would create approxi­

mately 220 jobs in stores, restaurants, banks, a hotel, post office,

airport, and other private and public enterprises, many of which

would require little or no training and would appeal equally to women

and men. In short, there would be ample opportunity for motivated

villagers to obtain employment with some aspect of the project.

In addition to direct employment opportunities, the project would

offer the possibility of Native-owned businesses supplying goods or

services required for maintenance and operation. For example, a

business formed by the Tyonek Native Corporation might negotiate a

maintenance contract for roads, or a snow-removal contract for the

airport runway. Also, it might seek to obtain a business franchise

at the town, or become a vendor of supplies and material purchased

regularly by the plant and its contractors. In this case, the village

corporation would be an employer, and it might wish to provide work

schedules, hours, and job-sharing to accommodate seasonal local sub­

sistence activities. Thus, a village-owned enterprise could contrib­

ute to community income through jobs and business profits.

19-14

(' 20.0 ACOUSTIC ENVIRONMENT

CONSTRUCTION EFFECTS

Construction Activities

During construction of the proposed methanol plant, the primary

noise source would be earthmoving equipment, pile drivers and com­

pressors. Typical noise levels for this equipment measured at a dis­

tance of 50 feet are:

Earthmoving Equipment

Pile Drivers

Compressors

80 dBa

95 dBa

75 dBa

This would impose a significant noise increment on a pristine 30 to

40 dBa area, but the increase would be temporary and would have

little or no adverse effect on present inhabitants. The nearest per­

manent inhabitants are at the Union Oil collection facility near

Granite Point, and there is one permanent residence on the Granite

Point beach area. There are also several seasonal residents on the

beach during fishing season. The construction activities should be

sufficiently far away (one to two miles) .to be muffled by the terrain

and vegetation and to be virtually un-noticed by the nearest inhabi­

tants. The largest earthmoving equipment in the mine areas would

be 15 to 25 miles away and would have no impact on the few indi­

viduals currently in the area. The noise from all construction

activities would be expected, at least temporarily, to displace wild­

life. The project construction activity and noise would not affect

any known critical habitat areas.

Vehicular Traffic

General transportation requirements for project construction activities

would substantially increase the volume of vehicular traffic in ·the

20-1

general Granite Point area. The traffic would be slow-moving and

would occur in fairly heavily vegetated areas, factors which would

minimize traffic-generated noise to a relatively un-noticeable level to

the local inhabitants. The sound level of various truck traffic would

range from approximately 72 to 89 dBa at 50 feet and decrease to a

range of 54 to 71 dBa at about 400 feet.

LONG-TERM EFFECTS

When the plant is operational, the principal continuous sources of

noise would be the coal crushers, blowers, burners, agitators, com­

pressors, pumps, turbines, condensers, coolers, air fins and diesel

engines. To estimate the effects of this catagory of noise sources

an analysis was done of 91 major noise-producing sources. Each had

acoustic emissions in excess of 90 dBa at 50 feet. The analysis also

assumes the noises emitted are from the source on a flat plain and

does not consider the dampening effects of terrain, vegetation or

special noise abating modifications that could be made to the equip­

ment. At the fence line of the plant, an average distance of 1,000

feet from the noise sources, the sound levels were predicted to be

58 to 67 dBa. At a distance of one mile, the sound pressure level is

estimated to drop to 51 dBa. At a distance of two miles, which is in

the proximity of the nearest inhabitants, the sound pressure level is

estimated to be 45 dBa. With the sound dampening effects of terrain

and vegetation, and additional acoustic treatment required by the

Occupational Safety and Health Act (OSHA) on high concentrations of

noise sources, it is expected that the 45 dBa level could be further

reduced to somewhere near the high end of the present ambient level

of about 40 dBa. For this analysis to be conservative, dBa values

in a high range were intentionally used.

Other equipment associated with the methanol plant is not influential

when considering environmental impacts of noise at a large distance

from the plant. These noises are relevant when considering com-

20-2

(~ pliance with OSHA worker exposure levels of 90 dBa, 8-hour time­

weighted average (29 CFR 1910. 95). When the equipment cannot

meet these requirements, other noise control measures such as

silencers, noise control installations, acoustical hoods, and closures,

etc. would be employed. Heavy pieces of mechanical equipment with

vibrating characteristics would be mounted on vibration isolators and

piped with elastomer couplings to minimize noise. Steam piping and

other gas lines are designed for reduced velocities to prevent excess

noise. Ejectors, reducers and related equipment which might other­

wise produce excessive noise are insulated.

Figure 20.1 illustrates levels of noise anticipated with the plant

operation.

MAJOR REGULATORY REQUIREMENTS

There are no State of Alaska areawide noise control regulations out­

side of the Department of Labor Occupational Safety and Health

Standards. The Kenai Peninsula Borough, which has jurisdiction

over this area, also does not have a noise control ordinance pro­

gram. The principal noise control requirements would be through

the federal OSHA Occupational Safety and Health Standards (29 CFR

1910) which basically cover individual source noise emissions particu­

larly as they relate to employee safety within the confines of the

workplace.

ENVIRONMENTAL ACCEPTABILITY OF PROPOSED ACTION

The short-term construction noise effects are considered to be

nominal in terms of a significant impact on the human population or

wildlife of the area. With reasonable engineering, the long-term

noise effects from plant operation should be limited to an area within

a two mile radius (12 square miles) which is primarily within the

20-3

n

FIGURE 20.1

NORMAL CONVERSATION

EXISTING NOISE LEVEL

LEVEL OF NOISE AT THE PERIMETER /FENCE, METHANOL PLANT

0 10 20 30 40 50 60 70 80 90 100 110 120 130 140 150 160 170 180 190

'j4 SOUND LEVEL dB(A)

~~~--~~--7-~~--~~--~~~--~~--~~~--~_.~

LEVEL OF NOI~ MILE FROM CENTER OF PROCESS AREA

MAXIMUM INTERNAL NOISE LEVEL

LEVEL OF NOISE AT THE PERIMETER FENCE, COAL HANDLING FACILITY

LEVELS OF NOISE, dB(A) - BELUGA METHANOL PLANT

c

range of the nearest population. Noise impacts on wildlife would not

be severe and should in all cases be acceptable both from an envi­

ronmental safeguard and a permitting standpoint. In the long-term,

the population near Granite Point is expected to expand and even­

tually exist somewhat closer to the plant site than it currently does.

Accompanying this growth would be a higher ambient noise level of

40 to 50 dBa on which would be imposed noise emission levels esti­

mated to measure 51 to 67 dBa between the plant fence line and a

point one mile ·away. In neither the short nor the long term is it

expected that noise levels in a populated area would exceed an

urban/residential level of 60 dBa or exceed an annoyance level of

about 65 dBa.

20-5

c

21.0 METHANOL IN THE ENVIRONMENT (SUMMARY)*

METHANOL IN THE ENVIRONMENT (GENERAL)

Environmental Hazards, Aquatic and Marine

Investigations of the biological consequences of methanol spills or

leaks into aquatic ecosystems indicate that many organisms are toler­

ant to low concentrations. However, significant disruptions of eco­

system dynamics may occur under certain conditions. The biological

effects of an aquatic methanol accident are correlated with many fac­

tors including scale and duration of spill, tidal involvement, cur­

rents, temperature, available oxygen, potential organic and inorganic

synergists, particular flora and fauna involved, and the interactions

of ecosystem components.

Marine and Estuarine

The following discussion presents a synopsis of the relative effects

that might be anticipated in the event there were a methanol spill

in Cook Inlet.

Substrate-forming invertebrates are key organisms in intertidal

marine and estuarine environments. Both coastal and estuarine com­

munities are largely dependent upon shelled or tube-dwelling organ­

isms for substrate stability, temperature regulation, canopy, and

larval settlement characteristics. Substrate formers with sealable

shells or tubes vary in susceptibility to experimental concentrations

of 100 ppm to 5% methanol. However, many invertebrates cannot

survive acute, short-term exposure to concentrations ranging from

0.1 to 5% in filtered seawater. Immediate physiological consequences

of acute exposure to methanol include reversible and/or irreversible

ciliary narcosis, neuronal disruptions leading to disorientation,

* Prepared by Peter D1Eiisceu

21-1

c

c

11 biological clock 11 suppression and alteration, inappropriate color

changes, untimely autotomy and cardiac arrhythmia. Carbon-14

( C 14 ) labeled methanol was found to concentrate in excretory or­

gans, neurons and gonadal tissues after only a few minutes exposure

to low-level alcohol-seawater mixes. Chronic exposure to methanol

(0.01 to 1% for 7 to 14 days) proved to be disruptive to gametogene­

sis, embryogenesis, larval development and larval settlement in many

molluscs, crustaceans, polychaetes, and other invertebrates.

In addition, the molting processes of several crustaceans (including

many commercial and game species) are accelerated by methanol expo­

sure. In spill situations this acceleration could cause premature

in star and adult molting, allowing increased population loss through

disease, predation, or other environmental factors. In some mol­

luscs, resistance to both tissue invasion and destruction by trema­

tode parasites is greatly reduced. This could also lead to increased

incidence of infection in the bird and fish definitive hosts of these

parasites. Plankton, mollusc and polychaete larvae are generally

susceptible to methanol concentrations as low as 100 ppm. However,

these larvae and many invertebrates with ciliated respiratory struc­

tures are much less affected in highly aerated conditions. A concen­

tration of about 1% methanol in seawater is tolerated by many com­

mon components of intertidal, mudflat, and estuarine ecosystems if

heavy metals are eliminated from methylation. However, lower levels

of methanol are toxic if metal contamination is considered. Molting

disruptions and cardiac arrhythmias of selected crustaceans have

been monitored, with commercially important crabs and lobsters re­

ceiving major focus. Examples have included toxic disruptions of the

eastern lobster Homarus, and several Cancer crab species from the

west coast. As in previous crustacean investigations, ethanol

proved more toxic than methanol, causing death or irreversible

neuromuscular disruptions at 1 to 3% volume. Methanol tolerance

limits are generally higher for those animals studied, ranging from

3 to 10% depending on species, size and nutritional state of the

organism.

21-2

Other test animals evaluated for fuel-water physiological tolerances

and responses include the marine gastropods Tegula funebralis,

Barleeia sp., and several limpet species of Notoacmaea. The inter­

tidal crab Pachygrapsus crassipes has also been monitored. In

exposures to 1 to 30% by volume fuel in water, operculate snails

Tegula and Barleeia were not differentially susceptible to alcohol or

gasoline. However, gasoline-water mixtures were 25 to 45% more

lethal than either alcohol for the non-operculate limpet Notoacmaea.

Crab test animals proved 50 to 60% more disrupted by gasoline mix­

tures in comparison to both alcohols. In LD50

determinations, line­

scaled on 100 to 0 non-unit comparison, the rank is indolene 100-­

ethanol 50--methanol 30. In procedures monitoring myogenic heart

rates and neurobiology of Pachygrapsus, significant disruptions of

rhythm, pulse intensity, secondary beats, and chamber coordination

occur with indolene at 1% volume, 3% ethanol, and 5% methanol per 1

hour exposures. In most cases, arrhythmias are reversible for

methanol, but recovery is generally incomplete for indolene expo­

sures, with permanent neuromuscular damage occurring in many

cases thus far monitored.

Since low levels of methanol occur naturally in many stable habitats

and as alcohol is generally quite miscible, volatile, and degradable,

gross environmental impact from moderate spills appears unlikely.

An evaluation of the toxicity of crude oil versus methanol in the

marine environment shows major differences in effect. While many of

the components of crude oil are held at the surface at ambient tem­

peratures, some extremely toxic components are soluble in water and

directly affect subsurface organisms. Since methanol is less toxic

initially and has a much shorter residence time than oil (hours vs.

years), it is considered a much less disruptive pollutant. Normal

biodegradation of methanol is more rapid than crude oil or gasoline

in aquatic and terrestrial habitats. In addition, recolonization by

important organisms is much more rapid in alcohol-disrupted habitats.

21-3

Assessments of experimental spill sites for methanol and ethanol have

shown nearly equivalent recovery. Coastal sites may show Shannon­

Weaver diversity indices of 6. 2 to 6.4 seven months post-spill. Sites

have nearly fully recovered, nearing the 8.15 diversity index of the

prespill baseline study.

Work with commercially important crabs and other marine anthropods

has focused on the neuromuscular disruptions from fuel exposure,

and clearance time and physiology. Electronic monitoring of isolated

heart nuclei from these animals in vivo demonstrated rapid arrhyth­

mia in ethanol and methanol exposures of 3% volume in seawater.

Autoradiographs of haemolymph samples taken at five minute inter­

vals after C 14 methanol exposure have demonstrated rapid partial

clearance from the body. However, muscle and antenna I gland

samples have indicated continued toxicity after 55 minutes of clear­

ance time for some specimens. Various physiological and behavioral

disruptions associated with methanol spill situations would probably

be short-term in field conditions. However, .complete tissue clear­

ance of alcohols is a matter of 2 to 5 hours, depending upon size,

nutritional state, and microhabitat of the organism tested. There­

fore, animals collected from a spill encounter should not be eaten

unless purged (alive), or leached for more than minimum clearance

time.

Comparison of Marine Environmental Impact Costs: Methanol/Oil

A comparison of the costs and consequences of crude oil spills ver­

sus alcohol spills indicates a further benefit in the transportation

sector of alcohol fuel utilization. In assessing the direct and indi­

rect costs of major oil spills, it is apparent that both acute immediate

losses and residual losses are more severe than those losses associ­

ated with methanol.

An evaluation of the cleanup costs, repair for physical damage to

boats, nets, filters, etc., and various socioeconomic losses due to

21-4

(, some monitored oil spills shows a general pattern. In a major spill

involving coastlines, such as those of the 1967 Torrey Canyon spill

(off Cornwall, England), the 1969 Santa Barbara Channel spill and

the 1978 Amaco Cadiz spill on the French Burgundy coast, costs may

include initial expenditures for containment of the spill such as

transportation and placement of physical barriers. Further attempts

with suction-pump recollection, chemical surfacant dispersal, deter­

gent application or absorption to straw, floating bel lets or other

material are generally applied. Later removal or degradation of

larger residue is considered a 11 final 11 step. However, the residence

time of some soluble components of the oil and small particulate

residue pollutant is very long. An estimate of seven to 12 years

retention of these residues in soft organic substrates and marshlands

of France is not considered conservative. The monetary loss of

fragile commercial species of crustacea, molluscs, and fish can be

greater than the initial losses. In the case of the Amaco Cadiz spill,

nearly all the commerical oyster industry of this region was lost and

required waiting five to six years for reseeding of spat to replenish

the industry. Loss of marshlands in the Santa Barbara and Amaco

Cadiz spills and consequent decreases in some commercial crustacean

and fish populations have been estimated at $2 million and $10 mil­

lion, respectively. The physical and biological properties of alcohol

fuels (methanol in particular) negate several of the possibilities for

fiscal losses which would be expected in a spill situation involving

oil. Short biological residence time, dilution and very rapid micro­

bial degradation of methanol compared to crude oil components all

contribute to this reduced loss.

Cleanup of a moderate to large methanol spill would involve removal

of dead organisms, if necessary, monitoring of alcohol levels for

several tidal periods, possible aeration of water as a restoration

technique and perhaps innoculation of water with methotrophic bac­

teria, such as Pseudomonas flourescens. The most likely efforts to

be employed for minor spills of methanol would be maintaining secur­

ity of the area for one or two tidal periods. Normal degradation

would complete the cleanup process with the least disruptions.

21-5

c:.

While monetary costs of floral and faunal losses due to oil pollution

in the sea are not well documented, the physiological effects and

population disruptions to birds, mammals, sessil invertebrates, zoo­

plankton, phytoplankton, algal canopy, and other organisms are the

objects of intensive current research.

Table 21.1 shows a comparison of the costs of example spills of

crude oil, diesel fuel, and methanol. There is a large reduction in

cleanup cost for methanol in contrast to diesel oil and crude oil.

The petroleum figures taken from are from literature, and the

methanol costs are estimated assuming worst-case conditions, based

on research and small scale experiments conducted on the Santa

Cruz, California coast. The major cost reduction factors associated

with methanol spill clean-up are:

a. Decreased Manpower Requirements. Fewer man-hours for immed­

iate cleanup operations are required for methanol. These figures

include lower involvements of death of vertebrate animals, chem­

ical treatments, monitoring, and health security operations.

b. Residual Toxic Effects are Shorter. Methanol toxic effects would

last hours rather than years as would effects of heavy fuel oil.

c. Costs of Cleanup Materials. Possible innoculation of waters with

alcohol-consuming bacteria and aeration of water or intertidal

zones are significantly less expensive than sweeping, suction,

dispersant-coagulant, or other technologies necessary for oil

clean-up operations.

d. Transportation. Transportation costs of vehicles and vessels

necessary for alcohol clean-ups are much less than those for oil

spi II situations.

e. Legal. Fines for environmental losses would likely be signifi-

cantly less for methanol spills.

they are considered equivalent.

21-6

However, for this comparison

(> "-.__/

Fuel

Diesel

Crude

Crude

Crude

Methanol"'

Table 21.1

COST COMPARISON OF SELECTED CRUDE OIL,

DIESEL FUEL, AND METHANOL SPILLS

Estimated SJ2ill Situation Year Total Cost Volume

Tampico Mara 1957 1,000,000 20,000 Met. Ton

Torrey Canyon 1967 17,020,000 100,000 Met. Ton

Santa Barbara 1967 50,500,000 3.4 Mill. Gals

Amoco Cadiz, Fr. 1978 100,000,000 6.0 Mill. Gals

Santa Cruz, CA 1977/78 120,000 1. 0 Mill. Gals

Cost Volume

$50/MT

$172/MT

14.9¢/gal

16. 7¢/gal

. 12¢/gal

* Methanol estimate established in 100 gallon spill enclosed system experiments.

21-7

Fresh Water

The following discussion presents a synopsis of the relative effects

that might be anticipated in the event there were a methanol spill

affecting one of the region's rivers or streams, such as could occur

along the transportation corridor.

Methanol impacts on both lotic and lentic aquatic systems are corre­

lated with several physical and biological factors. While tolerances

vary among organisms (Table 21. 2) the potential disruptions of popu­

lations or communities depend on amount and duration of spill, water

volume and flow rate, temperature, oxygen tension, seasonality or

temporality of effected species, and the life stage of organisms with

larvae, resistant spores, or motile instars. While few freshwater

organisms can tolerate long-term exposure to even 500 ppm methanol,

many organisms can survive acute or short-term exposures of 1%

volume. Some adult crus tacea may even tolerate 10% for several

hours. In general, aquatic insect larvae are subject to narcosis at

concentrations as low as 0.5%. In particular, lotic fish prey species

of Odonata, Plecoptera, Ephemeroptera, and Diptera are killed at 1%

concentrations at ambient temperatures. However, recolonization of

experimental spill sites involving these larvae is very rapid. Appar­

ently, the rapid dispersal and dilution of the alcohol in moving water

systems allows reoccupation of disrupted habitats through immigration

from upstream populations. Insect larvae exposed to, but not killed

by alcohol generally recover from the narcotic effects in several

hours. However, behavioral disruptions during this recovery

period, including disorientation, phototactic and thigmotactic rever­

sals, and color changes make them more vulnerable to predators and

physical disruptions.

Observations of some freshwater organisms indicate a wide range of

tolerance for methanol. As examples, narcosis occurs in some aqua­

tic insect larvae in concentrations as low as 0.5%, while several

crayfish species can live in 10% methanol solutions up to five hours.

21-8

Table 21.2

FRESHWATER ORGANISMS -- METHANOL TOXICOLOGY

~at 500 ~~mt 3 hrs.) LD50 (15°C) Color

Or9anism (%t. 3 hrs.~ Disorientation Narcosis Change

~~ 0.50 + +

Salmo~ 0.50 + +

Salmo gairdnerii 0.75 + +

Gambusia ~ 0.75 + +

Pomoxis sp. 0.75 + +

Lepomis sp. 0. 75 + +

Micro~terus salmoides 0.75 + +

Cy~rinus sp. 1.00 + +

Pacifasticus 3 spp. 3.0-5.0 + +

Procambarus sp. 3.00 + +

c A~us sp. 1.00 + +

~sp. 0.75 + +

Neuroptera (larva) 0.50 + +

Plecoptera (larva) 0.50 + +

Ephemeroptera (larva) 0.50 + +

Odonata (larva) 0.50 + +

Trichoptera (larva) 0.50 + +

Diptera (larva) 0.50 + +

Coleoptera (larva) 0.50 + +

Colepotera (adults) 1 .so S~ongilla 2 spp. * 1.00 +

S~haerium 3 spp. 3.00

A nodonta sp . 3.00

Physa 3 spp. 1.50

Pisidium casertanum 2.00

Oscillatoria sp. 1.00

~sp. 1.00

* Choanocyte activity

~: Many of these organisms are not present in the Beluga region.

21-9

Natural exposure to concentrated alcohols in freshwater habitats is

probably negligible, making this latter tolerance remarkable. Several

genera of both freshwater and marine bacteria are tolerant of 1%

methanol. Under some experimental field and lab conditions, bacteria

will metabolize C14 labeled methanol as a carbon source. Current

assessment of methanol toxicity to small aquatic organisms suggests

that the effects of one-time spills or leaks would probably be mini­

mal, except in proximal areas where concentrations reach or exceed

1%.

Control spills in several habitats and laboratory aquaria indicate

rapid deterioration of both individuals and community interactions at

alcohol concentrations above 5% volume in lentic waters and 5% volume

in !otic waters. Although oxygen concentrations appear to influence

survivorship, the natural exposure to both alcohols in still, lentic

waters seems to be a significant factor in organismic tolerance levels

for organisms from this habitat. While recovery observations are

still being carried out, preliminary evidence suggests more rapid

stabilization in running, lentic waters. This is probably due to the

more allogenic, colonizer-based community structure in this habitat,

wherein major components move in from upstream waters. These

studies will continue to document seasonal variations in community

structure and species diversity.

Specific neuronal dysfunctions have been monitored for the crayfish

Pacifasticus exposed to 5, 20, 30 and 50% of methanol f.or 30 and 60

minute periods. Cardiac nuclei desynchony, tachycardia, bradycar­

dia, and other symptoms were noted. Other experiments of 30% and

50% methanol proved irreversibly toxic in 90% of the exposure situa­

tions.

Tolerances for several larval Trichoptera species have been estab­

lished for both methanol-water and ethanol-water solutions. These

important freshwater insect larvae occupy several niches and could

prove useful as indicator organisms in the case of alcohol spills.

21-10

c

(_

Depending on species, previous exposure, water temperature, oxy­

gen tension, and chemical factors, Trichoptera tolerate 1 to 10%

methanol or ethanol by volume. Important genera evaluated have

included Tinodes and Athripsodis, and other key groups.

Chronic toxicity studies with the eggs of the mayfly Ephemerella

( Ephemerella) infreguens have indicated that at concentrations of 1. 0

and 1 .·6% methanol, there was no additional mortality but that devel­

opment· and hatching were somewhat delayed. At 2.5% methanol

overall survival was low (only 10.6% at 60 days) and no eggs

hatched. At even higher concentrations (3. O% plus) no eggs

developed. Ephemerella eggs appear to be less sensitive to methanol

than those of several fish species including grayling and Arctic

char.

Acute toxicity studies of the nymphs of five species of benthic

macroinvertebrates -- the mayflies Rithrogena doddsi, Ephemerella

( Ephemerella) infreguens, and Siphlonurus columbianus, the stonefly

I sogenus ( I sogenoides) elongatus, and the caddiesfly Hydropsyche

slossonae. The resultant data indicate that:

a. If comparisons are restricted to intermediate nymphal stages,

I sogenus is least sensitive to methanol, with Diphlonurus and

Ephemerella intermediate, and Rithrogena most sensitive;

b. There was no consistent significant difference between the toxi­

city of analytical and technical grade methanol;

c. For Siphlonurus, there appears to be no difference in the sensi­

tivity of mature nymphs and the black wingpad stage, whereas

for Ephemerella, the latter stage is significantly more sensitive

than the mature nymph;

d. In comparison with Arctic char, two species, Hydropsyche and

Rithrogena appear to be at least as sensitive, while three species,

21-11

Ephemerella, Siphlonurus, and lsogenus appear to be less sensi­

tive than the fish.

Effects of methanol on permanent and seasonal freshwater fish are

considered later in this section. Selected methanol toxicology is

summarized in Table 21.2.

Terrestrial Effects -- Direct Exposure

The following discussion presents a synopsis of the relative effects

that might be anticipated if there were a methanol spill on land.

Macrobiota and microbiota components in soil exposure experiments

have wide ranges of tolerance in methanol. Soft-bodied organisms

such as oligochaete and enchytraeid worms, nematodes, and soil

protozoa are quickly eliminated in surface saturation experiments.

Arthropod populations dependent on surface canopy vegetation are

also drastically reduced, as grasses, mosses, and other plants are

killed by surface saturation of methanol. However, arthropods at

lower soil depths, or that are very mobile in the soil, are not

affected (Table 21. 3). Monitored plots of soil surface saturation

spills in oak forest habitats indicate rapid recolonization of surface

horizons. Animal populations below 20 em in these plots were

affected little by saturation spills.

In addition, fungal and bacterial populations show great tolerance

and recolonization of surface horizons exposed to methanol. Pre­

liminary data show about 60% of initial fungal activity recovers in

horizons 10 to 30 em deep one week after surface saturation. Ninety

percent recovery is noted in similar plots and depths three weeks

after saturation. Bacterial activity at 10 to 30 em horizons is 85% of

initial after three weeks. The rapid recovery or recolonization of

these important agents of nutrient cycling is probably due to the

very resistant spores and resistant stages produced by many

species. Surface nitrates in experimental plots were nearly stable,

21-12

(\ '-._ _ _/

Table 21.3

ORGANISMIC RECOLONIZATION OF SURFACE SATURATED SOILS

METHANOL TOXICOLOGY

Post Exposure Post Exposure Population Loss 1 week 3 weeks

Organism (5% Intervals) (% below initial) ~% below initial)

Lepidoptera (larva) 5 spp. 100 100 100

Diptera (larva) 2 spp. 90 90 90

Collembola 4 spp. 100 50 5

Nematoda 4 spp. 85 30 15

Enchytraeid 2 spp. 85 25 20

Oligochaeta 90 30 10

Coleoptera (adult) 90 20 0

Coleptera (larvae) 90 90 90

mites 4 spp. 95 40 15

millipedes 3 spp. 70 40 10

centipedes 2 spp. 10 100 100

Orthoptera 3 spp. 100 100 100

bacteria 90 40 15

fungi 70 60 10

21-13

also indicating the rapid recovery of the microfauna. Laboratory

assessment of lateral and vertical movement of methanol in soil shows

both rapid initial penetration and degradation of C 14 labeled spills.

In oak forest soils, penetration and movement is limited to the immed­

iate spill area. Methothrophic soil bacteria become labeled in a few

hours at the perimeter of such tracer sites.

Emissions

Preliminary evaluation of the toxicity of methanol spills or evapora­

tive emissions shows minimal organismic effects. Flow chamber exper­

iments indicate little disruption of plant and animal physiology at

anticipated levels of methanol. Reversible narcosis occurs in many

flying insect species at 500 ppm methanol for 1 hour exposures.

Important pollinators may be adversely affected by methanol emis­

sions under chronic or massive exposure, but further work is

needed to determine the extent of direct and indirect disruptions.

Additional consideraton has been given to other pollinator and flying

predator species of insects, including various Hymenoptera, Diptera,

and Lepidoptera. More active fliers appear to be less tolerant of

alcohol emissions, but low-level exposures elicited reversible narcosis

and other effects in most cases. Exposure chamber evaluations

demonstrated reversible disorientation and decreased feeding-gather­

Ing behavior in honeybee, wild bee, wasp, skipper, butterfly, and

moth species tested at expected levels of pollution. Two species of

carpenter bee, and three species of hover flies lost flying territory

orientation under similar conditions. However, all of species' terri­

tories were reestablished in clean-air conditions in 0.5 to 2.5 hours

after initial exposure completion. Predatory wasp prey capture abil­

ities were decreased from 31% to 3% success ratio in chamber presen­

tations of prey species. Larvae of the honeybee, A pis, and several

species of moth soil larvae were killed by open air exposures (1,000

ppm methanol).

21-14

(\ "-----

Other studies have involved the neuronal, hormonal, and muscular

effects of methanol, ethanol, and indolene on selected arthropods.

Various Hymenoptera, Diptera, and Orthoptera have been evaluated.

The results indicated a relationship of tolerance to metabolic rate.

The more rapid breathing and flying Hymenoptera and Diptera were

more susceptible to gaseous fuels than the more terrestrial Orthop­

tera. In conditions approximating 500 ppm at 18° to 22°C, indolene

most quickly caused narcosis and disorientation, followed by ethanol

and methanol, respectively. Electronic monitoring of heart function

showed arrhythmia, deletions, and secondary beats under all three

fuel exposures. Possible permanent flight muscle dysfunction in

honeybees at the above conditions was recorded in these experiments

and is currently under investigation.

Other

above

tests

tory,

projects have involved arachnid exposures to methanol near or

levels expected in field spill situations. The results of these

indicate a gradient of tolerance among these important preda­

nutrient cycling, and pollinator organisms. Arachnids as a

group

after

sible

proved extremely hardy, showing reversible narcosis only

prolonged exposure to 300 ppm methanol. Narcosis and rever­

neuronal disruptions occurred at 100 ppm ethanol/methanol in

air for several orders of flying insects. Ongoing investigations in­

volve hormone and pheromone disruptions at expected field spill

levels of methanol. As most insect pheromones are short carbon

chains of low molecular weight, the effects of low levels of alcohol

are expected to be minimal.

METHANOL IN THE ENVIRONMENT (SPECIFIC)

Introduction

An overview of the biological consequences of methanol spills and

leaks demonstrates a wide range of effects in different situations.

The specific consequences of methanol on animal populations in the

21-15

(~

c

Beluga to Drift River areas are associated with both biological and

physical factors. In particular, life stage, nutritional state, sea­

sonal reproduction, microhabitat, migration, sediment load, oxygen

concentration, temperature, and exposure levels are most important

in assessing impacts of spills or leaks from the plant site, pipeline,

or tanker terminal. The consequences of methanol spill/ leak inci­

dents may be summarized in organismic groupings.

Fish

Experimental tests for acute and chronic exposure to methanol indi­

cate a wide range of tolerance, which varies within taxanomic

groups, adult, age/size, and life stage. In addition, availability of

oxygen during exposure, post exposure conditions, and other factors

contribute to degree of disruption in fish by supra-ambient concen­

trations of methanol.

Several trout and salmon species may tolerate 1% methanol for 3 to 5

days. While behavioral alterations occur at this concentration, per­

manent damage is uncommon. It is probable that the eggs, sperm,

embryos, and post-embryonic alevins of salmonid fishes can with­

stand brief exposures to methanol at 1%. A 1% concentration kills

grayling eggs if continued over their incubation period. Trout fry

are apparently unharmed by 24-hour exposures to 0. 8%. Adult rain­

bow and brook trout tolerate 3% methanol for 24 hours, when aera­

tion of water is supplied.

Blood analyses for methanol in exposed trout and salmon indicate

non-selective removal of the alcohol via urine and gill surface dif-

fusion. Adult brook trout exposed to 1% methanol show complete

clearance in blood tests 12 hours after exposure.

A 10% concentration of methanol is lethal to most fish, depending

upon oxygen demands and availability in each case. Eggs and

embryonic stages of most fish are killed at 10% methanol, even dur­

ing exposures of less than 1 minute.

21-16

Several unknowns exist for salmon and other fish of the Beluga-Drift

River area in interactions with methanol accidents. Preliminary

results show delayed embryogenesis and hatching at sublethal doses.

The effect of ambient methanol on fertilization is unknown. Both

sperm and ova could be extremely sensitive to low concentrations of

methanol. It is also likely that sublethal doses of methanol could

disrupt sensory recognition in spawning, migration, and courtship in

some fish. In· the sediment-laden waters of the upper inlet, these

disruptions could prove significant. The exposure of spawning,

migrating, or developing fish to methanol concentrations approaching

1% is potentially very disruptive. In addition, food chain alterations

for resident or anadromous feeding fish may be significant in. repro­

ductive and adult success.

Human consumption of methanol-killed fish is not advisable. While

this alcohol is rapidly removed from live tissues, it can remain in

dead organisms in significant amounts.

Crustaceans

Crabs and shrimp in the Beluga-Drift River area are much more vul­

nerable to methanol exposure at developmental stages than at the

adult stage. Studies have demonstrated reversible physiological

disruptions in various crustaceans exposed to high ambient methanol

concentrations. However, preliminary data suggest delayed meta­

morphis, color alteration, and reduced size in various crustacean

instars associated with 100 to 1,000 ppm methanol. These data sug­

gest potential damage to the tanner crab fisheries following any

major incident, as this species has a floating, surface-dwelling larvae

found throughout the lower inlet. Other species of commercially

important crabs and shrimp have free-swimming larvae capable of

avoiding temporary surface concentrations of methanol. However,

tanner crab adults .are generally found far south of the Drift River

Terminal. Significant and commercially important crustacea in lower

Cook Inlet include:

21-17

King Crab

Tanner Crab

Dungeness Crab

Pink Shrimp

Humpy Shrimp

Coonstripe Shrimp

Spot Shrimp

Sidestripe Shrimp

Paralithodes camschatica

Chinoecetes bairdi

Cancer magister

Pandalus borealis

Pandalus goniuris

Pandalus bypsinotus

Pandalus platyceras

Pandalopsis dispar

Most adult crabs and shrimp in the area of interest are somewhat

migratory. King crab populations, for example, occupy deep waters

in various localities throughout most of the year, and early in the

spring the adults move to shallow waters (15 to 30 fathoms) to

breed. Fertilized eggs are carried for a year. The following spring

(usually mid-April) free-swimming larvae occupy middle and lower

levels of shallower waters. Consequently, this species is not found

in extremely shallow areas, or at the surface where vulnerability to

methanol would be increased. In addition, like nearly all commer-

cially important crustacea of this inlet, the king crab population are

far removed from the Beluga-Drift River area.

In general, the significant crab and shrimp populations of Cook Inlet

are in minimal jeopardy from methanol for several reasons: Adult

mobility, adult tolerance levels, most have subsurface larvae, and

geographic distance from likely spill locations (plant and terminal

sites).

Molluscs

Molluscan species in the area of interest are more vulnerable as

larvae than as adults. While ciliary narcosis is common in clams and

other molluscs exposed to methanol, the effects of concentrations up

to 3% are usually reversible. Only adults in very high alcohol con­

centrations for extended periods would be lost in spill situations.

Significant and commercially important mollusca in lower Cook Inlet

include:

21-18

Razor clam

Northern (or Weathervane) scallop

Heart clam

Soft-Shelled clam

Bent-Nosed clam

Siliqua patula

Patinopecten caurinus

1. Cinocardium ciliatum 2. Cinocardium californiense

1. Mya sp. 2. Yoldia myalis

Macoma balthica

While razor clams and other clams are abundant in the central and

lower portions of the inlet, the sport and commercially significant

beds occur away from the proposed methanol plant site. However,

Harriet Point near Drift River is on the surface current line from

the Drift River Terminal. This area could suffer minor adult losses

in a major spill situation. Methanol concentrations would have to

exceed 3% over a 24-hour tidal period for damage to occur.

However, as the veligers of some clams (including the razor clam)

are tapetic or infaunal in pools or soft mud, they may be more vul­

nerable to low ambient methanol concentrations. Californian· strand

and estuarine clam veligers are killed by 100 to 1,000 ppm methanol,

depending on species, temperature, and available oxygen. It is

considered very unlikely that spills from the Beluga-Drift River area

could reach recognized clam beds in significant amounts.

Birds and Mammals

Disruptions to bird and mammal populations in Cook Inlet from any

methanol spills are considered unlikely. Since methanol is not bio­

logically magnified within food chains, it is not ordinarily passed

from prey to predator. Studies have demonstrated high non-primate

tolerance for methanol, in both acute and chronic exposure studies.

Habitat disruption from methanol spills into marshlands or mudflats

would be less permanent than from crude oil or diesel fuel spills.

Recovery of habitats following methanol spills is very rapid. Marsh

nesting birds and mammals could suffer temporary loss of canopy in

a saturation spill. Mobile cetaceans and pinnipeds would suffer min-

21-19

(~) ~~:;:-_....o-'

imal disruptions from either acute or chronic spills. Consumption of

contaminated fish or crustaceans by birds or mammals following a

spill similarly presents little hazard to non-human vertebrates.

Summary

The rapid dispersal, dilution, evaporation, and biological degradation

of methanol in both aquatic and terrestrial habitats minimize its im­

pact on living systems. Methanol in low levels is a normal component

in many habitats, particularly mudflats, and many organisms are be­

haviorally, biochemically, and morphologically equipped to tolerate its

presence. Soil penetration and aquifer involvement are minimal con­

cerns with methanol production. The extreme currents and tides of

the Beluga-Drift River area and the subsequent dilution of any

spilled methanol from this facility, suggest that most impacts would

not be severe or of long duration. Human impacts to fish and

crustacean fisheries would be very localized in any spill situation

from methanol plant to tanker terminal. Long-term disruptions to

fisheries, or bird and mammal populations are considered unlikely in

all but the most localized, worst-case possibilities.

21-20

(~ ___ /

SAFETY AND RISK

22.0 SAFETY AND RISK ANALYSIS

INTRODUCTION

The purpose of this section is to assess an occupational health and safety program for the proposed methanol plant, because there are potentially hazardous situations inherent to the coal gasification process. Regulatory standards are cited where compliance is manda­tory to achieve a given level of protection. In addition, potential hazards are enumerated to facilitate further evaluation of the programs necessary to achieve the desired level of protection. The most serious hazards are created by the possibility of fugitive emissions of carbon monoxide, hydrogen sulfide and methane.

A thorough safety/risk analysis involves complete identification and evaluation of hazardous elements to protect personnel, facilities and the environment against accidents. This level of analysis would consider the entire project from mining to shipping. A more detailed assessment as well as similar evaluations relative to the operation of the mine, transportation system, pipeline, and marine loading facility will be made in Phase II.

ASSESSMENT PROCEDURES

Program Characteristics

An early and complete safety analysis can eliminate potential safety and health problems that may otherwise, unknowingly, be produced during planning and construction phases of the project. This

analysis can also provide the foundation upon which a thorough safety program can be developed for the construction and operation

phases of the project. This safety program can minimize the impact

22-1

of physical and chemical hazards on human health. An effective

safety program requires management commitment both to the develop­

ment of the program and to. its implementation.

A thorough safety analysis should begin prior to the commencement

of construction to provide optimum cost effectiveness. I mplementa­

tion procedures and guideline characteristics for such a precon­

struction safety analysis and review should include:

1. Management•s accident control philosophy should be described by

a clear, workable policy.

2. Responsibility must be clearly defined to cover all aspects of the

program.

3. An organization must be formed to carry out the program.

4. Realistic objectives must be set.

5. Reporting procedures must be implemented so that accident facts

can be recorded and causative factors analyzed.

6. An analysis of the relationship of facilities, personnel, equipment

and materials to accident causes must be performed.

7. Personnel must be properly trained in their jobs, and management

must promote realistic caution at all times.

8. Programs must be evaluated regularly to strengthen weaknesses.

9. Recognition must be provided for outstanding effort and achieve­

ment.

10. Top management must exert leadership in order to maintain pro­

gram effectiveness.

22-2

Regulatory Assessment

An important area of regulatory concern is focused on the possible carcinogenic, mutagenic and teratogenic effects of polycyclic aromatic hydrocarbons (PAH) on human health. Polycyclic aromatic hydrocarbons are present in highest concentrations where incomplete combustion occurs. However, the Winkler gasifier is a partial oxidation system whereby the PAH compounds are converted into carbon oxides and hydrogen due to the relatively high temperature of gasification. Therefore, the major concern of the Winkler gasi­fier is not PAH compounds but, rather, the exposure to carbon monoxide and hydrogen sulfide, substances normally inherent to gi~ification processes.

The Occupational Safety and Health Administration (OSHA) Regulations, Title 29, Code of Federal Regulations, Part 1910 (cited 29 CFR 1910) at Subpart 2 (cited 29 CFR 1910 Subpart 2) lists a number of toxic and hazardous substance exposure limits. Of these toxic substances listed by OSHA, the following trace compounds in the raw gas are predicted to fall within the following ranges:

NH3 HCN

C2H2 C6H6 H2S cos

3 to 10 ppm (vol.) 10 to 20 ppm (vol.) 50 to 150 ppm (vol.) 10 to 30 ppm (vol.)

700 ppm (vol.) 1 00 ppm ( vo 1. )

It should be noted that the above concentrations of H2S and c6H6 are above acceptable ceiling limits pursuant to OSHA standards (i.e. 20 ppm- H2S; 1 ppm c6H6). Further applicable regulations are cited

throughout this section where mandatory standards apply.

22-3

C .... \ .

SAFETY OVERVIEW

Health Effects

The major hindrance to accurate risk assessment in a coal gasifica­tion plant arises because occupational exposures are to complex mixtures of chemicals rather than a single chemical. Chemicals similar in constitution and toxicologic mechanisms may simply have an additive toxic effect; or others may have a more serious synergis­tic effect, which is of particular concern with carcinogens. Some non-carcinogenic chemicals may enhance the potency of carcinogens

·when present. However, if components act independently, each can be considered as though the others were not present.

22-4

Effects of toxicant exposure on human health deviate dramatically.

Assessment of these effects, again, are complicated by the complex

chemical mixtures present. Exposure effects may vary from tempor­

ary irritation (e.g. ammonia exposure) to death within minutes (e.g.

hydrogen sulfide exposure). Exposure to polycyclic aromatic hydro­

carbons may cause problems that are not apparent for decades.

Protection of the work environment from these hazards requires an

effective sampling program to determine potential toxicant exposure.

Effective engineering and work practice controls can be developed

through this sampling program.

Coal gasification is essentially a closed process with few continual

opportunities for air or surface contamination. Process operating

conditions will determine the source of potential exposure. For

example, vessel entry would be the predominant exposure source

during down time (maintenance), while fugitive emissions from pro­

cess equipment could be the primary exposure source when on­

stream (operating). It is therefore logical to define possible hazards

with respect to operating stages. The gasification process can be

broken down into four modes of operation: Process Down Time,

Start-up, On-stream Operation and Shutdown.

0 Process Down Time

Process down time exposures would result primarily from mainten­

ance and repair operations which require an employee to enter a

vessel. Vessels may contain residual gases and surface contamin­

ants such that entry may pose health hazards to employees. A

safe work permit system should be established as a checklist for

the employee to proceed safely.

The following hazards apply both to vessels and confined areas.

Similar hazards exist when opening a process line and thus re­

quire similar attention. Among the health and safety hazards that

must be checked prior to vessel entry are:

22-5

Atmosphere: Areas containing less than 19% oxygen concentra­tions are considered inert for human respiratory functions. Oxygen concentrations far below 19% should be expected in all areas of the gasification process and may further exist in the baghouse areas.

Enclosed area within the process may contain vapors from vola­tile liquids. These vapors are capable of forming explosive mixtures upon contact with air. Coal dust present in the coal preparation .areas is equally capable of explosion at high con­centrations.

Gases and Liquids: A number of liquid, gaseous and vaporous constituents in the process are toxic. These toxic constituents should be expected in all gas stream vessels and lines.

To insure these hazards are minimized before opening the vessel, all material must be evacuated and properly disposed of in a safe manner. Flushing the vessel with steam or an adequate solvent will remove toxic gases and residues. Purging with an inert gas following flushing should remove the last traces of toxic gases and vapors. Physical isolation of the vessel is required to sepa­rate it from all sources of hazardous material. Isolation of a vessel involves plugging a line or removing a section of process pipe. Only if other methods are not possible should the use of a valve be permitted as an isolation method; then both supervisor and worker should 11 lock-out 11 a closed valve.

Before human entry, the existing (inert) vessel atmosphere should be.thoroughly exhausted by means of exhaust fans and flexible ducts inserted into vessel crevices. Testing of the vessel

22-6

0

should verify:

1. Greater than 19% oxygen concentration;

2. Atmospheres less than 1/10 the Lower Explosive Limit _(as

given in the Handbook of Industrial Loss Prevention);

3. Absence of toxic gases and vapors, determined by either

direct instrument reading or indicator tubes.

If testing indicates insufficient oxygen or toxic vapors are pres­

ent, respiratory equipment must be provided in accordance with

29 CFR 1910.134. However, respiratory equipment is a last re­

sort method only to be used after it has been demonstrated that

engineering work practice offers insufficient protection.

No more employees shall enter a vessel than there are means to

retrieve safely in an emergency. A standby employee must be

present at all times outside the vessel whenever an employee is

inside a vessel. The standby employee should maintain contin­

uous contact with the person inside and should be prepared to

initiate rescue procedures should it become necessary.

Opening a process line may expose a worker to the same toxic

hazards as entering a vessel. Prior to opening, the process line

should be blocked both upstream and downstream. An exhaust

hood should be used to remove any toxic gases and vapors to the

flare. Once an exhaust hood is in place, the bleed valve can be

opened gradually.

Start-up

Start-up procedures should include leak tests. Cold and hot

testing with an inert gas are necessary for adequate detection of

any potential process leaks. Detection of these leaks before oper-

22-7

0

ation begins will reduce the probability both of health hazards

and emergency shutdowns. Adequate training programs prior to

start-up are a necessity.

On -stream Operation

Worker exposure would occur from process equipment leaks.

Equipment such as pumps, compressors, valves and flanges are

subject to relatively high temperatures and pressures. Corrosive

and acidic liquids may be encountered especially in pumping coal

runoff water from the retention ponds. Proper selection of equip­

ment, seals and gasket materials to withstand such abuse is

needed to minimize the potential for leaks. Triple mechanical

seals may be necessary to effectively reduce the possibility of

toxic material leaks in some areas of the process scheme.

Leaks occurring at operating pressure should be readily recog­

nized as adverse effects on operating parameters or spontaneous

combustion upon gaseous entry into the atmosphere. Neither

condition is acceptable for any length of time; therefore little

exposure from a continuous source is expected as operating pro­

cedures would provide for shutdown and repair.

Numerous techniques can be employed to further reduce the risks

from process related leaks, among them various types of exhaust

ventilation. Requirements for ventilation are given in 29 CFR

1910.94; furthermore, construction, installation, inspection and

maintenance of exhaust systems must conform to standards given

in American National Standard Fundamentals Governing the Design

and Operation of Local Exhaust Systems, Z9.2 - 1960, and ANSI

Z33.1 - 1961. 11 Eiephant hoses 11 can and should be utilized in

enclosed areas. These long flexible exhaust hoses should be

conveniently located so they can be placed over a leak as it

occurs. When not in use each hose should be dampered. Areas

where more frequent leaking occurs should utilize local exhaust

ventilation.

22-8

0

Liquid leak exposures can be minimized by the use of portable

shields and drip pans. Lines containing toxic materials should be

designed with parallel duplicate lines and valves so that leaks can

be bypassed to allow for continued operation. In critical process

areas, the installation of parallel pumps and compressors could

circumvent an unplanned shutdown due to leaks.

Shutdowns

Shutdown essentially would present the same hazards as those

.encountered with the process down time operation. The only

difference is that line material would be vented to the flare. To

insure safety, the lines should be purged with inert gas until

instrumentation indicates no process gas remains. All other

safety procedures as given in the Process Down Time section

should be adhered to as part of normal safety practice.

PROCESS HAZARDS

While process operating conditions will establish the type and limits

of exposure, a thorough safety /risk analysis must also evaluate

operational hazards unique to each process section. Extensive pre­

construction investigation of each process section is required to

develop an adequate safety program. This review will be accom-

plished in Phase It.

Coal Storage

Potential hazards inherent in coal storage are dusting, fire and

leaching.

Dust is an intermittent health hazard caused by the loading,. unload­

ing and clean-up of coal in the storage area. Only storage facility

personnel should be affected, as the area is located a significant dis­

tance from the process itself. Good housekeeping techniques can

substantially reduce hazards and should be rigidly enforced.

?2-9

Lignite and sub-bituminous coals can ignite when dry and exposed to ambient air conditions. These surface fires produce hazardous gases and particulates similar to coke oven emissions. These emissions are a source of polycyclic-aromatic hydrocarbons and should be handled accordingly. As with dusting, good housekeeping procedures can reduce hazards.

Coal Preparation

Exposure to dust and excessive noise are the primary safety con~ cerns in the coal preparation area.

Dusting is possible from any equipment, especially equipment that requires frequent disassembly for maintenance. Dust produced from crushing coal presents a number of inhalation hazards, most notably precipitating pneumoconiosis. Dust explosion also increases the possibility of a fire hazard.

Additioanl fire and inhalation hazards exist in the coal drying area should the temperature in the drying zone exceed safe limits. The possibility of fire from spontaneous combustion also exists during conveying of this dried coal.

All grinding operations are inherently noisy. Although operation is located away from the process plant, operating personnel may still be affected psychologically. Mandatory occupational noise exposure limits are set in 29 CFR 1910.95.

Coal Feeding

Valves in the coal feeding process are subject to extraordinary abuse, particularly lockhopper valves. Faulty valves may cause reactor off-gas to escape to the atmosphere, as these valves are

22-10

located at the low pressure portion of the system. A double block valve arrangement wi11 be utilized minimizing potential leaks. Preliminary designs of the valves will occur in Phase II as well as the interlock control system.

Gasification

Potential health and safety hazards in the gasification areas will be due primarily to: leaks, plugged lines and insulation problems.

Leaks may involve the temporary release of extremely toxic sub­stances into the gasification areas, most notably carbon monoxide and, to a lesser extent, hydrogen sulfide. Even though leaks would be detected quickly in this area, potential loss of life is a ~rave reality should only minimal exposure occur.

Plugged lines may be a frequent problem in gasification and all previous safety precautions given in the process down safety assessment apply. Due to the formation of extremely toxic gases and vapors, addi·tional emphasis should be placed on an· safety precautions before vessel entry. Solids present in the gasifier should be essentially inert as they will be highly coked or ashed.

Ash Removal and Disposal

Valves in the ash removal and disposal lockhoppers are subject to the same abuses as those in the coal feeding process. High failure incidence may occur in these valves. Valve leaks can allow process

• gas to escape to the atmosphere causing potential inhalation hazards. Ash and chars are essentially inert but may absorb dissolved trace

elements from recycle water. These elements may later leach out upon rain exposure and produce a potentially toxic leachate.

22-11

Venturi Scrubber

The Venturi Scrubber recycle pump is subject to excessive wear due to the pumping of solids. This excessive wear necessitates frequent visual inspections to prevent possible leaking of toxic substances.

Appropriate sampling techniques are necessary to reduce the possi­bility of burns from hot sample water. Sludge must also be handled carefully to prevent both worker exposure and accidental spills.

Shift Conversion

In normal operation, few hazards are foreseen with the shift conver­sion process. Normal maintenance operations should also present few hazards if the high concentrations of carbon monoxide in the reaction vessels are adequately purged.

Acid Gas Removal

If leaking gas and vapors occur from the acid gas removal system, there may be the possibility of toxic exposure. Fugitive emissions may release toxic substances (e.g. H2S) from any section of the process up to and including the sulfur recovery system.

Methanol Synthesis

Adherence to proper operating procedures should produce few hazards. Leaks may occur due to: plugged bed or lines, leaking valves or leaking pumps. Leaks will release carbon monoxide, methane and hydrogen in the work place. It is expected that carbon monoxide will be emitted in greater amounts than methane or hydrogen. How­ever, frequency and severity of such leaks should be far less than in the upstream portion of the plant. Leaks may also occur in the reformer section of the process, possibly releasing carbon monoxide,

----2-2--1-2--~--~---------~-----------------~ --

hydrocarbon gases or hydrogen.

Methanol Distillation

If leaking occurs in the distillation columns, there is a possibility of worker exposure to the high concentration of methanol. Due to. the extremely toxic nature of methanol, exposure to it should be avoided under all circumstances.

Utilities

The coal-to-methanol process would require numerous support utili­ties for operation. Utilities ar~ generally located within a single building and are inherently noisy .

. MONITORING THE PROCESS ENVIRONMENT

Industrial Hygiene

An effective industrial hygiene program is composed of the following occupational health programs functioning together.

Monitoring

A monitoring program is implemented as a warning signal. The signal utilizes an indicator substance present in the process scheme such that any leak of the indicator would allow determination of a toxic constituent. The toxic constituent can be assumed to leak in the same ratio as the indicator substance. Although this assumption may not always be valid, the signal is not proposed as an absolute test of compliance, but rather an indicator of possible noncompliance.

22-13

This type of monitoring program avoids insensitivity to trace con­

. stituents at a reasonable cost.

Carbon monoxide would appear to be the best indicator for the gas­

ification process. Carbon monoxide is present in high concentra­

tions, and is also easily monitored in real time or by remote samp­

lers. Alarm systems are available that can detect carbon monoxide

levels as low a 0. 2 mg/M3.

Medical

Employees should be provided with preplacement and periodic medical

examinations. The preplacememt examination should include full phy­

sical and laboratory tests to ascertain general fitness, identify high­

risk individuals, and set a basis for further routine examinations.

Medical records should be compiled for each employee and these

records must contain employee exposure data. Medical records

should be maintained for 40 years in accordance with OSHA regula­

tions (29 CFR 1910.20).

Education and Training

Periodic meetings of all employees should be conducted to describe

all potential health hazards in detail. Details of the medical program

should also be made available to each employee. Personal hygiene

should be emphasized to further promote worker protection.

Toxic effects can also be reduced. by minimizing skin contact with

soiled clothing. Plant shower facilities should be provided, as

should laundering facilities for protective clothing. Requirements for

these installations and other plant sanitation equipment are given at

29 C F R 191 0 . 141 .

22-14

Compliance

Control methods should be implemented and evaluated regularly.

Control methods include engineering, work practice and administra­

tive controls. Protective devices should also be evaluated to deter­

mine compliance with safety and health standards (i.e., Occupational

Noise Exposure [29 CFR 1910. 95]; Personal Protective Equipment [29

CFR 1910, Subpart I]; etc).

Regulated Areas

Process areas may be regulated that exceed carbon monoxide concen­

trations of 35 ppm on a regular basis. Job functions may also be

regulated to reduce the number of exposures to a particular hazard.

Posting of warning signs to reinforce adherence to specific safety

requirements in each area enhances the effectiveness of the overall

health and safety program. Specifications for such safety signs are

given at 29 CFR 1910 145. Safety color coding should also be used

to mark physical hazards as given at 29 CFR 1910.144.

Emergency Procedures

Emergency procedures should be developed where hazardous sub­

stances are handled. These procedures should be compiled in writ­

ing. Sufficient protection training should also be given to the

applicable personnel. Means of egress and emergency procedures

should be provided as given at 29 CFR 1910, Subpart E and 29 CFR

1910, Subpart Z.

FIRE SAFETY

A potential fire hazard exists whenever a vessel, duct, flange,

pump, compressor or valve is opened. Coal particles adsorb a

number of gases readily so that the possibility of a fire occurring

remains even after gas purging of the system.

22-15

Gaseous effluents from the gasifier are the primary sources of fire hazards. Hot gas can escape from ruptured pipes, leaks or improper sampling procedures. Fugitive g~s can ignite spontaneously upon entry to the atmosphere or drift several hundred feet before exploding. The number of potential leak hazards can be eliminated by installation of double valve sampling ports.

All automatic process control systems should have redundant instru­mentation to prevent vessels from overheating.

Requirements for fire protection and equipment are given by OSHA at 29 CFR 1910, Subpart L.

Conclusion

This report was developed as the foundation for a thorough safety analysis. The report presents an attempt to realize potential safety hazards and assess their detrimental effects on human welfare. Although further safety evaluation is necessary, every conscientious effort shall be made to minimize physical and chemical hazards afflicting human health.

The ultimate objective of this evaluation shall be final application of an acceptable safety program at the GIRl/Placer Amex Production Facility; this ultimate objective will be accomplished in Phase H.

22-16

(',

23.0

SITE EVALUATION SUMMARY

SITE SELECTION

INTRODUCTION

Construction of a methanol plant is being considered in a major coal

resource area on west Cook Inlet referred to as the Beluga area.

For purposes of this study this is an area of approximately 450

square miles bounded on the north by the Beluga River, on the

south by Nikolai Creek, on the west by the Capps Glacier and on

the east by the shore of Cook Inlet. In order to narrow the alter­

natives for siting the methanol plant within this broad area a screen­

ing analysis was used. Due to unavailability, Tyonek Native Corpo­

ration lands (former Moquawkie Indian Reservation) and the Bass

Hunt Wilson coal lease areas were eliminated from consideration,

thereby reducing the 450 square miles area to 370 square miles. By

eliminating the areas of natural water courses and the wetlands con­

sisting of small lakes and other significant standing water, the can­

didate area is further reduced to about 150 square miles. To pro­

ceed further with plant site selection the following three-step

process was used to narrow the alternatives to the best available

site:

Level - Screening Analysis

Level II - Preliminary Site Selection

Level Ill - Final Site Selection

The Level and Level II reviews were done as part of this feasibil-

ity study. Level Ill, 11 Final Site Selection 11, will be conducted dur­

ing Phase II of development of this project if it is determined feasi­

ble to proceed. The following discussion summarizes the review

process that determined a proposed plant site to use as a base case

for this feasibility study.

23-1

Level I - Screening Analysis

The apparent alternatives for siting a methanol plant are to place it

near the feedstock source (the mine); place it near the transporta­

tion infrastructure (a dock on Cook Inlet); or place it in a location

remote from the feedstock source (most likely a market area). With

this in mind, four specific areas were reviewed:

0

0

a. Granite Point and vicinity on Cook Inlet

b. The Capps coal mine area

c. The Chuitna coal mine area

d. Remote location

Granite Point on Cook Inlet

The area reviewed is approximately 10 square miles in size on the

west Cook Inlet shoreline generally between Granite Point and the

mouth of Nikolai Creek. A distinct advantage of this location

would be realized in the transportation of the finished product

due to close proximity to the existing 20-inch diameter Cook Inlet

pipeline, which currently transports crude oil to a tanker terminal

operation at Drift River, approximately 40 miles to the south.

The oil fields served by this line are nearly depleted, and the

pipeline would be available by the time the plant were in opera­

tion. Also, a plant near the shore would ease the movement of

large prefabricated plant modules, allowing more flexibility in

planning and construction. Other positive factors include a more

favorable climate and shorter period of snow cover than at the

higher elevations of the mine areas. A disadvantage is that the

plant would be 15 to 25 miles from the coal feedstock necessitating

a mine-to-plant transportation system.

Capps Coal Field Area

The Capps Field is one of two proposed mining areas that would

provide coal to the methanol plant. The Capps mine area is ap-

23-2

0

proximately 25 miles from Cook Inlet, at about 2,000 feet eleva­

tion near the Capps Glacier. An advantage of this location is

that it would not only be near the feedstock source but also near

the first coal that would be produced from either mine area. It

would also be sufficiently removed from the shores of Cook Inlet

to be visually unnoticeable. A principal disadvantage would be

the need for a pipeline system from the mine to Cook Inlet to

transport the methanol. Another disadvantage to the upland loca­

tion would be difficulty in obtaining sufficient water for plant

operation. It is unlikely that significant quantities of ground­

water could be obtained in the vicinity, and the surface sources

are inappropriate due .to their seasonal nature as sources, and

due to water quality and/or use as a fish habitat.

A furtt:ler disadvantage to the Capps location is that the coal pro­

duced from the Chuitna Field would have to be hauled upgrade

from approximately 1,400 feet elevation to 2,000 feet, the eleva­

tion to the plant at the Capps mine. To operate a plant in this

location would require investment in both coal and methanol trans­

portation systems.

Chuitna Coal Field Area

The Chuitna mine area is approximately 15 miles from the shore of

Cook Inlet at an elevation of about 1,400 feet. This field is gen­

erally on a direct line route from Cook Inlet to the Capps Field.

Advantages of the Chuitna mine area would include the relatively

unnoticeable location and its nearness to the feedstock. The

pipeline transportation system to carry methanol to Cook Inlet

would be approximately 10 miles shorter than from a Capps site

and the coal supplied from the Capps mine could be transported

downgrade, instead of uphill from Chuitna to a Capps plant site.

23-3

( 0

0

Remote Location

To complete the site selection alternatives, the possibility of an

area away from Beluga or even outside of Alaska was also recog­

nized. A remote site was dismissed as unfeasible particularly due

to the need for double handling of coal, and additional marine

transportation costs associated with getting coal to the processing

location. In light of present market conditions and current and

anticipated energy policies during the life of this project it

appears essential to economic feasibility to have the plant close

enough to the coal source so that the coal may be provided with

minimal handling utilizing no more than one major mode of trans­

portation. The relatively clean and undeveloped Alaska location

also offer advantages in environmental permitting, since there

are not already significant contributions of air pollution or waste­

waters in the area consuming allowable 11 increments 11 of emissions

to the environment, as would be the case in most west coast loca­

tions.

Comparison of Alternatives

At this point the Capps Mine and the remote location were elimi­

nated from further consideration for reasons generally described

above. The two more likely alternatives, Granite Point and the

Chuitna Field, were then further compared using evaluation cri­

teria relevant to both locations. Each site was assigned a numer­

ical value (3 = good, 2 = average, 1 = poor) reflecting its com­

patability with the requirements or restrictions associated with

each of the evaluation criteria. Table 23.1 shows the results of

this comparison and numerical ranking.

Although all qualitative rating criteria were considered equally in

the above table, greater weight should be given to transporta­

tion, environment, and capital costs. The ratings on each of

these three criteria, as well as the overall outcome favored the

23-4

(~

(~~! , ___ ,

Table 23.1

QUALITATIVE COMPARISON OF SITES

Site Alternatives Shore of

Evaluation Criteria Chuitna Mine Cook Inlet

Coal Transportation 3 1 General Environmental 2 2 Capital Costs 1 3 Permit Concerns 2 2 Wetlands 3 2 Product Transportation 1 3 Geotechnical 1 2 Climate 1 2 Water Availability 1 3 Power (external) 1 2 Dock Access 1 3 Land Availability 2 2 Site Preparation 2 2 Support Services 1 2 Wastewater Discharge 1 3 Labor Factors 1 2 Visibility 2 1 Site Drainage 2 2

TOTAL 28 39

Cook Inlet site, so a second comparison using weighting .factors

for certain criteria was not necessary. The conclusion of the

screening analysis is that a site near the shore of Cook Inlet

would best serve the objectives of this project.

A disadvantage of the tidewater site noted in the analysis was the

need for a transportation system to move the coal to the process

facility. This concern becomes less significant in light of the

reasonable assumption that regardless of plant location, there

eventually will be a mine-to-shore transportation system for

movement and marketing of bulk coal totally unrelated to this

project. This reaffirms the selection of the Cook Inlet site.

23-5

c

Level II - Preliminary Site Selection

The next level of site selection involved choosing a specific area with

a minimum of 1,000 contiguous acres near the shore of Cook Inlet

between Granite Point and the mouth of Nikolai Creek that appears

suitable for location of the methanol plant. The site designated in

this review would form the base case for this feasibility study.

The area under review is approximately 10 square miles, constrained

by extensive wetlands and standing water to the north, the Trading

Bay State Game Refuge to the south, the shore of Cook Inlet to the

west, and, on the east, the desire to remain reasonably close to

Cook Inlet. Within these parameters there are two general site

alternatives for the plant: Tidewater in the low-lying area below the

bluffs, or in the upland area between the bluff line and Congahbuna

Lake.

0 Near Tidewater

There is a somewhat confined area very near high tideline in ele­

vation between Granite Point and the mouth of Nikolai Creek that

could be considered a candidate plant site. The land is· suffi­

ciently restricted in area, however, that it may not allow for suf­

ficient flexibility in the final plant lay-out if site-specific geo­

technical analysis or other considerations imposed further con­

straints. The physical characteristics of the site might require

splitting the facility into upland and tidewater-elevation locations

in any case. The foremost advantage of this tidewater location

would be that it would enable the plant to be constructed utilizing

very large prefabricated plant units which could be barged into

place through dredged channels and then fixed into position; the

channels could be reclaimed by backfilling. This method of build­

ing the plant could have a positive affect on capital costs which

could not be realized utilizing an inland site. A tidewater loca­

tion also would facilitate the discharge of treated wastewater

23-6

0

c_:,

effluent into Cook Inlet, the most likely receiving body of water

for an industrial discharge. However, this tidewater location is a

wetlands area and would require a Corps of Engineers permit.

Obtaining a permit could be very controversial due to proximity

to the Trading Bay State Game Refuge. The permit application

would have a reasonable potential to be denied in favor of more

environmentally acceptable upland locations. A plant located at

tidewater also would be susceptible to damage from storm-gen­

erated high tides.

Upland Location

An upland location 4 square miles in area was identified for this

site alternative (Sections 17, 18, 19 and 20, T11N, R13W, Seward

Meridian). Three-quarters of this land is controlled by the proj­

ect participant, Cl Rl. Selection of this location would avoid the

natural hazards associated with being near the shoreline at sea

level, but also would remove the option of being able to barge

large prefabricated plant units into place. However, it still would

be possible to receive and install large prefabricated interplant

modules using a coordinated barge and surface transportation

network. Portions of this candidate site area are considered wet­

lands by definition; however, it is believed that these wetland

areas fall under the jurisdiction of the Corps of Engineers

nationwide permit authority, a classification which avoids compli­

cations that may be associated with obtaining permits for a tide-

water location. Environmental and geotechnical constraints all

appear reasonable for this location, and indications are that

necessary permits could be granted.

The conclusion of the preliminary site selection review is that the

methanol plant should be located on the upland somewhere be­

tween Congahbuna Lake and the Cook Inlet bluff line. A specific

plant site within the general 4 square mile area was designated

for use as the base case in this feasibility study.

23-7

Level ttl - Final Site Selection

The last stage of site selection involves adjusting the preliminary

site location to make it most compatible with the actual conditions and

constraints identified by this feasibility study. This final site selec­

tion step would be accomplished under Phase II of project develop­

ment, if it is determined feasible to proceed with the project. At

this point it appears that the primary factor that will influence some

adjustment of the site location will be specific soils conditions.

Broad areas within the preliminary site area have been found to have

greater depths of organic overburden than originally anticipated.

Indications are that some relocation of the upland plant site in a

northwesterly direction would avoid some deep overburden and re­

duce capital costs through reduced site preparation. Further engi­

neering soils exploration would precede the final site selection deci­

sion.

23-8

BIBLIOGRAPHY

Ackerman, R. E. 1975. The Kenaitze People. Indian Tribal Series. Phoenix.

Alaska Department of Fish and Game. 1979. Recommendations for Minimiz­ing the Impact of Hydrocarbon Development on the Fish, Wildlife, and Aquatic Plant Resources of Lower Cook Inlet, Volumes I and II.

Alaska Department of Fish and Game. 1979. State Game Refuges and Crit­ical Habitat Areas and Game Sanctuaries.

Alaska Department of Fish and Game. 1975. Study G-1: Inventory and Cataloging. Vol. 16 (7-1-74 through 6-30-75).

Alaska Department of Commerce and Economic Development. 1979. Draft Permit/ Approval Requirements for Beluga Coal Developments.

Alaska Department of Commerce and Economic Development. 1978. Alaska Regional Energy Resources Planning Project. Chapter 1 - Beluga, Environment Chapter 2 - Beluga, Land Tenure Chapter 3 - Beluga, Transportation Chapter 4 - Beluga, Technology

(") "--.j Alaska Department of Commerce and Economic Development. 1977.

Alaska's Energy Resources Findings and Analysis. Prepared for U.S. Department of Energy.

Alaska Department of Natural Resources. 1979. Public Interest Land Report, Kenai Lowlands.

Alaska Petrofining Corporation. State Oil, I Program Plan.

1977. Proposal for Utilization of Alaskan October.

Anderson, L.L. 1972. Energy Potential from Organic Wastes: A review of the quantities and sources. Circular 8549. U.S. Department of the Interior. Bureau of Mines. Washington, D.C.

Anderson, H. E. 1959. Flora of Alaska and adjacent parts of Canada. Iowa State University Press (Ames), 543 pgs.

Arctic Environmental Information and Data Center. 1980. Environmental Impacts Associated with Coal Development in the Kukpowruk, Nenana and Beluga Fields, Ak. University of Alaska.

Arctic Environmental Information and Data Center. 1980. Reconnaissance of Aquatic and Terrestrial Habitats in the Capps and Chuitna Coal Lease Areas. Prepared for DOWL Engineers. November.

24-1

Arctic Environmental Information and Data Center. 1980. Terrestrial Wild­life Overview--Report (Cook Inlet Basin). Prepared for DOWL Engi­neers. December.

Atkinson, T. 1981. age Daily News.

New Budget Could Increase Taxes in Kenai. June 2.

Anchor-

Bacon, G. 1981. Personal Commun ic,ation.

Badger Plants, Inc. 1978. mercia! Plant, Vol. Ill:

Conceptual· Design of a Coal to Methanol Com­Environmental. NTIS.

Bancroft, H.H. 1886. History of Alaska 1730-1885. A.L. Bancroft and Company, San Francisco.

Barnes, F.F. 1966. Region, Alaska.

Geology and Coal Resources of the Beluga - Yentna USGS Bulletin 1202-C.

Battelle Human Affairs Research Centers. 1979. Pacific Northwest Labor­atory and CH2M Hill. Beluga Coal Field Development: Social and Management Alternatives. Prepared for Alaska Division of Energy and Power Development. May.

Bechtel. 1980. Executive Summary, Preliminary Feasibility Study, Coal Export Program, Bass-Hunt-Wilson Coal Leases, Chuitna River Field,

(-\ Alaska. April. ,_ .. /

c

Blakebrough, N.Y. 1978. Interactions of Oil and Microorganisms in Soil. (In) The Oil Industry and Microbial Ecosystems, K.W.A. Chatter and H. J. Somerville, Heyden and Son.

Bostwick, L; W. et at. 1979. Coal Conversion Control Technology, Vol. I: Environmental Regulations Liquid Effluents. NTIS. ·

Bostwick, L.E. et al. 1979. Coal Conversion Control Technology, Vol. II: Gaseous Emissions; Solid Waste. NTIS.

Beare, D.M. et al. 1978. Estimation of Ground Motion Parameters, USGS Circular 795.

Braund, S.R. and R. Behnke. 1980. Lower Cook Inlet opment Scenarios, Sociocultural Systems Analysis. Management, Anchorage. OCS Socioeconomic Studies cal Report No. 47.

Petroleum Devei­Bureau of Land Program Techni-

Braunstein, H.M. 1977. Environmental, Health and Control Aspects of Coal Conversion: An Information Overview.

British Steel Corp. 1974. The Gasification of Coal - A Bibliography. NTIS.

24-2

Brooks, A. H. et al. 1909. Mineral Resources of Alaska. U.S. Geological Survey Bulletin 379. U.S. Department of Interior.

Burrell, D.C. et al. 1967. Oceanography of Cook Inlet. University of Alaska, Institute of Marine Science.

Buck, E. H. et al. 1978. Comprehensive Bibliography and Index of Envi­ronmental Information for the Beluga-Susitna, Nenana and Western Arctic Coal Fields, Vols. I, II, and Ill. AEIDC.

Cairns, J., and K.L. Dickson. 1977. Recovery of Streams from Spills of Hazardous Materials. (In) Recovery and Restoration of Damaged Eco­systems, J. Cairns, K.L. Dickson, E.E. Herricks, Eds. Univ. Press of Virginia.

Calderwood, K. W., and Fackler, W. C. 1972. Proposed Stratigraphic No­menclature for Kenai Group, Cook Inlet Basin, Ak. Am. Assoc. of Petroleum Geologists Bulletin V. 56, No. 4, Pg. 739-754.

Capps, S. R. 1935. The Southern Alaska Range, USGS Bulletin 862. Department of Interior.

Chang, D.C. 1962. A Typology of Settlement and Community Patterns in Some Circumpolar Societies. Arctic Anthropology. Volume 1.

Chan, F. K. 1974. A Sasol Type Process for Gasoline, Methanol SNG and Low BTU Gas from Coal. M.W. Kellogg Co.

Chickalusion, M. and N. Chickalusion. 1979. Tubughna Elnena, the Tyonek People 1s Country. Alaska Native Language Center. Univer­sity of Alaska.

Chugach Electric Association. 1973. Environmental Analysis for Proposed Additions to Chugach Electric Association, Inc. Generating Station at Beluga, Alaska.

Cline, J., T. Bates, and C. Katz. 1980. Distribution and Abundance of Low Molecular Weight Hydrocarbons and Suspended Hydrocarbons in Cook Inlet, Shelikof Strait, and Norton Sound, Alaska. Pacific Marine Environmental Laboratory. April.

Cline, J., C. Katz, and A. Young. 1979. Distribution and Abundance of Low Molecular Weight Hydrocarbons and Suspended Hydrocarbons in Cook Inlet, Ak. Pacific Marine En vi ron mental Laboratory.

Committee on the Alaska Earthquake, Division of Earth Sciences, National Research Council. 1971. The Great Alaska Earthquake of 1964. Washington, D.C.

Conner, D.A., and G. Plock. 1975. Methanol Production from Coal. NTIS.

24-3

Cook Inlet Native Association. 1975. Cook Inlet Region Inventory of Native Historic Sites and Cemeteries.

Cowser, K.E., and C.R. Richmond. 1980. Synthetic Fossil Fuel Technol­ogy.

Dames and Moore. 1979. Ecological Studies of Intertidal and Shallow Sub­tidal Habitats in Lower Cook Inlet. N.O.A.A. April.

Dames and Moore. 1979. Oil Spill Trajectory Analysis, Lower Cook Inlet. N.O.A.A. March.

Dames and Moore. 1978. Drilling Fluid Disperson and Biological Effects Study for the Lower Cook Inlet, C.O.S.T. Well for Atlantic Richfield Co. April.

Dames and Moore. 1978. Air Quality Monitoring Plan. The Alpetco Co., Kenai Site.

Dames and Moore. 1976. Environmental Impact Report Proposed Ammonia/ Urea Plant Expansion, Kenai, Alaska. July.

Dames and Moore. 1976. Environmental Baseline Studies Proposed Coal Mining Operations Cook Inlet, Alaska. Prepared for Placer Amex,

(~-~ Inc., and Starkey A. Wilson. May . ... ........_~ 7'"

Dames and Moore. 1975. Environmental Impact Assessment Proposed Ex­pansion of Collier Ammonia/Urea Plant Nikiska, Alaska. November.

DeLaguna, F., Ph.D. 1975. The Archaeology of Cook Inlet, Alaska. Alaska Historical Society. Second Edition.

De Laguna, F. 1956. Chugach Prehistory Archaeology of Prince William Sound, Alaska. Washington Press.

DeLaguna, F., Ph.D. 1937. The Archaeology of Cook Inlet, Alaska. Alaska Historical Society. First Edition.

D'Eiiscu, P.N. 1979. Environmental Consequences of Methanol Spills and Methanol Fuel Emissions on Terrestrial and Freshwater Organisms. Proc. Third International Symposium on Alcohol Fuel Technology, Monterey, California.

D'Eiiscu, P.N. 1977. Biological Effects of Methanol Spills into Marine, Estuarine, and Freshwater Habitats. Proc. Symp. on Alcohol Fuels Technology, Wolfsburg.

D'Eiiscu, P.N. 1977. Methanol Toxicity of Mollusks and Other Selected Invertebrates of the Central California Coast. Proc. Western Society of Malacologists.

24-4

D'Eiiscu, P. N., J. Phillips, and D. Cook. 1981. Clearance and Recovery Rates for Selected Fish Exposed to Fuel Methanol Solutions. (M.S.) J. Toxicology.

D' Eliscu, P. N. et al. 1979. Community Dynamics and Physiological Con­sequences of Methanol Fuel Spills in California. Proc. Ecological Re- · search Society, Sacramento, California.

D'Eiiscu, P.N. et al. 1979. Effects of Methanol Fuels on Commercial Species of Crustacea in California. (M.S.) Crustaceana.

Detterman, USGS.

et al. Susitna MF-618.

S~gment, Castle Mountain Fault, Alaska.

DOWL Engineers. 1980. Development and Initial Application of Software to Produce a Seismic Hazard Analysis of the Gulf of Alaska. N.O.A.A.

DOWL Engineers. 1980. Greater Anchorage Area Earthquake Response Study. Alaska Division of Emergency Services.

DOWL Engineers. 1980. Seismicity/Risk Study Anchorage Pre-Trial Facility, Phase I. For CCC Architests and Municipality of Anchorage.

DOWL Engineers and Anderson, Bjornstad, Kane, Jacobs. 1980. quake Response Study, Medical Facilities, Anchorage, Alaska. Division of Emergency Services.

Earth­Alaska

Doyle, W.S. 1976. Strip Mining of Coal Environmental Solutions. Noyes Data Corp.

Dumond, D.E., and R.L.A. Mace. 1968. An Archaeological Survey along Knik Arm. Anthropological Papers of the University of Alaska, Vol­ume 14, Number 1.

Edwards, M.S. 1979. H2 S Removal Processes for Low - BTU Coal Gas. Oak Ridge National Laboratory.

Eldridge, G. H. 1898. A Reconnaissance in the Susitna Basin and Adja-cent Territory, Alaska. USGS Annual Report 20, Part 7.

Evans, C.D. et al. 1972. The Cook Inlet Environment- A Background of Available Knowledge. Prepared by Arctic Environmental Information and Data Center, University of Alaska, for Department of Army, Alaska District Corps of Engineers.

Fast, A. W. 1954. Artificial Aeration and Oxygenation of Lakes as a Res­toration Technique. Quart. J. Roy, Met. Soc. 80: 267-271.

Feely, R.A. et al. 1979. Composition, Transports and Disposition of Suspended Matter in Lower Cook Inlet and Shelikof Strait, Ak. Paci­fic Marine Environmental Laboratory.

24-5

Foster, M. J. and R. W. Holmes. 1977. The Santa Barbara Oi I Spi II: . An Ecological Disaster. (In) Cairns, Dickson, and Herricks, Eds. (Lee. CIT.).

Foster, H.L., and T. Karstrom. 1967. Ground Breakage in the Cook Inlet Area, USGS paper 543-F.

Freethey, G.W., and D.R. Scully. 1980. Water Resources of the Cook Inlet Basin, Ak., USGS Atlas HA-620.

Gastreick, K. D. 1980. Wetlands - A Coal Mine Permitting Challenge. Paper SME-AIME Mtg. October 22.

Gharma, G.D., F.F. Wright, J.J. Burns, and D.C. Burbank. 1974. Sea Surface Circulation, Sediment Transport, and Marine Mammal Distribu­tion, Alaska, Continental Shelf. Prepared for NASA. February.

Giddings, J.L. 1967. Ancient Men of the Arctic. Alfred A. Knopf, New York.

Gradet, A. and W. L. Short. 1980. Managing Hazardous Wastes under RC RA-Part 11. Chemical Engineering, McGraw Hill, New York, N.Y., July, pg. 60-68.

(; Gulf South Research Institute. 1970. Methanol Requirement and Tempera-.._ _ _/ ture Effects in Wastewater Denitrification. U.S. Environmental Pro­

tection Agency.

Hackett, S. 1975. Regional Gravity Survey of Beluga Basin and Adjacent Area. State of Alaska, Division of Natural Resources, Alaska Open File Report 100 (Preliminary).

Helm, J. 1968. The Nature of Dog rib Socioterritorial Groups. Man the Hunter. Aldine Publishing Company, Chicago.

Holmes and Narver. 1981. Conceptual Camp, Airport and Townsite Devel­opment Plan, Beluga Methanol Project. May.

Hulten, E. 1968. Flora of Alaska and neighboring territories; a manual of the vascular plants. Stanford University Press, California.

Humphrey, R. L. 1975. A Study of Archaeological and Historic Potential Along the Trans-Alaskan Natural Gas Pipeline Routes, I roque is Research Institute, Falls Church, Virginia.

Hutchison, 0. K. 1967. Alaska 1s Forest Resource. USFS Resource Bul­letin PNW19.

Jackson, F. R. 1974. Energy from Solid Waste. Noyes Data Corporation. Park Ridge, New Jersey.

24-6

Kari, J. 1978. The Heritage of Eklutna, Mike Alex, 1908-1977. Eklutna­Aiex Associates, Inc. Alaska Native Language Center, University of Alaska.

Kari 1 J. 1977. Dena• ina Noun Dictionary. Alaska Native Language Cen­ter, University of Alaska.

Karl strom, T. N. V. 1964. Quaternary Geology of the Kenai Lowland and Glacial History of Cook Inlet Region, Alaska. USGS Professional Paper 443.

Kellerher, J. A. 1970. Space-time Seismicity of the Alaska-Aleutian Seis­mic Zone, Journal of Geophysical Research. January.

Kelly, T.E. 1966. Geological Characteristics in Cook Inlet Area, Alaska. Paper prepared for 41st Annual Fall Meeting of the Society of Petro­leum Engineers of AIME, Dallas, Texas, October 2-5.

Kenai Borough. 1972. Comprehensive Community Development Plan for Tyonek.

Kent, F.J., J.V. Matthews, and F. Hadleigh-West. 1960. A Reportofan Archaeological Survey on the Northwestern Kenai Peninsula. Univer­sity of Alaska.

Kiefer, I. 1980. Questions and Answers on Hazardous Waste Regulations. Public Information and Participation Branch of EPAis Office of Solid Waste. Washington, D.C.

Klein, J.A. et al. 1978. Assessment of Environmental Control Technology for Coal Conversion Aqueous Wastes. Oak Ridge National Laboratory.

Kornegay, F.C. 1978. Assessing the Air Quality Related Impacts of Coal Conversion Facilities. Oak Ridge National Laboratory.

Kramer, L. et al. 1979. OCS Handbook: Planning for Petroleum Devel­opment in the Gulf of Alaska. Alaska Department of Community and Regional Affairs. June.

Kraxberger Drilling. 1980. Drillers Log for Well Drilled in Granite Pt. Sec. 28.

Laska, R. 1978. Energy/Environment Fact Book. U.S. Environmental Protection Agency.

Lutz, H .J. 1956. Ecological effects of forest fires in the interior of Alaska. USFS Alaska Forest Resource Center Technical Bulletin 1133.

Lynch, J.W. 1980. The New Hazardous-Waste Regulating Part I. Chemical Engineering, McGraw Hill, New York, N.Y. July.

24-7

Magee, E.M. 1976. Evaluation of Pollution Control in Fossil Fuel Conver­sion Processes Final Report. Exxon Research and Engineering Com­pany. Lindon, New Jersey.

Magoon, L.B. et al. 1978. Hydrocarbon Potential, Geologic Hazards, and Infrastructure for Exploration and Development of the Lower Cook Inlet, Alaska. USGS.

McCart, P.H., Ed. 1974. Gas Pipeline Routes in Arctic Gas Biological Environments Limited.

Fisheries Research Associated with Proposed Alaska, Yukon, and Northwest Territories. Report Series, Volume 15. Pre. Aquatic

McCart, P. H. et al. 1974. Toxicity of Methanol to Various Life History -Stages of Benthaic Macroinvertebrates. Arctic Gas Biological Report Series. Volume 15.

McGee, D.L., and K.S. Emmel. 1979. Alaska Coal Resources. Alaska Department of Natural Resources.

McKee and Wolfe. 1963. Water Quality Criteria, 2nd Edition, Califor.nia. State Water Resources Control Board, Pub. 3A.

Mitachi, K., K. Murakami, and J. Sato. 1981. Thermal Decomposition/Re­generation of Desulfurization Liquor. Chemical Engineering Progress,· American Institute of Chemical Engineers, New York, N.Y. April.

Mitchell, G.A., W.W. Mitchell, and J.D. McKendrick. 1980. Soil Charac­terizations of Alaskan Coal Mine Spoils. Paper for 1980 Alaska Coal Conference. University of Alaska

Moffit, F. H. et al. 1907. Mineral Resources of Kenai Peninsula, Alaska, Gold Fields of the Turnagain Arm Region. USGS Bulletin 277. Department of Interior.

Muench, R.D. et al. 1973. Oceanographic Conditions in Lower Cook Inlet: Spring and Summer. J. Geo. Res. 83 (C10).

Murphy 1 L. 1980. Alaska's Coal Leasing Program. Alaska Division of Minerals and Energy Management Paper - 1980 Ak. Coal Conference.

Murray, D.F. 1980. Threatened and endangered plants of Alaska. U.S. Forest Service Bureau of Land Management.

National Academy of Sciences. 1980. An Investigation of the Surface Min­ing Control and Reclamation Act of 1977 in Relation to Alaskan Condi­tions.

Nelson, G.S. 1980. Ground-water Reconnaissance Near Granite Point, Ak. USGS Paper - 1980 Ak. Coal Conference.

24-8

Nelson, S.A. 1977. Recovery of Some British Rocky Seashore from Oii Spills and Cleanup Operations. (In) Cairns, Dickson, and Herricks, Eds.

Olsen, M. et al. 1979. Beluga Coal Field Development: Social Effects and Management Alternatives. Battelle Pacific N. W. Lab.

Osgood, C. 1937. The Ethnography of the Tanaina. Yale University Publications in Anthropology No. 16.

Pacific Alaska LNG Associates. 1978. Western LNG Project, Draft Envi­ronmental Impact Statement, Vol. I. Federal Energy Regulatory Com­mission. Docket No. CP75-140.

Patterson, A. 1976. The Cook Inlet Subregion, Background Information on the Environment, Resources, People, Developments, Potentials. Industrial Development, Bureau of Indian Affairs. July.

Paul, J.K. 1978. Methanol Technology and Application in Motor Fuels. Noyes Data Corp.

Peive•, T. L. 1975. Quaternary Geology of Alaska. USGS Professional Paper 835.

Peterson, D.L., & Assoc. 1971. A Comprehensive Plan for Water Resource Mgmt. - The Cook Inlet Basin/Kenai Pen insula Region. Alaska Department of Natural Resources.

Petroff, I. Alaska.

1884. Report on the Population, Industries, and Resources of Tenth Census, 1880, Washington, D.C.

Pfeffer, F.M. 1975. Process and 'Environmental Technology for Producing SNG and Liquid Fuels.

Placer Amex. 1977. Beluga Coal Project Status Report.

Polunin, N. 1959. Circumpolar arctic flora. Oxford University Press, London.

Post, A., and L.R. Mayo. 1971. Glaciers, Dammed Lakes and Outburst Floods in Alaska. USGS Atlas HA-455.

Rao, P.D., and E.N. Wolff, Eds. 1975. Focus on Alaska 1 s Coal. Pro­ceedings of the Converence held at the University of Alaska, Fair­banks. October 15-17.

Reilly, J. 1981. Complication of available data of shoreline erosion rates -Kachemak Bay to Tyonek. Unpublished Paper, State Department of Geologic and Geophysical Survey.

Schmoll, H.R., A.D. Pasch, A.F. Chleborad, L.A. Yehle, and C.A. Gardner. Reconnaissance Engineering Geology of the Beluga Coal Resource Area, South Central Alaska. USGS Preliminary Report.

24-9

Schmoll, H.R., L.A. Yehle, and C.A. Garner. 1981. Preliminary Geologic Map of the Congahbuna Area, Cook Inlet Region, Alaska. USGS Open File Report 81-429.

Scully, D. R. et al. 1980. Data from a Hydrologic Reconnaissance of the Beluga, Peters Creek and Healy Coal Areas, Ak. USGS Open File Report 80-1206.

Sigafoos, R.S. 1958. Vegetation of northwestern North America, as an aid in interpretation of geological data. USGS Bulletin 1061 E.

Smith, I. H. , and G. J. Werner. 1976. Coal Conversion Technology. Noyes Data Corp.

Speer, E.B. 1980. Potential Impacts of Coal Development on Fish and Wildlife in Alaska. NWF Paper - 1980 Ak. Coal Conference.

Spurr, J. E. 1898. A Reconnaissance in Southwest Alaska in 1898. USGS Annual Report 20, Part 7.

Stanford Research Institute. 1975. Coals for Clean Export Fuels.

The Potential for Developing Alaskan NTIS.

Stanley, S., T. H. Pearson, and C. M. Brown. Marine Microbial Ecosystems and the Degradation of Organic Pollutants.

Still, P. J. 1980. Index of Streamflow and Water Quality Records to Sept. 30, 1978, S. Central Ak. USGS Open File Report 80-600.

Sundberg, K. and D. Clausen. 1976. Post-Larval King Crab ( Paralith­oides catschatica): . Distribution and Abundance in Kachemak Bay, Lower Cook Inlet, Alaska. (In) Environmental Studies of Kachemak Bay and Lower Cook Inlet, Volume V, Alaska Department of Fish and Game.

Sharma, G. D. et al. 1974. Sea-Surface Circulation, Sediment Transport, and Marine Mammal Distribution, Alaska Continental Shelf. Cont. NO. NASS-21833, Task 7.

Thomas, C. 0. 1975. Alaskan Methanol Concept, a Pre-feasibility Study. I EA (M) 75-5.

Townsend, J. 1965. Ethnohistory and Culture Change of the Iliamna. University of California, Los Angeles, Ph.D. Thesis.

Townsend, J. B., and S. J. Townsend. 1964. Additional Artifacts from Iliamna Lake, Alaska. Anthropology Paper of University of Alaska, Volume 12, No. 1.

Townsend, J.B. and S.J. Townsend. 1963. Ethnographic Notes on the Pedro Bay Tanaina. Anthropologica N.S., Volume V, No. 2.

24-10

Townsend, J.B. and S.J. Townsend. 1961. Archaeological Investigations at Pedro Bay, Alaska. Anthropology Papers of University of Alaska, Volume 1, No. 1.

Tranter, D. Tyonek.

1972. Comprehensive Community Development Plan for Kenai Peninsula Borough Planning Department, Soldotna.

University of Alaska. 1979. Current and Proposed Coal Research at the Geophysical Institute.

University of Alaska Museum. 1979. Lower Cook Inlet Cultural Resource Study Final Report. Fairbanks, Alaska. Prepared for U.S. Depart­ment of Interior.

U.S. Army Corps of Engineers, Alaska District. 1974. Offshore Oil and Gas Development in Cook Inlet, Alaska. September.

U.S. Department of Agriculture et al. 1979. Addendum Ak., Rivers Cooperative Study, Beluga and Upper Susitna Sub-basins Plan of Work.

U.S. Department of Commerce. 1979-80. Published Search - Pollution and Environmental Aspects of Fuel Conversion. NTIS.

U.S. Department of Commerce. 1967-79. Published Search -Strip Mining. NTIS.

U.S. Geological Survey. 1980. Map of Oil Well Sites Near Granite Point ( R 12W I T 11 N ) .

U.S. Geological Survey. 1980. 1980 Programs. Geological Survey Circu­lar 823-A.

U.S. Geological Survey. 1978. Water Resources Data for Alaska, Report AK-78-1.

U.s. Geological Survey. 1976. Reconnaissance Geologic Map Along Bruin Bay and Lake Clark Faults in Kenai and Tyonek Quadrangles, Alaska. Open File Report 76-477.

U.S. ·Geological Survey. 1962. Map Showing Extent of Glaciations in Alaska. Miscellaneous Geological Investigations Map 1-415. Alaska Glacial Map Committee.

U.S. Soil Conservation Service. 1980. Solicitation for Susitna River Basin Mapping, Digitizing and Analysis.

U.S. Soil Conservation Service. 1980. Vegetation Mapping - Beluga Area. Cooperative River Basin Study Program. ·

U.S. Soil Conservation Service. 1979. Preliminary Field Procedures for the Cooperative Vegetation Inventory of the Susitna River Basin. Cooperative River Basin Study Program.

24-11

Vanstone, J.W. 1974. Athapaskan Adaptations. (In) Hunters and Fisher­men of the Subarctic Forests. Aldine Publishing Company, Chicago.

Vanstone, J.W. and M.B. Townsend. 1970. Kyik: A Historic Tanaina Indian Settlement. Fieldiana: Anthropology Volume 59. Field Museum of Natural History, Chicago.

Viereck, L.A. and C. T. Dyrness. tern for vegetation of Alaska. Report PNW-106.

1980. A preliminary classification sys­U. S. Forest Service, General Technical

Viereck, L.A. and E.L. Little, Jr. 1975. Atlas of United States Trees: Vol. 2. Alaska trees and common shrubs. U.S. Forest Service Mis­cellaneous Publication No. 1293.

Viereck, L.A. and E.L. Little, Jr. 1972. Alaska trees and shrubs. U.S. Forest Service Agriculture Handbook No. 410.

Wagner, G., R.S. Murphy, and C.E. Behlke. 1969. A Program for the Collection, Storage, and Analysis of Baseline Evironmental Data for Cook Inlet, Alaska. Prepared fo.r Alaska Water Laboratory, Federal Water Pollution Control Administration by Institute of Water Resources of the University of Alaska.

Wapora, Inc. 1979. Lower Cook Inlet, Alaska, Environmental Evolution/ Impact Review Manual. Prepared for U.S. Environmental Protection Agency, Region X. August.

Watson, T., R. Hall, J. Davidson, and D. Case. 1980. RCRA Hazardous Wastes Handbook. Government Institutes Inc., Washington, D.C. Environmental Report, 1980. The Bureau of National Affairs, Inc. Washington, D.C.

Wilkes, A.S. 1980. Guide to the May 19th, 1980 Federal Register. Public Information and Participation Branch of EPNs Office of Solid Waste. Washington, D.C.

Wilson, D.G. 1977. Review of Advanced Solid-Waste Processing Technolo­gy, AICHE Symposium series, American Institute of Chemical Engi­neers. New York, N.Y., Volume 73.

Winterhalder, E.C. 1979. cipality of Anchorage.

Geotechnical Hazards Assessment Study, Muni­Harding- Lawson Associates.

Whipple, J.A. et al. 1978. Transport, Retention and Effects of the Water-Soluble Fraction of Cook Inlet Crude Oil in Experimental Food Chains. National Marine Fisheries Service.

Wolfe, J.A., D.M. Hopkins, and E.B. Leapold. Paleobotany of the Cook Inlet Region, Ak.

Tertiary Stratigraphy and USGS Paper 398-A.

Woodward - Clyde. 1980. Port and Harbor Demand and Feasibility Pro-ject. Kenai Borough.

24-12

C~

Yehle, L.A., J.R. Schmoll, C.A. Gardner, and A.F. Chleborad. 1980. Preliminary Field Geotechnical and Geophysical Logs from a Drill Hole in the Capps Coal Field. USGS Open File Report 80-393.

Yehle, L.A. et al. 1980. Beluga Coal Resource.

Reconnaissance Engineering Geology of the Paper - 1980 Ak. Coal Conference.

Zenone, C., and G.S. Anderson. 1978. Summary Appraisals of the Nation's Ground-water Resources - Alaska. USGS Paper 813P.

24-13

., )> ~ ..... () ., )> z ~

PARTICIPANTS

DOWL ENG1NEERS/ALASKA TESTLAB

4040 11 B 11 Street Anchorage, Alaska 99503

Principal Investigators:

Lewis E. Dickinson John E. Paulson Ronald R. Dagon James R. Finley Luke C. Franklin David A. Cole, Jr. Thomas R. Williams

CCC ARCHITECTS AND PLANNERS

431 West 7th Avenue Anchorage, Alaska 99501

Principal Investigators:

Edwin B. Crittenden Richard K. Morehouse Gordon S. Harrison

RADIAN CORPORATION

8500 Shoal Street Austin, Texas 78766

Principal Investigators:

PETER D'ELISCEU

Mike Hoban Ed Rashin

University of Santa Clara 1273 Kririckerbocher Drive Sunnydale, California 94087

UNIVERSITY OF ALASKA

707 11 A 11 Street Anchorage, Alaska 99501

Principal Investigators:

Jean Baldridge nr~virl Trudgen Jim Thiel

25-1

Terry L. Barber Priscilla P. Wahl Roberta E. Goldman Vicky N. Sterling Mark J. Holum Robert W. Kranich

WOODY TRIHEY

P.O. Box 10-1774 Anchorage, Alaska 99511

RICHARD J. HENSEL

Hawkins Lane Anchorage, Alaska 99507

DRYDEN & LaRUE

4060 11 8 11 Street Anchorage, Alaska 99503

Principal Investigator:

Delbert LaRue.

OTHERS

Exploration Supply & Equipment MW Drilling Trading Bay Catering Company Alaska Helicopters Ross & Moore Associates, Inc.

In addition there was an exchange of information with the other principal project participants and consultants.

Placer Amex, Inc. Cl Rl, Inc. Davy Me Kee Corporation Klahn Leonoff R. W. Fisk Engineering Paul Weir Company CIRI/Holmes & Narver

25-2


Recommended