Coal Use for Power into the
Future and the need for Rapid
Introduction of CCS
“Sustainable Fossil Fuels for Future Energy”“Sustainable Fossil Fuels for Future Energy”
S4FE, Rome, 7 July 2009
Dr John Topper
Managing Director of IEA Clean Coal Centre
© IEA Clean Coal Centre www.iea-coal.org.uk
MEMBERS
Italy Japan
Rep. of Korea
UK
Spain
USAAustria
Canada
GermanyCEC
Australia
Poland
© IEA Clean Coal Centre www.iea-coal.org.uk
BHEL
Anglo Coal
ESKOM
Netherlands Group
BG Group
BRICC
Australia
CANZ
Eletrobras
DPG
SuekSIG
Schlumberger
Banpu
Arup
CONTENTS
• IEA’s Projections for Coal
• Coal Use Today
• Carbon Capture and Coal
© IEA Clean Coal Centre www.iea-coal.org.uk
10 000
12 000
14 000
16 000
18 000
Mto
e
Other renewables
Hydro
Nuclear
Biomass
World primary energy demand in the Reference
Scenario: this is unsustainable!this is unsustainable!IEA WEO 2008
0
2 000
4 000
6 000
8 000
10 000
1980 1990 2000 2010 2020 2030
Gas
Coal
Oil
World energy demand expands by 45% between now and 2030 – an average rate of increase
of 1.6% per year – with coal accounting for more than a third of the overall rise
Incremental primary energy demand in the
Reference Scenario, 2006-2030
IEA WEO 2008
Other Asia
E. Europe/Eurasia
Latin America
AfricaCoal
Oil
Gas
Nuclear
Hydro
Other
- 500 0 500 1 000 1 500 2 000
China
India
OECD
Middle East
Mtoe
Other
The increase in China’s energy demand to 2030 – the result of its sheer market size &
stronger economic growth prospects – dwarfs that of all other countries & regions
The continuing importance of coal in world
primary energy demand
60%
80%
100%
All other fuels
Coal
Shares of incremental energy demand
Reference Scenario, 2006 - 2030Increase in primary demand, 2000 - 2007
Mto
e
600
700
800
900
1 000
4.8%% = average annual rate of growth
IEA WEO 2008
0%
20%
40%
Non-OECD OECD
Demand for coal has been growing faster than any other energy source & is projected to
account for more than a third of incremental global energy demand to 2030
0
100
200
300
400
500
600
Coal Oil Gas Renewables Nuclear
1.6%2.6%
2.2%
0.8%
The Reference Scenario:
World coal production
5 000
6 000
7 000
8 000
Mil
lio
n t
on
ne
s o
f co
al
eq
uiv
ale
nt
Brown coal and peat
Coking coal
Steam coal
IEA WEO 2008
Steam coal, used mainly in power generation, dominates the 60% growth in global coal
production in 2006-2030, its share of output rising from 77% to 81%
0
1 000
2 000
3 000
4 000
1990 2006 2015 2030
Mil
lio
n t
on
ne
s o
f co
al
eq
uiv
ale
nt
The Reference Scenario:
Net hard-coal exports
Latin America
OECD North America
Africa
Other Asia
Russia
OECD Oceania 2006
2030
IEA WEO 2008
-300 -200 -100 0 100 200 300 400
OECD Asia
India
OECD Europe
China
Middle East
Other E. Europe/Eurasia
Latin America
Million tonnes of coal equivalent
Trade in hard coal grows by 2% per year to 2030, reaching almost 980 Mtce,
with most of the growth in exports going to China & India
Source: Powerline, Feb 2008
© IEA Clean Coal Centre www.iea-coal.org.uk
The Reference Scenario:
World electricity generation
8 000
10 000
12 000
14 000
16 000
TW
h
Coal
Oil
Gas
Nuclear
Hydro
Biomass
IEA WEO 2008
0
2 000
4 000
6 000
8 000
2006 2030
Biomass
Wind
Rest of renewables
The shares of coal & renewables in the power-generation fuel mix increase to 2030
– mainly at the expense of natural gas & nuclear power
Total power generation capacity today
and in 2030 by scenario
Hydro
Nuclear
Gas
Coal 1.2 x today
1.5 x today
2.1 x today
1.8 x today
In the 450 Policy Scenario, the power sector undergoes a dramatic change – with CCS,
renewables and nuclear each playing a crucial role
0 1 000 2 000 3 000
Other renewables
Wind
Hydro
Coal and gas with CCS
GW
13.5 x today
2.1 x today
12.5 x today
15% of today’s coal & gas capacity
Today Reference Scenario 2030 450 Policy Scenario 2030
Global view of Coal Use today
© IEA Clean Coal Centre www.iea-coal.org.uk
Recent Plant State-of-the-Art Conditions
G8 Case study plantsStudstrup (DK) 540/540
Maatsura 1 (J) 538/566
Esbjerg (DK) 560/560
Schwarze Pumpe (D) 547/565
Maatsura 2 (J) 593/593
Haramachi 2 (J) 600/600
Nordjylland (DK) 580/580/580
Boxberg (D) 545/581580
590
600
610
Max S
H S
team
Tem
pera
ture
, °C
⊗⊗⊗⊗Ultrasupercritical
© IEA Clean Coal Centre www.iea-coal.org.uk
Boxberg (D) 545/581
Tachibanawan 1 (J) 600/610
Avedore (DK) 580/600
Niederaussem (D) 580/600
Hekinan (J) 568/593
Isogo (J) 600/610
Torrevaldaliga (I) 600/610⊗⊗⊗⊗
Hitachinaka (J) 600/600
Huyan (China)
Genesee 3 580/570
Yunghung 566/576
530
540
550
560
570
1980 1985 1990 1995 2000 2005 2010
Year
Max S
H S
team
Tem
pera
ture
,
Supercritical
Locations for G8 case studies on Coal Plant
Genesee 3, Canada
Niederaussem K
Germany
Nordjylland 3
Denmark Wangqu, China
Younghung
S. Korea
Isogo New #1
Japan
© IEA Clean Coal Centre www.iea-coal.org.uk
Isogo New #1
Japan
Suratgarh, India
Majuba
South Africa
Natural gas fired
plant, Enfield, UK
Nordjylland 3, Denmark – highlights
• Most efficient coal-fired plant
• Operating net efficiency 47% LHV, power only mode/44.9%
HHV (not annual)
USC, tower boiler, tangential corner firing,
int. bituminous coals, cold sea water
© IEA Clean Coal Centre www.iea-coal.org.uk
HHV (not annual)
• High steam conditions 29 MPa/582°C/580°C/580°C at boiler by
early use of new materials (P91)
• Large number of feedwater heating stages
• Double reheat has prevented LP blade erosion
• Very low emissions and full waste utilisation
• NOx abatement Combustion measures and SCR
• Particulates removal ESP
• Desulphurisation Wet FGD
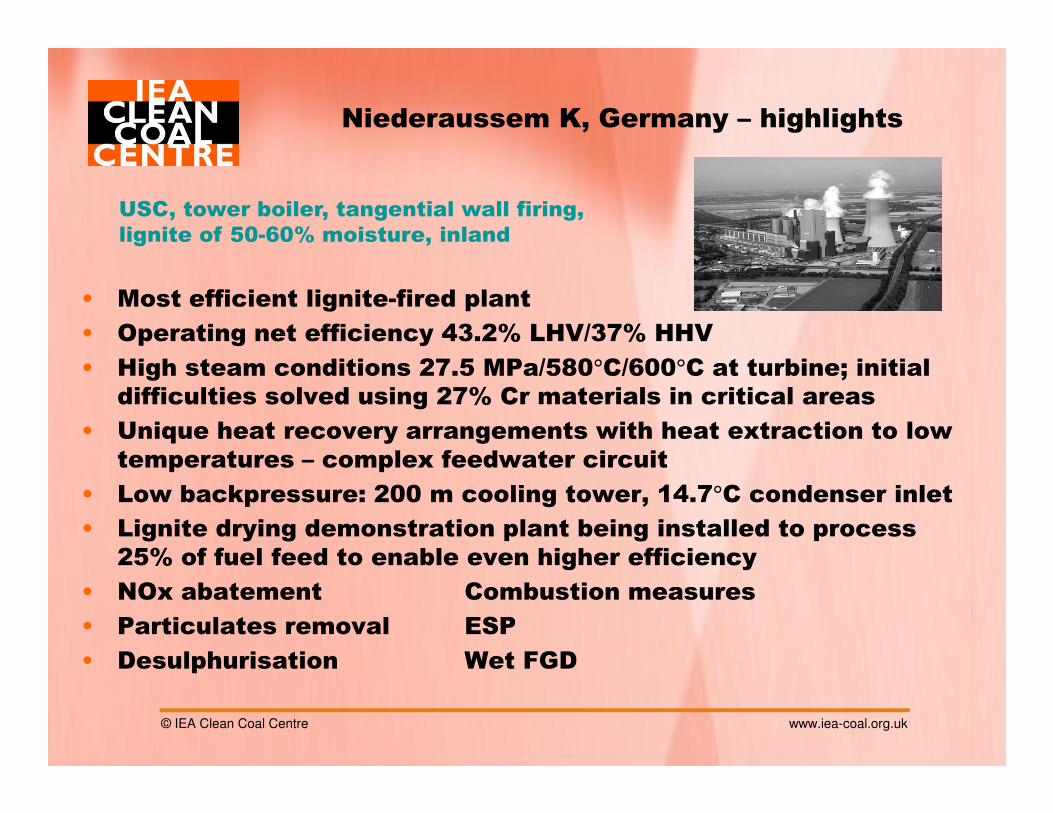
Niederaussem K, Germany – highlights
• Most efficient lignite-fired plant
• Operating net efficiency 43.2% LHV/37% HHV
• High steam conditions 27.5 MPa/580°C/600°C at turbine; initial
difficulties solved using 27% Cr materials in critical areas
USC, tower boiler, tangential wall firing,
lignite of 50-60% moisture, inland
© IEA Clean Coal Centre www.iea-coal.org.uk
difficulties solved using 27% Cr materials in critical areas
• Unique heat recovery arrangements with heat extraction to low
temperatures – complex feedwater circuit
• Low backpressure: 200 m cooling tower, 14.7°C condenser inlet
• Lignite drying demonstration plant being installed to process
25% of fuel feed to enable even higher efficiency
• NOx abatement Combustion measures
• Particulates removal ESP
• Desulphurisation Wet FGD
Isogo New Unit 1, Japan – highlights
• Near zero conventional emissions (NOx 20 mg/m3, sulphur oxides 6
mg/m3, particulates 1 mg/m3, at 6% O2, dry); full waste utilisation
• Highest steam conditions: 25.0 MPa/600°C/610°C at turbine: ASME
USC, tower boiler, opposed wall firing, int
bitum and Japanese coals, warm sea water
© IEA Clean Coal Centre www.iea-coal.org.uk
• Highest steam conditions: 25.0 MPa/600°C/610°C at turbine: ASME
CC 2328 steels in S/H; P122 for main steam pipework
• Operating net efficiency >42% LHV/40.6% HHV
• Efficiency tempered slightly by 21°C CW, fewer FW heating stages
• Dry regenerable activated coke FGD (ReACT)
• NOx abatement Combustion measures and SCR
• Particulates removal ESP
• Isogo New Unit 2 will use ReACT specifically for multi-pollutant
control, including mercury
Torrevaldaliga Nord – highlights
• 3 units at 660MWe = 1980MWe station
• Very low conventional emissions (NOx <100 mg/m3, sulphur oxides
<100 mg/m3, particulates 15 mg/m3, at 6% O , dry); full waste
USC, boilers supplied by Babcock Hitachi ,
using bituminous coal
© IEA Clean Coal Centre www.iea-coal.org.uk
<100 mg/m3, particulates 15 mg/m3, at 6% O2, dry); full waste
utilisation
• Highest steam conditions: 604°C/612°C at turbine: 25 MPa
• Operating net efficiency >44.7% LHV
• Wet scrubber based limestone/gypsum FGD
• NOx abatement SCR
• Particulates removal Bag filters
• New sea port for coal delivery
• Solids handling all enclosed
E On 50% efficient plant
… 50 plus by using new materials
Location
Efficiency
Capacity
Wilhelmshaven
50 %
500 MWe
© IEA Clean Coal Centre www.iea-coal.org.uk
Investment
Start of operation
1 billion €
2014
Size of plant Search for location
2007
Material developmentRequest for proposal
2010
ConstructionStart of operation
2014
Coal use in China, India and South Africa
Subcrit PCC
SC/USC PCC
FBC IGCC
China X X X X
India X (X) X X
South X (X)
Power generation: •Shanghai, 900 MW SC units
•Fuyang Huaren, 660 MW SC units
© IEA Clean Coal Centre www.iea-coal.org.uk
South
Africa
X (X)
Sipat power plant, India
Lagisza Supercritical CFBC – new design
• The world’s first CFBC
unit with supercritical
steam conditions
• Largest CFBC; 460 MWe
• Start-up in 2009
© IEA Clean Coal Centre www.iea-coal.org.uk
• Start-up in 2009
• Emissions of SOx, NOx
and particulates lower
than required by latest
EU LCPD limits.
• Located to NE of
Katowice, Poland
Carbon Capture
© IEA Clean Coal Centre www.iea-coal.org.uk
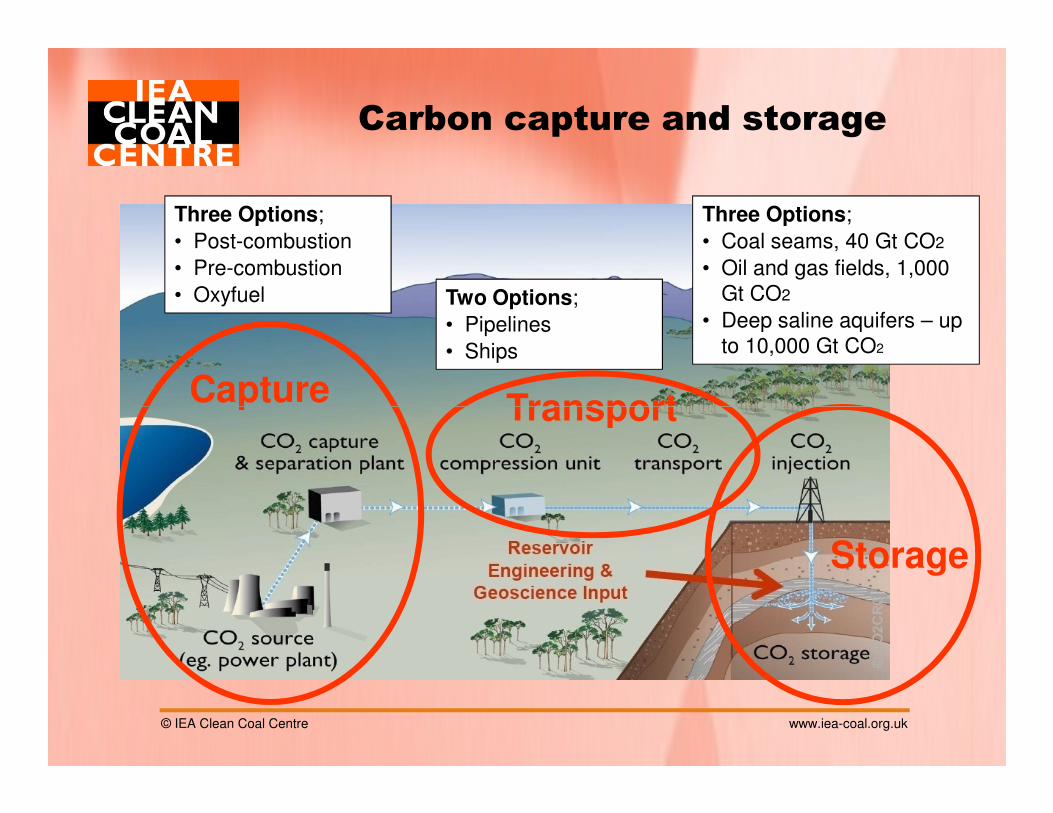
Carbon capture and storage
CaptureTransport
Three Options;
• Post-combustion
• Pre-combustion
• Oxyfuel Two Options;
• Pipelines
• Ships
Three Options;
• Coal seams, 40 Gt CO2
• Oil and gas fields, 1,000
Gt CO2
• Deep saline aquifers – up
to 10,000 Gt CO2
© IEA Clean Coal Centre www.iea-coal.org.uk
CaptureTransport
Storage
Vattenfall’s 30 MWth oxy fuel carbon capture
unit
Italian CCS activities – Oxy-fuel combustion –
CCS2, Brindisi
Pilot plant• Pressurised oxy-fuel technology
• Test programme (3 and 5 MWth
test facilities)
Demonstration plant
ENEL-Livorno
Demonstration plant
• Full scale combustor(48 MWth) combustion tests at
Brindisi
• Commercial operations 2011
• Data used for 35-70 MWe PCC-based
zero emissions oxy-coal power plant
(2012)
Courtesy ENEL
ITEA –Gioia del Colle
Brindisidemo
China’s 1st Post Combustion CO2 Capture Pilot Plant
The design parameters
are:
� Flue gas flow to unit
2000-3000 Nm3/h
� Steam consumption
© IEA Clean Coal Centre www.iea-coal.org.uk
� Steam consumption
3GJ/tonne CO2
� Solvent consumption <
1.35 kg/tonne CO2
� Owners: Huaneng
� CSIRO assisted
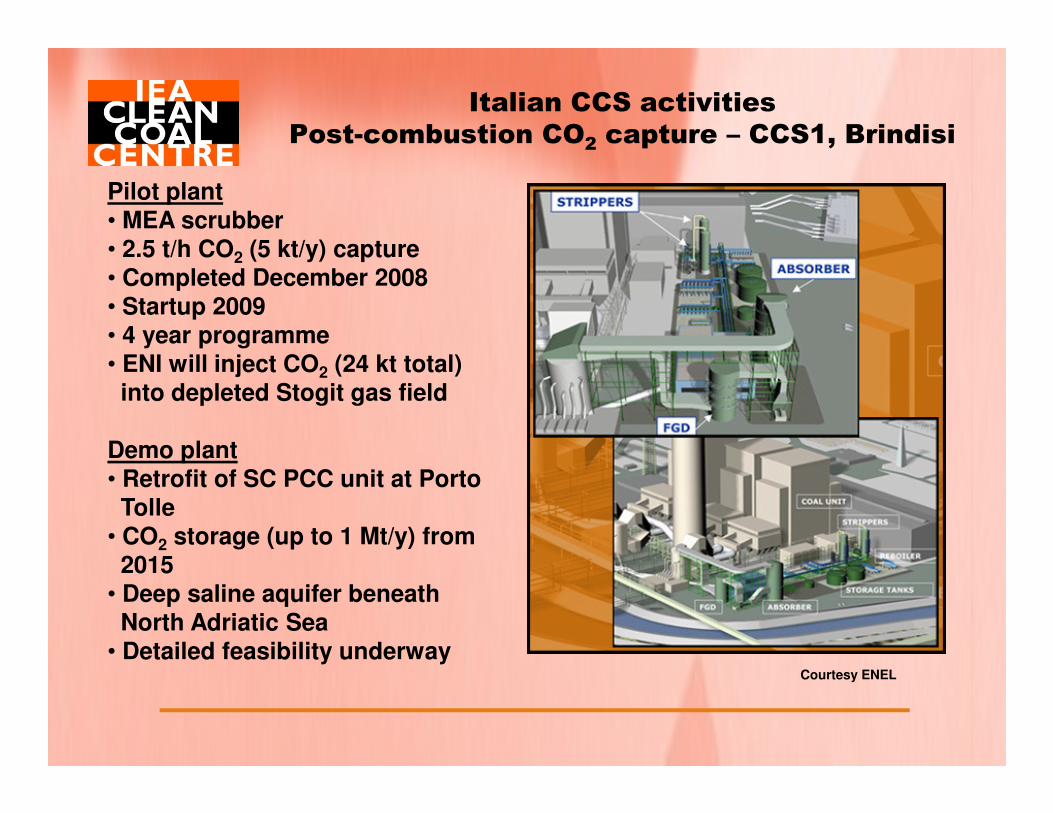
Italian CCS activities
Post-combustion CO2 capture – CCS1, Brindisi
Pilot plant• MEA scrubber
• 2.5 t/h CO2 (5 kt/y) capture• Completed December 2008
• Startup 2009• 4 year programme
• ENI will inject CO2 (24 kt total)
into depleted Stogit gas field
Demo plant
• Retrofit of SC PCC unit at Porto
Tolle• CO2 storage (up to 1 Mt/y) from
2015
• Deep saline aquifer beneath
North Adriatic Sea• Detailed feasibility underway
Courtesy ENEL
Development of IGCC by RWE Power
RWE Power will develop a zero-CO2 lignite-fired IGCC in
Germany
© IEA Clean Coal Centre www.iea-coal.org.uk
RWE Power will develop a zero-CO2 lignite-fired IGCC in
Germany
Plant will be commissioned with CO2 transport and storage
if market and regulatory conditions are appropriate
– Capacity: 450 MWgross, 360 MWnet
– Net efficiency (target): 40%
– CO2 storage: 2.6 million tonnes per year in depleted
Gas reservoir or saline aquifer
– Commissioning: 2014
Green Gen – The first Chinese IGCC
© IEA Clean Coal Centre www.iea-coal.org.uk
Near Tiajin, southeast of Beijing. The first phase of GreenGen is
expected on line in 2009, generating 250MWe, expanding to 650
megawatts in later phases.
THE END
Thank you for Listening
[email protected]
+44 20 8780 2111
© IEA Clean Coal Centre www.iea-coal.org.uk