36
Arch Coal, Inc. Coal’s Vital Role in America’s Energy Future Kim Link, Spokeswoman Arch Coal, Inc. July 24, 2009 William Jewel College, Liberty, Missouri

Arch Coal, Inc.
Coal’s Vital Role in America’s Energy FutureKim Link, SpokeswomanArch Coal, Inc.
July 24, 2009William Jewel College, Liberty, Missouri

Arch Coal, Inc.
2
P R O G R E S S I V E R E S P O N S I B L E V I T A L G R O W I N G
Arch Coal is a leader in the U.S. coal industry
Source: ACI
• One of the largest coal producers in the United States
• Supply roughly 12 percent of the U.S. coal supply
– Provide cleaner-burning, low-sulfur coal to domestic power producers to fuel 6 percent of the nation’s electricity
– Ship coal to domestic and international steel manufacturers as well as international power producers
• Talented workforce operates large, modern and efficient mines
• Industry leader in mine safety and environmental commitment

Arch Coal, Inc.
3
P R O G R E S S I V E R E S P O N S I B L E V I T A L G R O W I N G
Source: ACI assigned reserves at 12/31/08
12
234 5 21
34
Arch’s national scope of operations and reserve base includes presence in four major U.S. coal basins
Western Bituminous1. Arch of Wyoming2. Skyline3. Dugout4. Sufco5. West Elk
Powder River Basin1. Coal Creek2. Black Thunder
Illinois BasinKnight Hawk
Central Appalachia1. Mountain Laurel2. Coal-Mac3. Cumberland River4. Lone Mountain
1
Free surface coal mine tour offered to the public during the summer at Thunder Basin Coal Company’s Black Thunder mine near Wright, Wyoming. Fly into Rapid
City, South Dakota and incorporate sight seeing at Mt. Rushmore and Devil’s Tower. Call 307-464-2201 for details and reservations.

Arch Coal, Inc.
4
P R O G R E S S I V E R E S P O N S I B L E V I T A L G R O W I N G
What is coal?
Coal is a combustible rock formed from
the remains of trees, ferns and other
plants that existed and died during the
time of the dinosaurs
Source: ACI

Arch Coal, Inc.
5
P R O G R E S S I V E R E S P O N S I B L E V I T A L G R O W I N G
Where is coal found?
Source: EPRI

Arch Coal, Inc.
6
P R O G R E S S I V E R E S P O N S I B L E V I T A L G R O W I N G
What is coal used for?
Coal (85%)
Source: EIA, Annual Energy Review 2008 Projected
2008 U.S. Coal Consumption: 1.1 billion tons
Electric generation (94%)
Industrial, Residential& Commercial (5%)
Metallurgical (2%)

Arch Coal, Inc.
7
P R O G R E S S I V E R E S P O N S I B L E V I T A L G R O W I N G
Coal is the dominant fuel source for U.S. electric generation
Coal (85%)
Source: EIA Flash Report
2008 Net Electricity Generation by Source(per billion KwH)
Coal (48%)
Nuclear (20%)
Natural gas (21%)
Hydro (6%)
Other Renewables (4%)
Oil (1%)

Arch Coal, Inc.
8
P R O G R E S S I V E R E S P O N S I B L E V I T A L G R O W I N G
Missouri gets nearly 82% of its electricity from coal
Coal (85%)
Source: EIA State Electricity Profiles
2008 Net Electricity Generation in Missouri(per billion KwH)
Coal (82.4%) Nuclear (10.3%)
Natural gas (5.5%)
Hydro (1.3%)
Crude Oil / Other (.5%)
Arch Coal, Inc.
9
P R O G R E S S I V E R E S P O N S I B L E V I T A L G R O W I N G
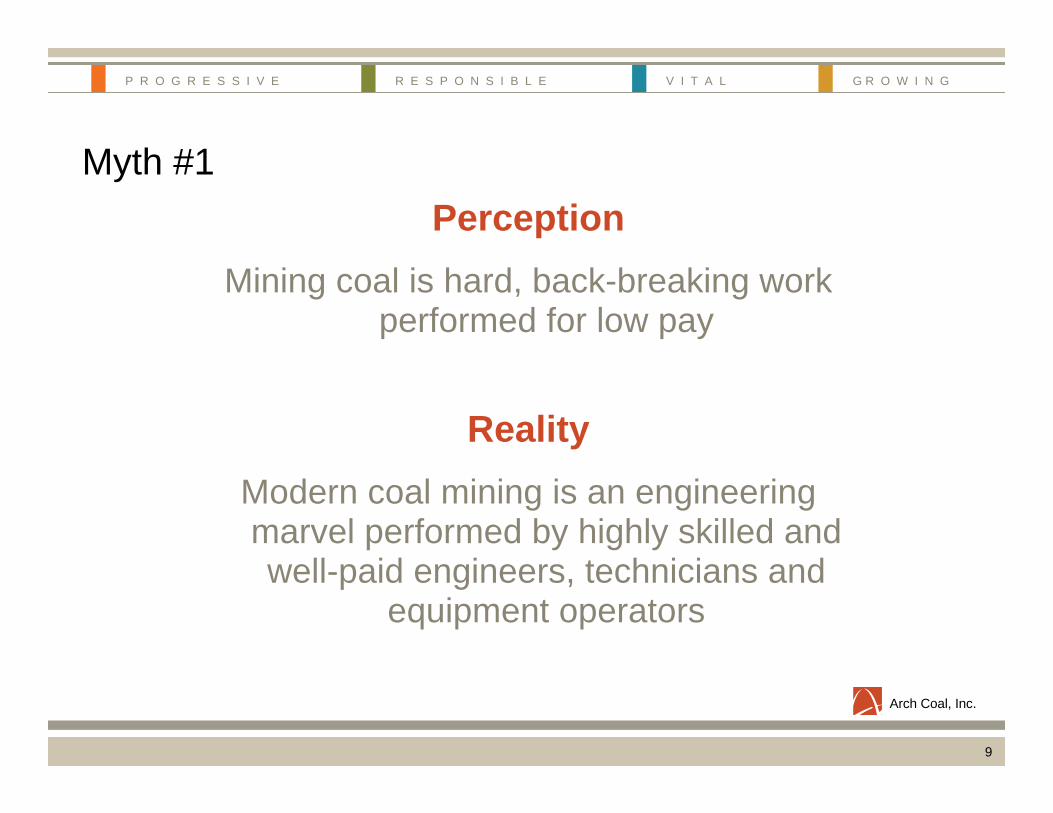
Myth #1Perception
Mining coal is hard, back-breaking work performed for low pay
RealityModern coal mining is an engineering marvel performed by highly skilled and well-paid engineers, technicians and
equipment operators

Arch Coal, Inc.
10
P R O G R E S S I V E R E S P O N S I B L E V I T A L G R O W I N G
Today’s coal mine is highly mechanized and computerized
• Workers are generally equipment operators, mechanics, electricians, engineers
• New generation of miners comfortable with joysticks and computers
• Among the most regulated industries in the nation
Source: ACI

Arch Coal, Inc.
11
P R O G R E S S I V E R E S P O N S I B L E V I T A L G R O W I N G
Anatomy of a longwall operation
Copyright Arch Coal, Inc. 2007

Arch Coal, Inc.
12
P R O G R E S S I V E R E S P O N S I B L E V I T A L G R O W I N G
A longwall is the most efficient method for extracting coal underground
Source: ACI

Arch Coal, Inc.
13
P R O G R E S S I V E R E S P O N S I B L E V I T A L G R O W I N G
Anatomy of a dragline operation
Copyright Arch Coal, Inc. 2007

Arch Coal, Inc.
14
P R O G R E S S I V E R E S P O N S I B L E V I T A L G R O W I N G
The dragline is one of the world’s largest earth-moving machines
Source: ACI

Arch Coal, Inc.
15
P R O G R E S S I V E R E S P O N S I B L E V I T A L G R O W I N G
The dragline’s bucket can dig an Olympic-sized swimming pool in 25 minutes
Source: ACI

Arch Coal, Inc.
16
P R O G R E S S I V E R E S P O N S I B L E V I T A L G R O W I N G
After the soil and rock are removed, electric shovels move coal to haul trucks
Source: ACI
Arch Coal, Inc.
17
P R O G R E S S I V E R E S P O N S I B L E V I T A L G R O W I N G
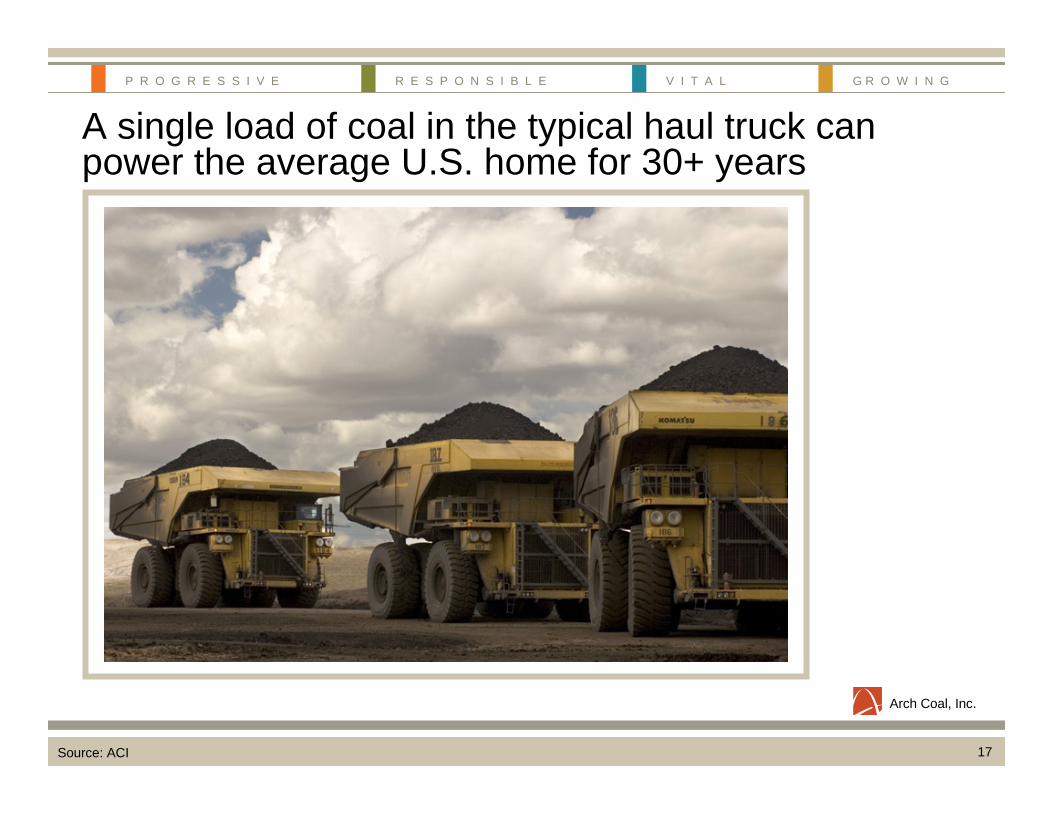
A single load of coal in the typical haul truck can power the average U.S. home for 30+ years
Source: ACI
Arch Coal, Inc.
18
P R O G R E S S I V E R E S P O N S I B L E V I T A L G R O W I N G
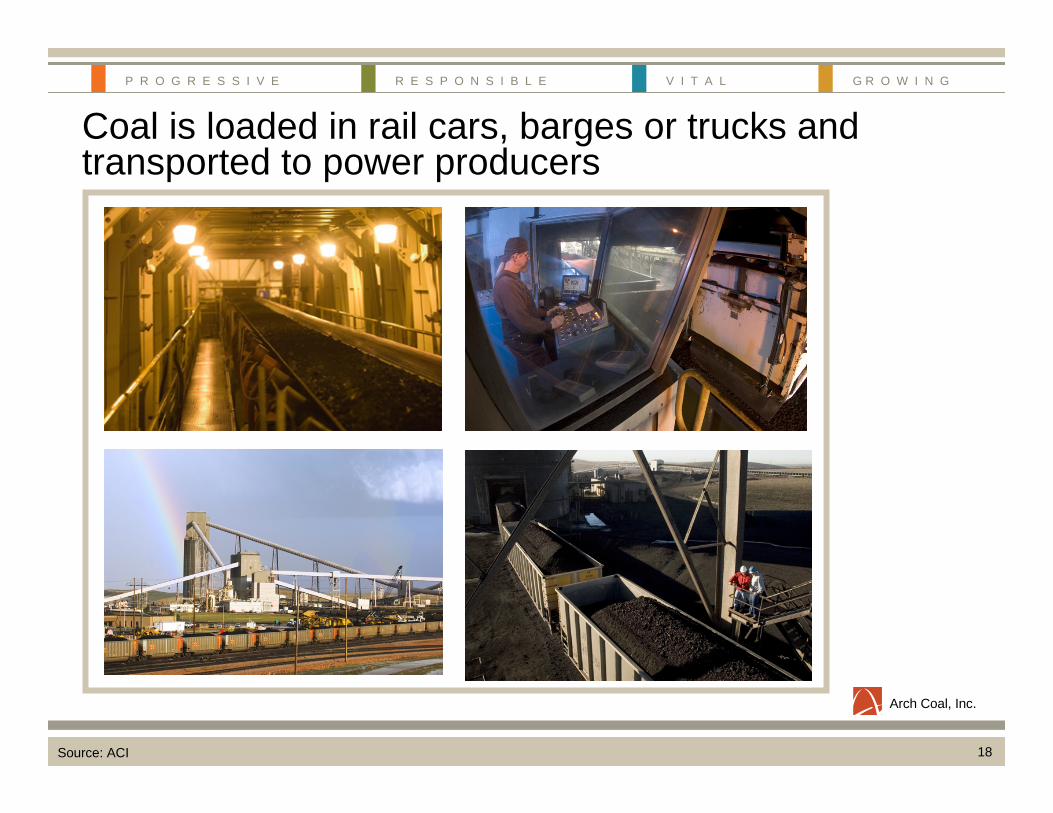
Coal is loaded in rail cars, barges or trucks and transported to power producers
Source: ACI

Arch Coal, Inc.
19
P R O G R E S S I V E R E S P O N S I B L E V I T A L G R O W I N G
Myth #2Perception
Mining is the most dangerous occupation in America
RealityIn terms of injuries, working in a coal mine is safer than working on a farm, in a factory or even at a retail outlet

Arch Coal, Inc.
20
P R O G R E S S I V E R E S P O N S I B L E V I T A L G R O W I N G
3.84.84.9
5.45.45.66.4
7.7
Hos
pita
ls
Tran
spor
tatio
n&
War
ehou
sing
Man
ufac
turin
g
Cons
truc
tion
Agric
ultu
re,
Fore
stry
&Fi
shin
g
Reta
il
Coal
Min
ing
U.S. Industry Injury & Illness Rates(per 100 employee-hours worked)
Public perception of unsafe work conditions contradicts today’s modern coal mining
Sources: NMA, MSHA, Department of Labor Statistics
U.S. Coal Mine Safety & Productivity Trends(1970-2007)
0
50
100
150
200
250
300
1970
1980
1990
2000
2002
2004
2006
2008
No.
of F
atal
ities
0
200
400
600
800
1000
1200
1400
Milli
on S
hort
Tons
Fatalities U.S. Production
The U.S. coal mining industry is safer than construction, forestry and fishing, manufacturing
Arch Coal, Inc.
21
P R O G R E S S I V E R E S P O N S I B L E V I T A L G R O W I N G
Myth #3Perception
Environmental issues outweigh any positive benefits for using coal
RealityThe increasingly clean use of coal has led
to dramatic improvements in the quality of America’s natural environment
Arch Coal, Inc.
22
P R O G R E S S I V E R E S P O N S I B L E V I T A L G R O W I N G
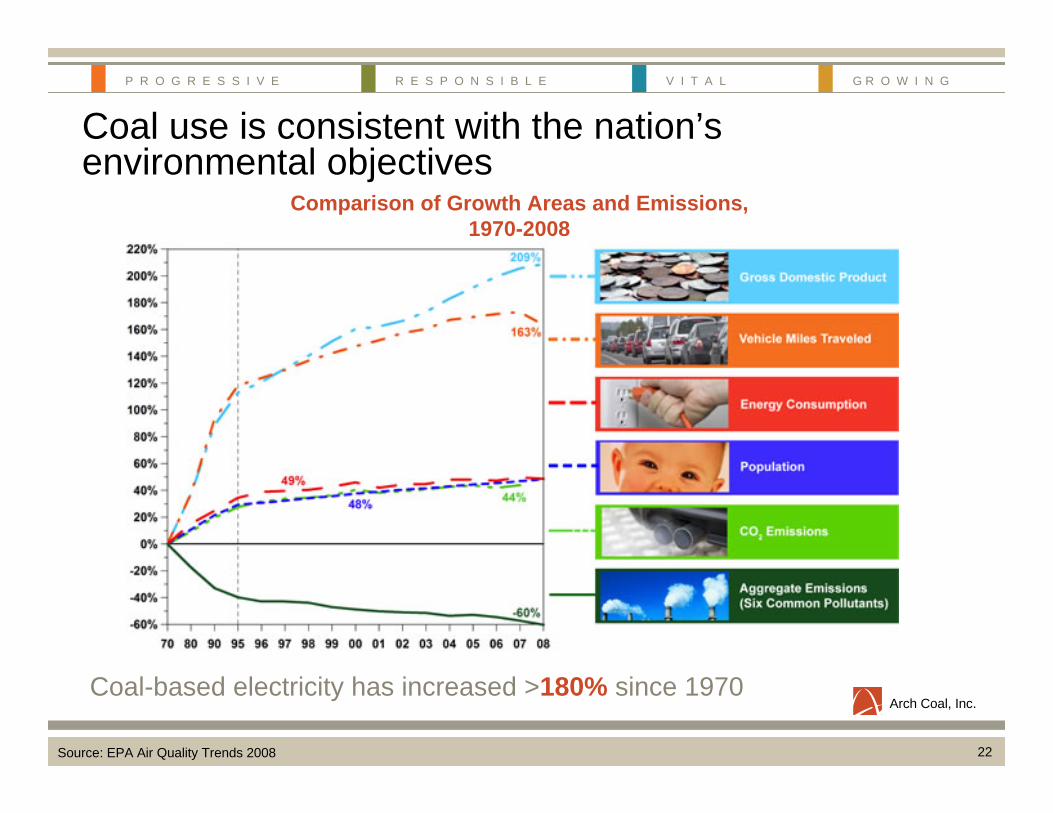
Coal use is consistent with the nation’s environmental objectives
Source: EPA Air Quality Trends 2008
Coal-based electricity has increased >180% since 1970
Comparison of Growth Areas and Emissions, 1970-2008
Arch Coal, Inc.
23
P R O G R E S S I V E R E S P O N S I B L E V I T A L G R O W I N G
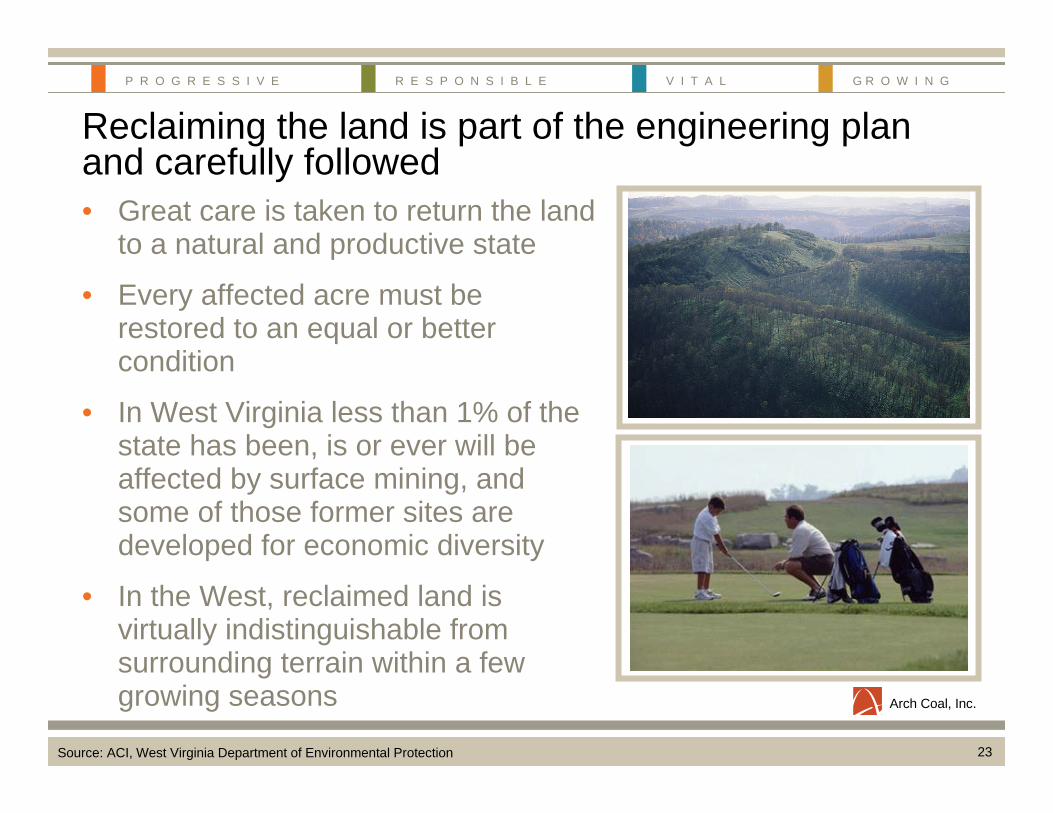
Reclaiming the land is part of the engineering plan and carefully followed• Great care is taken to return the land
to a natural and productive state
• Every affected acre must be restored to an equal or better condition
• In West Virginia less than 1% of the state has been, is or ever will be affected by surface mining, and some of those former sites are developed for economic diversity
• In the West, reclaimed land is virtually indistinguishable from surrounding terrain within a few growing seasons
Source: ACI, West Virginia Department of Environmental Protection

Arch Coal, Inc.
24
P R O G R E S S I V E R E S P O N S I B L E V I T A L G R O W I N G
Myth #4Perception
The United States must eliminate fossil fuel use to reduce global climate change
RealityThe developing world will continue to use
indigenous energy sources, the U.S. must provide technology leadership to
make an impact

Arch Coal, Inc.
25
P R O G R E S S I V E R E S P O N S I B L E V I T A L G R O W I N G
Economic growth around the world is putting pressure on energy markets
Source: EIA International Energy Outlook 2009, EIA International Energy Annual 2006 (published 12-08)
Electricity demand in developing nations will nearly triple the growth rate of the developed nations through 2030, as defined by membership in the Organization for Economic Cooperation and Development (OECD)
Electricity Consumption 1996-2006(percent change, billion kilowatt hours)
U.S. India
17.0%
60.1%
174.6%
China
Worldwide Electric Generation & Forecast(billion kilowatt hours)
04,0008,000
12,00016,00020,00024,00028,00032,00036,000
2008 2030
OECD Non-OECD

Arch Coal, Inc.
26
P R O G R E S S I V E R E S P O N S I B L E V I T A L G R O W I N G
Coal has been the world’s fastest-growing fuel source in the past seven years
Source: BP Statistical Review of World Energy 2009
Cumulative Percent Change in Global Energy Consumption2000 – 2008
(in million tonnes of oil equivalent)
41%
19%
25%
11%
6%
Coal
Hydro
Nat. Gas
Oil
Nuclear
• Since 2000, global coal use has grown by 41%, roughly double the consumption growth in natural gas
• Growth in coal demand will continue to be driven by consumption in the developing world, with gains in the developed world as well
• Fossil fuels are expected to remain dominant global energy sources through 2030

Arch Coal, Inc.
27
P R O G R E S S I V E R E S P O N S I B L E V I T A L G R O W I N G
Oil
Natural Gas
Coal
0
100
200
billions of tonnesof oil equivalent
Coal’s advantage: abundant, secure and widely dispersed
Source: ACI, Bank of America, BP Statistical Review 2009 and Blackwell Energy Research
Based on current production levels and proven reserves, coal should outlast both gas supplies and oil reserves by more than 3 times
North America
Central and South America
Europe
Middle East
Africa
Russia
India
China
Other Asia Pacific
Arch Coal, Inc.
28
P R O G R E S S I V E R E S P O N S I B L E V I T A L G R O W I N G
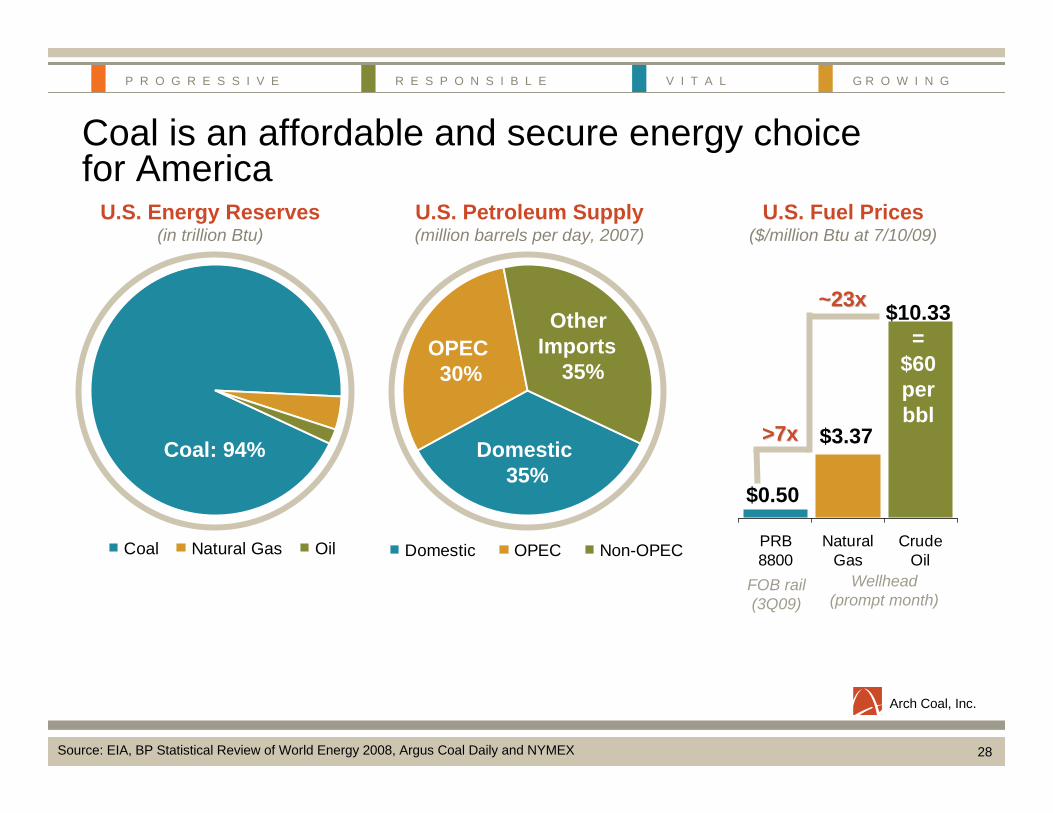
Coal is an affordable and secure energy choice for America
Coal Natural Gas Oil
Coal: 94%
U.S. Petroleum Supply(million barrels per day, 2007)
U.S. Energy Reserves(in trillion Btu)
Source: EIA, BP Statistical Review of World Energy 2008, Argus Coal Daily and NYMEX
Domestic OPEC Non-OPEC
OPEC 30%
Domestic 35%
OtherImports
35%
PRB8800
NaturalGas
CrudeOil
FOB rail (3Q09)
Wellhead (prompt month)
$10.33=
$60perbbl
>7x>7x
$0.50
$3.37
~23x~23x
U.S. Fuel Prices($/million Btu at 7/10/09)

Arch Coal, Inc.
29
P R O G R E S S I V E R E S P O N S I B L E V I T A L G R O W I N G
Where will the United States get its future power, if not from coal?
Source: EIA, ACI and Baker Hughes
• U.S. natural gas production is keeping pace with demand at current 20% market share levels – but the ability to expand share significantly is questionable.
• Since 2000, nuclear utilization has been at or close to 90% and the fleet is aging. At least 30 new units are needed by 2030 just to maintain current market share.
• Hydro power is concentrated in the Northwest. No net additions to capacity are anticipated.
• While renewables can play a growing role (beyond 3% currently), they face enormous hurdles before achieving baseload status.
– Even if the U.S. can meet an ambitious goal of 25% renewable energy by 2030, it still leaves 75% of our power requirements to other fuels.

Arch Coal, Inc.
30
P R O G R E S S I V E R E S P O N S I B L E V I T A L G R O W I N G
Coal can and will handle the lion’s share of new electricity demand in the U.S.
Source: EIA (2007 actual data; 2030 projected in AEO 2009)
Net Generation by Fuel Type (in billion kilowatt hours)
Coal
Nuclear
Hydro
Renewables
Natural Gas
Crude Oil
2,4142,022
908805
1012892
301248
730352
61 66
2030
2007
2030
2007
2030
20072030
2007
2030
2007
2030
2007

Arch Coal, Inc.
31
P R O G R E S S I V E R E S P O N S I B L E V I T A L G R O W I N G
Coal: 94%
Low-cost electricity enhances America’s standard of living and global competitiveness
Source: EIA Electric Power Annual, March 2009, EIA International Electricity Prices for Households
Power Costs(U.S. cents per kilowatt hour)
Ireland 24.4Germany 22.2 United Kingdom 21.9Japan 17.8France 15.8United States 10.6
NY 18.8CA 14.4TX 12.8 MO 9.1
There is a strong correlation between coal use and power prices.Electricity is a major input cost in most economic enterprises – esp. manufacturing.
30%
63% 91%8%
66%95%
65%
7%
73%
74%
22%1%
82%
52%
37%
77%
60%
48%
81%
48%
37%
66%
47%
26%
61%
95%85%
2%
14%
35% 51% 63%
41%
94%44%
53%
98%
61%63%
0%
% = % of total generation from coal Note: Hydro states rank in top 10 states
for low electricity prices
Lower 48 states plus DC
Least expensive
Most expensive
Hydro#1
CT: #49
Arch Coal, Inc.
32
P R O G R E S S I V E R E S P O N S I B L E V I T A L G R O W I N G
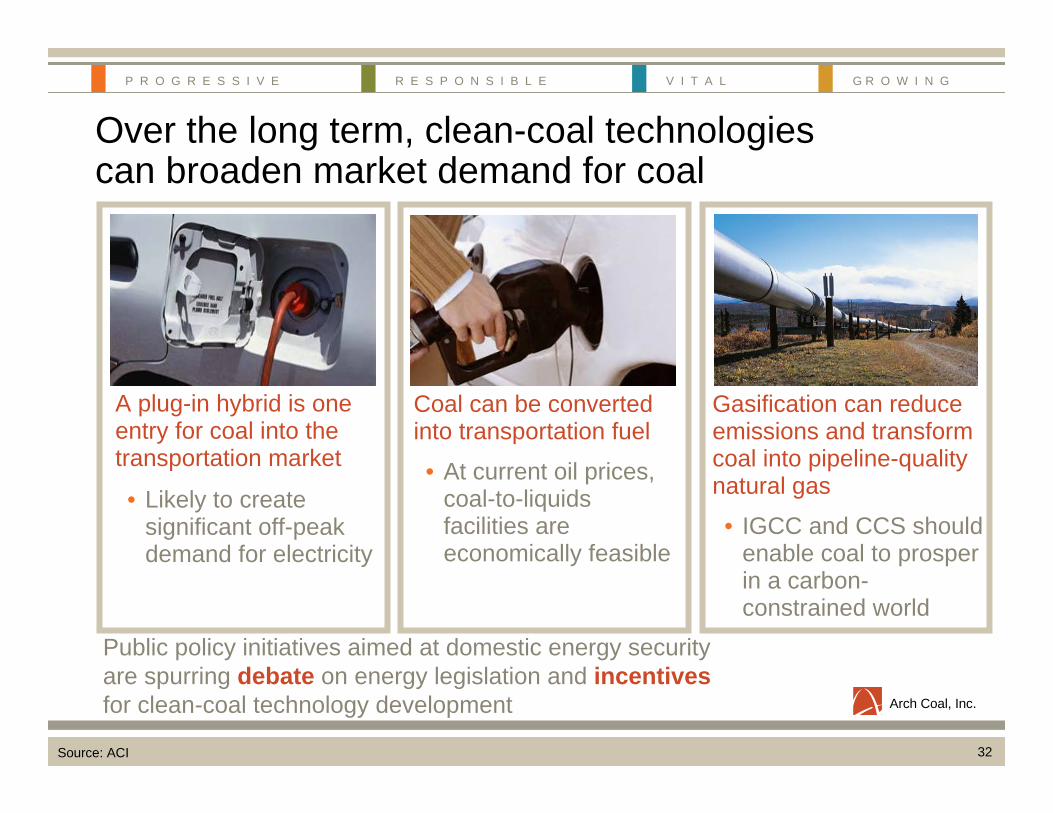
Coal can be converted into transportation fuel
• At current oil prices, coal-to-liquids facilities are economically feasible
A plug-in hybrid is one entry for coal into the transportation market
• Likely to create significant off-peak demand for electricity
Gasification can reduce emissions and transform coal into pipeline-quality natural gas
• IGCC and CCS should enable coal to prosper in a carbon-constrained world
Public policy initiatives aimed at domestic energy security are spurring debate on energy legislation and incentivesfor clean-coal technology development
Over the long term, clean-coal technologies can broaden market demand for coal
Source: ACI
Arch Coal, Inc.
33
P R O G R E S S I V E R E S P O N S I B L E V I T A L G R O W I N G
Coal can play a significant role in meeting America’s future energy needs• Nearly half of electric generation and growing• Coal conversion technologies will help satisfy
America’s oil addiction and provide greater U.S. energy independence
• Coal has an economic advantage versus competing fuels, and it has been proven more reliable
• Technology is enabling increasingly clean and carbon-friendly uses of coal
• America has well-developed and reliable infrastructure in place to produce and transport coal—expansion is possible albeit with significant levels of investment
Source: ACI

Arch Coal, Inc.
34
P R O G R E S S I V E R E S P O N S I B L E V I T A L G R O W I N G
This presentation and other teaching materials and links are available online
www.archcoal.com/community/justforteachers.aspx
Source: ACI

Arch Coal, Inc.
35
P R O G R E S S I V E R E S P O N S I B L E V I T A L G R O W I N G
www.teachcoal.org is an excellent resource
Source: American Coal Foundation

Arch Coal, Inc.
36
P R O G R E S S I V E R E S P O N S I B L E V I T A L G R O W I N G
And a site for your students… kcplkids.com


