ORIGINAL PAPER Coastal hazard mapping in the Cuddalore region, South India S. Saxena • R. Purvaja • G. Mary Divya Suganya • R. Ramesh Received: 9 December 2011 / Accepted: 16 August 2012 Ó Springer Science+Business Media B.V. 2012 Abstract It is estimated that nearly one-third of India’s population lives on the coast and is dependent on its resources. Shoreline erosion, storm surges and extreme events have resulted in severe loss of human life, damage to ecosystems and to property along the coast of India. Studies carried out in the Cuddalore region of South India reveal that this low- lying coastal zone, which suffered significant erosion during the last century, has been severely affected by the tsunami of 2004, storm floods and cyclones. In response to these impacts, a variety of coastal defense measures and adaptation strategies have been implemented in the region, although with only limited success. In order to inform future coastal planning in this region, the work reported here identifies a composite hazard line, seaward of which coastal flooding events will have a return interval of less than 1 in 100 years. The area landward of the coastal hazard line will be unaffected by 100 years of coastal erosion at present day rates. The study directly supports the Integrated Coastal Zone Management (ICZM) Plan of the Tamil Nadu State through the identification and assessment of coastal hazards and the overall vulnerability to coastal flooding and erosion. The key results from this pilot study will be used directly by the State of Tamil Nadu in the protection of the coastal livelihoods, better conservation measures and sustainable devel- opment along the coast. This study is a step toward mapping the hazard line for the entire coast of India that helps protect human lives and property. Keywords Coastal erosion Flood hazard Vulnerability Event return interval Composite hazard line 1 Introduction More than three hundred million people, or nearly 26 % of the total population, live in the coastal zone of India. As the population increases, more and more people are exposed to natural coastal hazards such as storm surges, tsunamis and shoreline erosion. Considerable S. Saxena R. Purvaja G. Mary Divya Suganya R. Ramesh (&) Institute for Ocean Management, Anna University, Chennai 600 025, India e-mail: [email protected]123 Nat Hazards DOI 10.1007/s11069-012-0362-7
Transcript
ORI GIN AL PA PER
Coastal hazard mapping in the Cuddalore region,South India
S. Saxena • R. Purvaja • G. Mary Divya Suganya • R. Ramesh
Received: 9 December 2011 / Accepted: 16 August 2012� Springer Science+Business Media B.V. 2012
Abstract It is estimated that nearly one-third of India’s population lives on the coast and
is dependent on its resources. Shoreline erosion, storm surges and extreme events have
resulted in severe loss of human life, damage to ecosystems and to property along the coast
of India. Studies carried out in the Cuddalore region of South India reveal that this low-
lying coastal zone, which suffered significant erosion during the last century, has been
severely affected by the tsunami of 2004, storm floods and cyclones. In response to these
impacts, a variety of coastal defense measures and adaptation strategies have been
implemented in the region, although with only limited success. In order to inform future
coastal planning in this region, the work reported here identifies a composite hazard line,
seaward of which coastal flooding events will have a return interval of less than 1 in
100 years. The area landward of the coastal hazard line will be unaffected by 100 years of
coastal erosion at present day rates. The study directly supports the Integrated Coastal Zone
Management (ICZM) Plan of the Tamil Nadu State through the identification and
assessment of coastal hazards and the overall vulnerability to coastal flooding and erosion.
The key results from this pilot study will be used directly by the State of Tamil Nadu in the
protection of the coastal livelihoods, better conservation measures and sustainable devel-
opment along the coast. This study is a step toward mapping the hazard line for the entire
coast of India that helps protect human lives and property.
More than three hundred million people, or nearly 26 % of the total population, live in the
coastal zone of India. As the population increases, more and more people are exposed to
natural coastal hazards such as storm surges, tsunamis and shoreline erosion. Considerable
S. Saxena � R. Purvaja � G. Mary Divya Suganya � R. Ramesh (&)Institute for Ocean Management, Anna University, Chennai 600 025, Indiae-mail: [email protected]
123
Nat HazardsDOI 10.1007/s11069-012-0362-7
variation occurs in the frequency, magnitude and seasonality of these events. While the
west coast of India is affected by the seasonal tropical cyclones during the southwest
monsoon (June–September), the east coast is affected by the northeast monsoon (October–
December) and is highly vulnerable to storm surge events. From 1,737 onward, there have
been 23 major surge events in the Bay of Bengal, accounting for [10,000 human lives lost
during each event (Murthy et al. 2006).
Studies of individual hazards such as storms, cyclones, tsunamis, sea-level change and
shoreline change have been carried out by several researchers in the North Indian Ocean,
Arabian Sea and the Bay of Bengal (Dube et al. 2006; Indu Jain et al. 2006; Unnikrishnan
and Shankar 2007; Kumar et al. 2008 and Rao et al. 2009). Annual maximum water levels
observed at Chennai tide gauge station were obtained from the Survey of India for a period
of 23 years from 1987 to 2010, which indicate that the sea level along the Indian coast has
been rising at the rate of about 1.3 mm year-1 on average (INCCA 2010). Nicholls and
Leatherman (1995) estimate (assuming no adaptation and the population in 1990) that a
1-m rise in sea level could displace nearly 7 million people from their homes in India.
Flood hazard mapping identifies coastal areas that are at risk of flooding under extreme
conditions, with the key objective to reduce the impact of coastal flooding. Erosion
mapping helps identify areas that are prone to high erosion risks along the coastline
(Linham and Nicholls 2010). Hazard mapping involves the identification of shorelines that
are potentially susceptible to the impacts of storm surge, a rise in sea level and erosion.
Future sea-level rise due to climate change seems likely to involve an increase in the
frequency of storm surge flood events and the accelerated erosion of shorelines, and this
must be seen as a central component of any hazard mapping. The probability of a flood of a
given magnitude occurring can be expressed as:
• a return interval (i.e., highest flood expected in 100 years)
• a probability (e.g., 0.01)
• a percentage (i.e., a 1 % chance in any given year)
Although in theory all hazard return intervals can be mapped, in practice, it may be best
to select one type of event that represents the limit of risk for coastal communities. The line
proposed in this study is that of the 100-year event return interval. The main purpose of
choosing a 1-in-100-year event return interval is due to:
• Design life of coastal infrastructure including houses, buildings and power plants
• Limit to sea-level rise predictions and
• International standards recommend 1-in-100-year event return interval
The composite hazard line is the most landward of the following
(a) 1-in-100-year flood inundation line which includes the predicted surge level, regional
(local) sea-level variation and global (eustatic) sea-level rise due to climate change
(IPCC 2007);
(b) a line demarcating estimated shoreline displacement (accretion or erosion) after a
100-year period.
Such hazard mapping can provide an initial or precautionary guide for coastal planning
and management responses to rise in sea level and can, in turn, form the basis for vul-
nerability mapping, which identifies the impact of hazards on coastal communities. Several
case studies have developed methods for hazard mapping (Nicholls et al. 2007; Healy and
Dean 2000; Sindhu and Unnikrishnan 2012).
Nat Hazards
123
Along the coast of Tamil Nadu, India, the Nagapattinam–Cuddalore region experienced
the worst impacts of the tsunami surge and inundation caused by the Great Sumatra
Earthquake of 26 December 2004 (Mw 9.3). Surge heights along this coastal region were
of the order of 2–5 m, with inundation distances of many hundreds of meters into the
hinterland. In the Cuddalore District, maximum run-up during the December 2004 tsunami
ranged from 2.5 to 3.3 m with inundation distances between 330 and 1,680 m (Subra-
manian 2006). Subsequently, Cyclone Nisha in 2008 and Cyclone Thane in December
2011 created surge heights between 1 and 1.5 m. In view of the vulnerability of the
Cuddalore coastal area to coastal hazards, this study sets out to examine the magnitude and
frequency of flood events caused by cyclones, storm surges and tsunamis by extrapolating
the existing frequencies. It also provides existing erosion rates along this stretch of
coastline and extrapolates these into the future. The principal aim of the study is to
combine these two estimates of future hazard in order to delineate a ‘‘Composite Hazard
Line’’ (flood hazard mapping ? erosion mapping) for the coast of Cuddalore District,
Tamil Nadu.
Composite hazard line mapping is a key component in appropriate land use planning in
flood-prone areas (Linham and Nicholls 2010). Since 1991, coastal planning and decision
making in India have been carried out using the Coastal Regulation Zone (CRZ) Notifi-
cation under the Environment (Protection) Act 1986 issued by the Ministry of Environment
and Forests, Government of India. The notification, first issued in 1991, defined the CRZ as
the area between the High Tide Line (HTL) and 500 m on the landward side and the inter
tidal region [between the Low Tide Line (LTL) and the HTL]. Activities in this zone were
restricted, some prohibited and some permitted, based on an arbitrary distance.
The CRZ 1991 Notification was modified and reissued in 2011 with the aim of pro-
tecting life and assets of coastal communities, conservation and protection of inter-gen-
erational resources and enhanced livelihood security of coastal communities (Ramesh et al.
2010). As an important component of the CRZ 2011, mapping of ‘‘composite hazard line’’
is being undertaken to delineate the boundaries of the coastal zone in mainland India.
Delineation of the composite hazard line is now established based on historic erosion rates
or extreme water levels rather than adopting arbitrary distances which do not truly rep-
resent the threat from erosion or coastal flooding. As a pilot study, a composite hazard line
map along with current land use pattern has been prepared for a short coastal stretch of the
Cuddalore District, based on flooding and erosion lines, for the first time in India.
2 Study area
Cuddalore (11�4404500N and 79�4505600E) is a large industrial town in the State of Tamil
Nadu, South India, which has experienced rapid rates of coastal development. The coastal
stretch of Cuddalore extends from Gadilam estuary in the north to Pichavaram mangroves
in the south, a total length of 42 km (Fig. 1) along the Bay of Bengal. The Bay of Bengal
experiences severe tropical cyclones in northeast monsoon (October through December),
and nearly 60 cyclonic surges and severe cyclonic surges in past century (IMDeAtlas 2011)
have been reported.
The storm surges are well known for their destructive potential and impact on human
activities due to associated strong winds along the coast and heavy rainfall. An added risk
factor is that large parts of the coastal zone are low lying and with a gentle slope, resulting
in large inundation, and therefore increased vulnerability of the region. Coastal regions that
have a gentle topography are more vulnerable than those with a steep topography. The east
Nat Hazards
123
coast of India is more vulnerable than the west coast, because the former is low-lying and
more prone to the occurrence of cyclones than the latter.
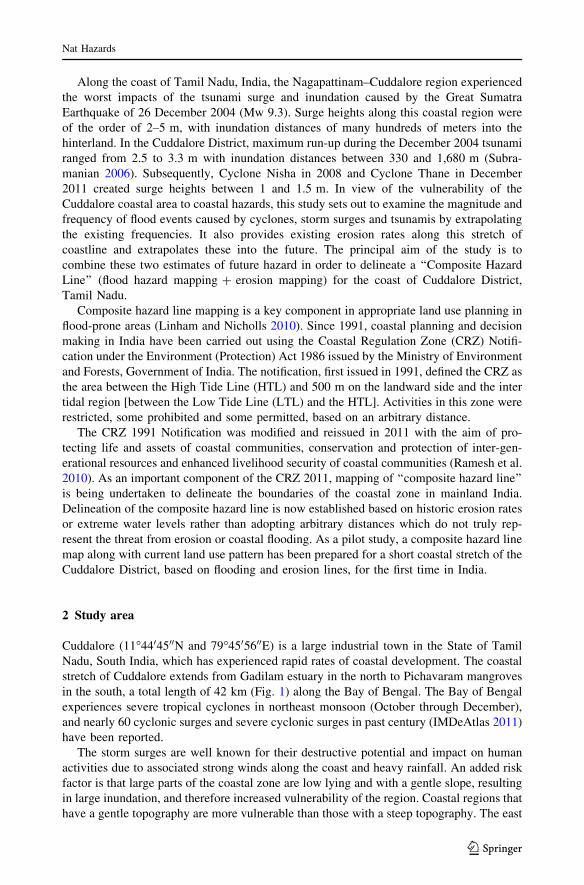
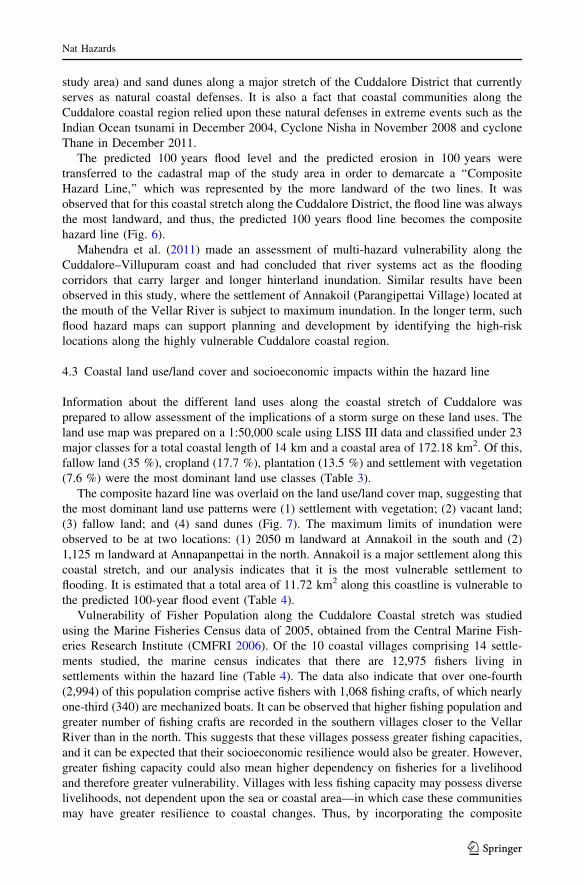
Shoreline change assessment was made for the entire Cuddalore District (marked as ‘‘a’’
in Fig. 1), while a pilot study for hazard line mapping has been carried out for a shorter
Fig. 1 Map of Cuddalore District and the study area for composite hazard mapping, Tamil Nadu, India
Nat Hazards
123
stretch of 14 km within the district (marked as ‘‘b’’ in Fig. 1). The geomorphology of the
Cuddalore coastal stretch includes the coastal plain with an average width of 6 km. Its
coastal landforms include strandlines, raised beaches, sand dunes, mangrove swamps and
tidal flats with predominantly sandy beaches on the northern side and mangrove swamps to
the south. The coastal towns of Cuddalore in the North and Porto Novo (Parangipettai) in
the South are the most densely populated along this region. Unlike the west coast of India,
the wettest period of the year is during the northeast monsoon. An analysis of the annual
cyclones and severe cyclonic storms in the Bay of Bengal region clearly indicates that
although the frequency of cyclones has decreased after 1980, there has been a marginal
increase in the occurrence of severe cyclonic storms, which in turn implies an increase in
storm magnitude (Dube et al. 1997). An added risk factor is that large parts of this coastal
zone are low lying with a gentle slope, resulting in wide inundation areas, thus increasing
the vulnerability of the region (Murthy et al. 2006).
3 Methodology
Two key factors are used to delineate the composite hazard line: (1) lateral shoreline
movement to deal with erosion and (2) topographic elevation to deal with flooding. Fol-
lowing this, the study methodology is described under three major headings: (1) erosion
mapping; (2) coastal flood hazard mapping; and (3) land use/land cover analysis and
socioeconomic impacts.
3.1 Erosion mapping
Shoreline change is the horizontal movement of a specific shoreline; however, the precise
definition of a shoreline is always a problem. Depending on the location and data source,
different proxies for shoreline position are used to document shoreline change, including
the high water line, wet-dry line, vegetation line, dune toe or crest, toe or berm of the
beach, cliff base or top and the instantaneous water line as extracted from satellite imagery
(Thieler et al. 2009). In order to verify the accuracy of the demarcated shorelines, various
control points were selected at severely eroding sites, as visually observed from satellite
images. A total of eight different data sources in addition to the Survey of India topo-
graphical map were used to obtain historical shorelines in this study and are listed in
Table 1. Ground control points (GCPs) were selected based on their stability through time
and their proximity to the shoreline (Thieler et al. 2009). Differential Global Positioning
System (DGPS) coordinates were recorded during field survey for these sites to corroborate
with the GCPs. The DGPS coordinates were later compared with the shorelines created in
GIS.
Several methods are proposed in the literature to estimate the rate of shoreline change.
These include the End Point Rate (EPR) by Fenster et al. (1993), and the Average of Rates
(AOR), Linear Regression Rate (LRR) and Jackknife (JK) by Dolan et al. (1991). Each
method has its own advantages and limitations, depending upon various factors such as
accuracy in shoreline measurement, temporal variability, number of shoreline positions
and total time span of shoreline data acquisition. The LRR method for calculating the rate
of shoreline change was adopted for this study, since it minimizes the potential errors and
short-term variability through the use of a statistical approach (Douglas and Crowell 2000).
The Digital Shoreline Analysis System (DSAS) as defined by the USGS (2005) and
Himmelstoss (2009) was used to determine the rate of change for the shoreline of the
Nat Hazards
123
Cuddalore region. This method computes rate-of-change statistics from multiple historic
shoreline positions inherent in a GIS environment. The created layers of multi-date
shorelines [1972, 1977, 1991, 1999, 2001, 2005, 2006, 2009 and 2011] were used as an
input for the DSAS model to calculate the rate of change since 1972 for a period of
39 years. Baselines were created at *1 km landward of the 1972 shoreline but did not
include the smaller creeks and areas such as river mouths and spits. For the Cuddalore
coastal region, this method represented about 42 km of shoreline along 141 transects. The
DSAS-generated transects, perpendicular to the baseline, were 300 m apart. With reference
to the baseline, seaward shift of the shoreline along transect was considered as positive
(accretion), while landward shift was considered as negative (erosion). The rate of
shoreline variations was calculated using LRR method in the ARCGIS environment to
identify erosion and accretion areas along the coasts of the study area, similar to the studies
carried out by Himmelstoss (2009).
A minimum of 4 shoreline years at each DSAS transect was used for the calculation of
rates of shoreline change. Rates were not calculated at (1) river mouths/creek openings, (2)
ports and harbors and (3) other coastal structures (seawalls/ripraps). Eight different classes
for shoreline change have been considered, based on the intensity of erosion/accretion
(Table 2). Erosion control works (such as seawalls and groynes) have been undertaken to
protect the highly eroding coastal stretches of India, and in order to differentiate already
protected coasts from critical areas of high erosion, such coastal structures have been
classified as ‘‘Artificial Coasts’’. These artificial coasts were highly eroding but are cur-
rently protected and managed.
3.2 Flood hazard mapping
Flood hazard mapping helps identify coastal areas that are at risk of flooding under extreme
conditions. Hazard mapping defines the potential for harm using event return intervals
(Pethick 2009). The return interval for each flood event was computed from past events.
Prediction into the future was made through extrapolation, using statistical distributions
(i.e., the 100 years flood height from data collected over the past 20 years from Chennai
Port tide gauge data). These data were transferred from the Chart Datum (CD) to Topo-
graphic Map Datum (OD). In order to determine which areas are at risk of flooding, coastal
topographic survey was undertaken along the Cuddalore coast (marked ‘‘b’’ in Fig. 1)
using a Total Station (LeicaTc405), with reference to the Survey of India Benchmark
located at the Cuddalore Port. About 5,500 control points were obtained from the Low Tide
Table 1 Data sources consultedand used for analysis of shorelinechange
Sensor Spatialresolution (m)
Years
LANDSAT—I 57 27 Jan 1977
LANDSAT TM 30 29 Jan 1991
LANDSAT TM 30 11 Nov 1999
IRS LISS III 23.5 8 Feb 2001
EO-1, advance land imager 10 16 Mar 2005
LANDSAT TM 30 7 Feb 2006
EO-1, advance land imager 30 14 Feb 2009
CARTOSAT-II 2.5 Month 2011
Nat Hazards
123
Line (LTL) to the 5 m topographic contour elevation, that is, approximately 2 km from the
High Tide Line (HTL). The topographic survey helped to demarcate the extent of landward
movement of extreme water levels.
The water-level data were then ranked in ascending order, and the return intervals were
calculated using Gumbel Distribution. The return intervals were then plotted against the
maximum water-level elevation for each year by using the topographic datum in log x axis.
A trend line (log-linear) was drawn using the prediction equation to extrapolate to a
100-year event. To this, the impact of regional sea-level rise was added to determine the
100-year return interval. The flood and erosion lines for a given time interval were mapped
and a composite hazard line was drawn, based on the most landward of the two lines and
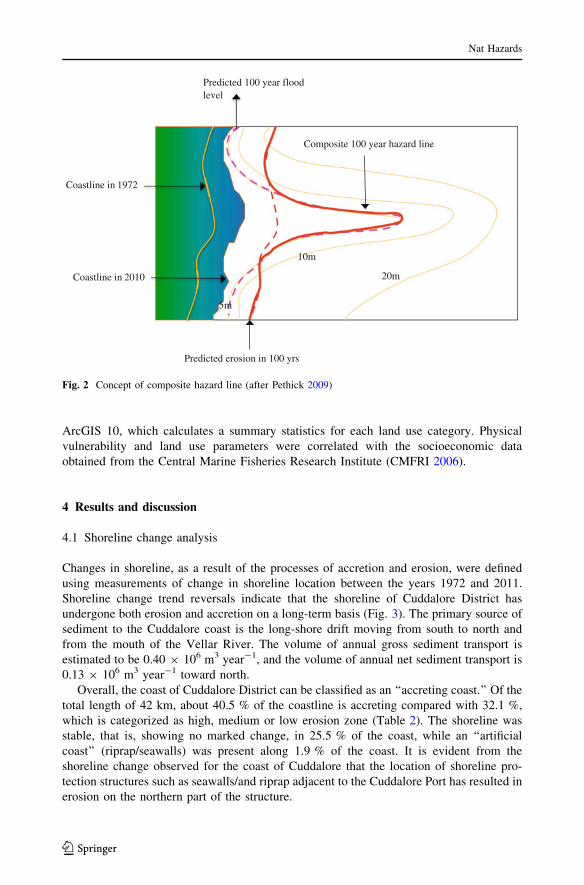
the composite hazard line represents a margin of safety. The concept of composite hazard
line mapping is shown in Fig. 2.
3.3 Land use/land cover analysis
Geometrically and radiometrically corrected satellite images using ERDAS IMAGINE
were utilized for identifying the land use and land cover from satellite images. Delineation
of land use/land cover mapping was carried out through on-screen interpretation of the
satellite imagery. LISS III (2011) false color composites of bands 3,2,1 were used with a
spatial resolution of 23.5 m. The spectral information contained in the original and
transformed bands was used to characterize each class pattern, and to discriminate between
classes. Various key interpretation elements such as size, shape, shadow, tone, color,
texture and pattern were identified for delineating different land use patterns. The National
Remote Sensing Centre classification scheme (NRSC 2010) was adopted for extracting the
information of land use/land cover classes from satellite imagery. Based on this classifi-
cation scheme, land use features were digitized in ArcGIS geodatabase, and 23 land use/
land cover features were classified from the satellite imagery up to level III. The quanti-
fication of land use/land cover statistics was made using geo-processing technique in
Table 2 Shoreline change sta-tistics for the coastal district ofCuddalore
Classification of coast Extent(km)
Percentof coast
High erosion zone (\-5 m year-1) 0.69 1.64
Medium erosion zone (-2 to -5 m year-1) 5.13 12.22
Low erosion zone (-0.5 to -2 m year-1) 7.65 18.23
Artificial coast (seawalls/riprap) 0.79 1.89
Stable coast (-0.5 to ? 0.5 m year-1) 10.72 25.54
High accretion zone ([5 m year-1) 1.68 4.00
Medium accretion zone (2–5 m year-1) 5.73 13.65
Low accretion zone (0.5–2 m year-1) 9.58 22.83
Total length of coastline 41.98 100.00
Number of ports and fishing harbors 1
Number of fish landing centers 5
Number of groynes/breakwaters 2
Number of jetties 3
Nat Hazards
123
ArcGIS 10, which calculates a summary statistics for each land use category. Physical
vulnerability and land use parameters were correlated with the socioeconomic data
obtained from the Central Marine Fisheries Research Institute (CMFRI 2006).
4 Results and discussion
4.1 Shoreline change analysis
Changes in shoreline, as a result of the processes of accretion and erosion, were defined
using measurements of change in shoreline location between the years 1972 and 2011.
Shoreline change trend reversals indicate that the shoreline of Cuddalore District has
undergone both erosion and accretion on a long-term basis (Fig. 3). The primary source of
sediment to the Cuddalore coast is the long-shore drift moving from south to north and
from the mouth of the Vellar River. The volume of annual gross sediment transport is
estimated to be 0.40 9 106 m3 year-1, and the volume of annual net sediment transport is
0.13 9 106 m3 year-1 toward north.
Overall, the coast of Cuddalore District can be classified as an ‘‘accreting coast.’’ Of the
total length of 42 km, about 40.5 % of the coastline is accreting compared with 32.1 %,
which is categorized as high, medium or low erosion zone (Table 2). The shoreline was
stable, that is, showing no marked change, in 25.5 % of the coast, while an ‘‘artificial
coast’’ (riprap/seawalls) was present along 1.9 % of the coast. It is evident from the
shoreline change observed for the coast of Cuddalore that the location of shoreline pro-
tection structures such as seawalls/and riprap adjacent to the Cuddalore Port has resulted in
erosion on the northern part of the structure.
20m
5m
10m
Coastline in 1972
Coastline in 2010
Predicted erosion in 100 yrs
level
Composite 100 year hazard line
Predicted 100 year flood
Fig. 2 Concept of composite hazard line (after Pethick 2009)
Nat Hazards
123
Rates of shoreline change are more uniform along the central part of the study site
between Vellar and the Uppanar rivers (Fig. 3). The average net rate of shoreline change
here was ?0.15 m year-1. It was observed that 1.6 % of this coastline was classified as
Fig. 3 Erosion mapping along the coast of Cuddalore District
Nat Hazards
123
‘‘highly eroding’’ (\-5 m year-1) and, in addition, the already highly eroded but pro-
tected coast (classified as artificial coast) was estimated to be 1.9 %, totaling 3.5 % of the
42-km-long coast (Table 2).
Medium erosion was observed south of Vellar River mouth at Pichavaram and between
Uppanar and Gadilam rivers in the north (Fig. 3): It appears that river mouth dynamics
determine the erosion/accretion pattern along this section of the coast. High rates of
erosion were observed along the shores of Pichavaram Mangrove Reserved Forest, prob-
ably due to reduced inflow from the Coleroon River, a major tributary of the Cauvery.
There are groynes lining the south and north of Uppanar river mouth leading to the Old
Cuddalore Port. Littoral drift is predominantly toward the north, and thus, sediment
accretion occurs on the southern side of the groyne with erosion on the northern side,
limiting long-shore sediment transport and reshaping the coastline over a period of time.
Linear Regression Rate (LRR) of shoreline change (Fig. 4) was calculated at each
transect (300 m) as the slope of the linear regression through all shoreline positions from
1972 onward to the most recent (2010). The single highest erosion rate measured for the
Cuddalore coast is -5.5 m year-1 near Chinnavaikal, located south of the Vellar River
(Fig. 4). The highest accretion rate of ?6.1 m year-1 was observed near Pudukuppam,
north of the Vellar River mouth. Field observations at the Vellar river mouth indicate the
presence of a conspicuous sand spit, extending from the south to north by shore-welding
processes, resulting in the formation of sand barriers across the river mouth. It is observed
that erosion is dominant along two coastal stretches of the Cuddalore District: (1) south of
Vellar River, extending up to the Pichavaram mangroves, and (2) north of Uppanar River,
Fig. 4 Linear regression rate (LRR m year-1) of erosion and accretion along the coast of CuddaloreDistrict for period from 1972 to 2010
Nat Hazards
123
extending up to Cuddalore Town. The region between Uppanar River in the North and
Vellar River in the South is either accreting or stable.
4.2 Flood hazard analysis and composite hazard line
The flood hazard mapping study was undertaken for a short stretch (14 km) along the
Cuddalore District (marked ‘‘b’’ in Fig. 1), in response to a recent increase in the level of
destruction caused by tsunami and cyclones in this region: (1) Tsunami (December 2004);
(2) Cyclone Nisha in November 2008 and (3) Cyclone Thane in December 2011.
Using the Gumbel distribution, the 1-in-100-year flood/surge level was estimated to be
2.98 m MSL (Fig. 5). To this, the annual MSL rise of Chennai (0.041 m), obtained from
the Survey of India (1952–2008), and the global sea-level rise (of 0.59 m) as given by the
IPCC (2007) were added to determine the 100-year return interval. Based on this, the 1-in-
100-year extreme flood level including local MSL and global sea-level rise was calculated
to be 3.611 m MSL for the Cuddalore coastal region as follows:
1. Extreme flood level calculated using the Gumbel Distribution: 2.98 m MSL
2. Annual MSL of Chennai: 0.041 m
3. Global (IPCC) sea-level rise: 0.59 m
i.e., 2.98 ? 0.041 ? 0.59 = 3.611 m MSL
SLR increases the probability of flooding in coastal zones, unless flood protection
measures can be upgraded (Linham and Nicholls 2010). From the flood frequency
probability curve (Fig. 5), it is evident that a 0.631-m rise in sea level along the Cuddalore
coast causes a sea level previously seen only once every 100 years on an average, to
occur approximately once every 21 years instead. Once the extreme water level for the
y = 0.4042ln(x) + 1.1606
0
0.5
1
1.5
2
2.5
3
3.5
4
1000100101
Ext
rem
e W
ater
Lev
el (
m a
bove
MSL
)
Return Interval (years)
Original Sea Level
With 0.631m SLR
Fig. 5 Flood frequency probability curve using Gumbel Distribution
Nat Hazards
123
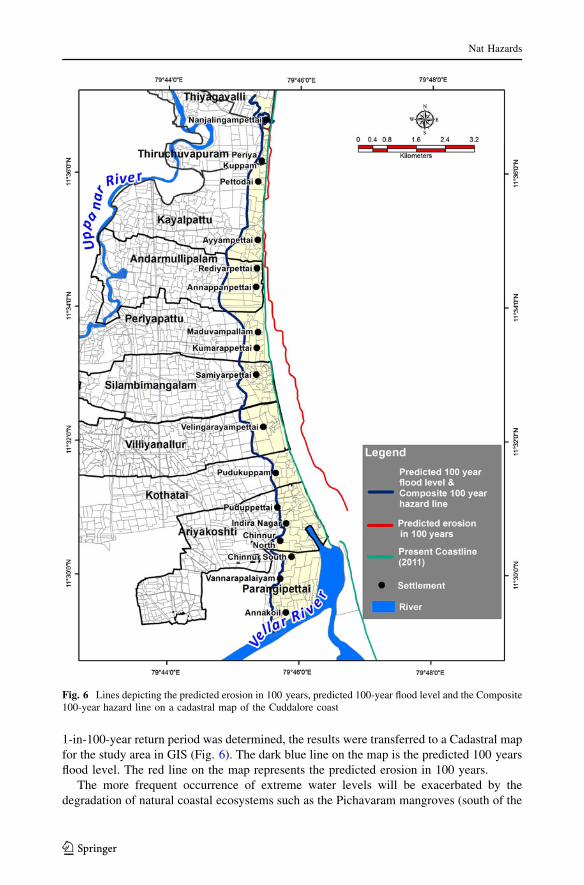
1-in-100-year return period was determined, the results were transferred to a Cadastral map
for the study area in GIS (Fig. 6). The dark blue line on the map is the predicted 100 years
flood level. The red line on the map represents the predicted erosion in 100 years.
The more frequent occurrence of extreme water levels will be exacerbated by the
degradation of natural coastal ecosystems such as the Pichavaram mangroves (south of the
Fig. 6 Lines depicting the predicted erosion in 100 years, predicted 100-year flood level and the Composite100-year hazard line on a cadastral map of the Cuddalore coast
Nat Hazards
123
study area) and sand dunes along a major stretch of the Cuddalore District that currently
serves as natural coastal defenses. It is also a fact that coastal communities along the
Cuddalore coastal region relied upon these natural defenses in extreme events such as the
Indian Ocean tsunami in December 2004, Cyclone Nisha in November 2008 and cyclone
Thane in December 2011.
The predicted 100 years flood level and the predicted erosion in 100 years were
transferred to the cadastral map of the study area in order to demarcate a ‘‘Composite
Hazard Line,’’ which was represented by the more landward of the two lines. It was
observed that for this coastal stretch along the Cuddalore District, the flood line was always
the most landward, and thus, the predicted 100 years flood line becomes the composite
hazard line (Fig. 6).
Mahendra et al. (2011) made an assessment of multi-hazard vulnerability along the
Cuddalore–Villupuram coast and had concluded that river systems act as the flooding
corridors that carry larger and longer hinterland inundation. Similar results have been
observed in this study, where the settlement of Annakoil (Parangipettai Village) located at
the mouth of the Vellar River is subject to maximum inundation. In the longer term, such
flood hazard maps can support planning and development by identifying the high-risk
locations along the highly vulnerable Cuddalore coastal region.
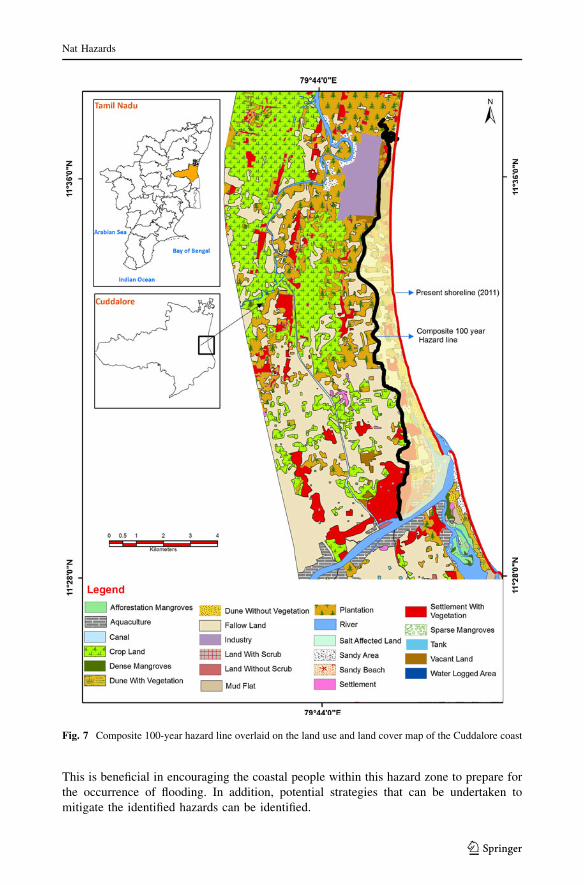
4.3 Coastal land use/land cover and socioeconomic impacts within the hazard line
Information about the different land uses along the coastal stretch of Cuddalore was
prepared to allow assessment of the implications of a storm surge on these land uses. The
land use map was prepared on a 1:50,000 scale using LISS III data and classified under 23
major classes for a total coastal length of 14 km and a coastal area of 172.18 km2. Of this,
fallow land (35 %), cropland (17.7 %), plantation (13.5 %) and settlement with vegetation
(7.6 %) were the most dominant land use classes (Table 3).
The composite hazard line was overlaid on the land use/land cover map, suggesting that
the most dominant land use patterns were (1) settlement with vegetation; (2) vacant land;
(3) fallow land; and (4) sand dunes (Fig. 7). The maximum limits of inundation were
observed to be at two locations: (1) 2050 m landward at Annakoil in the south and (2)
1,125 m landward at Annapanpettai in the north. Annakoil is a major settlement along this
coastal stretch, and our analysis indicates that it is the most vulnerable settlement to
flooding. It is estimated that a total area of 11.72 km2 along this coastline is vulnerable to
the predicted 100-year flood event (Table 4).
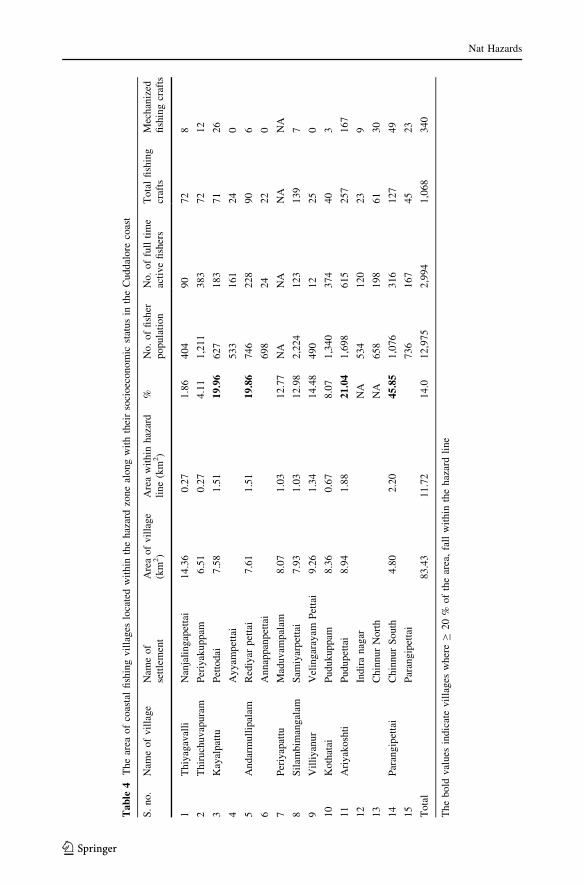
Vulnerability of Fisher Population along the Cuddalore Coastal stretch was studied
using the Marine Fisheries Census data of 2005, obtained from the Central Marine Fish-
eries Research Institute (CMFRI 2006). Of the 10 coastal villages comprising 14 settle-
ments studied, the marine census indicates that there are 12,975 fishers living in
settlements within the hazard line (Table 4). The data also indicate that over one-fourth
(2,994) of this population comprise active fishers with 1,068 fishing crafts, of which nearly
one-third (340) are mechanized boats. It can be observed that higher fishing population and
greater number of fishing crafts are recorded in the southern villages closer to the Vellar
River than in the north. This suggests that these villages possess greater fishing capacities,
and it can be expected that their socioeconomic resilience would also be greater. However,
greater fishing capacity could also mean higher dependency on fisheries for a livelihood
and therefore greater vulnerability. Villages with less fishing capacity may possess diverse
livelihoods, not dependent upon the sea or coastal area—in which case these communities
may have greater resilience to coastal changes. Thus, by incorporating the composite
Nat Hazards
123
hazard line into the current land use, it is possible to understand the extent and socio-
economic implications for people and assets at risk of flooding. This may help ensure
proper safeguards of people and property along this coastal area due to hazards such as
tsunamis, storm surges and coastal erosion. Thus, the assessment of coastal vulnerability to
climate-related impacts is a basic prerequisite for obtaining an understanding of the risk of
climate change to natural and socioeconomic coastal systems (Sterr 2008).
4.4 Advantages of hazard line mapping for coastal management in India
Mapping of the composite hazard line is planned for the first time for the entire coastline of
India, and this pilot study directly helps determine the appropriate methodologies to be
followed. This will assist in the definition of the spatial dimensions of the coastal zone of
India in the context of establishing planning boundaries of the state/local integrated coastal
zone management (ICZM) plans. The composite 100 years hazard line will incorporate the
effects of recurrent coastal hazards, including potential incremental effects induced by
climate change (most notably sea-level rise) within the ICZM plans. The composite hazard
line would help coastal planners by providing a minimum elevation above sea level to be
applied for future development and is a highly effective method of minimizing property
damage due to coastal flooding and erosion. The creation of composite hazard maps would
promote greater awareness of the risk of flooding and erosion to the coastal population.
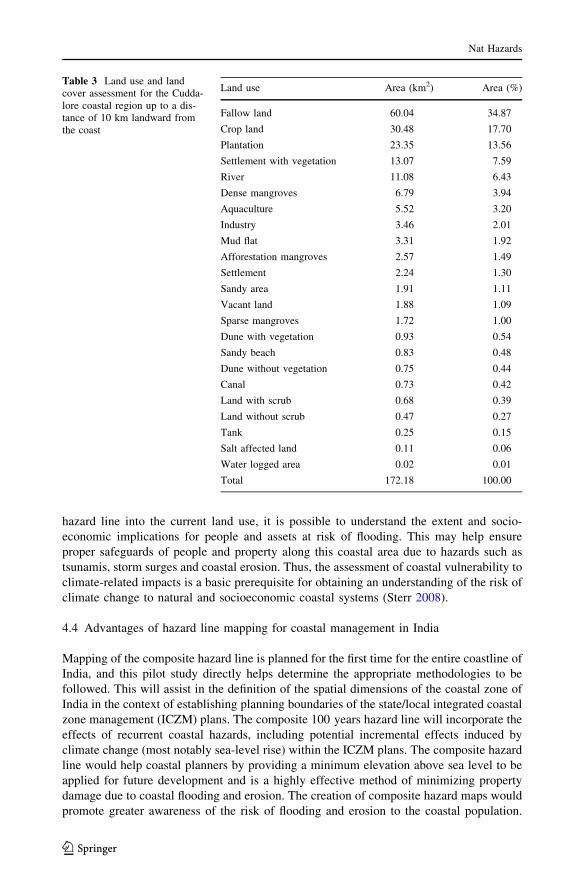
Table 3 Land use and landcover assessment for the Cudda-lore coastal region up to a dis-tance of 10 km landward fromthe coast
Land use Area (km2) Area (%)
Fallow land 60.04 34.87
Crop land 30.48 17.70
Plantation 23.35 13.56
Settlement with vegetation 13.07 7.59
River 11.08 6.43
Dense mangroves 6.79 3.94
Aquaculture 5.52 3.20
Industry 3.46 2.01
Mud flat 3.31 1.92
Afforestation mangroves 2.57 1.49
Settlement 2.24 1.30
Sandy area 1.91 1.11
Vacant land 1.88 1.09
Sparse mangroves 1.72 1.00
Dune with vegetation 0.93 0.54
Sandy beach 0.83 0.48
Dune without vegetation 0.75 0.44
Canal 0.73 0.42
Land with scrub 0.68 0.39
Land without scrub 0.47 0.27
Tank 0.25 0.15
Salt affected land 0.11 0.06
Water logged area 0.02 0.01
Total 172.18 100.00
Nat Hazards
123
This is beneficial in encouraging the coastal people within this hazard zone to prepare for
the occurrence of flooding. In addition, potential strategies that can be undertaken to
mitigate the identified hazards can be identified.
Fig. 7 Composite 100-year hazard line overlaid on the land use and land cover map of the Cuddalore coast
Nat Hazards
123
Ta
ble
4T
he
area
of
coas
tal
fish
ing
vil
lages
loca
ted
wit
hin
the
haz
ard
zon
eal
ong
wit
hth
eir
soci
oec
on
om
icst
atu
sin
the
Cu
dd
alo
reco
ast
S.
no
.N
ame
of
vil
lage
Nam
eo
fse
ttle
men
tA
rea
of
vil
lag
e(k
m2)
Are
aw
ith
inh
azar
dli
ne
(km
2)
%N
o.
of
fish
erp
op
ula
tio
nN
o.
of
full
tim
eac
tive
fish
ers
To
tal
fish
ing
craf
tsM
echan
ized
fish
ing
craf
ts
1T
hiy
agav
alli
Nan
jali
ng
apet
tai
14
.36
0.2
71
.86
40
49
07
28
2T
hir
uch
uv
apu
ram
Per
iyak
up
pam
6.5
10
.27
4.1
11
,21
13
83
72
12
3K
ayal
pat
tuP
etto
dai
7.5
81
.51
19
.96
62
71
83
71
26
4A
yy
amp
etta
i5
33
16
12
40
5A
nd
arm
ull
ipal
amR
ediy
arp
etta
i7
.61
1.5
11
9.8
67
46
22
89
06
6A
nn
appan
pet
tai
69
82
42
20
7P
eriy
apat
tuM
aduv
amp
alam
8.0
71
.03
12
.77
NA
NA
NA
NA
8S
ilam
bim
ang
alam
Sam
iyar
pet
tai
7.9
31
.03
12
.98
2,2
24
12
31
39
7
9V
illi
yan
ur
Vel
ing
aray
amP
etta
i9
.26
1.3
41
4.4
84
90
12
25
0
10
Ko
that
aiP
ud
uk
up
pam
8.3
60
.67
8.0
71
,34
03
74
40
3
11
Ari
yak
osh
tiP
udupet
tai
8.9
41.8
82
1.0
41
,69
86
15
25
71
67
12
Ind
ira
nag
arN
A5
34
12
02
39
13
Ch
innu
rN
ort
hN
A6
58
19
86
13
0
14
Par
angip
etta
iC
hin
nur
South
4.8
02.2
04
5.8
51
,07
63
16
12
74
9
15
Par
angip
etta
i736
167
45
23
To
tal
83
.43
11
.72
14
.01
2,9
75
2,9
94
1,0
68
34
0
Th
eb
old
val
ues
ind
icat
ev
illa
ges
wh
ere
C2
0%
of
the
area
,fa
llw
ith
inth
eh
azar
dli
ne
Nat Hazards
123
5 Conclusions
The purpose of this study is to understand the current risks, added risks expected from
climate change and perceived vulnerability to the growing coastal problems in the context
of coastal management. This study confirms the previous findings that the coastal stretches
of Cuddalore District are in the high-risk zones for multi-hazards. The results of a pilot
study presented here suggest that inundation already creates critical management chal-
lenges along the Cuddalore coast. Such information and data would assist local state
governments in preparing for the impacts of erosion, inundation risks and future sea-level
rise, along the Indian coastline. Using this concept, the Survey of India has initiated hazard
line mapping the entire coast of mainland India using aerial photography and very high-
resolution satellite imagery.
Acknowledgments We gratefully acknowledge funding for this research from the Ministry of Environ-ment and Forests, Government of India (MoEF Project No. 15-3/2009-IA-III). Special thanks are due toProf. John Pethick, World Bank Expert on coastal vulnerability, U.K., and to Dr. Sarah Coulthard,Northumbria University, U.K., for their invaluable comments and suggestions for improvement on themanuscript. We thank Mr. C. M. Muralidharan for his support with the socioeconomic data. All interpre-tations of the data, and any remaining oversights therein, are ours and do not necessarily reflect the opinionsof our sponsors. Finally, we thank our survey and GIS team for their generous cooperation in this study.
References
CMFRI FRAD (2006) Marine fisheries census 2005 Part III(4)Tamil Nadu. CMFRI, KochiDolan R, Fenster MS, Holme SJ (1991) Temporal analysis of shoreline recession and accretion. J Coast Res
7(3):723–744Douglas BC, Crowell M (2000) Long-term shoreline position prediction and error propagation. J Coast Res
16(1):145–152Dube SK, Rao AD, Sinha PC, Murty TS, Bahulayan N (1997) Storm surge in the Bay of Bengal and Arabian
Sea: the problem and its prediction. Mausam 48:283–304Dube SK, Indu Jain, Rao AD (2006) Numerical storm surge prediction model for the North Indian Ocean
and the South China Sea. Disaster Dev 1:47–63Fenster MS, Dolan R, Elder J (1993) A new method for predicting shoreline positions from historical data.
J Coast Res 9(1):147–171Healy TR, Dean RG (2000) Methodology for delineation of coastal hazard zones and development setback
for open duned coasts. In: Herbich JB (ed) Handbook of Coastal engineering, Chap. 19. McGraw-Hill,New York
Himmelstoss EA (2009) DSAS 4.0 Installation instructions and user guide. In: Thieler ER, Himmelstoss EA,Zichichi JL Ergul A (eds) Digital shoreline analysis system (DSAS) version 4.0—An ArcGIS exten-sion for calculating shoreline change: U.S. Geological Survey Open-File Report 2008-1278
IMD eAtlas (2011) Cyclone eAtlas—IMD, Tracks of cyclones and depressions over North Indian Ocean(from 1891 to 2011). http://www.imd.gov.in/section/nhac/dynamic/eatlas.pdf
INCCA Indian Network for Climate Change Assessment (2010) Climate change and India: a 4 X 4assessment—a Sectoral and Regional Analysis for 2030S (http://moef.nic.in/downloads/public-information/fin-rpt-incca.pdf)
Indu Jain, Chittibabu P, Agnihotri N, Dube SK, Sinha PC, Rao AD (2006) Numerical storm surge predictionmodel for Gujarat coast of India and adjoining Pakistan coast. Nat Hazards 42:67–73
IPCC (2007) Climate change the physical science basis. Contribution of working group I to the fourthassessment report of the intergovernmental panel on climate change [Solomon S, Qin D, Manning M,Chen Z, Marquis M, Averyt KB, Tignor M and Miller HL (eds)] Cambridge University Press,Cambridge, United Kingdom and New York, NY, USA, p 996
Kumar CS, Murugan PA, Krishnamurthy RR, Batvari BPD, Ramanamurthy MV, Usha T, Pari Y (2008)Inundation mapping—a study based on December (2004) Tsunami Hazard along Chennai coast,Southeast India. Nat Hazards Earth Syst Sci 8:617–626
Linham M, Nicholls RJ (2010) Technologies for climate change adaptation: coastal erosion and flooding.TNA Guidebook Series. UNEP/GEF, 150 pp
Mahendra RS, Mohanty PC, Bisoyi H, Srinivasa Kumar T, Nayak SR (2011) Assessment and managementof coastal multi-hazard vulnerability along the Cuddalore-Villupuram, East Coast of India usinggeospatial techniques. Ocean Coast Manag 54(4):302–311
Murthy KSR, Subrahmanyam AS, Murty GPS, Sarma KVLNS, Subrahmanyam V, Rao KM, Rani PS,Anuradha A, Adilakshmi B, Sri Devi T (2006) Factors guiding tsunami surge at the Nagapattinam–Cuddalore shelf, Tamil Nadu, east coast of India. Curr Sci 90(11):1535–1538
Nicholls RJ, Leatherman SP (1995) Global sea level rise.In: Strzepek KM, Smith JB (eds) As climatechanges: international impacts and implications. Cambridge University Press, Cambridge, pp 92–123
Nicholls RJ, Wong PP, Burkett VR, Codignotto JO, Hay JE, McLean RF, Ragoonaden S, Woodroffe CD(2007) Coastal systems and lowlying areas. Climate Change 2007: impacts, adaptation and vulnera-bility. In: Parry ML, Canziani OF, Palutikof JP, van der Linden PJ, Hanson CE (eds) Contribution ofworking group II to the fourth assessment report of the intergovernmental panel on climate change.Cambridge University Press, Cambridge, UK, pp 315–356
NRSC (2010) Natural resources census, fifth cycle (2008-09). National land use and land cover mappingusing multitemporal AWiFS data (LULC-AWiFS). Remote Sensing & GIS Applications Area,National Remote Sensing Centre, Indian Space Research Organisation, Department of Space, Gov-ernment of India, 51 pp
Pethick J (2009) Interaction meeting and national workshop on draft coastal management zone notification(Personal Communication)
Ramesh R, Purvaja R, Senthil Vel A, Ahana Lakshmi, Bhat JR (2010) Coastal regulation zone notification: areview of the chronology of amendments. In: Bhatt JR, Manintosh DJ, Nayar TS, Pandey CN, Nila-ratna P (eds) Coastal environment. In: Towards conservation and management of mangrove ecosys-tems in India. IUCN India, pp 219–239
Rao VR, Ramana Murthy MV, Bhat M, Reddy NT (2009) Littoral sediment transport and shoreline changesalong Ennore on the southeast coast of India: field observations and numerical modelling. Geomor-phology 112:158–166
Sindhu B, Unnikrishnan AS (2012) Return period estimates of extreme sea level along the east coast of Indiafrom numerical simulations. Nat Hazards 61:1007–1028
Sterr H (2008) Assessment of vulnerability and adaptation to sea-level rise for the coastal zone of Germany.J Coast Res 242:380–393
Subramanian BR (2006) Inundation of seawater due to Indian Ocean Tsunami along the Indian Coast. In:Rajamanickam GV, Subramaniyan BR, Baba M, Ramesh R, Elango L, Prithviraj M (eds) 26thDecember 2004 tsunami: causes, effects, remedial measures pre and post tsunami disaster manage-ment: a geoscientific perspective, pp 10–44
Thieler ER, Himmelstoss EA, Zichichi JL, Ergul A (2009). Digital Shoreline Analysis System (DSAS)version 4.0-An ArcGIS extension for calculating shoreline change: U.S. Geological Survey Open-FileReport 2008-1278
Unnikrishnan AS, Shankar D (2007) Are sea-level-rise trends along the coasts of the north Indian Oceanconsistent with global estimates? Glob Planet Chang 57:301–307
USGS (2005) The digital shoreline analysis system (DSAS) version 3.0, an ArcGIS extension for calculatinghistrionic shoreline change, Open-File Report 2005-1304. http://woodshole.er.usgs.gov/project-pages/DSAS/version3/. Accessed October12, 2011