26
COCO RISK: Practical Approaches to Measuring Risk Robert Stamicar July 2016
COCO RISK: Practical Approaches to Measuring Risk
Robert Stamicar
July 2016
AXIOMA COCO RISK: Practical Approaches to Measuring Risk
COCO RISK
CoCo (contingent conversion) bonds have seen an upsurge in the headlines lately. In a nutshell, these
instruments allow banks to boost regulatory capital during periods of financial stress, but not at the
expense of taxpayers; hence, these instruments mitigate the too-big-to-fail doctrine. Investors of CoCos
take the brunt of losses if a bank’s capital ratio dips below a predefined level. When Common Equity
Tier 1 (CET1) capital falls below a preset threshold level, the bonds either convert into cheap equity
shares or suffer a partial or full write-down in principal. In either case, this loss-absorption mechanism
immediately strengthens the capital structure of the issuing bank. For taking on this “regulatory” risk,
investors are compensated with higher yields, which are attractive under the current low interest rate
environment.
Conflicting signals
From the onset, CoCos are appealing from both a regulator’s and bank’s perspective because they inject
capital before insolvency without a government bailout. However, Cocos as an asset class have recently
come under scrutiny, not only from investors, as might be expected, but from an issuing bank. In
particular, Deutsche Bank (DB) in March of this year stated that CoCos were bad products and that
DB might stop issuing them altogether. But these statements did not discourage investor demand for
CoCos. In April, just one month later, UBS issued 1.5B USD worth of CoCos. In addition, the Spanish
bank Banco Bilbao Vizcaya Argentaria (BBVA) and the Dutch bank ING both issued 1B EUR worth of
CoCos. In all cases demand outstripped supply. Why this wide disconnect among issuer’s perceptions
of contingent capital issuance? The negative statements about CoCos from DB might sound surprising,
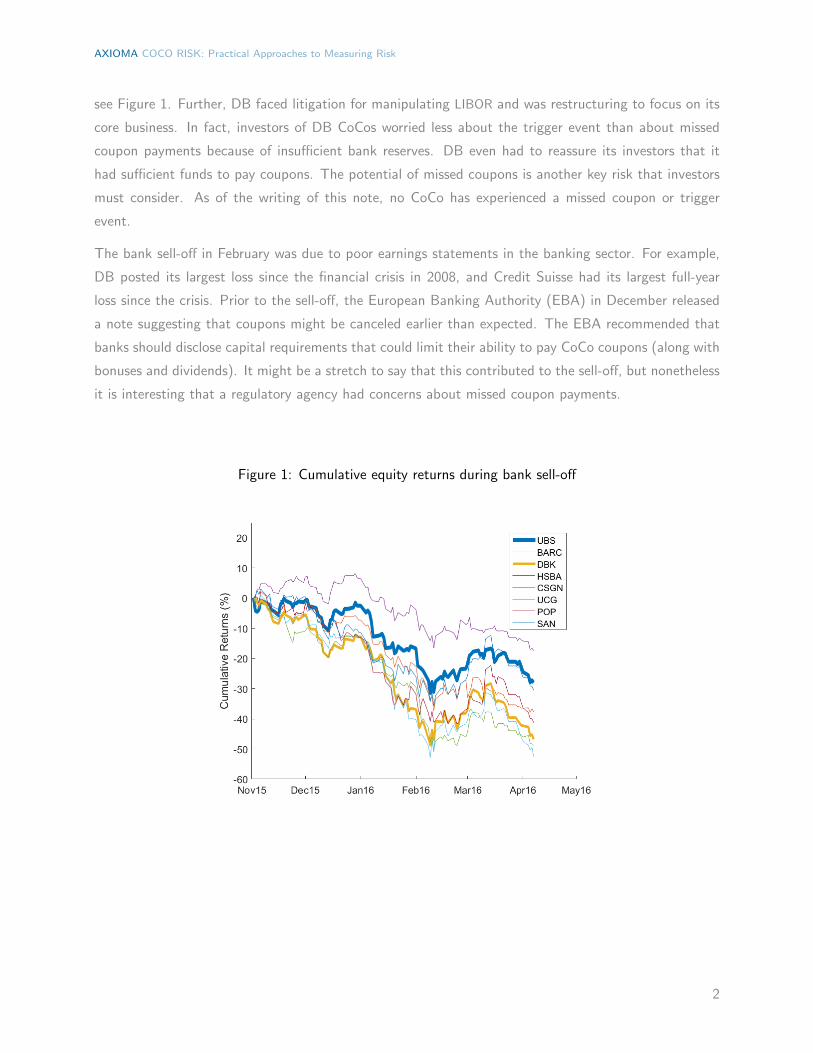
but these came after a sell-off in bank shares and bonds in February, with a partial recovery in March;
1
AXIOMA COCO RISK: Practical Approaches to Measuring Risk
see Figure 1. Further, DB faced litigation for manipulating LIBOR and was restructuring to focus on its
core business. In fact, investors of DB CoCos worried less about the trigger event than about missed
coupon payments because of insufficient bank reserves. DB even had to reassure its investors that it
had sufficient funds to pay coupons. The potential of missed coupons is another key risk that investors
must consider. As of the writing of this note, no CoCo has experienced a missed coupon or trigger
event.
The bank sell-off in February was due to poor earnings statements in the banking sector. For example,
DB posted its largest loss since the financial crisis in 2008, and Credit Suisse had its largest full-year
loss since the crisis. Prior to the sell-off, the European Banking Authority (EBA) in December released
a note suggesting that coupons might be canceled earlier than expected. The EBA recommended that
banks should disclose capital requirements that could limit their ability to pay CoCo coupons (along with
bonuses and dividends). It might be a stretch to say that this contributed to the sell-off, but nonetheless
it is interesting that a regulatory agency had concerns about missed coupon payments.
Figure 1: Cumulative equity returns during bank sell-off
2

AXIOMA COCO RISK: Practical Approaches to Measuring Risk
MECHANICS OF COCOS
The goal of CoCos is to readily provide bank capital during a financial crisis (prior to insolvency) at the
expense of the investors. All CoCos are characterized with a loss-absorption mechanism and a trigger
that activates that mechanism:
• Loss-absorption mechanism: Losses should be absorbed prior to the point of insolvency. After
the trigger event, the CoCo is either converted to equity or suffers a principal write-down.
Lately, write-down CoCos have been popular since they will not dilute existing shares.
• Trigger levels: Activation of losses is triggered when the issuing bank’s capital falls below a
specified fraction of its risk-weighted assets (RWAs). More precisely, when the ratio of CET1
capital to RWA falls below a threshold, t‹, CoCo investors face losses either through conversion
to equity or a write-down:
CET1
RWAă t‹, (1)
We can represent the loss, L, of a CoCo as
L “ N ´ CR ¨ S‹ (2)
“ N
ˆ
1´S‹
X
˙
, (3)
where N is the notional, CR is the conversion ratio, X “ N{CR is the conversion price, and S‹ is the
(unknown) equity value when the capital ratio is breached. The last term in (3) can be interpreted as a
recovery rate; here the conversion price determines the loss when a trigger event occurs. For example, if
X “ S‹ then no loss is observed. In fact, the loss-absorption mechanism is not standardized and varies
in the CoCo market. Some common specifications are: (i) X “ S0 where S0 is the initial equity price at
CoCo issuance; (ii) X “ θS0 where θ is a specified fraction of the issue price; and (iii) X “ minpS0, S1q
with a specified floor share price of S1. For write-down CoCos, we can replace the last term in (3) with
a recovery rate that reflects either full or partial principal write-downs.
The predefined accounting trigger (1) is typically accompanied with a regulatory trigger at the discretion
of the local supervisor. The discretionary trigger is also known as a point of non-viability (PONV) trigger,
which allows regulators to activate the loss-absorption if they believe a bank is close to insolvency. It
allows regulators to act more quickly than accounting data would permit, but at the cost of adding
uncertainty around the timing of the trigger event.
3
AXIOMA COCO RISK: Practical Approaches to Measuring Risk
Regulatory fine-tuning
CoCos are a relatively new asset class that first appeared in 2009 when Lloyds Bank issued its equity
credit notes (ECNs). Since their inception to strengthen the financial health of the banking sector,
CoCos have come under scrutiny by regulators. Regulatory bodies such as the European Securities and
Market Authority (ESMA) and Germany’s Federal Financial Supervisory Authority (BaFin) have advised
that only sophisticated investors such as asset managers and hedge funds should be allowed to purchase
CoCos. Because CoCos carry many risks (which we will discuss in the next section), this is a prudent
measure to protect retail investors.
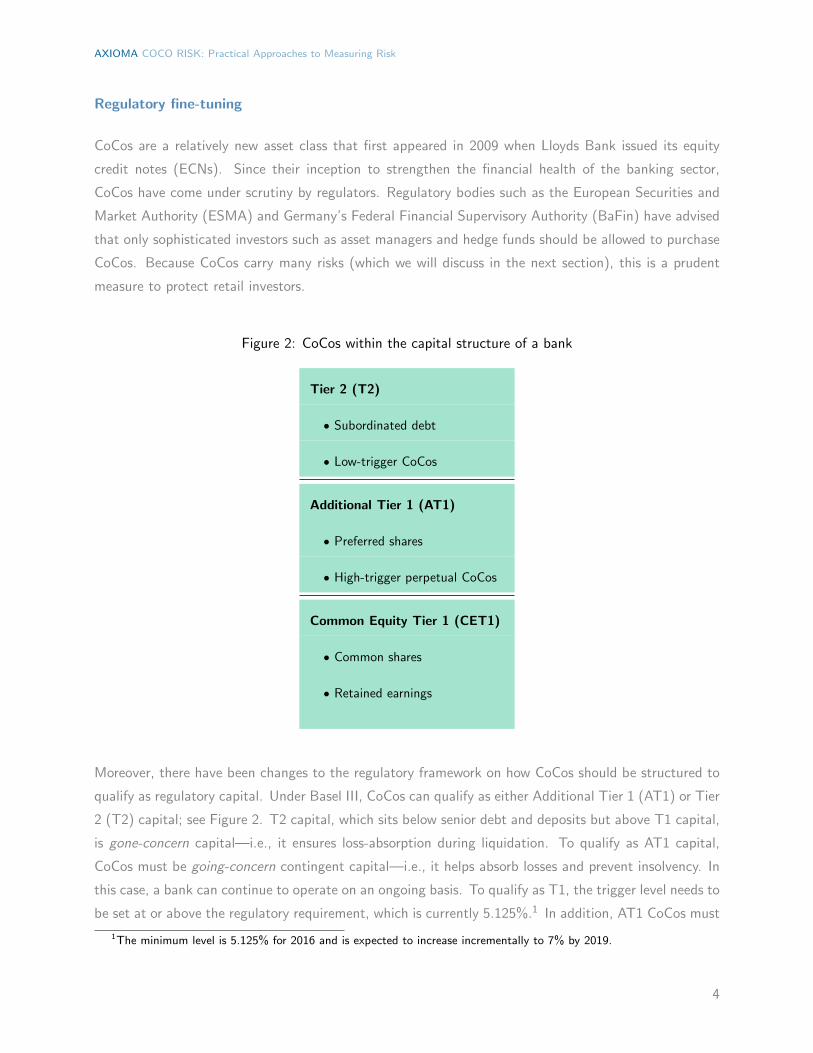
Figure 2: CoCos within the capital structure of a bank
Tier 2 (T2)
‚ Subordinated debt
‚ Low-trigger CoCos
Additional Tier 1 (AT1)
‚ Preferred shares
‚ High-trigger perpetual CoCos
Common Equity Tier 1 (CET1)
‚ Common shares
‚ Retained earnings
Moreover, there have been changes to the regulatory framework on how CoCos should be structured to
qualify as regulatory capital. Under Basel III, CoCos can qualify as either Additional Tier 1 (AT1) or Tier
2 (T2) capital; see Figure 2. T2 capital, which sits below senior debt and deposits but above T1 capital,
is gone-concern capital—i.e., it ensures loss-absorption during liquidation. To qualify as AT1 capital,
CoCos must be going-concern contingent capital—i.e., it helps absorb losses and prevent insolvency. In
this case, a bank can continue to operate on an ongoing basis. To qualify as T1, the trigger level needs to
be set at or above the regulatory requirement, which is currently 5.125%.1 In addition, AT1 CoCos must
1The minimum level is 5.125% for 2016 and is expected to increase incrementally to 7% by 2019.
4

AXIOMA COCO RISK: Practical Approaches to Measuring Risk
now be perpetual securities, although they may be callable. Callable AT1 CoCos are required to have
the first call date at least five years after issuance; see [1] for details. Further, step-up or other incentives
to redeem are no longer permitted. In the past, step-up coupons resulting in investors’ anticipation of
redemption at the first call date.
EMBEDDED RISKS
CoCos are hybrid securities that exhibit both bond- and equity-like features. In the capital structure of
the bank, they sit between senior debt and equity, and qualify as either T2 or AT1 capital. (See Figure
2.) AT1 CoCos are the most subordinated debt and consequently the most risky bank debt.
CoCos carry a wide spectrum of risk, including market, credit, and regulatory risk. (See Table 1.) As a
result, the valuation and risk modeling of these complex securities is difficult. First, modeling the trigger
event itself is challenging. The accounting trigger contains in its denominator the value of RWA, which
is a function of a bank’s internal models, reported at most on a quarterly basis. Thus, different banks
compute RWA differently for identical portfolios of assets. As a result, the trigger may not accurately
indicate impeding insolvency. Moreover, because the accounting triggers are lagged, they will not provide
an early warning during a bank crisis.
Extension and missed-coupon risk for AT1 capital is important to acknowledge. As described earlier,
callable AT1 CoCos must have the first call date at least five years after issuance. After the first call, the
coupon payments typically switch from fixed to float. Thus, modeling assumptions about redemption are
required to compute yields and spreads for CoCos. One can compute yields by using a simple approach
such as yield-to-worst or -first or from a standard interest rate model that handles arbitrary coupon
structures. Missed-coupon or coupon cancellation risk is the risk of the bank not paying interest to
CoCo investors. Recall that Deutsche Bank’s perceived inability to make future coupon payments after
the February sell-off caused turmoil for its contingent capital investors.
Finally, there is regulatory risk. Recall that a discretionary trigger may accompany an accounting trigger.
Anticipating when regulators will use a discretionary trigger or when they will permit redemption, even
if it makes sense economically from the bank’s perspective, is virtually impossible. In addition, when
regulatory capital definitions change, the issuer can call at the prevailing market price (regulatory call
provision). At times, the price of CoCos has soared when investors anticipated an issuer call due to
the reclassification of regulatory capital. An interesting case involves Swiss regulators in October 2015,
when they proposed that only high-trigger CoCos be classified as AT1 capital. Consequently, investors
5

AXIOMA COCO RISK: Practical Approaches to Measuring Risk
anticipated a regulatory call of a low-trigger AT1 Coco issued by Credit Suisse. This drove its price
above par until the regulators decided to grandfather this particular CoCo as an AT1.
Table 1: Embedded risks for CoCo bonds
Key Risk
Interest rates Currently minimal in low-rate environment
Credit spread Systematic and issuer specific
Coupon cancellation AT1 capital is subject to missed coupon
payments
Extension risk Most AT1 CoCos are callable
Regulatory risk - timing of discretionary trigger
- discretionary coupon cancellation
- extension risk
- regulatory call provision: issuer can call
if regulatory capital definitions change
WHAT’S A RISK MANAGER TO DO?
At one extreme, one can claim that modeling CoCos adequately is impossible. As discussed above, this is
due to an opaque definition of the accounting trigger (or RWA), the timing of the trigger event, missed
coupon risk, and extension risk. And on top of this, we have regulatory risk that entails regulatory call
provisions, discretionary triggers, and redemption approval. As a consequence, we may never be able to
model all the risks of CoCos. However, we can begin with standard models, which have been proposed
in the literature, for valuation and risk estimations. As a first step, it seems reasonable to link the
pricing model of a CoCo to its equity. This is a reasonable starting point given that CoCos are hybrid
securities. As a bank’s credit deteriorates, its share price will plummet and equity volatility will increase.
The three models that we outline below, to varying extents, incorporate equity prices and volatility into
6

AXIOMA COCO RISK: Practical Approaches to Measuring Risk
the pricing.
In this section we will outline the models and use one (a market-based structural model) to compare the
creditworthiness of a sample of European banks that issue CoCos.
Pricing models
The pricing models for CoCos can be divided into three broad categories:
• Equity derivative models
• Credit derivative models
• Structural models
This wide spectrum of pricing models is due to the hybrid features of CoCos. For a description of
equity and credit derivative models, see De Spiegeleer and Schoutens [3]. With the equity derivative
model, a CoCo is modeled as a bullet bond and a series of knock-in derivatives. Under a credit derivatives
approach, the standard concepts of risky bond pricing are utilized. Each bond’s cash flow has a probability
of survival associated with it. The model is adjusted for the probability of a trigger event rather than
default. Instead of modeling the dynamics of the accounting trigger explicitly, an implicit equity barrier
(see Equation (3)) is introduced such that if the share price dips below this level, a trigger event is
activated. See Appendix A for a description of the credit derivatives model.
Structural models take as inputs the asset value, asset volatility, and firm leverage, and output a credit
spread.2 Default occurs when the asset value falls below the firm’s liability level. The dynamics of the
firm’s assets drives both the firm’s equity and credit, and consequently provides a link between equity
and credit markets.
Moreover, structural models can be classified as fundamental or market-based. (See Stamicar and Fin-
ger [9].) Both fundamental and market-based structural models can be extended to model CoCos. The
fundamental approach estimates inputs using first principles and then computes model prices of financial
instruments. The fundamental model provides a natural framework that incorporates the bank’s balance
sheet. Incorporating CoCos into the capital structure is nontrivial, but several fundamental models have
been proposed; see, for example, Metzler and Ressor [6] or Pennacchi [8]. On the other hand, market-
based approaches observe market prices of financial instruments and solve for the model parameters that
allow us to recover these prices. For example, given the price of a CoCo, we can infer the leverage that re-
covers its price.3 The market-based approach is attractive in that it can bypass the estimation of leverage
2Structural models provide default probabilities as outputs. Since we focus on the pricing of CoCos, we only consider
risk-neutral versions of structural models.3Market-based structural models are similar to the credit derivatives model that De Spiegeleer and Schoutens [3]
proposed.
7

AXIOMA COCO RISK: Practical Approaches to Measuring Risk
and can be used to calibrate models for risk estimations such as VaR. We will provide examples at the end
of this note to illustrate this approach. Table 2 provides a list of inputs and outputs for structural models.
Table 2: Fundamental and market-based structural models
Inputs Outputs
Asset value Risk-neutral probabilities
Leverage Credit spreads
Market cap.
Equity volatility
Capital structure
including CoCos
Which model?
Equity derivative, credit derivative, and market-based structural models might better address the regula-
tory uncertainty than do fundamental structural models. But the lagged financial statement data remains
to be addressed. In fact, De Spiegeleer, Marquet and Schoutens [2] propose a model, which is structural
in spirit, where the regulatory trigger is explicitly modeled. They introduce a distance-to-trigger parame-
ter that is analogous to distance-to-default. At first, this seems of little use since accounting information
lags and different banks compute RWA differently. But the authors cleverly introduce an uncertainty in
this metric through a CET1 volatility parameter. This uncertainty in CET1 can potentially be added to
a structural framework.
In the next few sections, we will examine how a particular market-based structural model can provide
an early warning signal. The structural model that we consider is the E2C/CreditGrades model that was
initially introduced by JPMorgan. (See Finger [5].) It is a first exit barrier model, which is similar to the
credit derivatives model. This structural model provides tractable solutions for risk-neutral probabilities
and spreads. In our market-based implementation of E2C/CreditGrades, we introduce an implied barrier
that represents the leverage of the firm. See Appendix A for a description of this model. We are not
claiming that market-based structural (or credit derivative) models are the best models, but we select
them because implementation is fairly straightforward.
A standard model for a CoCo should:
8

AXIOMA COCO RISK: Practical Approaches to Measuring Risk
• Link to the CoCo’s equity
• Provide a warning by using CoCo spreads to imply leverage
• Use other sources of data such as CDS or implied volatilities as a warning signal at the issuer
level
• Stress test redemption assumptions
Implied leverage as an early warning signal
Recall that the accounting trigger is updated only when the bank publishes a new RWA, and as a result
does not provide a reliable warning. Daily market data provides a more timely warning.
To illustrate, we use the market-based version of E2C/CreditGrades, described in Appendix A, to compute
implied leverage. Leverage can be defined in various ways, and for our analysis, we define leverage
simplistically as long-term debt to market capitalization. We use balance sheet information to calibrate
the model to the initial value of leverage, which then changes with market data. Consider the case
where our inputs are the equity price, equity volatility, and the five-year CDS spread of a bank. From
these parameters, we compute an implied asset volatility that recovers the initial CDS spread and an
initial leverage as described above. We keep the asset volatility fixed as equity and CDS prices change.
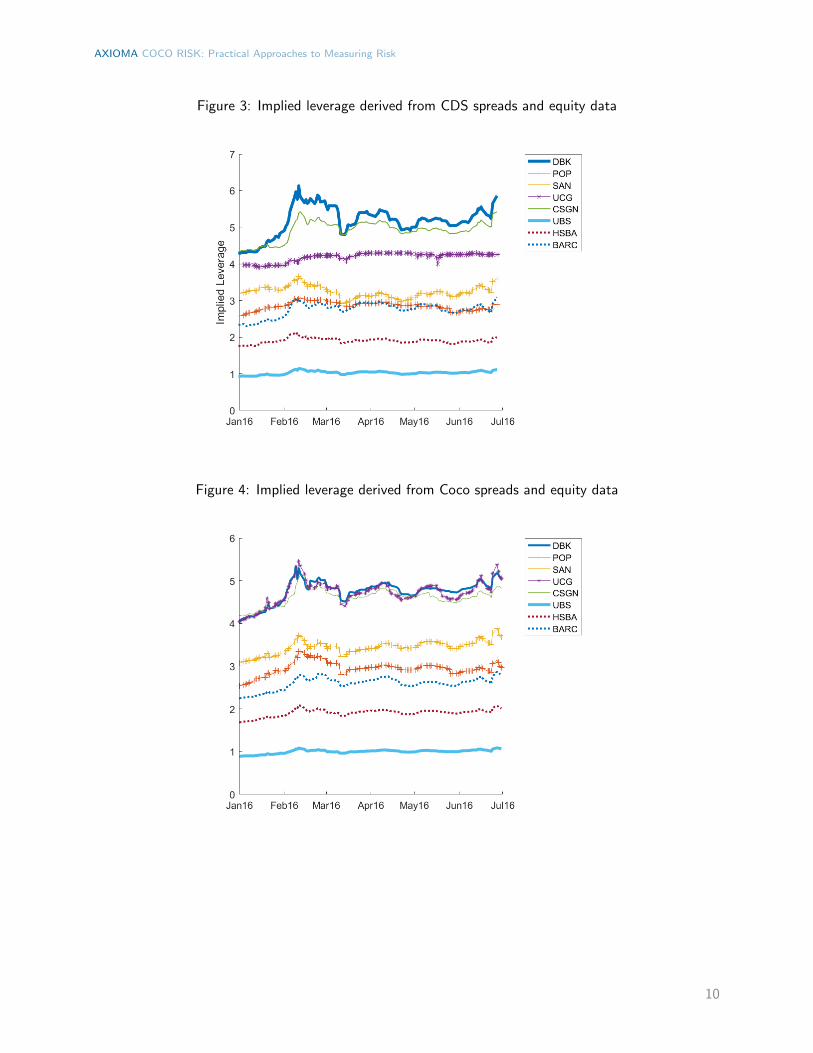
Figure 3 provides implied leverages for a sample of European banks. During February implied leverage
increased for most banks, with a notable increase for DB. At the other extreme we see UBS with the
smallest change in implied leverage.
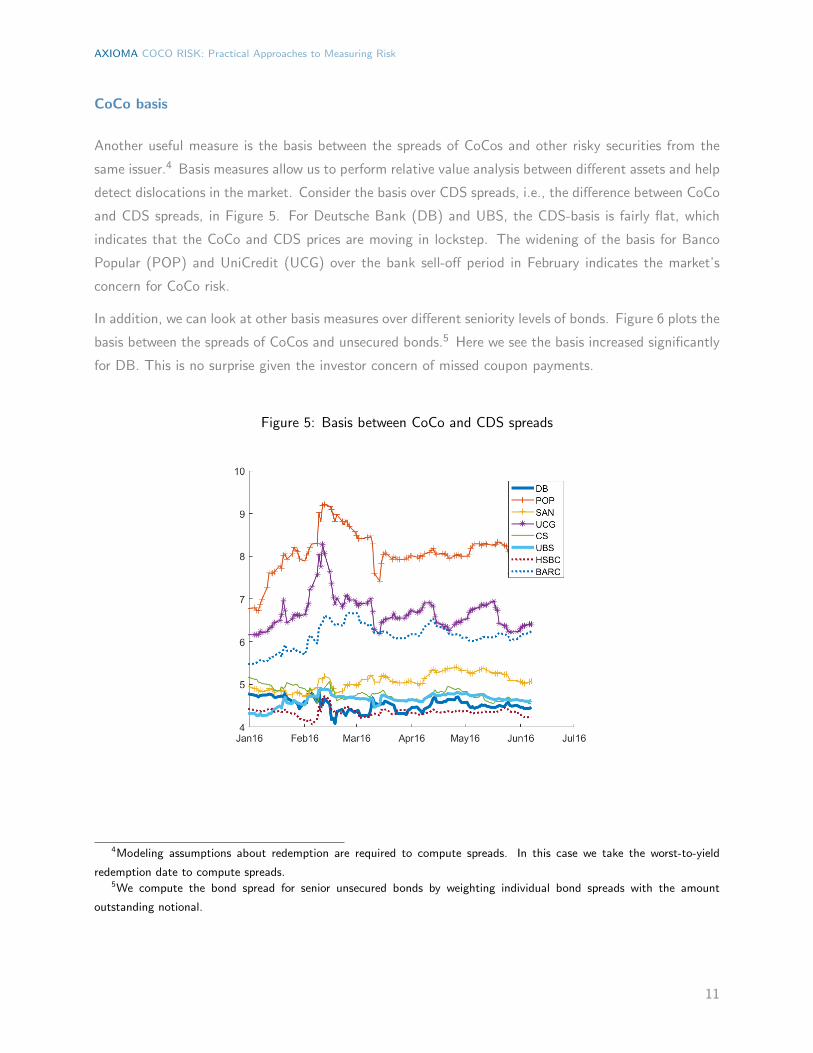
Although the implied leverage computed from CDS is useful, we have not utilized any CoCo data yet.
We can incorporate equity prices and CoCo spreads into the computation of implied leverage as well.
Our sample consists of AT1 CoCos with write-down triggers. Figure 4 displays the implied leverage
from CoCo spreads. CoCo spread-implied leverage behaves much like CDS-implied leverage, but the
movements in leverage for certain banks were much more pronounced over the periods of the bank
sell-off in February and the Brexit referendum in late June.
We can interpret the differences between the CDS and CoCo spread versions of implied leverage that are
illustrated in Figures 3 and 4 as follows: the CDS-implied leverage captures the creditworthiness of the
issuer, whereas the CoCo spread-implied leverage is more specific to the bank’s CoCo issuance. For ex-
ample, we observe much more pronounced movements in leverage for Banco Popular (POP), UnitCredit
(UCG), and Banco Santander (SAN) over both the bank sell-off and Brexit periods. These results are
not surprising since the CoCo bonds of these three banks suffered big losses during the bank sell-off; at
times they were trading below 75 cents to the euro.
9
AXIOMA COCO RISK: Practical Approaches to Measuring Risk
Figure 3: Implied leverage derived from CDS spreads and equity data
Figure 4: Implied leverage derived from Coco spreads and equity data
10
AXIOMA COCO RISK: Practical Approaches to Measuring Risk
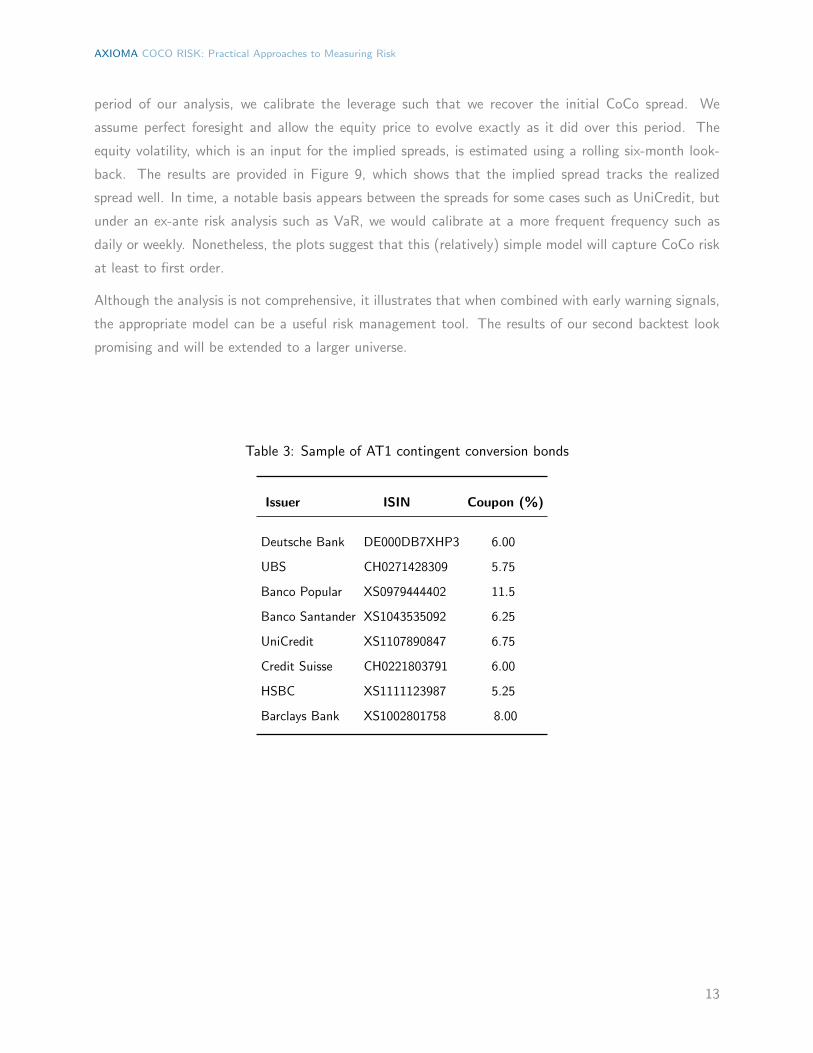
CoCo basis
Another useful measure is the basis between the spreads of CoCos and other risky securities from the
same issuer.4 Basis measures allow us to perform relative value analysis between different assets and help
detect dislocations in the market. Consider the basis over CDS spreads, i.e., the difference between CoCo
and CDS spreads, in Figure 5. For Deutsche Bank (DB) and UBS, the CDS-basis is fairly flat, which
indicates that the CoCo and CDS prices are moving in lockstep. The widening of the basis for Banco
Popular (POP) and UniCredit (UCG) over the bank sell-off period in February indicates the market’s
concern for CoCo risk.
In addition, we can look at other basis measures over different seniority levels of bonds. Figure 6 plots the
basis between the spreads of CoCos and unsecured bonds.5 Here we see the basis increased significantly
for DB. This is no surprise given the investor concern of missed coupon payments.
Figure 5: Basis between CoCo and CDS spreads
4Modeling assumptions about redemption are required to compute spreads. In this case we take the worst-to-yield
redemption date to compute spreads.5We compute the bond spread for senior unsecured bonds by weighting individual bond spreads with the amount
outstanding notional.
11

AXIOMA COCO RISK: Practical Approaches to Measuring Risk
Figure 6: Basis between CoCo and bond spreads. Right-hand plot is identical to left-hand plot except
that the range in the y-axis has been restricted
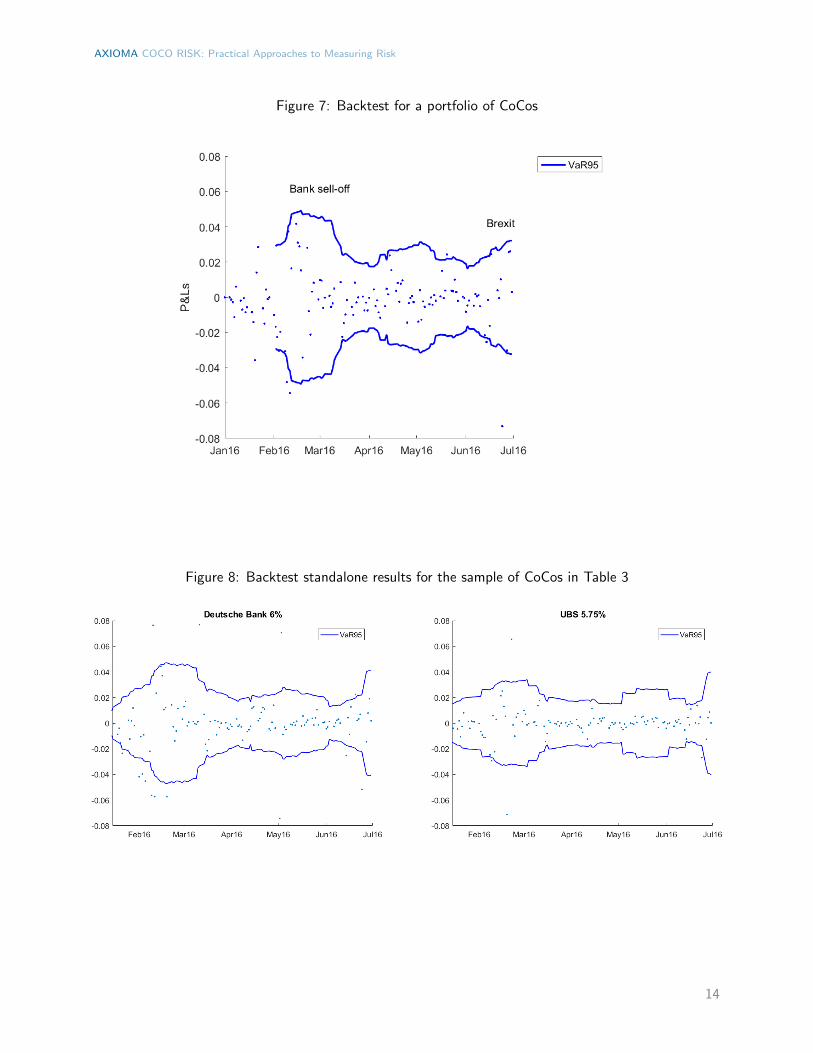
RISK ESTIMATION
We take a pragmatic approach to estimating risk for CoCos because of the myriad of risks described
earlier. In this section we apply the E2C/CreditGrades model to compute VaR for a small subset of AT1
CoCos listed in Table 3. We perform two backtests of the model in this section. The first is based on
comparing realized P&Ls (profits and losses) against ex-ante risk forecasts, and the second is based on
how well the model tracks realized spreads when given perfect foresight in the movement of underlying
risk factors.
In Figure 7 we illustrate our first backtest. We plot daily P&Ls against predicted VaR, at the 95%
confidence level and one-month decay, and monitor the number of excessions from the confidence bands.
We expect to observe downside excessions 5% of the time. Over this period of daily returns, we are in
line with the expected number of excessions (5-6). From the plot, we observe the increased level of risk
during the bank sell-off period in February and the period prior to the Brexit referendum in late June. In
Figure 8 we also plot VaR confidence bands for some CoCo bonds on a stand-alone basis. The pattern
of elevated risk during the bank sell-off and Brexit periods are similar to the portfolio result in Figure
7.
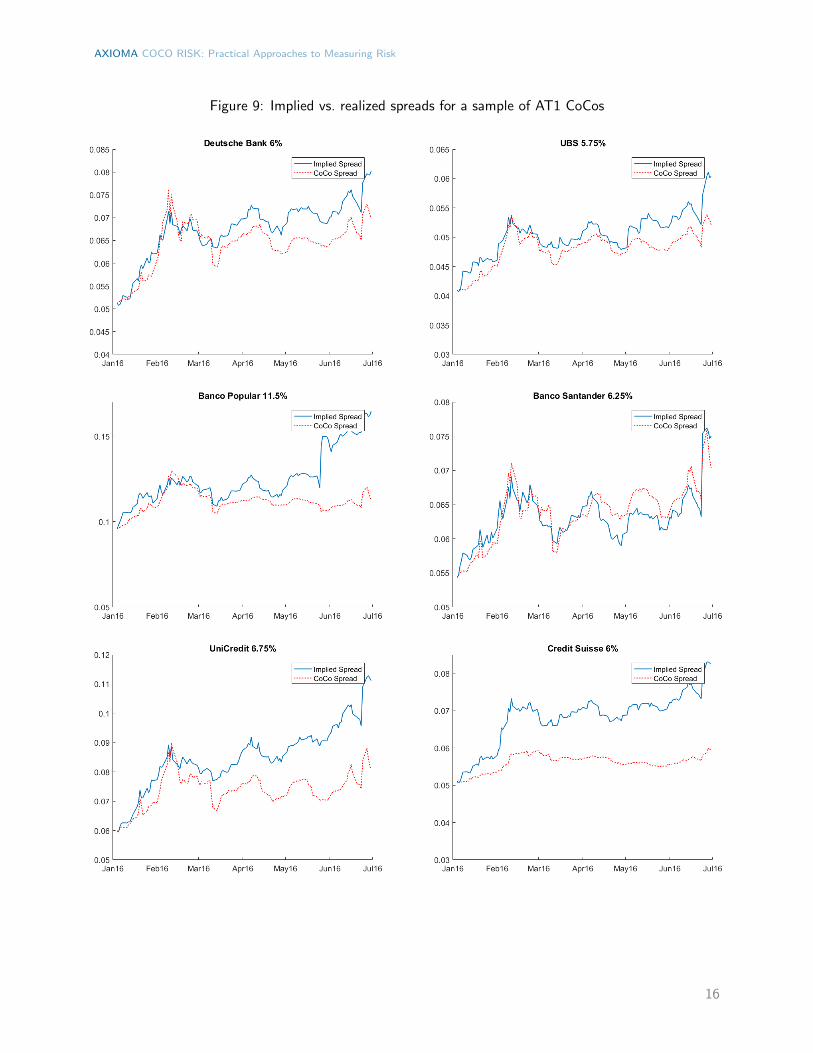
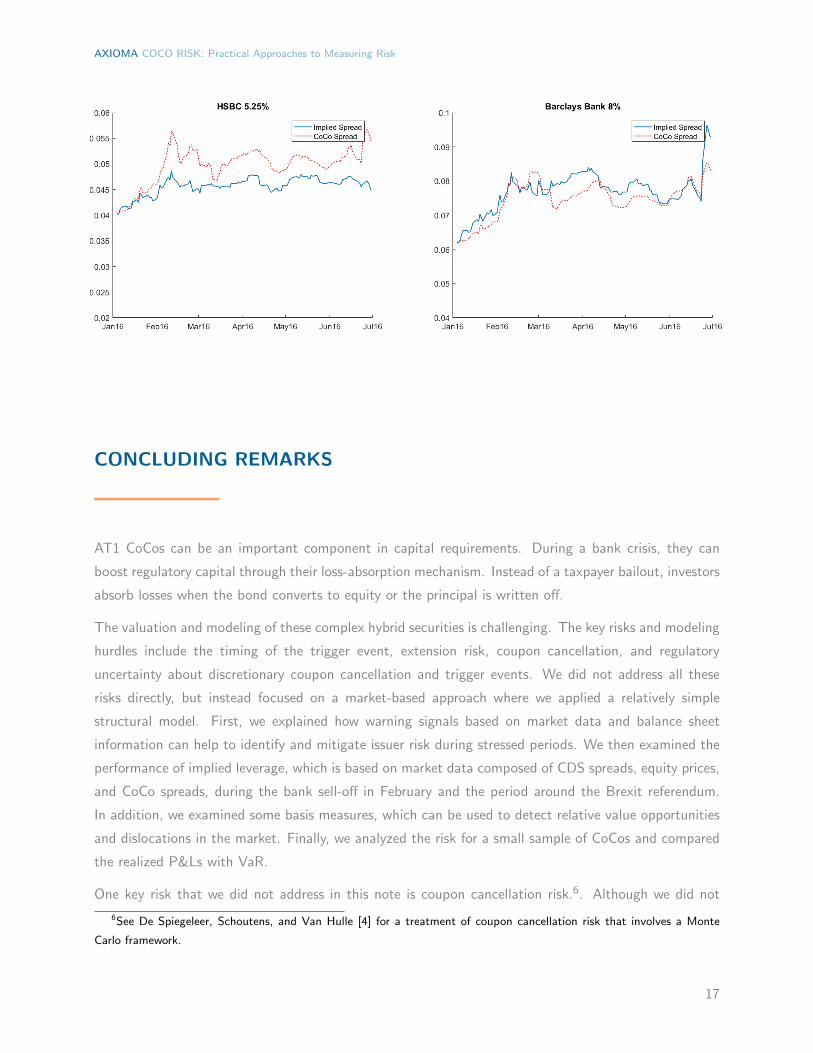
In our second backtesting analysis, we compare CoCo with implied CoCo spreads. At the beginning
12
AXIOMA COCO RISK: Practical Approaches to Measuring Risk
period of our analysis, we calibrate the leverage such that we recover the initial CoCo spread. We
assume perfect foresight and allow the equity price to evolve exactly as it did over this period. The
equity volatility, which is an input for the implied spreads, is estimated using a rolling six-month look-
back. The results are provided in Figure 9, which shows that the implied spread tracks the realized
spread well. In time, a notable basis appears between the spreads for some cases such as UniCredit, but
under an ex-ante risk analysis such as VaR, we would calibrate at a more frequent frequency such as
daily or weekly. Nonetheless, the plots suggest that this (relatively) simple model will capture CoCo risk
at least to first order.
Although the analysis is not comprehensive, it illustrates that when combined with early warning signals,
the appropriate model can be a useful risk management tool. The results of our second backtest look
promising and will be extended to a larger universe.
Table 3: Sample of AT1 contingent conversion bonds
Issuer ISIN Coupon (%)
Deutsche Bank DE000DB7XHP3 6.00
UBS CH0271428309 5.75
Banco Popular XS0979444402 11.5
Banco Santander XS1043535092 6.25
UniCredit XS1107890847 6.75
Credit Suisse CH0221803791 6.00
HSBC XS1111123987 5.25
Barclays Bank XS1002801758 8.00
13
AXIOMA COCO RISK: Practical Approaches to Measuring Risk
Figure 7: Backtest for a portfolio of CoCos
Figure 8: Backtest standalone results for the sample of CoCos in Table 3
14

AXIOMA COCO RISK: Practical Approaches to Measuring Risk
15
AXIOMA COCO RISK: Practical Approaches to Measuring Risk
Figure 9: Implied vs. realized spreads for a sample of AT1 CoCos
16
AXIOMA COCO RISK: Practical Approaches to Measuring Risk
CONCLUDING REMARKS
AT1 CoCos can be an important component in capital requirements. During a bank crisis, they can
boost regulatory capital through their loss-absorption mechanism. Instead of a taxpayer bailout, investors
absorb losses when the bond converts to equity or the principal is written off.
The valuation and modeling of these complex hybrid securities is challenging. The key risks and modeling
hurdles include the timing of the trigger event, extension risk, coupon cancellation, and regulatory
uncertainty about discretionary coupon cancellation and trigger events. We did not address all these
risks directly, but instead focused on a market-based approach where we applied a relatively simple
structural model. First, we explained how warning signals based on market data and balance sheet
information can help to identify and mitigate issuer risk during stressed periods. We then examined the
performance of implied leverage, which is based on market data composed of CDS spreads, equity prices,
and CoCo spreads, during the bank sell-off in February and the period around the Brexit referendum.
In addition, we examined some basis measures, which can be used to detect relative value opportunities
and dislocations in the market. Finally, we analyzed the risk for a small sample of CoCos and compared
the realized P&Ls with VaR.
One key risk that we did not address in this note is coupon cancellation risk.6. Although we did not
6See De Spiegeleer, Schoutens, and Van Hulle [4] for a treatment of coupon cancellation risk that involves a Monte
Carlo framework.
17
AXIOMA COCO RISK: Practical Approaches to Measuring Risk
include this in our model, including this analysis in a risk management framework is beneficial. The ability
to create stress tests on missed coupons and redemption assumptions at different call dates complements
a market-based risk analysis.
THE FUTURE OF COCOS
There have been positive steps to remove ambiguity around CoCo investing. For instance, the regula-
tory classification of CoCos has evolved, and currently under Basel III, there is increased transparency
concerning how CoCos qualify as either T2 or AT1 capital.
However, there remains a lack of standardization for CoCos in terms of trigger levels, loss-absorption
mechanisms, and necessary capital buffer levels. Greater standardization from regulators would benefit
investors and potentially enhance modeling techniques. For instance, the mechanics of coupon cancella-
tion are unclear. Providing transparency and regulation for the maximum distributable amount (MDA)
that governs the proportion of earnings that can be distributed as dividends, AT1 coupon payments
and bonuses would be beneficial. Regulatory-specified details of a MDA waterfall could be incorporated
into a risk framework of stress testing and pricing models. Regulators could also reduce the variability
on RWA calculation from bank’s internal models. This could be achieved to some extent by allowing
banks to estimate their own probability of defaults, but with loss given default parameters provided by
regulators.
With potentially more regulatory fine-tuning, it will be interesting to see how CoCos as an asset class
will evolve. As CoCos and CoCo regulation coevolve, our approach to pricing and risk modeling will also
continue to adapt in interesting ways.
18

AXIOMA COCO RISK: Practical Approaches to Measuring Risk
APPENDIX A
Spiegeleer and Schoutens [3] present two practitioners’ approaches to pricing CoCos, both of which are
based on observable market inputs. The first method is based on a credit derivatives framework while
the second approach is based on an equity derivatives framework.
In this note we will focus on the credit derivatives method outlined in [3] and present an extension based
on a random barrier. Since the publication of capital ratios has an inherent lag, the inclusion of an
uncertain barrier from a modeling perspective seems suitable.
In addition, we will present an approach based on a structural model. It is important to point out that
this version of the structural model is based on risk-neutral probabilities. In fact, the structural model
that we present will be similar to the credit derivatives approach: both will be calibrated from market
observables; in the case of credit derivatives an implied equity threshold is backed out while in the case
of the structural model, an implied leverage is backed out.
CREDIT DERIVATIVES APPROACH
In a reduced form approach, we model default as an exogenous process. Under a single period, we can
price a zero bond with unit notional as
e´pr`sqt “ e´rtrp1´ psurvqR` psurvs (4)
where r is the risk-free rate, s is the bond spread, t is the time to maturity, psurv is the survival probability,
and R is the recovery rate. From this equation we can obtain
s “ p1´Rqh (5)
where psurv “ e´ht. For a CoCo, we use the same credit derivative framework, but replace the default
intensity h with a trigger intensity hCoCo:
sCoCo “ p1´RCoCoqhCoCo (6)
Loss and conversion
The conversion price is defined as
X “N
n(7)
19

AXIOMA COCO RISK: Practical Approaches to Measuring Risk
where N is the notional and n is the conversion ratio of the CoCo. For a traditional convertible bond
(CB), it is in-the-money when the underlying stock price S is greater than the conversion price, i.e.,
S ą X, and out-of-the-money when S ă X. Unlike a traditional convertible bond where the investor
exercises conversion, a CoCo will either experience a write-down or forced conversion when the Core Tier
1 ratio drops below a threshold. This will occur at an unknown stock price S‹. The loss incurred by the
investor is
LCoCo “ N ´ nS‹ (8)
“ N
ˆ
1´S‹
X
˙
(9)
Thus the recovery rate in (6) is
RCoCo “S‹
X(10)
Barrier problem
The probability of equity hitting the trigger S‹ can be modeled as a first exit barrier problem. Given a
risk-neutral process for the equity
dS “ pr ´ qqSdt` σsSdW (11)
where r is the risk-free rate, q is the dividend rate, σs is the equity volatility, and W is Brownian motion,
we can show that the probability of survival is given by
psurvpt, S‹q “ Φ
˜
µt´ logpS‹
S q
σs?t
¸
´
ˆ
S‹
S
˙
2µ
σ2sΦ
˜
µt` logpS‹
S q
σs?t
¸
(12)
where µ “ r ´ q ´ σ2s{2 and Φ is the cumulative normal distribution. The trigger intensity and spread
are now given by
λCoCo “ ´1
tlogppsurvpt, S
sCoCo “ λCoCo p1´RCoCoq
(13)
(14)
Thus, given a CoCo bond spread, we can use (12)–(14) to back out an implied equity barrier S‹ that
corresponds to the trigger event. We can either fix the recovery rate or allow it to be a function of the
barrier:
RCoCo “
$
’
’
’
&
’
’
’
%
Rfixed for fixed recovery assumption
S‹{X otherwise
(15)
An example of different recovery rates is provided in Figure 1 at the end of this section.
20

AXIOMA COCO RISK: Practical Approaches to Measuring Risk
Random barrier problem
We can generalize the previous model (12)–(13) that was introduced by [3] to include uncertainty in
the estimation of S‹. Assume that the barrier S‹ is lognormally distributed with standard deviation
λS‹ :
S‹ “ ĎS‹ezλS‹´λ2S‹
2 (16)
where z is a normal random variable with mean zero and variance one. This is not an unreasonable
extension given that accounting information inherently lags. We can interpret λS‹ as the uncertainty in
balance sheet information and use it as a tuning parameter for the estimation of spread volatility. In this
version (12) becomes
psurvpt, S‹q “ Φ
˜
µt´ logpS‹
S q `λ2
2a
σ2s t` λ2
¸
´
ˆ
S‹
S
˙
2µ
σ2
eCΦ
¨
˝
µt` logpS‹
S q ´λ2
2 ` 2λ2 µσ2s
a
σ2s t` λ2
˛
‚ (17)
where
C “ λ2µ
σ2s
ˆ
´1` 2µ
σ2s
˙
(18)
Note that λ “ 0 reduces to the previous case. We provide an example in Figure 1, where the CoCo
spread is plotted as a function of the equity barrier S‹. As S‹ increases, the spread monotonically
increases.
EQUITY-TO-CREDIT (E2C)/CREDITGRADES STRUCTURAL MODEL
Under a structural model, the asset value of a firm is typically modeled as geometric Brownian motion
and default occurs when the asset value dips below the liability level of the firm. The key inputs to a
structural model are the asset value and asset volatility, both of which are unobservable. In a traditional
implementation, one estimates the asset value through consolidated balance sheet information. We differ
in our implementation in two important ways:
• Outputs of the model are risk-neutral probabilities and spreads
• Bypass the estimation of liability via balance sheet information; calibrate to the observed spread
by backing out an implied leverage
The structural model we present is a first exit barrier model, similar to the equity barrier model in the
previous section. See [5] and [9] for a description of the model mechanics. We present the key results
of the model, which we call the Equity-to-Credit (E2C) model, below.
21

AXIOMA COCO RISK: Practical Approaches to Measuring Risk
The survival probability of the E2C model is given by7
psurvpt, B‹q “ Φ
ˆ
´At2`
logpdq
At
˙
´ dΦ
ˆ
´At2´
logpdq
At
˙
(19)
where
d “V
B‹eλ
2(20)
At “a
σ2at` λ2 (21)
and the barrier follows a lognormal distribution such that ErBs “ B‹ and λ “ Stdev logB. The asset
value and volatility are estimated as follows:
V “ S `B‹ (22)
σa “ σs
ˆ
S
S `B‹
˙
(23)
Thus, as in the previous section, the survival probability (19) is a function of market observable inputs
and the barrier. Likewise, given the spread of the CoCo bond, we can back out a barrier; in this case,
an implied debt barrier.
Note that given all else equal, a CoCo with a greater spread will calibrate to an implied barrier that is
greater.
7See Finger [5] for a derivation.
22
AXIOMA COCO RISK: Practical Approaches to Measuring Risk
REFERENCES
[1] Basel Committee on Banking Supervision (2011). Basel III: A global regulatory framework for more
resilient banks and banking systems.
[2] De Spiegeleer, I. Marquet, and W. Schoutens (2014). Implied CET1 volatility. SSRN report
http://ssrn.com/abstract=2575558.
[3] De Spiegeleer, J. and W. Schoutens (2011). Pricing contingent convertibles: a derivatives approach.
SSRN report http://ssrn.com/abstract=1795092.
[4] De Spiegeleer, J., W. Schoutens, and C. Van Hulle (2014). The handbook of hybrid securities:
convertible bonds, coco bonds, and bail-in. Wiley Finance Series.
[5] Finger, C. (ed.) (2002). CreditGrades. Technical document, RiskMetrics Group.
[6] Metzler, A. and R.M. Ressor (2014). Valuation and analysis of zero-coupon contingent capital
bonds.
[7] Merton, R.C. (1974). On the pricing of corporate debt: the risk structure of interest rates. Journal
of Finance 29, 449–470.
[8] Pennacchi, G. (2011). A structural model of contingent bank capital. Working paper, University of
Illinois.
[9] Stamicar, R. and C. Finger (2006). Incorporating equity derivatives into the CreditGrades model.
Journal of Credit Risk 2(1).
23

AXIOMA COCO RISK: Practical Approaches to Measuring Risk REFERENCES
COCO RISK: Practical Approaches to Measuring Risk
By Axioma, Inc.
First published June 2016
This version published July 27, 2016
Copyright c© 2016 Axioma, Inc.
Axioma Risk, Axioma Portfolio Analytics, Axioma Portfolio
Optimizer, and Axioma Risk Model Machine are trademarks of
Axioma, Inc. All other company, organization, product, or
service names referenced herein may be trademarks of their
owners.
24

United States and Canada: +1 212-991-4500
Europe: +44 (0)20 7856 2424
Asia: +852-8203-27904New YorkAxioma, Inc.17 State StreetSuite 2700New York, NY 10004Phone: 212-991-4500Fax: 212-991-4539
FrankfurtAxioma Deutschland GmbHMainzer Landstrasse 41D-60329 Frankfurt am MainGermanyPhone: +49-(0)-69-95-925-162
AtlantaAxioma, Inc.400 Northridge RoadSuite 850Atlanta, GA 30350Phone: 678-672-5400Fax: 678-672-5401
ChicagoAxioma, Inc.2 N LaSalle StreetSuite 1400Chicago, IL 60602Phone: 312-448-3219Fax: 877-385-8919
GenevaAxioma CHRue du Rhone 69, 2nd Floor1207 Geneva, SwitzerlandPhone: +41-22-700-83-00
Hong KongAxioma, (HK) Ltd.Unit B, 17/F, Entertainment Bldg30 Queen’s Road CentralHong KongPhone: +852-8203-2790Fax: +852-8203-2774
LondonAxioma, (UK) Ltd.30 Crown PlaceLondon, EC2A 4EBPhone: +44-207-856-2424Fax: +44-(0)-20-3006-8747
MelbourneAxioma (AU) Ltd31st Floor120 Collins StreetMelbourne, VIC 3000AustraliaPhone: +61-(0)3-9225-5296
ParisAxioma (FR)19 Boulevard Malesherbes75008, Paris, France
Phone: +33-(0)-1-55-27-38-38
San FranciscoAxioma, Inc.201 Mission StreetSuite 2150San Francisco, CA 94105Phone: 415-614-4170Fax: 415-614-4169
SingaporeAxioma, (Asia) PTE Ltd.30 Raffles Place#23-00 Chevron HouseSingapore 048622Phone: +65-6233-6835Fax: +65-6233-6891
TokyoAxioma, JapanTekko Building 4F1-8-2 Marunouchi, Chiyoda-kuTokyo 100-0005JapanPhone: +81-6870-7766
Sales: [email protected] Client Support: [email protected] Careers: [email protected]


