108
August 2013 Coconino County Wildlife Connectivity Assessment: Detailed Linkages San Francisco Peaks to Mogollon Rim Linkage Design Arizona Game and Fish Department Coconino County

1
August 2013
Coconino County Wildlife Connectivity Assessment: Detailed Linkages
San Francisco Peaks to Mogollon Rim Linkage Design
Arizona Game and Fish Department
Coconino County

ii
SAN FRANCISCO PEAKS – MOGOLLON RIM
LINKAGE DESIGN
Prepared by
Jessica Gist and Mark Ogonowski
22 August 2013
iii
San Francisco Peaks – Mogollon Rim Linkage Design
ACKNOWLEDGEMENTS
This project would not have been possible without the help of many individuals:
The models and report developed by Jessica Gist and Mark Ogonowski followed closely the
methodology, terminology, and reporting format of Arizona’s Missing Linkages (AML), a
project funded by the Arizona Game and Fish Department (AGFD) and undertaken by Dr. Paul
Beier and colleagues at Northern Arizona University (www.corridordesign.org). Much of the
material presented herein including text and many figures is taken directly from previous AML
linkage reports by permission of the authors, for which we are most grateful.
Paul Beier, Emily Garding, Jeff Jenness, and Dan Majka provided guidance on GIS analyses.
Erika Nowak, Janet Lynn, Jeff Gagnon, and Scott Sprague reviewed portions of the results and
provided empirical data for model validation, and Sue Boe generously shared the results of
AGFD telemetry studies. Jeff Gagnon generously shared his I-40 crossing recommendations.
We thank Sylvester Allred, Melissa Amarello, Terry Arundel, Thomas Brennan, Jeff Corcoran,
Charles Drost, Andrew Edelman, Shaula Hedwall, Holly Hicks, Carrie King, Chad Loberger,
Lee Luedeker, Carl Lutch, Susi MacVean, Tom McCall, Emily Nelson, Erika Nowak, Justin
Schofer, and Mike Sredl for parameterizing focal species models and suggesting focal species.
Sarah Reif, Fenner Yarborough, Janet Lynn, Andi Rogers, Jeff Gagnon, and Larry Phoenix
helped identify focal species and provided species expertise.
Bill Noble provided both recommendation and inspiration for a future Interstate Highway 40
wildlife overpass.
Bill Knowles, Shea Meyer, Julie Mikolajczyk, Dean Pokrajac, Dana Warnecke, and Kelly Wolff-
Krauter provided technical, planning, editing, and implementation support.
John Aber, Tiffany Antol, Sue Pratt, and Bill Towler of the Coconino County Department of
Community Development helped prioritize linkages for modeling, and the County provided
necessary financial support through partial funding of Mr. Ogonowski’s position.
RECOMMENDED CITATION
Arizona Game and Fish Department. 2013. Coconino County Wildlife Connectivity Assessment:
Detailed Linkages. San Francisco Peaks – Mogollon Rim Linkage Design. Phoenix, Arizona.
GIS DATA
Accompanying GIS data for this linkage design are available from the Arizona Game and Fish
Department’s Habitat Branch by request.

iv
San Francisco Peaks – Mogollon Rim Linkage Design
TABLE OF CONTENTS
LIST OF TABLES ............................................................................................................. vi
LIST OF FIGURES .......................................................................................................... vii
TERMINOLOGY ............................................................................................................ viii
EXECUTIVE SUMMARY .................................................................................................1
INTRODUCTION ...............................................................................................................3
Habitat connectivity matters ........................................................................................................ 3
A statewide-to-local approach for conserving habitat connectivity in Arizona ........................... 4
STUDY AREA AND METHODS ......................................................................................6
Study area ..................................................................................................................................... 6
Delineation of wildland blocks .................................................................................................... 6
Focal species selection ................................................................................................................. 9
Modeling methods and field investigations ............................................................................... 10
RESULTS: LINKAGE DESIGN AND MODEL VALIDATION ....................................11
Linkage design ........................................................................................................................... 11
Model validation ........................................................................................................................ 13
Non-modeled areas important to wildlife movement ................................................................. 16
MANAGEMENT RECOMMENDATIONS ....................................................................17
Impacts of roads and railways on wildlife ................................................................................. 17
Types of roadway mitigation structures ..................................................................................... 18
Guidelines for implementing wildlife crossing structures ......................................................... 21
Existing roads affecting the linkage design ............................................................................... 23
Recommendations for crossing structures in the linkage design ............................................... 23
Urban and rural development as a barrier to wildlife movement ............................................... 27
Guidelines for mitigating impacts of urban and rural development ........................................... 29
Mitigating barriers from urban and rural development in the linkage planning area ................. 30
Summary: Using the linkage design as a planning tool ............................................................. 31

v
San Francisco Peaks – Mogollon Rim Linkage Design
APPENDIX A: LINKAGE DESIGN METHODS ............................................................33
Focal species selection ............................................................................................................... 33
Habitat suitability models .......................................................................................................... 34
Identifying potential breeding patches and potential population cores ...................................... 36
Identifying biologically best corridors ....................................................................................... 37
Patch configuration analysis ...................................................................................................... 39
Minimum linkage width ............................................................................................................. 40
Field investigations and empirical validation ............................................................................ 40
Creating a final linkage design ................................................................................................... 41
APPENDIX B: INDIVIDUAL SPECIES ANALYSES ....................................................42
APPENDIX C: NON-MODELED SPECIES WITHIN LINKAGE DESIGN ..................80
APPENDIX D: DESCRIPTION OF LAND COVER CLASSES .....................................81
APPENDIX E: CREATING A PERENNIAL WATERS DATASET ..............................86
APPENDIX F: LITERATURE CITED .............................................................................88

vi
San Francisco Peaks – Mogollon Rim Linkage Design
LIST OF TABLES
Table 1: Focal species selected for San Francisco Peaks – Mogollon Rim linkage design
Table 2: Characteristics which make species vulnerable to the three major direct effects of roads
Table 3: Habitat suitability scores and factor weights for each focal species
Table 4: Non-modeled species occurring in the linkage design which are of conservation concern
to state and federal management agencies

vii
San Francisco Peaks – Mogollon Rim Linkage Design
LIST OF FIGURES
Figure 1: Land ownership within the linkage planning area
Figure 2: Land cover within the linkage planning area
Figure 3: The linkage design between the San Francisco Peaks and Mogollon Rim wildland
blocks
Figure 4: Mule deer telemetry data validate modeled mule deer corridor
Figure 5: Relation of elk-vehicle collisions on Interstate Route 40 to elk corridor model
Figure 6: Non-modeled areas important to wildlife movement in the linkage planning area
Figure 7: Road mitigation structures
Figure 8: Desert bighorn sheep overpasses in northwestern Arizona
Figure 9: Highway underpasses linked by ungulate-proof fencing near Payson, Arizona Figure 10: Linkage design and biologically-best corridor for elk in relation to Interstate Highway 40
mileposts
Figure 11: Recommended crossing locations on Interstate Highway 40
Figure 12: Location photo and possible design of wildlife overpass near milepost 174 on
Interstate Highway 40
Figure 13: Elk crossings of U.S. Highway 180 northwest of Flagstaff, Arizona
Figure 14: Percent natural vegetation declines rapidly at housing densities greater than 1
dwelling unit per 40 acres
Figure 15: Habitat factors used to create habitat suitability models
Figure 16: Example moving window analysis used to calculate the average habitat suitability
surrounding a pixel
Figure 17: Creation of biologically best corridors
Figure 18: Modeled habitat suitability for Abert’s squirrel in the San Francisco Peaks –
Mogollon Rim Linkage
Figure 19: Modeled habitat suitability for Arizona black rattlesnake in the San Francisco Peaks –
Mogollon Rim Linkage
Figure 20: Modeled habitat suitability and biologically best corridor for badger in the San
Francisco Peaks – Mogollon Rim Linkage
Figure 21: Modeled habitat suitability and biologically best corridor for black bear in the San Francisco
Peaks – Mogollon Rim Linkage including bear observations on Camp Navajo Figure 22: Modeled habitat suitability and biologically best corridor for bobcat in the San
Francisco Peaks – Mogollon Rim Linkage
Figure 23: Modeled habitat suitability and biologically best corridor for elk in the San Francisco
Peaks – Mogollon Rim Linkage
Figure 24: Modeled habitat suitability for Gunnison’s prairie dog in the San Francisco Peaks –
Mogollon Rim Linkage
Figure 25: Modeled habitat suitability and biologically best corridor for mule deer in the San
Francisco Peaks – Mogollon Rim Linkage
Figure 26: Modeled habitat suitability for northern leopard frog in the San Francisco Peaks –
Mogollon Rim Linkage
Figure 27: Modeled habitat suitability and biologically best corridor for porcupine in the San
Francisco Peaks – Mogollon Rim Linkage
Figure 28: Modeled habitat suitability and biologically best corridor for pronghorn in the San
Francisco Peaks – Mogollon Rim Linkage

viii
San Francisco Peaks – Mogollon Rim Linkage Design
TERMINOLOGY
Biologically Best Corridor: Continuous swath of land expected to be the best route by which a
focal species can travel from a potential population core in one wildland block to a potential
population core in the other wildland block, and which may consist of 1 or more strands.
Focal Species: Species chosen to represent the needs of all wildlife in the linkage planning area
including a) species dependent on a single habitat type, b) area-sensitive species, and c) species
most sensitive to barriers. Focal species include “passage species” able to travel between
wildland blocks in days or weeks and “corridor dwellers” requiring multiple generations to move
between blocks. For some species GIS analysis may not produce a corridor model.
Habitat Connectivity: Extent to which an area of landscape facilitates ecological processes such
as wildlife movement, seed dispersal, and gene flow. Reduced by habitat fragmentation.
Habitat Fragmentation: Process through which previously intact areas of wildlife habitat are
divided into smaller disconnected areas by roads, urbanization, or other barriers.
Linkage Design: Land that if conserved will maintain or restore the ability of wildlife to move
between wildland blocks. A linkage design is produced by joining biologically best corridors for
focal species then modifying this area to delete redundant strands, avoid urban areas, include
parcels of conservation interest, and minimize edges.
Linkage Planning Area: The wildland blocks plus Potential Linkage Area. Implementing this
linkage design will enhance the biological diversity of the entire Linkage Planning Area.
Permeability: Opposite of travel cost; a perfectly permeable landscape would have a travel cost
of zero. Permeability refers to the degree to which landscapes are conducive to wildlife
movement and can sustain ecological processes.
Pixel: Smallest unit of area in a GIS map (30 meters by 30 meters in our analyses). Each pixel is
associated with a vegetation class, topographic position, elevation, and distance from paved road.
Potential Linkage Area: Land between wildland blocks where urbanization, roads, and other
activities threaten to prevent wildlife movement. Linkage designs conserve a portion of this area.
Travel Cost: Effect of habitat on a species’ ability to move through an area, reflecting quality of
food resources, suitable cover, and other resources. Our model assumes that habitat suitability is
the best indicator of the cost of movement through the pixel.
Wildland Blocks: Areas the linkage design connects. Wildland blocks can include varied land
ownership, but must be biologically important to focal species and likely to remain in relatively
natural condition for at least 50 years. Blocks may contain non-natural elements but have a long-
term prospect of serving as wildlife habitat, and their value is eroded if habitat connectivity
between them is lost. Tribal sovereignty includes the right to develop tribal lands within blocks.

1
EXECUTIVE SUMMARY
As western communities expand to accommodate growing populations, roads, urban and rural
developments, railways, energy facilities, and utility corridors create physical barriers that can
fragment habitat, isolate wildlife populations, and disrupt critical ecological processes. Habitat
fragmentation can be mitigated by conserving networks of large wildland blocks connected by
habitat corridors or linkages that promote the safe movement of wildlife while maintaining gene
flow, seed dispersal, and other processes. Such connected landscapes may also prove crucial in
helping wildlife populations adapt to shifts in vegetation and environmental conditions
associated with climate change. GIS-based linkage models provide a powerful tool for
identifying wildlife linkages, and can guide the siting of crossing structures and other actions.
In an effort to maintain habitat connectivity in northern Arizona the Arizona Game and Fish
Department collaborated with Coconino County to develop this GIS-based linkage design for
an area of conservation priority. At workshops held in 2009 and 2010 we convened
stakeholders with expertise in planning, wildlife conservation, land management,
transportation, and other areas to identify and map important wildlife movement areas across
Coconino County. Attendees identified the San Francisco Peaks to Mogollon Rim movement
area as a priority, a selection supported by County planners with knowledge of future growth
patterns and potential conservation opportunities.
We used least-cost corridor modeling (www.corridordesign.org) to identify lands to maintain
wildlife movement between two large areas of USFS-administered lands near the cities of
Flagstaff and Williams, Arizona. These “wildland blocks” encompass significant portions of the
Coconino and Kaibab National Forests, four federal wilderness areas, span a broad elevational
range, and provide habitat for diverse wildlife. Running east-west through the landscape
between the blocks are Interstate Route 40, the Burlington Northern Santa Fe railroad, and areas
of urban and rural development presenting obstacles to animal movement. Our linkage design
identifies areas which if conserved and enhanced will maintain animal movement patterns and
the overall biological integrity of this important area.
The linkage design is based on a focal species approach. We selected 11 species known to
inhabit both wildland blocks based on recommendations of workshop participants and other
agency and academic scientists including 9 mammals, 1 reptile, and 1 amphibian. The species
are sensitive to habitat loss and fragmentation and represent the range of habitat and movement
requirements of the region’s wildlife. Species such as pronghorn and mule deer are averse to
crossing roads, while black bear requires large areas to ensure population viability and
successful dispersal. Others such as Gunnison’s prairie dog and northern leopard frog require
specialized habitats and are threatened or rare. Thus the species used to create this linkage
design should provide for the connectivity needs of many others not modeled.
For each focal species we created habitat suitability models in ArcGIS using
www.corridordesign.org tools based upon habitat use information provided by species experts.
We selected patches of suitable habitat large enough to support breeding populations of each
species in the wildland blocks and used least-cost corridor techniques to model biologically-
optimal corridors between the blocks. We refined individual species’ corridor models with

2
San Francisco Peaks – Mogollon Rim Linkage Design
empirical data as available then combined these models to produce the multi-species linkage
design. For species requiring multiple generations to move between blocks (“corridor
dwellers”) we did not model corridors, but examined the distribution of suitable habitat to
ensure they were also accommodated by the linkage design.
Our linkage design includes three strands linking core habitats in the San Francisco Peaks and
Mogollon Rim wildland blocks. The strands encompass lands under diverse ownership
including public lands administered by the U.S. Forest Service and other agencies. Comparison
of our modeled focal species corridors with available location datasets provided a high degree
of validation for our design. Through field investigation and collaboration with the Arizona
Game and Fish Department Contracts Branch we also identified potential locations for
mitigation measures such as highway crossing structures at critical points in the modeled
linkage.
We believe that integrating empirical data with GIS-based linkage designs provides a powerful
way to mutually validate each approach, and can extend connectivity planning beyond those
species for which field data are available. We recommend this synergistic approach to
conserving connectivity for wildlife for other important wildlife movement areas in which the
Arizona Game and Fish Department and partners are working in other areas of the state.
This linkage design identifies areas that will maintain animal movements and ecological
processes if conserved and enhanced via land acquisition, conservation easements, zoning,
habitat restoration, fence removal and improvement, roadway crossing structures, and other
tools. We hope this report and GIS dataset will help guide regional landscape-scale planning
efforts and be integrated with future linkage designs to promote large-scale habitat connectivity.
Successful implementation will require the support of many partners. Fortunately, diverse
organizations and agencies including the Arizona Department of Transportation, Arizona Game
and Fish Department, Arizona State Land Department, Camp Navajo, City of Flagstaff,
Coconino County, Northern Arizona University Centennial Forest, U.S. Department of
Defense, U.S. Forest Service, U.S. Naval Observatory, U.S. Fish and Wildlife Service and
others are engaged in a range of conservation partnerships in the linkage planning on which to
build.

3
San Francisco Peaks – Mogollon Rim Linkage Design
INTRODUCTION
Habitat connectivity matters
All animals move across the landscape in order to acquire the resources necessary for survival
such as food, water, protective cover, and mates, and the distance and timing of animal
movements can vary considerably. Species such as mountain lion, black bear and mule deer
roam over vast expanses that can encompass thousands of acres, while smaller animals such as
Abert’s squirrel and northern leopard frog engage in essential movements on a much smaller
scale. Some animal movements occur on a daily basis, seasonal migrations occur annually,
while the dispersal of young from their natal sites to new breeding territories happens once in
an individual’s lifetime. These diverse movement patterns ensure individual survival, help
protect local populations from extinction (Laurance 1991, Beier and Loe 1992), enable gene
flow and reduce the risk of inbreeding (Beier and Loe 1992, Bennett 1999), and facilitate
critical ecological processes such as pollination and seed dispersal.
Roads, urban development, agriculture, energy production, and other land uses present barriers
to animal movement that can threaten the long-term persistence of wildlife populations and the
long-term stability of ecosystems (Noss 1983, Wilcox and Murphy 1985, Noss 1987, Bennett
1999, Henle et al. 2004, Noss and Daly 2006). The process through which previously intact
areas of habitat are divided into smaller disconnected areas by human activities is known as
habitat fragmentation. Habitat fragmentation can cause problems ranging from roadway
mortality to genetic isolation, and negatively impact human welfare by increasing the risk of
wildlife-vehicle collisions and the frequency of unwanted “close encounters” with wildlife.
The negative effects of habitat fragmentation can be mitigated by identifying and protecting
areas that wildlife use for movement, known as wildlife linkages or corridors (Beier and Noss
1998, Haddad et al. 2003, Eggers et al. 2009, Gilbert-Norton et al. 2010). Ridgelines, canyons,
riparian areas, cliffs, intact swaths of forest or grassland, and other features may function as
linkages and some species may spend their entire life cycle within a linkage rather than moving
through it (Perault and Lomolino 2000, Beier et al. 2007b). Wildlife linkages are most effective
when they connect relatively large and unfragmented areas of habitat known as wildland
blocks. Wildland blocks are areas large enough to sustain healthy wildlife populations and
essential ecological processes for the foreseeable future (Noss 1983, Noss and Harris 1986,
Noss 1987, Noss et al. 1996) and for which a relatively high measure of natural resource
protection exists.
Conserving wildlife linkages and the habitat blocks they connect may also help wildlife adapt to
climate change, by allowing populations to shift their range with latitude or elevation as the
distribution of vegetation communities and suitable environmental conditions changes (Hannah
et al. 2002, TWS 2004, Glick et al. 2009, Wildlands Network 2009). Climatologists agree that
global average temperatures will rise significantly over pre-industrial levels in coming decades
with attendant changes in regional climate (Millennium Ecosystem Assessment 2005, IPCC
2007, USGCRP 2009). Most climate models predict a hotter and drier Southwest (Seager et al.
2007, Mearns 2010, Overpeck and Udall 2010) and a likely increase in the frequency and
severity of wildland fires (Westerling et al. 2006, Marlon et al. 2012, Moritz et al. 2012).
Despite uncertainty about the direction and magnitude of local climatic changes, there can be

4
San Francisco Peaks – Mogollon Rim Linkage Design
no doubt that the regional distribution of vegetation types will be significantly different in
coming decades. The ponderosa pine forest which covers much of the linkage planning area
addressed in this report may be particularly vulnerable: some studies suggest these forests may
be threatened by climate change independent of increases in fire, insect outbreaks, and other
disturbances (Allen et al. 2010, Ironside et al. 2010). Including a diversity of aspects, slopes,
and elevation in a linkage design provides a better chance that the linkage will have most
vegetation types well-distributed along its length during coming decades of climate change. The
diversity of focal species we used ensures that our linkage design includes considerable
topographic and elevational diversity and thus should be resilient to future changes in
vegetation communities.
Maintaining wildlife linkages also benefits human communities, perhaps most obviously by
improving public safety. One study estimated that over 200 motorists are killed and
approximately 29,000 injured annually in the United States as a result of deer-vehicle collisions
alone (Conover 1995). Wildlife collisions are a significant problem in the area addressed by this
linkage design: from 2007 to 2009 over 190 wildlife-vehicle collisions occurred on Interstate
Highway 40 between Williams and Twin Arrows, the majority involving elk (Arizona Game
and Fish Department 2011a). Identifying wildlife movement areas that intersect transportation
corridors permits informed siting of wildlife over- and underpasses that can greatly reduce the
likelihood of collisions (Clevenger et al. 2001, Forman et al. 2003). This approach has proven
successful in Arizona along State Route 260 where a combination of underpasses and ungulate-
proof fencing reduced elk-vehicle collisions by 97% (Gagnon et al. 2010).
Identifying and conserving wildlife linkages can provide a number of other societal benefits to
Arizonans. These include helping municipal and county governments prioritize lands for
acquisition as open space and avoid land use decisions which could lead to conflicts with
wildlife. By helping to maintain healthy wildlife populations, linkage conservation provides
economic benefits given the significant contribution of wildlife-based recreation to the
economies of Coconino County and the state of Arizona (Southwick Associates 2003,
American Sportfishing Association 2007). In 2001 alone non-consumptive wildlife recreation
such as wildlife viewing generated an estimated $87 million in Coconino County (Southwick
Associates 2003) while fishing and hunting generated over $124 million, supported 1,860 jobs,
provided residents with $22 million in salary and wages, and generated $6 million in state tax
revenue (Silberman 2003).
A statewide-to-local approach for conserving habitat connectivity in Arizona
Habitat connectivity can be represented at various spatial scales. In Arizona, we have found it
valuable to identify habitat blocks and wildlife linkages at state, county, and local scales to
serve different conservation and planning objectives. The linkage planning tools created at each
scale have led to a progressive refinement of our knowledge of wildlife movement areas and
threats to habitat connectivity across the state, and the fine-scale linkage design presented in
this report owes much to the broader-scale efforts that preceded it.
Arizona’s wildlife linkage planning efforts began in 2004 when federal, state, municipal,
academic, and non-governmental biologists and land managers participated in a workshop to
map important habitat blocks, linkages, and potential threats to connectivity across the state.

5
San Francisco Peaks – Mogollon Rim Linkage Design
The Arizona Wildlife Linkages Workgroup represented a collaboration of the Arizona Game
and Fish Department, Arizona Department of Transportation, Federal Highways
Administration, Northern Arizona University, Sky Islands Alliance, US Bureau of Land
Management, US Fish and Wildlife Service, US Forest Service, and the Wildlands Network and
resulted in Arizona’s Wildlife Linkages Assessment (AWLA; Arizona Wildlife Linkages
Workgroup, 2006). The AWLA provides a vision for maintaining habitat connectivity in a
rapidly growing state and has served as the foundation for subsequent regional and local efforts,
including the creation of fine-scale GIS linkage designs by scientists at Northern Arizona
University (available at www.corridordesign.org) that provided the template for this report.
The statewide assessment was followed in 2008 by an effort to map wildlife linkages and
potential barriers within individual Arizona counties. The Arizona Game and Fish Department
partnered with counties to organize stakeholder workshops to create county-wide maps of
wildlife linkages (Arizona Game & Fish Department 2011b) and a list of priority linkages for
future fine-scale GIS modeling1. In Coconino County stakeholders highlighted the San
Francisco Peaks to Mogollon Rim linkage area as a high priority, a selection supported by
County planners with knowledge of future growth patterns and conservation opportunities. This
linkage design is the result.
1 A report describing the Coconino County workshops and resulting linkage data is available online at
http://www.azgfd.gov/w_c/conn_Coconino.shtml. This report, The Coconino County Wildlife Connectivity
Assessment, has informed local and regional planning efforts & led to creation of this linkage design.
6
San Francisco Peaks – Mogollon Rim Linkage Design
STUDY AREA AND METHODS
Study area
The linkage planning area spans three ecoregions of central Arizona: Arizona-New Mexico
Mountains, Apache Highlands North, and Colorado Plateau (descriptions taken from Arizona
Game and Fish Department 2006a). The majority of the planning area lies within the Arizona-
New Mexico Mountains Ecoregion which overall covers over 6 million acres in Arizona and
ranges from approximately 1,220 to over 3,700 meters (4,000 to 12,000 feet) in elevation. This
ecoregion includes extensive ponderosa pine forest, pinyon-juniper woodland and high
elevation grassland and features some of the most dramatic landforms in the state including the
Mogollon Rim at its southern boundary and the volcanic San Francisco Peaks, the highest point
in Arizona. The northwest and southwest corners of the linkage planning area transition into the
Apache Highlands North Ecoregion, spanning 9.4 million acres in Arizona ranging from
approximately 640 to 2,700 meters (2,100 to 8,800 feet). Landforms vary from rolling hills, flat
valleys, and broad plateaus to steep mountains and the rugged canyons of the Mogollon Rim.
The northeastern corner of the linkage planning area overlaps a small portion of the Colorado
Plateau Ecoregion, an area of extensive plains interspersed with canyons and buttes. The latter
two ecoregions span grassland, chaparral, pinyon-juniper, desertscrub and small areas of
ponderosa pine, mixed conifer, and oak woodlands.
The linkage planning area provides habitat for diverse wildlife including the federally-protected
Mexican spotted owl, roundtail chub, bald eagle, and San Francisco Peaks groundsel (USFWS
2013), and supports important game species and state species of concern. Our linkage design
does not directly address connectivity for native riparian species but perennial portions of the
Sycamore and Oak Creek drainages in the Mogollon Rim block support speckled dace, desert
sucker, Sonora sucker, narrow-headed garter snake, and lowland leopard frog.
Existing and potential barriers to wildlife movement in the potential linkage area include
Interstate Highway 40, the Burlington Northern Santa Fe Railroad, urban and rural development
around Flagstaff (U.S. Census Bureau 2011) and along the I-40 and I-17 corridors, expanded
military activities and infrastructure on Camp Navajo, fencing, OHV recreation, grassland
shrub encroachment, wildland fire, invasive species, and drought. The linkage planning area is
less-densely populated than Maricopa County to the south but is affected by Maricopa’s recent
explosive growth through purchases of first and second homes, greater highway traffic,
increased year-round recreation on national forest lands and wilderness areas, and other
impacts.
Delineation of wildland blocks
We defined two wildland blocks we named the San Francisco Peaks and Mogollon Rim blocks
after prominent landscape features (Figure 1). Each is primarily administered by the US Forest
Service—Kaibab National Forest to the west and Coconino National Forest to the east2. The
blocks do not have a formal designation but encompass lands providing habitat for diverse
wildlife expected to remain in good ecological condition into the future and are contiguous with
hundreds of thousands of additional acres of National Forest. We used major highways and
2 A very small part of the southwest corner of the Mogollon Rim block is administered by Prescott National Forest.

7
San Francisco Peaks – Mogollon Rim Linkage Design
Figure 1: Land ownership within the linkage planning area
8
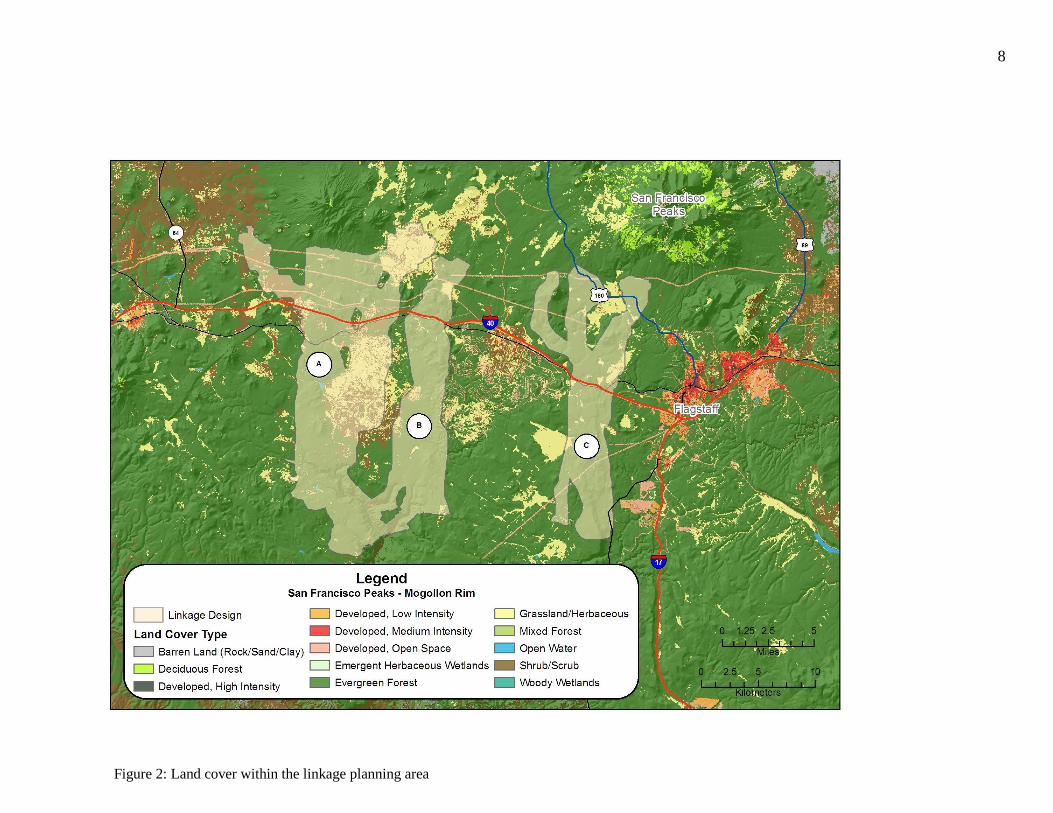
Figure 2: Land cover within the linkage planning area

9
National Forest and Wilderness boundaries to delimit the blocks, and retained private inholdings
where development is low-density and valuable wildlife habitat remains. We included state-
owned parcels managed by Northern Arizona University’s Centennial Forest in the Mogollon
Rim block. The blocks are separated by Interstate Highway 40, the Burlington Northern Santa Fe
railroad, and private, state, and federal lands developed to varying degrees.
The San Francisco Peaks wildland block encompasses 430,500 acres and includes prominent
volcanic mountains such as the San Francisco Peaks and Kendrick Peak. Elevation ranges from
approximately 1,750 to 3,850 meters (5,760 to over 12,630 feet) supporting high-elevation
grassland, pinyon-juniper woodland, ponderosa pine, aspen, mixed conifer, and alpine tundra
vegetation (Figure 2). This block includes the U.S. Forest Service-administered Kachina Peaks
(18,616 acres) and Kendrick Mountain (6,510 acres) Wilderness Areas. The Mogollon Rim
wildland block encompasses 241,200 acres and includes a significant portion of the Mogollon
Rim, a 320-kilometer long escarpment defining the southern edge of the Colorado Plateau.
Several major drainages including Sycamore Creek and Oak Creek leave the Mogollon Rim via
deep canyons in this block. Elevation ranges from 1,090 to 2,325 meters (3,575 to 7,630 feet)
supporting chaparral, grassland, pinyon-juniper woodland and ponderosa pine, and riparian
communities at lower elevations. This block includes the Sycamore Canyon (55,937 acres) and
Red Rock-Secret Mountain (47,194 acres) Wilderness Areas and is adjacent to the Munds
Mountain Wilderness Area (24,411 acres), all administered by the U.S. Forest Service.
The linkage planning area also includes several smaller conservation investments. The
Centennial Forest encompasses 22,269 acres of “checkerboard” State Trust and Forest Service
lands jointly administered by the Arizona State Land Department and Northern Arizona
University School of Forestry to serve research and teaching goals. The Coconino County Parks
and Recreation Department’s Pumphouse (128 acres) and Rogers Lake (2,490 acres) County
Natural Areas are managed for natural resource values including wildlife habitat. The Camp
Navajo Army National Guard training facility (28,255 acres) includes intact forest and
grasslands actively managed for wildlife.
Focal species selection
We selected 11 focal species known to inhabit both wildland blocks based on recommendations
of workshop participants and agency and academic scientists, including 9 mammals, 1 reptile,
and 1 amphibian (Table 1). Species selected are sensitive to habitat loss and fragmentation and
represent the range of habitat and movement needs of wildlife in the region. For example,
pronghorn and mule deer are averse to crossing roads, while black bear requires large areas to
ensure population viability and successful dispersal. Others such as Gunnison’s prairie dog and
northern leopard frog require specialized habitats and are threatened or rare. We included four
species (marked in Table 1 by a “*”) that we classified as “corridor dwellers” requiring multiple
generations to move between blocks. Other species were considered but not included due to a
lack of understanding of their habitat use, unavailability of GIS data to quantify habitat use, or
because they can likely travel (e.g. fly) across unsuitable habitat. Together the focal species
provide for the connectivity needs of many others not modeled but found locally.

10
San Francisco Peaks – Mogollon Rim Linkage Design
Table 1: Focal species selected for San Francisco Peaks – Mogollon Rim linkage design
Mammals Amphibians & Reptiles
Abert’s squirrel* Gunnison’s prairie dog* Arizona black rattlesnake*
badger mule deer northern leopard frog*
black bear porcupine
bobcat pronghorn
elk
*Species modeled as “corridor dwellers” requiring multiple generations to move between wildland blocks. For these
we modeled habitat suitability (not corridors) and verified that the linkage design included high quality habitat and
patches of adequate size.
Modeling methods and field investigations
For each focal species we created a habitat suitability model based on expert rankings of habitat
use of classes within up to 5 factors: land cover, elevation, topography, distance to roads, and
perennial water. Habitat suitability was modeled in ArcGIS using www.corridordesign.org tools
to create a weighted overlay of data layers corresponding to each factor, resulting in an overall
suitability score for each pixel in the analysis extent. We selected patches of suitable habitat
large enough to support breeding populations of each species in the wildland blocks. We then
used least-cost corridor modeling techniques to identify biologically-optimal corridors linking
breeding patches in the two blocks based on the modeled suitability scores. We only created
corridor models for species capable of moving between wildland blocks in a single generation.
We refined individual species’ corridor models with empirical data when available, then
combined all the species-specific corridors to produce the linkage design. For “corridor
dwellers” requiring multiple generations to traverse wildland blocks we did not model corridors.
Instead we examined the distribution of suitable habitat to verify that the linkage design included
high quality habitat and patches of adequate size for these species. (See Appendix A for full
details of our modeling methodology).
Through a combination of field investigations and recommendations provided by Arizona Game
and Fish Department colleagues (Gagnon et al. 2012), we also identified potential locations for
highway crossing structures and other mitigation at critical points in the final linkage design
which we detail below.
.

11
RESULTS: LINKAGE DESIGN AND MODEL VALIDATION
Linkage design
Our final linkage design (Figure 3) is composed of three strands linking core habitats for focal
species in the San Francisco Peaks and Mogollon Rim blocks across the Interstate 40 corridor.
The strands encompass 9,530 acres of ponderosa pine forest, mixed conifer forest, pinyon-
juniper woodland, grassland, canyon, and wetland habitats ranging in elevation from 1,570 to
2,590 meters (5,148 to 8,497 feet). We label these strands A, B, and C from west to east and
describe them in that order; strands A and B overlap at their southern end near the point where
each enters the Mogollon Rim block.
Strand A (“Garland Prairie Strand”) includes ponderosa
pine forest, pinyon-juniper woodland, high-elevation
grassland, and ephemeral wetland and provides live-in
and pass-through habitat for species utilizing these
habitat types. It is approximately 30 km long at its
greatest extent and is largely protected within the
Kaibab National Forest. This strand is composed of
biologically-best corridors for badger, black bear,
bobcat, elk, mule deer, porcupine, and pronghorn, and
provides breeding and dispersal habitat for corridor
dwellers including Abert’s squirrel, Arizona black
rattlesnake, and Gunnison’s prairie dog and potential
habitat for northern leopard frog. Strand A includes
relatively flat meadows including Government and
Garland Prairies, gentle forested slopes in its western
half, and it overlaps the Sycamore Canyon Wilderness
at its southern terminus.
Strand B (“Volunteer Mountain Strand”) follows the
wooded highlands on the western edge of the U.S.
Army’s Camp Navajo installation and is dominated by
ponderosa pine forest, with small areas of pinyon-juniper and grassland at its southern and
western edges, respectively. It is approximately 23 km long and much of it is protected by the
Kaibab and Coconino National Forests and NAU Centennial Forest, and includes undeveloped
portions of Camp Navajo not generally utilized for military operations. Strand B includes
biologically best corridors for black bear, bobcat, and mule deer and provides breeding and
dispersal habitat for corridor dwellers including Abert’s squirrel and Arizona black rattlesnake
and potential habitat for northern leopard frog. Strand B includes considerable areas of steep
slopes on its eastern flank including Volunteer Mountain and gentler terrain along its western
portion at Garland Prairie. This strand includes more rugged terrain at its southern terminus,
including the head of the Sycamore Canyon Wilderness and the portion of Volunteer Canyon
where this joins Sycamore Canyon.
LINKAGE DESIGN GOALS
Provide move-through habitat
for diverse species
Provide live-in habitat for
species with dispersal distances
too short to traverse linkage in
one lifetime
Provide adequate area for a
metapopulation of corridor-
dwelling species to move
through the landscape over
multiple generations
Buffer against edge effects
such as pets, lighting, noise,
nest predation & parasitism,
and invasive species
Allow animals and plants to
move in response to climate
change

12
San Francisco Peaks – Mogollon Rim Linkage Design
Figure 3: The linkage design between the San Francisco Peaks and Mogollon Rim wildland blocks
includes three strands each serving different species. A: Garland Prairie Strand; B: Volunteer
Mountain Strand; C: Woody Ridge Strand.

13
San Francisco Peaks – Mogollon Rim Linkage Design
Strand C (“Woody Ridge Strand”) encompasses most of north-south trending Woody Ridge east
of Camp Navajo. This area is predominantly ponderosa pine forest and of rugged topography.
Strand C is approximately 24 km long and largely protected by the Coconino National Forest and
NAU Centennial Forest, though the area just south of I-40 and east of Camp Navajo is
predominantly Arizona State Trust Land potentially vulnerable to development. Strand C
includes biologically best corridors for black bear, bobcat, mule deer, and porcupine, and
provides breeding and dispersal habitat for corridor dwellers including Abert’s squirrel and
Arizona black rattlesnake and potential habitat for northern leopard frog. Strand C includes the
most developed area of the linkage design on the western edge of Flagstaff, and includes an
important bottleneck where the BNSF Railroad crosses under I-40 near the U.S. Naval
Observatory. Strand C overlaps the ephemeral wetland of Rogers Lake and a west-east wildlife
movement area from this feature to the Dry Lake caldera.
The strands in this linkage design are wider on average than those described in many previously
published least-cost corridor linkage designs (e.g. Beier et al. 2008). Strand A for example
measures approximately 8 km at its widest point. This is a reflection of the number of modeled
species underlying our linkage design, our best judgment of the species-specific minimum
corridor widths needed to ensure their long-term functional integrity, and our desire to provide
maximum flexibility in facilitating collaboration among the range of land owners and
management agencies with jurisdiction in the potential linkage area.
Model validation
We used available data to inform and validate our linkage design. Camp Navajo biologists
shared camera trap data for black bear locations. Several of these locations overlapped Strand B
while others aligned with Volunteer Canyon, an area of more localized wildlife movement (see
Appendix B). Mule deer locations obtained from the Arizona Game and Fish Department’s
Contracts Branch strongly overlapped the easternmost strand of our modeled corridor for this
species, and guided a small extension of this strand where it crosses US Highway 180 just inside
the San Francisco Peaks block (Figure 4).
We also compared wildlife-vehicle collision data obtained data from the Arizona Department of
Transportation for Interstate Highway 40 with our modeled corridor for elk (Figure 5). These
data too support our modeling results. While significant numbers of elk collisions were reported
at several areas along I-40 for the study period, a peak is evident in the vicinity of milepost 175.
This milepost is included within our modeled biologically-best corridor for elk.

14
San Francisco Peaks – Mogollon Rim Linkage Design
Figure 4: Mule deer telemetry data (green dots) validate modeled mule deer corridor (white).

15
San Francisco Peaks – Mogollon Rim Linkage Design
a)
b)
Figure 5: Relation of elk-vehicle collisions on Interstate Route 40 to elk corridor model. a)
Wildlife-vehicle collisions between Ash Fork and Twin Arrows, AZ 1989-2006 (elk data in blue;
note circled peak at milepost 175). b) Modeled elk corridor includes milepost 175.
16
San Francisco Peaks – Mogollon Rim Linkage Design
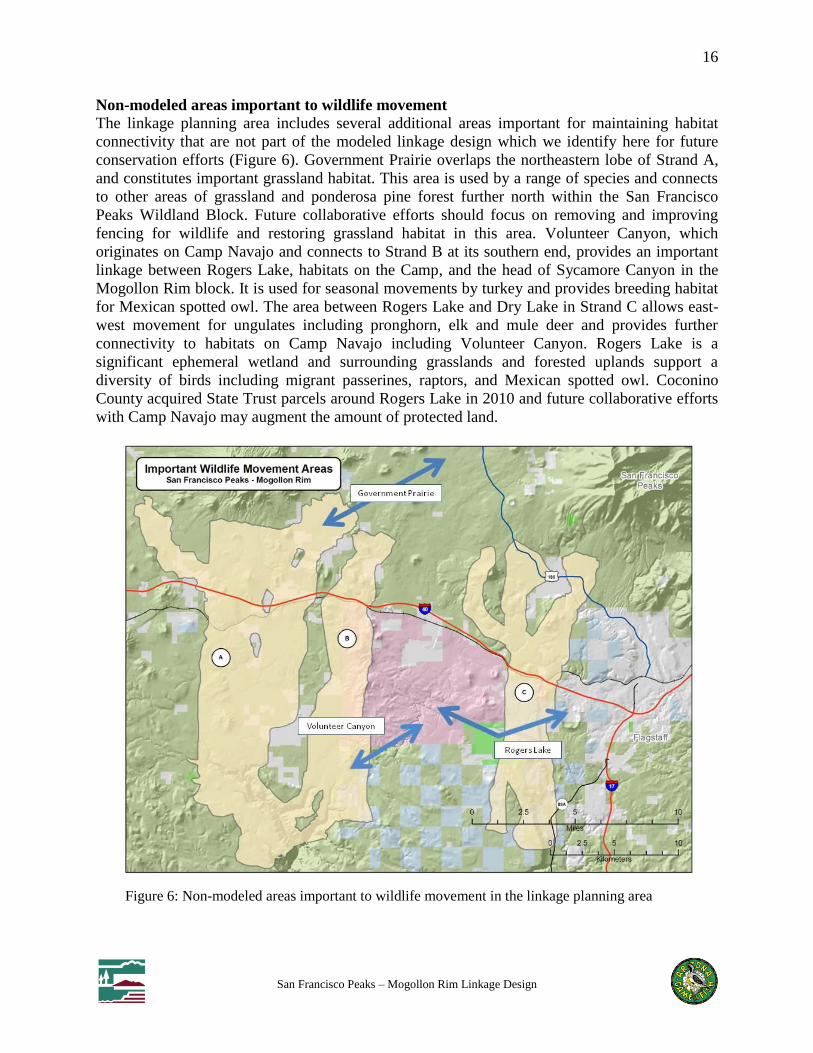
Non-modeled areas important to wildlife movement
The linkage planning area includes several additional areas important for maintaining habitat
connectivity that are not part of the modeled linkage design which we identify here for future
conservation efforts (Figure 6). Government Prairie overlaps the northeastern lobe of Strand A,
and constitutes important grassland habitat. This area is used by a range of species and connects
to other areas of grassland and ponderosa pine forest further north within the San Francisco
Peaks Wildland Block. Future collaborative efforts should focus on removing and improving
fencing for wildlife and restoring grassland habitat in this area. Volunteer Canyon, which
originates on Camp Navajo and connects to Strand B at its southern end, provides an important
linkage between Rogers Lake, habitats on the Camp, and the head of Sycamore Canyon in the
Mogollon Rim block. It is used for seasonal movements by turkey and provides breeding habitat
for Mexican spotted owl. The area between Rogers Lake and Dry Lake in Strand C allows east-
west movement for ungulates including pronghorn, elk and mule deer and provides further
connectivity to habitats on Camp Navajo including Volunteer Canyon. Rogers Lake is a
significant ephemeral wetland and surrounding grasslands and forested uplands support a
diversity of birds including migrant passerines, raptors, and Mexican spotted owl. Coconino
County acquired State Trust parcels around Rogers Lake in 2010 and future collaborative efforts
with Camp Navajo may augment the amount of protected land.
Figure 6: Non-modeled areas important to wildlife movement in the linkage planning area

17
San Francisco Peaks – Mogollon Rim Linkage Design
MANAGEMENT RECOMMENDATIONS
Roads, rail lines and developed lands occupy a fraction of the area within the linkage design yet
present significant obstacles to animal movement between the wildland blocks. Here we review
existing literature on impacts of such features on ecological processes, identify specific barriers
within the linkage design, and suggest mitigation options. It is important to realize that crossing
structures, while critical, are one of several measures needed to successfully implement this
linkage design. Investment in a crossing structure is futile if habitat between the structure and
either wildland block is lost, or if the wildland blocks themselves become developed. Ongoing
stewardship is also needed to maintain and improve permeability for wildlife, e.g. by removing
or redesigning fences and addressing impacts from irresponsible recreation, noise, lighting,
invasive species, unrestrained domestic pets, and other sources.
Impacts of roads and railways on wildlife
While the physical footprint of the over 4 million miles of roads in the United States is relatively
small their ecological influence extends much farther. Direct effects of roads include mortality,
habitat fragmentation and loss, and reduced connectivity. The severity of these effects depends
on species’ ecological characteristics (Table 2). Most species are vulnerable to direct roadkill,
with severe impacts documented for wide-ranging predators such as the cougar in southern
California, Florida panther, ocelot, wolf, and Iberian lynx (Forman et al. 2003). In a 4-year study
of 15,000 km of road observations in Organ Pipe Cactus National Monument, Rosen and Lowe
(1994) found an average of at least 22.5 snakes per km killed annually due to vehicle collisions.
We may not think of roads as causing habitat loss, but a single freeway (typical width = 50 m,
including median and shoulder) crossing diagonally across a 1-mi2 section of land results in the
loss of 4.4% of habitat area for species that cannot live in the right-of-way. Roads fragment
habitat by breaking large areas into small isolated patches supporting fewer individuals, and
these small populations can lose genetic diversity and are at risk of local extinction (Dodd et al.
2011, Theimer et al. 2012). Traffic volume likely contributes to fragmentation by reducing the
frequency with which wildlife cross busy highways (Gagnon et al. 2007). While the effects of
railways on wildlife are not well understood, it is likely that heavily-utilized rail lines have many
similar impacts as have been observed for roads.
In addition to these obvious effects roads create noise and vibration that interfere with ability of
reptiles, birds, and mammals to communicate, detect prey, or avoid predators. Roads also
increase the spread of exotic plants, promote erosion, create barriers to aquatic species, and
pollute water sources with roadway chemicals (Forman et al. 2003). Highway lighting also has
important impacts on animals (Rich and Longcore 2006).
Table 2: Characteristics which make species vulnerable to the three major direct effects of roads
(Source: Forman et al. 2003)
Species Characteristic
Effects of Roads
Road
mortality
Habitat loss Reduced
connectivity
Attraction to road habitat
High intrinsic mobility
Habitat generalist

18
San Francisco Peaks – Mogollon Rim Linkage Design
Multiple-resource needs
Large area requirements/low density
Low reproductive rate
Behavioral avoidance of roads
Types of roadway mitigation structures
A range of wildlife crossing structures including overpasses, “green bridges,” bridges, culverts,
and pipes have been used in North America and Europe to facilitate movement over or under
roads and railways (Figure 7). While many of these structures were not originally constructed
with ecological connectivity in mind they benefit many species (Clevenger et al. 2001; Forman
et al. 2003). No single structure will mitigate road barriers for all species. For example, rodents
prefer to use pipes and small culverts (McDonald & St Clair 2004) while bighorn have been
shown to use unvegetated overpasses in Arizona (Figure 8). A concrete box culvert may be
readily used by a mountain lion or bear, but not by a deer or bighorn sheep. A number of
crossing structures have been implemented successfully in Arizona (see below). Other strategies
have been employed where topography does not lend itself to under- or overpasses. Flashing,
motion-sensor warning signs coupled with fencing have proven effective at alerting motorists to
large animals approaching the roadway (Gagnon et al. 2010). These can be utilized on highways
with low traffic volumes, and provide low-cost interim solutions where major highway
improvements are not yet planned or financed.

19
San Francisco Peaks – Mogollon Rim Linkage Design
Figure 7: Road mitigation structures (top to bottom) include overpasses, bridges, culverts, and drainage
pipes. Fencing (lower right) is used to guide animals to structures. (Photographs from Beier et al. 2007a).

20
San Francisco Peaks – Mogollon Rim Linkage Design
Wildlife overpasses are most often designed to help large mammals cross busy highways.
Overpasses are typically 30-50 meters wide but can be as wide as 200 meters. In Banff National
Park, Alberta grizzly bears, wolves, and ungulates (bighorn sheep, deer, elk, and moose) prefer
overpasses while species such as mountain lion prefer underpasses (Clevenger & Waltho 2005).
In northwestern Arizona studies of desert bighorn sheep movements around State Route 93 near
the Hoover Dam informed design and construction of a series of overpasses and associated
directive fencing. Camera data have validated the efficacy of these structures in facilitating
bighorn movements (Figure 8; J.Gagnon, Arizona Game & Fish Department, pers. com.).
a) b)
Figure 8: Desert bighorn sheep overpasses in northwestern Arizona. Telemetry studies informed design
and siting of three overpasses and directive fencing along State Route 93. These structures have been
readily adopted by bighorn. a) Artist rendering of overpass. b) Bighorn ewe and lamb using overpass,
June 2012. (Source: Arizona Game and Fish Department Contracts Branch).
Wildlife underpasses include viaducts, bridges, culverts, and pipes typically designed to ensure
drainage beneath highways. For ungulates such as deer that prefer open crossing structures tall,
wide bridges are best. Mule deer in southern California only used underpasses below large
spanning bridges (Ng et al. 2004), and the average size of underpasses used by white-tailed deer
in Pennsylvania was 15 feet wide by 8 feet high (Brudin 2003). Because most small mammals,
amphibians, reptiles, and insects need vegetative cover for security, bridged undercrossings
should ideally extend to uplands beyond the scour zone of the stream and be high enough to
allow enough light for vegetation to grow underneath. In the Netherlands, rows of stumps or
branches under crossing structures have increased connectivity for smaller species crossing
bridges on floodplains (Forman et al. 2003). Black bear and mountain lion prefer less-open
structures (Clevenger & Waltho 2005). “Funnel fencing” can help guide animals to underpasses
and greatly improve their utilization. Along State Route 260 in Arizona, a series of underpasses
linked by ungulate-proof fencing has proven very successful in facilitating movements of large
mammals while conveying significant safety benefits to motorists, having reduced the frequency
of elk-vehicle collisions in the area by over 95% (Figure 9; Gagnon et al. 2010).

21
San Francisco Peaks – Mogollon Rim Linkage Design
a) b)
Figure 9: Highway underpasses linked by ungulate-proof fencing near Payson, Arizona along State Route
260 have reduced elk-vehicle collisions by over 95%. a) Bridge over Preacher Canyon on SR 260. b)
Fencing used to direct wildlife to underpasses. (Source: Arizona Game and Fish Department).
Bridges are a roads supported on piers or abutments, while a culvert is one or more round or
rectangular tubes under a road. The most important difference is that the streambed under a
bridge is mostly native rock and soil rather than the concrete or corrugated metal of culverts.
Even when rip-rap or other scour protection is installed to protect bridge piers or abutments,
stream morphology and hydrology usually return to near-natural conditions in bridged streams
and vegetation often grows beneath. In contrast vegetation does not grow inside culverts and
hydrology and stream morphology are permanently altered, not only within the culvert but for
some distance upstream and downstream from it.
Despite their disadvantages well-designed and sited culverts can mitigate the effects of busy
roads for small and medium sized mammals (Clevenger et al. 2001; McDonald & St Clair 2004).
Culverts and concrete box structures are used by many species including mice, shrews, foxes,
rabbits, armadillos, river otters, opossums, raccoons, ground squirrels, skunks, coyotes, bobcats,
mountain lions, black bear, great blue heron, long-tailed weasel, amphibians, lizards and snakes
(Yanes et al. 1995; Brudin III 2003; Dodd et al. 2004; Ng et al. 2004). In south Texas, bobcats
most often used 1.85 meters high by 1.85 meters wide box culverts to cross highways, preferred
structures near suitable scrub habitat, and sometimes used culverts to rest and avoid high
temperatures (Cain et al. 2003). Culvert usage can be enhanced by providing a natural substrate
bottom and establishing a ledge in locations where the culvert floor is persistently covered with
water (Cain et al. 2003). It is important for the lower end of a culvert to be flush with
surrounding terrain as scouring can undercut the culvert lip; many small mammals, snakes, and
amphibians are less likely to find or use suspended culverts.
Guidelines for implementing wildlife crossing structures
We offer the following research-based guidelines to assist with design and implementation of
wildlife crossing structures. The Arizona Game and Fish Department has also created guidelines
including detailed design specifications for design of bridges (AGFD 2008) and culverts (AGFD
2006b) to ensure their permeability for wildlife that are available through our website.

22
San Francisco Peaks – Mogollon Rim Linkage Design
1. Multiple crossing structures should be constructed to provide connectivity for all species
likely to use a given area (Little 2003). Different species prefer different types of structures
(Clevenger et al. 2001; McDonald & St Clair 2004; Clevenger & Waltho 2005; Mata et al.
2005). Open structure such as bridges best accommodate ungulates. For medium-sized
mammals, black bear, and mountain lions, large box culverts with natural substrate flooring
are optimal (Evink 2002). Small mammals tend to prefer pipe culverts from 0.3 meters to 1
meter in diameter (Clevenger et al. 2001; McDonald & St Clair 2004).
2. At least one crossing structure should be located within an individual’s home range. Because
most reptiles, small mammals and amphibians have small home ranges, metal or cement box
culverts should be installed at intervals of 150-300 meters (Clevenger et al. 2001). Larger
crossing structures such as bridges, viaducts, or overpasses that accommodate ungulates and
predators should be located no more than 1.5 km apart (Mata et al. 2005; Clevenger and
Wierzchowski 2006). Inadequate size and insufficient number of crossings are two primary
causes of poor use by wildlife (Ruediger 2001).
3. Suitable habitat should occur on both sides of a crossing structure (Ruediger 2001; Barnum
2003; Cain et al. 2003; Ng et al. 2004). This applies at both local and landscape scales. On a
local scale, vegetative cover appropriate to the target species should be present near entrances
to give animals security and reduce road-associated deterrents such as lighting and noise
(Clevenger et al. 2001; Cain et al. 2003; McDonald & St Clair 2004). On the landscape scale,
crossing structures are only as effective as the land and resource management strategies
around them (Clevenger et al. 2005). Suitable habitat must be present throughout the linkage
for animals to use a crossing structure.
4. Whenever possible, suitable habitat should occur within a crossing structure. This can best
be achieved by designing bridges high enough to allow light for vegetation to grow beneath
and to span upland habitat not regularly scoured by floods. If this is not possible rows of
stumps or branches under large span bridges can provide cover for smaller animals such as
reptiles, amphibians, rodents, and invertebrates; regular visits are needed to replace artificial
cover removed by flood. The type and amount of vegetation on wildlife overpasses should be
appropriate to the species for which the structure is intended. Within culverts, earthen floors
are preferred by mammals and reptiles.
5. Structures should be monitored for and cleared of obstructions such as detritus or silt
blockages that impede movement. Small mammals, carnivores, and reptiles avoid crossing
structures with significant detritus blockages (Yanes et al. 1995; Cain et al. 2003; Dodd et al.
2004). Bridged undercrossings rarely have similar problems.
6. Fencing should never block entrances to, but should direct animals toward, crossing
structures (Yanes et al. 1995). In Florida, construction of a barrier wall to guide animals to a
culvert system resulted in 93.5% reduction in roadkill and increased the number of species
using culverts from 28 to 42 (Dodd et al. 2004). In Arizona, use of ungulate-proof fencing to
guide animals to a below-grade underpass reduced elk-vehicle collisions by 97% (Gagnon et
al. 2010). Fences, guard rails, and embankments at least 2 meters high discourage animals
from crossing roads (Barnum 2003; Cain et al. 2003; Malo et al. 2004). One-way ramps on
roadside fencing allow animals to escape if trapped on a road (Forman et al. 2003).
7. Raised sections of road discourage animals from crossing roads and can encourage animals
to use crossing structures. Clevenger et al. (2003) found that vertebrates were 93% less
susceptible to road-kills on sections of road raised on embankments compared to road
segments at the natural grade of the surrounding terrain.
23
San Francisco Peaks – Mogollon Rim Linkage Design
8. Manage human activity near crossing structures. Clevenger & Waltho (2000) suggest that
human use of crossing structures be restricted and foot trails relocated away from structures
intended for wildlife, though large crossing structures (viaduct or long, high bridge) can
accommodate both recreational and wildlife use. Educating recreational users to maintain
utility of the structure for wildlife can create conservation allies. At a minimum, nighttime
human use of structures should be restricted.
9. Design culverts to provide for animal movement. Most culverts are designed to carry water
under roads and minimize erosion. Culvert designs adequate for transporting water often
have pour-offs at downstream ends that prevent wildlife usage. At least 1 culvert every 150-
300 meters of road should have openings flush with the surrounding terrain and native land
cover up to both culvert openings as noted above.
Existing roads affecting the linkage design
The principal roadway in the potential linkage area is Interstate 40 which crosses all three strands
of the linkage design for a total length of approximately 10.5 miles. The Burlington Northern
Santa Fe railroad, also a major barrier, roughly parallels I-40 for a total distance of
approximately 17 miles across the three linkage strands. Other roadways impacting the linkage
design are over 7 miles of U.S. Highway 180 in the northern portion of Strand C and
approximately 2.3 miles of U.S. Highway 89A in the extreme southeastern portion of this strand.
Local paved roads also intersect one or more of the linkage strands (e.g. State Route 66) as well
as a large number of tertiary roads maintained by the Coconino and Kaibab National Forests. The
recent implementation of Travel Management Rules (e.g. USDA 2012) has resulted in the
closure of many of these USFS routes which may have a positive effect on wildlife connectivity
within the strands of the linkage design.
Recommendations for crossing structures in the linkage design
Interstate Highway 40: Arizona Game and Fish Department biologists with support from the
Arizona Department of Transportation have studied large mammal movements along many of
Arizona’s major highways to define optimal locations for wildlife crossing structures (AGFD
2011a, AGFD 2012a, Gagnon et al. 2012). Their findings for Interstate Route 40 reinforce our
modeling results. Gagnon et al. (2012) evaluated our modeled biologically-best corridor for elk
by comparing several indices of elk use for 0.1 mile segments of I-40 within vs. outside both our
elk-specific corridor model and our multi-species linkage design (Figure 10). For our elk
biologically-best corridor, per-segment mean elk-vehicle collisions, mean elk approaches to the
highway, and mean rating scores (a composite of several parameters reflecting overall suitability
of the segment for a crossing structure) were all higher than for segments of I-40 outside the elk
corridor, validating our elk model and lending added support for Gagnon et al.’s crossing
recommendations (see below). No significant differences were observed in these elk parameters
for segments within vs. outside the multi-species linkage design.
24
San Francisco Peaks – Mogollon Rim Linkage Design
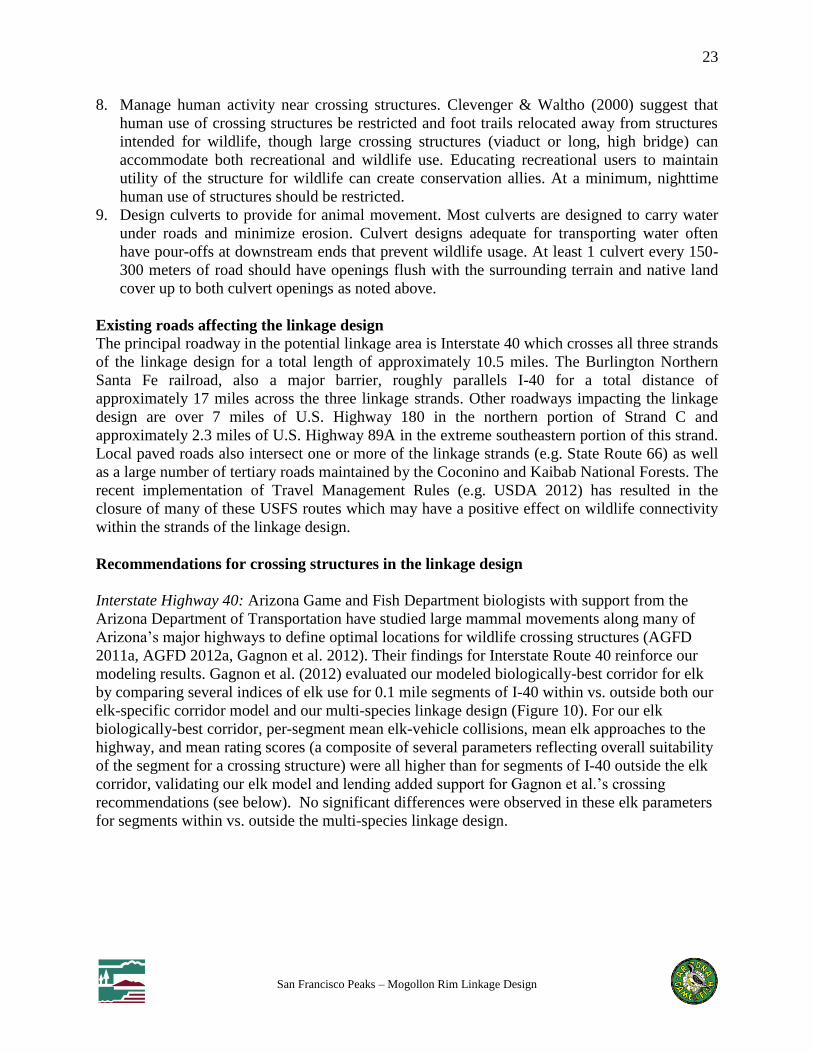
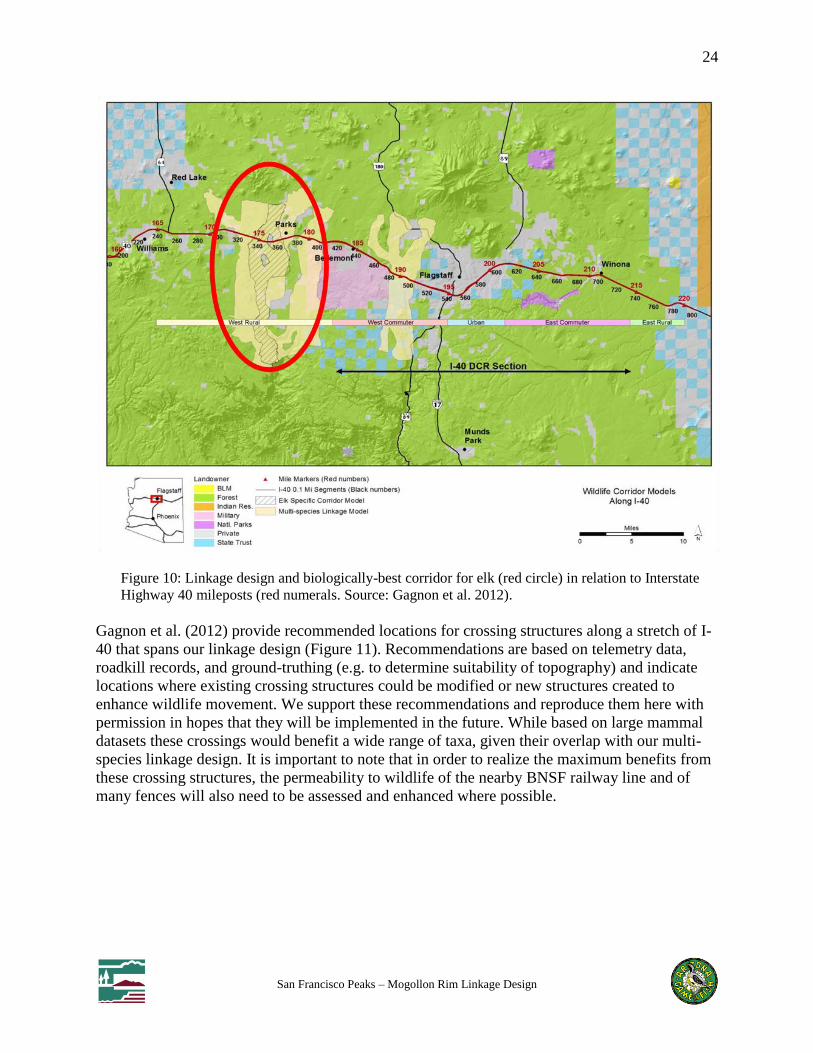
Figure 10: Linkage design and biologically-best corridor for elk (red circle) in relation to Interstate
Highway 40 mileposts (red numerals. Source: Gagnon et al. 2012).
Gagnon et al. (2012) provide recommended locations for crossing structures along a stretch of I-
40 that spans our linkage design (Figure 11). Recommendations are based on telemetry data,
roadkill records, and ground-truthing (e.g. to determine suitability of topography) and indicate
locations where existing crossing structures could be modified or new structures created to
enhance wildlife movement. We support these recommendations and reproduce them here with
permission in hopes that they will be implemented in the future. While based on large mammal
datasets these crossings would benefit a wide range of taxa, given their overlap with our multi-
species linkage design. It is important to note that in order to realize the maximum benefits from
these crossing structures, the permeability to wildlife of the nearby BNSF railway line and of
many fences will also need to be assessed and enhanced where possible.

25
San Francisco Peaks – Mogollon Rim Linkage Design
Figure 11: Recommended crossing locations on Interstate Highway 40 (Source: Gagnon et al. 2012).

26
San Francisco Peaks – Mogollon Rim Linkage Design
One of the crossing locations recommended by Gagnon et al. (2012) may have particular value
for serving multiple species, including pronghorn and other grassland taxa. This location has
been independently recommended by Kaibab National Forest biologists (B. Noble, pers. comm.;
Figure 12). The location is found east of milepost 174 in Strand A of the linkage design (marked
174.4 in Figure 11) and is immediately adjacent to our modeled biologically-best corridors for
both pronghorn and elk. Here I-40 passes through a roadcut of solid rock and the base material is
of similar height on both sides of the highway and in the median between east and westbound
lanes. These features could help support a wildlife overpass. Significant grasslands (Government
and Garland Prairies) are located north and south of the interstate and the adjacent land is under
U.S. Forest Service ownership. A crossing here could play a key role in restoring habitat
connectivity for what appear to be increasingly isolated pronghorn populations in this area (Dodd
et al. 2011, Theimer et al. 2012). Successful implementation will require significant financial
investment and substantial restoration treatments to remove encroached shrubs and create more
open grassland habitat on both sides of I-40.
a) b)
Figure 12: Location photo (a) and possible design (b) of wildlife overpass near milepost 174 on Interstate
Highway 40 (Source, b: Norris Dodd).
U.S. Highway 180: While the same level of analysis has not been applied to all roadways in the
linkage design, we wish to draw attention to U.S. Highway 180 where it crosses linkage Strand
C. High numbers of elk, mule deer and other species have been documented in this vicinity as
indicated by Arizona Game and Fish Department elk crossing data (Figure 13). Elk crossings
from 2009 to 2012 were highest between mile markers 224 and 226, a segment of Highway 180
which overlaps the middle lobe of linkage Strand C. In addition to providing empirical validation
for our linkage design these data reinforce the need to explore potential locations for wildlife
crossings and the impact of fencing in this important area.

27
San Francisco Peaks – Mogollon Rim Linkage Design
Figure 13: Elk crossings of U.S. Highway 180 northwest of Flagstaff, Arizona. Color reflects total
number of crossings in 0.1 mile segments, May 2009 to March 2012. (Source: AGFD Contracts Branch)
Urban and rural development as a barrier to wildlife movement
Urbanization ranges from low-density ranchette development to factories, gravel mines,
shopping centers, and high-density residential housing. These diverse land uses can impact
wildlife movement in several ways:
• Growth of local road networks. Rural subdivisions require more road length per dwelling
than more compact residential areas. Many animals are killed on roads, in some cases at
frequencies that significantly affect populations. Some reptiles are repelled even from
low-speed 2-lane roads (Findlay and Houlahan 1997). Species that avoid roads may not
experience high mortality but instead may become isolated by habitat fragmentation.
• Loss and fragmentation of natural vegetation. Conservation Biology Institute (2005)
evaluated 4 measures of habitat fragmentation in rural San Diego County: percent natural
habitat, mean patch size of natural vegetation, percent core areas (natural vegetation >30
meters from non-natural land cover), and mean core area per patch at 7 housing density
levels (Figure 14). Fragmentation was negligible in areas with <1 dwelling unit per 80
acres and severe in areas with >1 dwelling unit per 40 acres. Similar patterns with a
dramatic threshold at 1 unit per 40 acres were evident in 4 measures of fragmentation
across 60 landscapes studied (CBI 2005).

28
San Francisco Peaks – Mogollon Rim Linkage Design
Acres per dwelling unit Figure 14: Percent natural vegetation declines rapidly at housing densities greater than 1 dwelling unit per
40 acres (Source: CBI 2005).
• Decreased abundance and diversity of native species and replacement by non-natives
(Reed et al. 2012). In Arizona these trends were evident for birds (Germaine et al. 1998)
and lizards (Germaine and Wakeling 2001) and loss of native species increased as
housing density increased. Similar patterns were observed for birds and butterflies in
California (Blair 1996, Blair and Launer 1997, Merenlender et al. 1998, Blair 1999,
Rottenborn 1999, Strahlberg and Williams 2002, Merenlender et al. 2009), birds in
Washington state (Donnelly and Marzluff 2004), mammals and forest birds in Colorado
(Odell and Knight 2001, Hastings et al. 2006), and migratory birds in Ontario (Friesen et
al. 1995). Negative effects of urbanization were evident at densities as low as 1 dwelling
unit per 40-50 acres, with less impact below this threshold on birds and small mammals.
• Increased vehicle traffic, increasing mortality and repellent effects of roads (Van der Zee
et. al 1992).
• Increased numbers of dogs, cats, and other pets that kill millions of wild animals each
year (May and Norton 1996, Courchamp and Sugihara 1999).
• Increased numbers of wild predators removed for killing pets or hobby animals
(Woodroffe and Frank 2005).
• Subsidized “suburban native predators” such as raccoons, foxes, and crows that exploit
garbage and other sources to reach unnaturally high density, outcompeting and preying
on other native species (Crooks and Soule 1999).
• Spread of non-native plants that thrive on roadsides and other disturbed ground or are
deliberately introduced by humans.
• Perennial water in formerly ephemeral streams making them more hospitable to bullfrogs
and other non-native aquatic species that displace natives and reduce species richness
(Forman et al. 2003).
• Mortality of native plants and animals via pesticides and rodenticides, which kill not only
target species such as domestic rats but also secondary victims, e.g. raccoons and coyotes
that feed on poisoned rats, and tertiary victims, e.g. mountain lions that feed on raccoons
and coyotes (Riley et al. 2007).

29
San Francisco Peaks – Mogollon Rim Linkage Design
• Artificial night lighting which can impair the ability of nocturnal species to navigate
(Beier 1995, 2006) and negatively affect reptile populations (Perry and Fisher 2006).
• Conflicts with native herbivores feeding on landscape plants (Knickerbocker and
Waithaka 2005).
• Noise, which may disturb or repel some animals and present a barrier to movement
(Liddle 1997).
• Disruption of natural fire regimes by: increasing wildfire ignitions, especially outside the
natural burning season; increasing the need to suppress potentially beneficial fires that
can maintain natural ecosystem structure; and requiring firebreaks and vegetation
manipulation, sometimes at considerable distance from human-occupied sites.
Guidelines for mitigating impacts of urban and rural development
Unlike road impacts which can be mitigated with fencing and crossing structures, urban and rural
development create barriers to movement which often cannot be easily mitigated; avoidance is
the best way to manage these impacts in a wildlife linkage. Although some species such as
lizards and small mammals will occupy residential areas, most large carnivores, small mammals,
and reptiles cannot occupy or even move through urban areas. Where development does occur,
the following guidelines can help reduce the barrier effects of urban and rural development and
maintain habitat connectivity:
1. Use zoning and other tools to retain open space and natural habitat and discourage
urbanization of natural areas in the linkage design.
2. Encourage small building footprints on large (>40 acre) parcels with a minimal road network.
3. Encourage conservation easements, innovative cooperative agreements, and acquisition of
land from willing land owners in the linkage design.
4. Combine habitat conservation with compatible public goals e.g. recreation and protection of
water quality.
5. Plan trail systems in the linkage design to minimize resource damage and disturbance of
wildlife. Encourage users to stay on trails, keep dogs leashed, and travel in groups in areas
used by mountain lions or bears, and discourage visitors from collecting reptiles.
6. Where housing or other low-density development occurs enlist landowners as stewards of the
linkage. This can include landscaping with natural vegetation, managing fire risk, keeping
pets indoors or in enclosures (especially at night), maximizing personal safety with respect to
large carnivores by appropriate behaviors, using pesticides and rodenticides carefully, and
directing outdoor lighting toward houses and walkways and away from the linkage area.
7. Develop a public education campaign to inform those living and working within the linkage
area about living with wildlife and the importance of maintaining ecological connectivity.
8. Discourage residents and visitors from feeding or providing water for wild mammals or
otherwise allowing wildlife to lose their fear of people.
9. Install wildlife-proof trash and recycling receptacles and encourage secure garbage storage.
10. Do not install night lighting on rural roads passing through the linkage design. Reduce
vehicle speeds in sensitive locations by speed bumps, curves, artificial constrictions, etc.
11. Encourage use of wildlife-friendly fencing on property and pasture boundaries, and wildlife-
proof fencing around yards with domestic pets and potential wildlife attractants e.g. gardens.
12. Discourage the killing of ‘threat’ species such as rattlesnakes.

30
San Francisco Peaks – Mogollon Rim Linkage Design
13. Respect the property rights of people living in wildlife corridors. Work with homeowners and
residents to manage residential areas for wildlife permeability. Develop innovative programs
that respect the rights of residents and enlist them as stewards of the linkage area.
The Arizona Game and Fish Department has created documents outlining wildlife-friendly
design and building practices which can help maintain and enhance habitat connectivity in the
linkage planning area, including research-based design specifications. These include guidelines
for the design of wildlife-friendly bridges (AGFD 2008), culverts (AGFD 2006b), community
planning and project development (AGFD 2009a), and fencing (AGFD 2011c).
Mitigating barriers from urban and rural development in the linkage planning area
While developed areas currently account for a small proportion of the land cover within the
linkage design, residential and commercial development could increase in the future. Much of
the area in all three linkage strands is under the ownership of the Kaibab and Coconino National
Forests and is expected to remain protected in the future, but private inholdings are scattered
throughout. Future growth in these pockets, particularly if in proximity to proposed wildlife
crossings along I-40, could compromise the long-term integrity of the linkage and the mitigation
actions proposed above. Proactive planning, open space management, and wildlife-friendly
design of future housing developments will help maintain habitat connectivity. Significant
portions of Strands B and C are under Department of Defense and Arizona State Land
Department ownership, respectively. Collaborative multiparty conservation efforts and future
protection of some of these lands as protected open space will likely be necessary.
Land management and acquisition in each strand of the linkage design
Strand A traverses the most rural portion of the linkage design but may present a unique
conservation challenge. This strand includes the biologically best corridor for pronghorn,
probably the most barrier-sensitive of the species we modeled. Developed areas in Strand A
include Pittman Valley and Parks adjacent to Interstate 40, and Parks is located between the
grasslands of Government Prairie to the north and Garland Prairie south of I-40. Extensive
fencing also exists for livestock and property boundaries. Fences may be designed or retrofitted
to be more wildlife-permeable but this will require significant investment. To optimize use of the
proposed I-40 overpass at mile 174.4 (described above) by pronghorn and other grassland
species, extensive thinning in adjacent areas of National Forest will likely be required.
Land ownership in Strand B is primarily divided between National Forest (Kaibab and
Coconino) and U.S. Army Camp Navajo, with a small portion of the NAU Centennial Forest
included at its southern terminus. These areas are not under immediate threat from development,
and stakeholder collaboration can help to ensure that future changes to training operations or
land use on the Camp are compatible with landscape permeability for wildlife, in particular
bobcat, black bear and mule deer. The U.S. Army is also exploring future acquisition of
conservation easements for private inholdings on the western side of the Camp through its Army
Compatible Use Buffer (ACUB) program.
Strand C includes two areas of potential vulnerability to future development. Small private
inholdings exist adjacent to the U.S. Naval Observatory where the BNSF railroad line passes
beneath Interstate 40. This underpass likely represents a bottleneck in Strand C where telemetry

31
San Francisco Peaks – Mogollon Rim Linkage Design
and wildlife camera data have documented a variety of species traveling under the highway.
There is also a cluster of Arizona State Trust Land parcels south and west of the Naval
Observatory and east of Camp Navajo which include developable lands. Key parcels in both of
these areas should be prioritized for future acquisition.
City and County discretionary permitting and land use planning
Design features which maintain wildlife movement areas can be incorporated into individual
projects including residential subdivisions. Coconino County’s award-winning Comprehensive
Plan is grounded in a conservation framework that integrates consideration of natural resource
features including wildlife corridors into land use decisions and project planning (CCCPP 2003).
Coconino County promotes the use of integrated conservation design for residential subdivisions
whereby wildlife corridors, wetlands and springs, and other sensitive habitat features are
conserved while developers are given flexibility in the siting and density of homesites. Recent
studies indicate that such developments are most effective when the ecosystem context and the
relation of the conserved open space to the surrounding landscape are considered during project
planning (Wortman-Wunder 2012). We hope that this linkage design and report will be
incorporated as a supporting resource for the forthcoming revision of the Comprehensive Plan.
The City of Flagstaff has incorporated goals and policies for promoting wildlife habitat
connectivity in the “Environmental Planning and Conservation” and “Open Space” elements of
its revised Draft Regional Land Use Plan currently in review (City of Flagstaff 2013). The “Open
Space” element promotes use of tools such as conservation easements, transfer of development
rights, and prioritizing parcels that overlap wildlife corridors for future acquisition as open space.
The Draft Plan also includes Arizona Game and Fish Department wildlife corridor GIS data as a
layer in its composite map of important natural resources, proposed to be considered in project
permitting and planning, and the City assessed potential impacts to mapped corridors in
modeling the consequences of various development patterns during Plan development.
Summary: Using the linkage design as a planning tool
This San Francisco Peaks-Mogollon Rim linkage design is a biologically-based plan for
conservation action in central Coconino County. It can be integrated into local and regional
planning efforts by government planners, state and federal land managers, and conservation
organizations as a recommendation to protect habitats and landscape connections that maintain
regional biodiversity and ecosystem processes. The Coconino County Comprehensive Plan and
the City of Flagstaff’s Regional Land Use Plan acknowledge the importance of wildlife
movement areas and include policies and planning tools aimed at their conservation. The U.S.
Forest Service, managing the Coconino and Kaibab National Forests and the majority of the
linkage planning area, has incorporated existing Arizona Game and Fish Department linkage
data into its resource management and wilderness plans for the region, and into proposed
treatment prescriptions developed for the ambitious multiple stakeholder Four Forests
Restoration Initiative. The Forest Service can use this linkage design to further refine elements of
its plans and prescriptions that address the maintenance of wildlife habitat connectivity.
This linkage design may inform barrier mitigation, including the crossing structures
recommended above, and habitat improvement efforts such as removing and retrofitting fencing
to “wildlife-friendly” specifications. The Arizona Department of Transportation is providing

32
San Francisco Peaks – Mogollon Rim Linkage Design
considerable financial support to Arizona Game and Fish Department biologists to determine
movement patterns of large mammals and identify locations for wildlife crossings along
Interstate Highway 40. Our linkage design is being used to reinforce this research and to identify
species not studied directly that may benefit from proposed crossings. This linkage design can
also inform habitat restoration projects to maximize wildlife benefits. A partnership between the
Arizona Wildlife Federation, National Forest Foundation, Arizona Game and Fish Department,
and U.S. Forest Service has used this linkage design to guide fence removal and road closures in
support of Four Forests Restoration Initiative goals for improving wildlife habitat. This linkage
designs may also guide and support regional land acquisition, conservation easements, open
space management, and zoning. The City of Flagstaff, Coconino County, and U.S. Department
of Defense are pursuing various open space acquisitions and easements in the linkage area.
Finally, it is important to remember that the benefits of wildlife linkages can only be fully
realized if the habitat blocks they connect also remain protected and effectively managed for
wildlife. It is our hope that over time this project and others will contribute to a more complete
picture of connected habitats in northern Arizona, and facilitate planning at multiple scales that
recognizes the importance of interconnected habitats for the benefit of both wildlife and society.

33
San Francisco Peaks – Mogollon Rim Linkage Design
APPENDIX A: LINKAGE DESIGN METHODS Our goal was to identify continuous corridors of land that, if conserved with appropriate
mitigation of potential barriers, will best maintain or restore habitat linking two protected
wildland blocks. We call these proposed corridors the linkage design.
To create the linkage design we employed GIS-based techniques and a focal species approach,
integrated with the best available data and wildlife expertise, to model optimal travel routes for
species representing the ecological community of the region3. By carefully selecting a diverse
group of focal species the linkage design should ensure the long-term viability of all species in
the study area, including those for which we did not develop models. Our approach followed
these general steps:
1) Select focal species
2) Create habitat suitability models for each focal species
3) Identify potential breeding patches and potential population cores of suitable habitat in
each wildland block
4) Identify the biologically best corridor (BBC) through which each focal species could
move between cores in the wildland blocks; join these BBCs for all focal species
5) Ensure that the union of BBCs includes enough population patches and is wide enough to
accommodate all focal species
6) Carry out field visits to identify barriers to movement and potential mitigation sites
Focal species selection
The focal species concept assumes that a carefully selected set of diverse species will represent
the needs of an entire biological community (Lambeck 1997). Biologists familiar with the
region’s taxa identified species meeting one or more of the following criteria:
• Habitat specialists, especially of habitats that may be relatively rare in the potential
linkage area.
• Barrier sensitive species averse to highways, canals, urbanization, or other potential
barriers in the potential linkage area, especially species with limited movement ability.
• Species with large home ranges requiring expansive and well-connected landscapes to
maintain a viable population and genetic diversity.
• Ecologically-important and keystone species such as top predators, important seed
dispersers, and species that affect vegetation, soil structure, or other ecosystem processes.
• Species of concern to management agencies, such as those listed as threatened or
endangered by the US Fish and Wildlife Service under the Endangered Species Act and
species of special concern to the Arizona Game and Fish Department or US Forest
Service.
3 Like every scientific model, our models involve uncertainty and simplifying assumptions, and therefore do not
produce absolute “truth” but rather an estimate or prediction of the optimal wildlife corridor. Despite this limitation,
there are several reasons to use models instead of maps hand-drawn by species experts or other intuitive approaches.
(1) Developing the model forces important assumptions into the open. (2) Using the model makes us explicitly deal
with interactions (e.g., between species movement mobility and corridor length) that might otherwise be ignored. (3)
The model is transparent, with every algorithm and model parameter available for anyone to inspect and challenge.
(4) The model is easy to revise when better information is available.
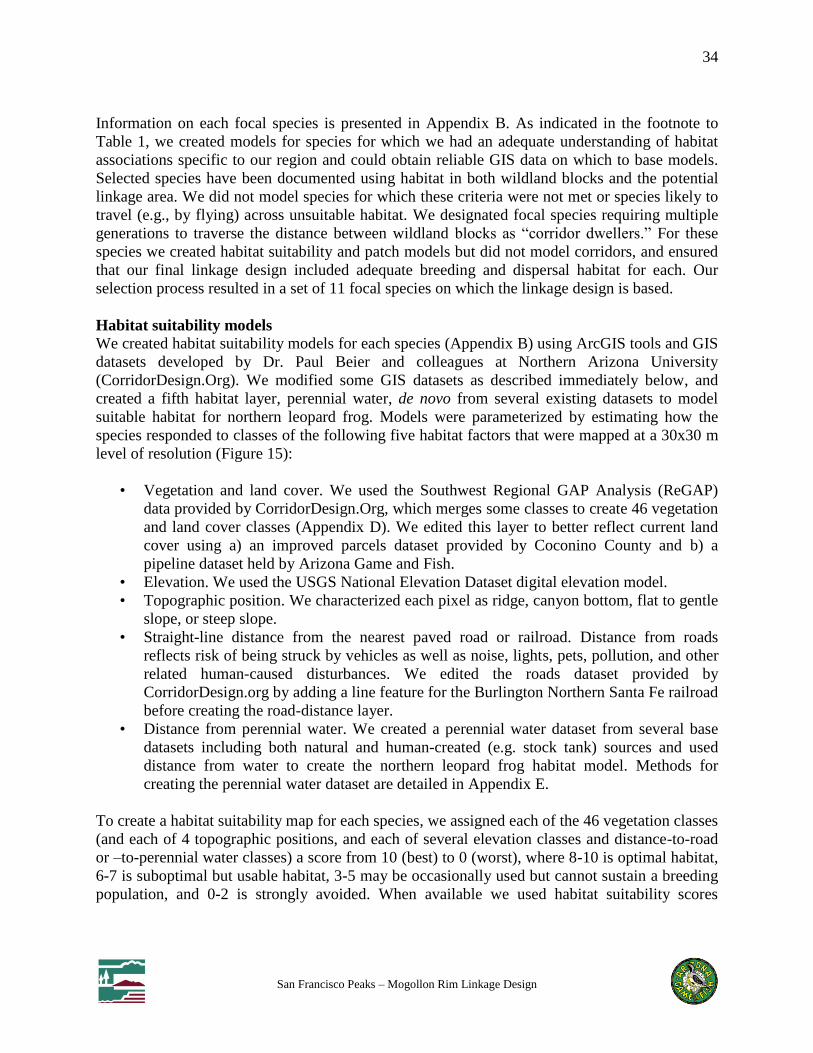
34
San Francisco Peaks – Mogollon Rim Linkage Design
Information on each focal species is presented in Appendix B. As indicated in the footnote to
Table 1, we created models for species for which we had an adequate understanding of habitat
associations specific to our region and could obtain reliable GIS data on which to base models.
Selected species have been documented using habitat in both wildland blocks and the potential
linkage area. We did not model species for which these criteria were not met or species likely to
travel (e.g., by flying) across unsuitable habitat. We designated focal species requiring multiple
generations to traverse the distance between wildland blocks as “corridor dwellers.” For these
species we created habitat suitability and patch models but did not model corridors, and ensured
that our final linkage design included adequate breeding and dispersal habitat for each. Our
selection process resulted in a set of 11 focal species on which the linkage design is based.
Habitat suitability models
We created habitat suitability models for each species (Appendix B) using ArcGIS tools and GIS
datasets developed by Dr. Paul Beier and colleagues at Northern Arizona University
(CorridorDesign.Org). We modified some GIS datasets as described immediately below, and
created a fifth habitat layer, perennial water, de novo from several existing datasets to model
suitable habitat for northern leopard frog. Models were parameterized by estimating how the
species responded to classes of the following five habitat factors that were mapped at a 30x30 m
level of resolution (Figure 15):
• Vegetation and land cover. We used the Southwest Regional GAP Analysis (ReGAP)
data provided by CorridorDesign.Org, which merges some classes to create 46 vegetation
and land cover classes (Appendix D). We edited this layer to better reflect current land
cover using a) an improved parcels dataset provided by Coconino County and b) a
pipeline dataset held by Arizona Game and Fish.
• Elevation. We used the USGS National Elevation Dataset digital elevation model.
• Topographic position. We characterized each pixel as ridge, canyon bottom, flat to gentle
slope, or steep slope.
• Straight-line distance from the nearest paved road or railroad. Distance from roads
reflects risk of being struck by vehicles as well as noise, lights, pets, pollution, and other
related human-caused disturbances. We edited the roads dataset provided by
CorridorDesign.org by adding a line feature for the Burlington Northern Santa Fe railroad
before creating the road-distance layer.
• Distance from perennial water. We created a perennial water dataset from several base
datasets including both natural and human-created (e.g. stock tank) sources and used
distance from water to create the northern leopard frog habitat model. Methods for
creating the perennial water dataset are detailed in Appendix E.
To create a habitat suitability map for each species, we assigned each of the 46 vegetation classes
(and each of 4 topographic positions, and each of several elevation classes and distance-to-road
or –to-perennial water classes) a score from 10 (best) to 0 (worst), where 8-10 is optimal habitat,
6-7 is suboptimal but usable habitat, 3-5 may be occasionally used but cannot sustain a breeding
population, and 0-2 is strongly avoided. When available we used habitat suitability scores
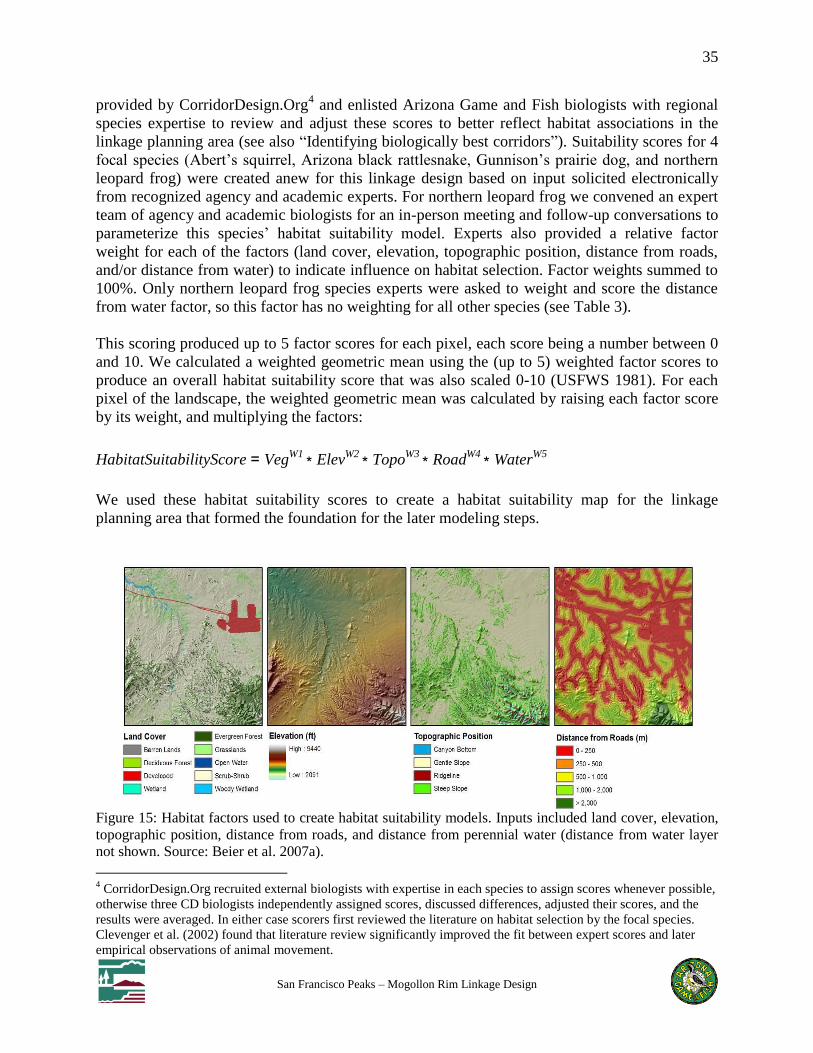
35
San Francisco Peaks – Mogollon Rim Linkage Design
provided by CorridorDesign.Org4 and enlisted Arizona Game and Fish biologists with regional
species expertise to review and adjust these scores to better reflect habitat associations in the
linkage planning area (see also “Identifying biologically best corridors”). Suitability scores for 4
focal species (Abert’s squirrel, Arizona black rattlesnake, Gunnison’s prairie dog, and northern
leopard frog) were created anew for this linkage design based on input solicited electronically
from recognized agency and academic experts. For northern leopard frog we convened an expert
team of agency and academic biologists for an in-person meeting and follow-up conversations to
parameterize this species’ habitat suitability model. Experts also provided a relative factor
weight for each of the factors (land cover, elevation, topographic position, distance from roads,
and/or distance from water) to indicate influence on habitat selection. Factor weights summed to
100%. Only northern leopard frog species experts were asked to weight and score the distance
from water factor, so this factor has no weighting for all other species (see Table 3).
This scoring produced up to 5 factor scores for each pixel, each score being a number between 0
and 10. We calculated a weighted geometric mean using the (up to 5) weighted factor scores to
produce an overall habitat suitability score that was also scaled 0-10 (USFWS 1981). For each
pixel of the landscape, the weighted geometric mean was calculated by raising each factor score
by its weight, and multiplying the factors:
HabitatSuitabilityScore = VegW1 ∗ Elev
W2 ∗ TopoW3 ∗ Road
W4 ∗ WaterW5
We used these habitat suitability scores to create a habitat suitability map for the linkage
planning area that formed the foundation for the later modeling steps.
Figure 15: Habitat factors used to create habitat suitability models. Inputs included land cover, elevation,
topographic position, distance from roads, and distance from perennial water (distance from water layer
not shown. Source: Beier et al. 2007a).
4 CorridorDesign.Org recruited external biologists with expertise in each species to assign scores whenever possible,
otherwise three CD biologists independently assigned scores, discussed differences, adjusted their scores, and the
results were averaged. In either case scorers first reviewed the literature on habitat selection by the focal species.
Clevenger et al. (2002) found that literature review significantly improved the fit between expert scores and later
empirical observations of animal movement.

36
San Francisco Peaks – Mogollon Rim Linkage Design
Identifying potential breeding patches and potential population cores
The habitat suitability map provides scores for each 30x30-m pixel. For our analyses, we also
needed to identify – both in the wildland blocks and in the potential linkage area – areas of good
habitat large enough to support reproduction. Specifically, we wanted to identify:
Potential breeding patches: areas large enough to support a breeding unit (individual
female with young, or a breeding pair) for one breeding season. Such patches could be
important stepping-stones for species that are unlikely to cross a potential linkage area
within a single lifetime.
Potential population cores: areas large enough to support a breeding population of the
focal species for about 10 years.
To do so, we first calculated the suitability of any pixel as the average habitat suitability in a
neighborhood of pixels surrounding it (Figure 16). We averaged habitat suitability within a 3x3-
pixel neighborhood (90 x 90 m2, 0.81 ha) for less-mobile species, and within a 200-m radius
(12.6 ha) for more-mobile species5. Thus each pixel had both a pixel score and a neighborhood
score. Then we joined adjacent pixels of suitable habitat (pixels with neighborhood score > 6)
into polygons that represented potential breeding patches or potential population cores. The
minimum sizes for each patch type were specified by the biologists who provided scores for the
habitat suitability model.
Figure 16: Example moving window analysis used to calculate the average habitat suitability surrounding
5 An animal that moves over large areas for daily foraging perceives the landscape as composed of relatively large
patches, because the animal readily moves through small swaths of unsuitable habitat in an otherwise favorable
landscape (Vos et al. 2001). In contrast, a less-mobile animal has a more patchy perception of its surroundings.
Similarly, a small island of suitable habitat in an ocean of poor habitat will be of little use to an animal with large
daily spatial requirements, but may be sufficient for the animal that requires little area.

37
San Francisco Peaks – Mogollon Rim Linkage Design
a pixel. a) original habitat suitability model, b) 3x3-pixel moving window, c) 200m radius moving
window. (Source: Beier et al. 2007a). [NOTE: Numeric scoring ranges shown are those used in prior
CorridorDesign.Org linkage reports and do not reflect the opposite 10-0 scaling used in this design, but
the color scheme and conceptual illustration accurately reflect the methods we used].
Identifying biologically best corridors
The biologically best corridor6 (BBC) is a continuous swath of land that is predicted to be the
best (highest permeability, lowest cost of travel) route for a species to travel from a potential
population core in one wildland block to a potential population core in the other wildland block.
Travel cost increases in areas where the focal species experiences poor nutrition or lack of
suitable cover. Permeability is simply the opposite of travel cost, such that a perfectly permeable
landscape would have a travel cost at or near zero. Travel cost and permeability reflect the scores
created during habitat suitability modeling, such that high suitability equals high permeability
(and conversely, low travel cost).
We developed BBCs only for those focal species that can move between wildland blocks in a
single generation, and thus in less time than disturbances such as fire or climate change will
make the current vegetation map obsolete. For focal species that did not meet this criterion (the 4
“corridor dwellers”) we conducted patch configuration analysis (next section).
We created a pair of wildland blocks encompassing relatively protected lands in our analysis area
on the Kaibab and Coconino National Forests north and south of Interstate Route 40. The
relatively close proximity of these blocks would cause our GIS procedure to identify BBCs in
those areas where they nearly touch, even though the resulting corridor would not necessarily
include the best habitat for the species being modeled7. A BBC drawn this way could be
unrealistic, and could serve small wildlife populations near the road while failing to serve much
larger populations in the rest of the wildland block. To address these problems for purposes of
BBC analyses we redefined the blocks so that their facing edges were parallel to each other,
making the distances between their edges a nearly uniform 21 km (13 mi).
We next identified potential population cores and potential breeding patches that fell completely
within each wildland block. If potential population cores existed within each block we used these
as the starting and ending points for creating BBCs. Otherwise, the start-end points were
potential breeding patches within the wildland block, or (for a wide-ranging species with no
potential breeding patch entirely within a wildland block) any suitable habitat within the
wildland block.
To create each biologically best corridor, we used the modeled habitat suitability score as an
estimate of the cost of movement through each pixel8. For each pixel we then calculated the
lowest cumulative cost to that pixel from a starting point in one wildland block. We similarly
6 This approach has often been called Least Cost Corridor Analysis (Beier et al. 2006) because it identifies areas that
require the least cost of travel (energetic cost, risk of mortality) to the animal. However, CorridorDesign.Org
recommends avoiding use of the term “least cost” because this is easily misunderstood as referring to the dollar cost
of conserving land or building an underpass. 7 The GIS algorithm will almost always select a corridor 100 m long (width of a freeway) over a corridor 5 miles
long, even if the habitat is much better in the longer corridor. 8 Levey et al. (2005) provide evidence that animals make movement decisions based on habitat suitability.
38
San Francisco Peaks – Mogollon Rim Linkage Design
calculated the lowest cumulative travel cost to the pixel from the second wildland block, and
added these 2 cumulative travel costs to calculate the total travel cost for each pixel. The total
travel cost reflects the lowest possible cost associated with a path between wildland blocks that
passes through the pixel. Finally, we defined the biologically best corridor as the swath of pixels
with the lowest total travel cost and a species-specific minimum functional width (Figure 17).
While we used 1000m as a general minimum width as per prior CorridorDesign.Org linkage
designs (see Beier et al. 2008), we increased this for some wide-ranging species (e.g. black bear)
for which a greater width would better ensure the BBC’s long-term integrity. If a species had two
or more distinct strands in its biologically best corridor we eliminated any strand markedly worse
than the best strand (e.g. narrower than the desired minimum width), but otherwise we retained
multiple strands if they had roughly equal travel cost overall.
We shared our intial BBCs with local species experts and utilized location and telemetry data
when available to validate and refine the models. We also referenced aerial imagery to identify
potential errors in the model output. Model results that could not be supported by formal and
informal evaluation were further investigated. We were able to correct any issues by revising the
underlying species parameters based on local information to better reflect habitat associations in
our analysis area (see “Habitat suitability models”).
For a number of species the BBC models created with our initially-defined wildland blocks
included corridor strands only to the west of Camp Navajo, even though empirical data and
expert opinion indicated that most of these species also used Woody Ridge as a movement
corridor. In order to capture known connectivity for populations using the San Francisco Peaks
and moving down through Woody Ridge, we defined a smaller northern habitat block within the
larger block with western edge defined primarily by the Coconino National Forest boundary.
We then created a second set of BBCs between this smaller northern block and the Mogollon
Rim Block, and integrated these with BBCs created using the original larger northern block in
the next and final step.
After developing a biologically best corridor for each species, we combined all biologically best
corridors to form a union of biologically best corridors (UBBC). The UBBC for this linkage
design was based on corridor models created for badger, black bear, bobcat, elk, mule deer,
porcupine, and pronghorn.

39
San Francisco Peaks – Mogollon Rim Linkage Design
a) b)
Figure 17: Creation of biologically best corridors. a) Landscape permeability layer for entire
landscape, b) biologically best corridor composed of most permeable 10% of landscape. (Source:
Beier et al. 2007a).
Patch configuration analysis
Although the UBBC identifies an optimum corridor between the wildland blocks, this optimum
might be poor for a species with little suitable habitat in the potential linkage area. Furthermore,
biologically best corridors were not modeled for some focal species (see previous section). To
address these issues we examined whether the UBBC encompasses adequate potential breeding
patches and potential population cores for each focal species, including species for which a BBC
was estimated. For species requiring multiple generations to move between wildland blocks
(corridor dwellers) we compared the distance between neighboring cores and patches to the
species’ dispersal9 distance, because a patch of habitat beyond dispersal distance will not
promote connectivity. We also verified that each linkage strand was at least twice the home
range width for corridor dwellers to minimize the likelihood that territorial interactions would
limit the ability of individuals to move through the corridor.
For species with limited suitable habitat within the UBBC (Gunnison’s prairie dog and northern
leopard frog) we looked for potential habitat patches within the potential linkage area but outside
of the UBBC. For northern leopard frog, when such patches overlapped the UBBC or were
within the species’ dispersal distance from patches within it, we merged these polygons to the
9 Dispersal distance is how far an animal moves from its birthplace to its adult home range. We used dispersal
distances reported by species experts and in published literature.

40
San Francisco Peaks – Mogollon Rim Linkage Design
UBBC (see Appendix B for explanation of why this step was not taken for Gunnison’s prairie
dog). This widened the strands of the UBBC only slightly but allowed us to accommodate
additional high quality habitat for this species.
Minimum linkage width
Wide linkages are beneficial for several reasons. They (1) provide adequate area for development
of metapopulation structures necessary to allow corridor-dwelling species (individuals or genes)
to move through the landscape; (2) reduce pollution into aquatic habitats; (3) reduce edge effects
such as pets, lighting, noise, nest predation & parasitism, and invasive species; (4) provide an
opportunity to conserve natural fire regimes and other ecological processes; and (5) improve the
opportunity of biota to respond to climate change. To address these concerns, we established a
minimum width of 1 km (0.62 mi) along the length of each strand of the preliminary linkage
design. We widened any bottlenecks where possible by adding natural habitats that included
high-quality habitat for one or more focal species. In some areas the preliminary linkage design
was considerably wider than 1 km due to the partial overlap of individual BBCs. Because we had
used relatively generous minimum widths in developing BBCs, we were able to narrow the
preliminary linkage design in these areas and still maintain a minimum 1 km width for both
individual BBCs and the overall linkage design. The result of these adjustments was the final
linkage design.
Field investigations and empirical validation
We examined areas of the modeled corridor where data were scarce or we had concerns about
the model output through targeted field visits. Based on these investigations we wish to highlight
the following issues for possible future mitigation and restoration:
Fencing poses significant barriers to pronghorn and other species. While portions of
Garland Prairie are particularly impacted, fencing is prevalent throughout the linkage
analysis area. Where practicable, fencing might be removed or upgraded to wildlife-
friendly specifications (see “Guidelines for mitigating impacts from urban and rural
development” for further discussion).
Several small communities within the linkage have potential for future growth. Strategic
development should accommodate wildlife movement to the greatest extent possible.
As detailed above (see “Recommendations for crossing structures in the linkage design”) we also
relied on telemetry data and field investigations conducted by the Arizona Game & Fish
Department, Wildlife Contracts Branch to guide our recommendations for wildlife crossing
structures along key roadways.
Finally, we referenced a number of regional empirical datasets which allowed us to both validate
and refine our initial BBC models for selected species. These included the following:
Camera-trap black bear occurrence data on Camp Navajo provided by Janet Lynn of the
Camp.
Arizona Department of Transportation collision data for elk and mule deer along
Interstate Route 40.

41
San Francisco Peaks – Mogollon Rim Linkage Design
Telemetry locations and maps for elk, mule deer, and pronghorn provided by the Arizona
Game and Fish Department Research and Contracts Branches.
Arizona black rattlesnake occurrence data provided by Erika Nowak of Northern Arizona
University.
Northern leopard frog historical locations provided by Susan MacVean of the Arizona
Game and Fish Department Nongame Branch.
Mexican spotted owl occurrence data acquired from the Arizona Game and Fish
Department’s Heritage Database Management System
See individual species sections in Appendix B for a description of how we integrated these
various data sources into the development and validation of our linkage design. A number of
these datasets were proprietary and focused on sensitive species, thus we do not present all
spatially-explicit location data herein in order to protect the welfare of the species involved.
Creating a final linkage design
To create the final linkage design, we combined biologically best corridors for all passage focal
species modeled and made several minor edits to the union of biologically best corridors:
We widened the UBBC where necessary to ensure the minimum functional width for all
species served by each strand (1.2 – 2 km).
We trimmed excess width where aerial imagery indicated developed land or poor habitat
for the species served, or where BBCs were wider than the species-specific minimum
functional width.
We eliminated gaps in the strands where habitat was suitable for all focal species served
in that area and land was undeveloped.
We expanded the UBBC to capture significant areas of optimal habitat for corridor
dwellers, particularly northern leopard frog, where these overlapped or were within the
species’ dispersal distance of UBBC strands.
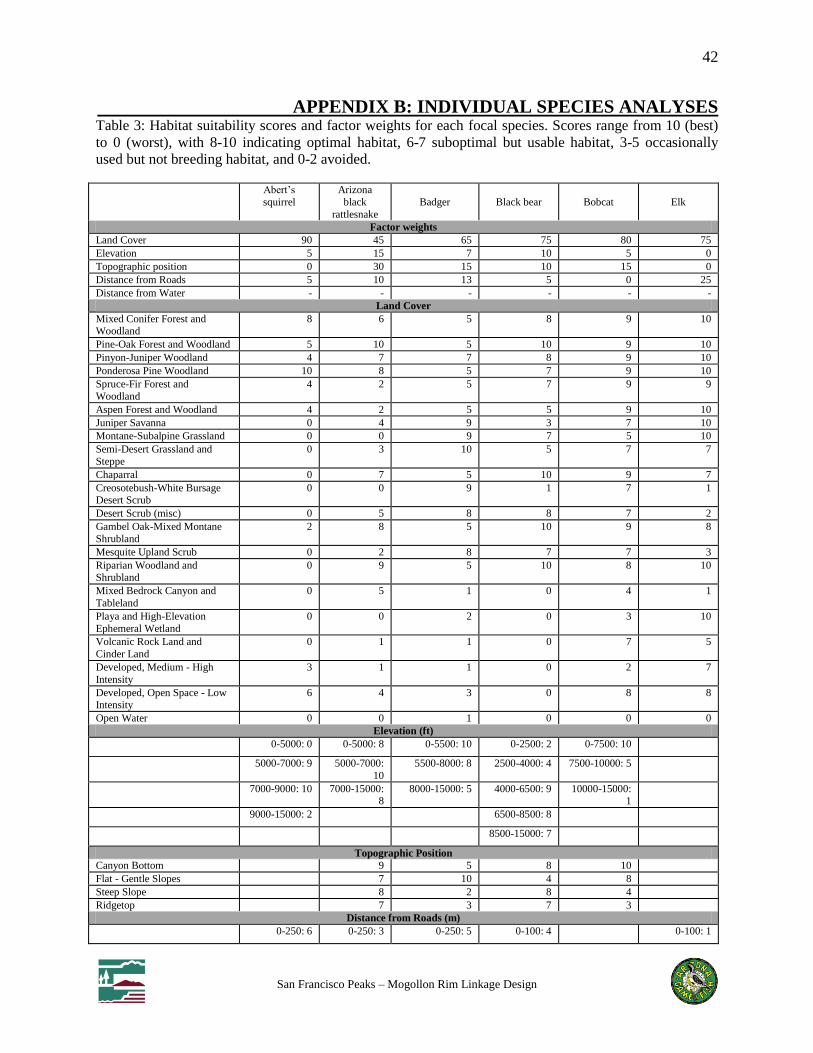
42
San Francisco Peaks – Mogollon Rim Linkage Design
APPENDIX B: INDIVIDUAL SPECIES ANALYSES Table 3: Habitat suitability scores and factor weights for each focal species. Scores range from 10 (best)
to 0 (worst), with 8-10 indicating optimal habitat, 6-7 suboptimal but usable habitat, 3-5 occasionally
used but not breeding habitat, and 0-2 avoided.
Abert’s
squirrel
Arizona
black
rattlesnake
Badger Black bear Bobcat Elk
Factor weights
Land Cover 90 45 65 75 80 75
Elevation 5 15 7 10 5 0
Topographic position 0 30 15 10 15 0
Distance from Roads 5 10 13 5 0 25
Distance from Water - - - - - -
Land Cover
Mixed Conifer Forest and Woodland
8 6 5 8 9 10
Pine-Oak Forest and Woodland 5 10 5 10 9 10
Pinyon-Juniper Woodland 4 7 7 8 9 10
Ponderosa Pine Woodland 10 8 5 7 9 10
Spruce-Fir Forest and
Woodland
4 2 5 7 9 9
Aspen Forest and Woodland 4 2 5 5 9 10
Juniper Savanna 0 4 9 3 7 10
Montane-Subalpine Grassland 0 0 9 7 5 10
Semi-Desert Grassland and
Steppe
0 3 10 5 7 7
Chaparral 0 7 5 10 9 7
Creosotebush-White Bursage Desert Scrub
0 0 9 1 7 1
Desert Scrub (misc) 0 5 8 8 7 2
Gambel Oak-Mixed Montane
Shrubland
2 8 5 10 9 8
Mesquite Upland Scrub 0 2 8 7 7 3
Riparian Woodland and
Shrubland
0 9 5 10 8 10
Mixed Bedrock Canyon and
Tableland
0 5 1 0 4 1
Playa and High-Elevation
Ephemeral Wetland
0 0 2 0 3 10
Volcanic Rock Land and
Cinder Land
0 1 1 0 7 5
Developed, Medium - High
Intensity
3 1 1 0 2 7
Developed, Open Space - Low Intensity
6 4 3 0 8 8
Open Water 0 0 1 0 0 0
Elevation (ft)
0-5000: 0 0-5000: 8 0-5500: 10 0-2500: 2 0-7500: 10
5000-7000: 9 5000-7000:
10
5500-8000: 8 2500-4000: 4 7500-10000: 5
7000-9000: 10 7000-15000: 8
8000-15000: 5 4000-6500: 9 10000-15000: 1
9000-15000: 2 6500-8500: 8
8500-15000: 7 Topographic Position
Canyon Bottom 9 5 8 10
Flat - Gentle Slopes 7 10 4 8
Steep Slope 8 2 8 4
Ridgetop 7 3 7 3
Distance from Roads (m)
0-250: 6 0-250: 3 0-250: 5 0-100: 4 0-100: 1

43
San Francisco Peaks – Mogollon Rim Linkage Design
250-500: 7 250-500: 6 250-15000: 10 100-500: 7 100-200: 2
500-1000: 8 500-1000: 9 500-15000: 10 200-400: 4
1000-15000: 10
1000-15000: 10
400-1000: 5
1000-2000: 8
2000-15000: 10
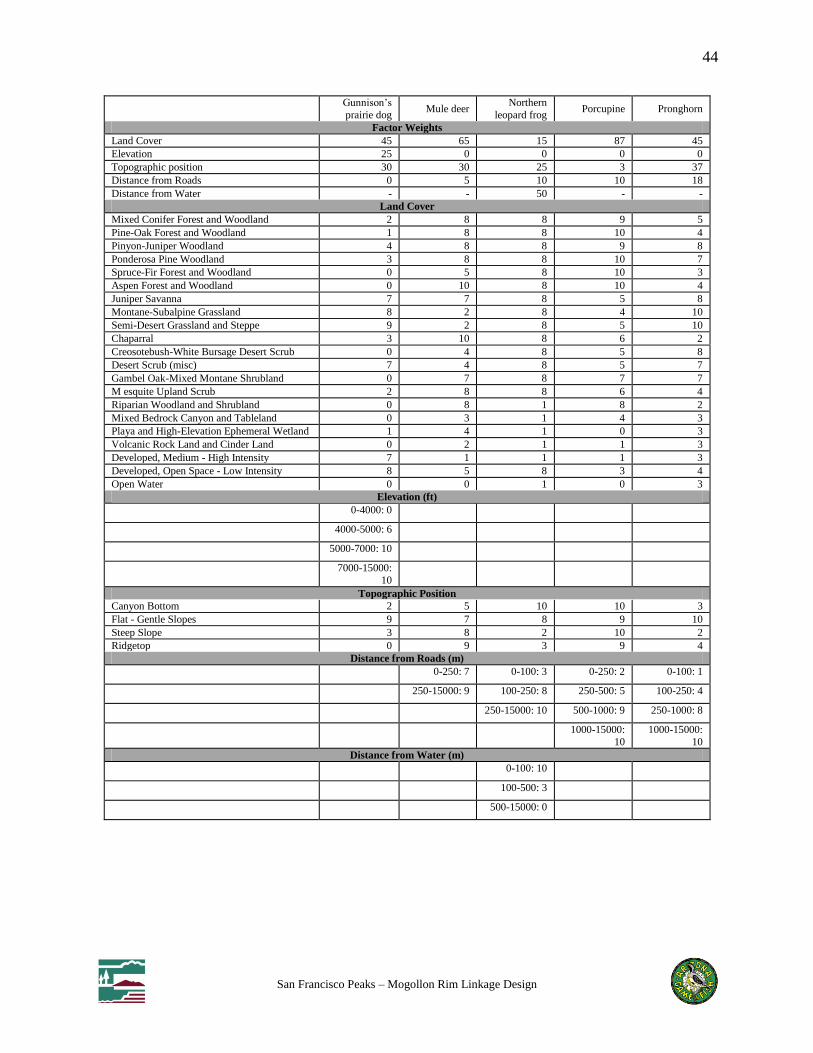
44
San Francisco Peaks – Mogollon Rim Linkage Design
Gunnison’s
prairie dog Mule deer
Northern
leopard frog Porcupine Pronghorn
Factor Weights
Land Cover 45 65 15 87 45
Elevation 25 0 0 0 0
Topographic position 30 30 25 3 37
Distance from Roads 0 5 10 10 18
Distance from Water - - 50 - -
Land Cover
Mixed Conifer Forest and Woodland 2 8 8 9 5
Pine-Oak Forest and Woodland 1 8 8 10 4
Pinyon-Juniper Woodland 4 8 8 9 8
Ponderosa Pine Woodland 3 8 8 10 7
Spruce-Fir Forest and Woodland 0 5 8 10 3
Aspen Forest and Woodland 0 10 8 10 4
Juniper Savanna 7 7 8 5 8
Montane-Subalpine Grassland 8 2 8 4 10
Semi-Desert Grassland and Steppe 9 2 8 5 10
Chaparral 3 10 8 6 2
Creosotebush-White Bursage Desert Scrub 0 4 8 5 8
Desert Scrub (misc) 7 4 8 5 7
Gambel Oak-Mixed Montane Shrubland 0 7 8 7 7
M esquite Upland Scrub 2 8 8 6 4
Riparian Woodland and Shrubland 0 8 1 8 2
Mixed Bedrock Canyon and Tableland 0 3 1 4 3
Playa and High-Elevation Ephemeral Wetland 1 4 1 0 3
Volcanic Rock Land and Cinder Land 0 2 1 1 3
Developed, Medium - High Intensity 7 1 1 1 3
Developed, Open Space - Low Intensity 8 5 8 3 4
Open Water 0 0 1 0 3
Elevation (ft)
0-4000: 0
4000-5000: 6
5000-7000: 10
7000-15000:
10
Topographic Position
Canyon Bottom 2 5 10 10 3
Flat - Gentle Slopes 9 7 8 9 10
Steep Slope 3 8 2 10 2
Ridgetop 0 9 3 9 4
Distance from Roads (m)
0-250: 7 0-100: 3 0-250: 2 0-100: 1
250-15000: 9 100-250: 8 250-500: 5 100-250: 4
250-15000: 10 500-1000: 9 250-1000: 8
1000-15000:
10
1000-15000:
10
Distance from Water (m)
0-100: 10
100-500: 3
500-15000: 0

45
San Francisco Peaks – Mogollon Rim Linkage Design
Abert’s squirrel (Sciurus aberti)
Justification for Selection
Three subspecies of Abert’s squirrel, also called
the tassel-eared squirrel, are found in Arizona:
Abert’s (S. a. aberti), Kaibab (S. a. kaibabensis),
and Abert’s Chuska (S. a. chuscensis). This
arboreal mammal is closely associated with pine
forest in the Four Corners region. This species
was included because its habitat needs represent
those of many coniferous forest specialists. It is a
Forest Service Management Indicator Species as
it is locally abundant, is an obligate forest dweller,
responds to changes in forest structure, is
economically important as game, and is prey for the northern goshawk (Accipiter gentilis), a
Federal Species of Concern.
Distribution
The tassel-eared squirrel is found within forests dominated by ponderosa pine (Pinus ponderosa)
on the Colorado Plateau and in the southern Rocky Mountains in Arizona, Utah, Colorado, New
Mexico, Wyoming, and northern Mexico. These dry forests occur at elevations from 1,800 to
2,600 meters (5,900 to 8,500 feet), however introduced Abert’s squirrel populations occur up to
10,400 feet in Arizona’s Pinaleño mountains. This squirrel is common throughout most of its
range, although rare in parts of the periphery.
Habitat Associations
The primary food source for tassel-eared squirrels is ponderosa pine, along with fungi (truffles
and mushrooms), acorns, and mistletoe (States et al. 1988; Hutton et al. 2003). Pine stands with
interlocking crowns provide nest trees and travel cover (Patton et al. 1985). Optimal habitat,
according to Dodd et al. (1998), includes large seed trees (30-74 cm diameter at breast height
[dbh]) and interlocking canopies, while marginal habitat is dominated by trees 2.5-30.3 cm dbh.
Nest trees are generally taller and larger than surrounding trees (19.0 ± 2.7 m versus 13.5 ± 5.1 m
tall and 37.5 ± 7.5 cm versus 28.9 ± 11.6 cm dbh) (Halloran and Beckoff 1994). Quaking aspen
stands and meadows are considered non-habitat.
Prather et al. (2006) found that local basal area explained squirrel density in 9 northern Arizona
studies, while basal area and canopy cover greater than 50% at the 160-ha scale explained
recruitment. Canopy cover of 40-50% probably represents a threshold for optimal tree squirrel
habitat (Prather et al. 2006; Loberger et al. 2011). Optimal basal area is greater than 35 m2/ha
(150 ft2/ac) (Dodd et al. 1998). Habitat patchiness, particularly in regards to fuels reduction
treatments, is probably important for foraging, nesting, and escaping predators. Large trees with
interlocking crowns are selected for nest sites, while smaller “jack pines” are associated with
hypogeous fungi (Dodd et al. 1998).
While ponderosa pine-dominated forests represent optimal habitat, Abert’s squirrels utilize other
tree species for various habitat needs. Occasionally squirrels feed on Douglas fir (Pseudotsuga

46
San Francisco Peaks – Mogollon Rim Linkage Design
menziesii) or pinyon pine (Pinus edulis) cones. Gambel’s oak (Quercus gambelii) provides
acorns and occasionally nesting cavities. Hutton et al. (2003) documented Abert’s squirrels in
Arizona foraging, feeding, chasing, and nest building in mixed conifer and spruce-fir forests.
Spatial Patterns
Estimates for individual home ranges vary from less than 4 ha for females in the non-breeding
season (Farentinos 1979) to 26 ha (Lema 2001) to greater than 70 ha, depending on habitat
quality. Estimated population densities vary even more widely seasonally and year-to-year
(Dodd et al. 1998; Dodd 2003; Keith 2003). Abert’s squirrels are non-territorial, occasionally
nesting in pairs or groups (Lema 2001). Farentinos (1972) recorded juvenile dispersal distances
between 840 and 1,440 meters (0.5-0.89 miles).
Conceptual Basis for Model Development
Habitat suitability model – Forest structure and composition is probably the most important
habitat attribute for tassel-eared squirrels. Elevation is important to the degree that it influences
vegetation and also the severity of winter snow, a major cause of mortality. Individuals seem to
readily cross roads, but are also commonly killed in collisions. They have been observed
traveling several hundred meters to drink from streams (Farentinos 1979). Land cover received
an importance weight of 90%, while elevation, topography, and distance from roads received
weights of 5%, 0%, and 5%, respectively. For specific scores of classes within each of these
factors see Table 3.
Patch size & configuration analysis – Towry (1984) estimated a minimum viable population
would require 30 individuals and 174 ha of optimal habitat. In 2006, Prather et al. concluded that
high quality habitat over a 160-305 ha area is likely needed to facilitate recruitment. Wood et al.
(2007) modeled population viability for several tree squirrel species, synthesizing the available
literature for Sciurus spp. Under various environmental conditions, they estimated a minimum
population of 15-45 Abert’s squirrels could persist for 100 years. Most (13 of 14) tree squirrel
introductions begun with at least 10 individuals have been successful over 50 years. Based on the
input of species experts we defined minimum potential breeding patch size as 10 ha, and
minimum potential population core size as 116 ha. To determine potential breeding patches and
population cores, the habitat suitability model for this species was first averaged using a 3 x 3
pixel square neighborhood moving window analysis.
Biologically best corridor analysis – We did not model a biologically best corridor for this
species. Based on dispersal distance data Abert’s squirrel is considered a “corridor dweller”
requiring more than a generation to traverse the distance between wildland blocks.
Results & Discussion
Union of biologically best corridors – While we did not model a biologically best corridor for
this species, the habitat suitability model indicates that significant high-quality habitat exists for
Abert’s squirrel in both wildland blocks and in the linkage design itself, in particular in the more
upland forested habitats within the western portion of Strand A and most of Strands B and C
(Figure 18). Similarly, abundant population cores exist throughout much of both wildland blocks
and the strands of the linkage design within the species’ dispersal distance, indicating that the

47
San Francisco Peaks – Mogollon Rim Linkage Design
linkage design should facilitate successful movement of Abert’s squirrel between wildland
blocks over multiple generations.
Figure 18: Modeled habitat suitability for Abert’s squirrel in the San Francisco
Peaks – Mogollon Rim Linkage

48
San Francisco Peaks – Mogollon Rim Linkage Design
Arizona black rattlesnake (Crotalus cerberus)
Justification for Selection
The Arizona black rattlesnake (C. cerberus),
previously considered a subspecies of the
Western rattlesnake (C. viridis) has recently
been recognized as a distinct species (Crother et
al. 2008). Due to its unique habitat requirements
and distribution almost entirely within the state
of Arizona, C. cerberus is an important focal
species for wildlife connectivity.
Distribution
C. cerberus is found in mid- and high-elevation
forested mountains in Arizona and New Mexico. Nickerson and Mays (1969) reported specimens
and reliable accounts of individuals from 1,340 to 3,050 meters (4,400 to 10,000 ft) elevation,
however individuals in Tonto National Monument were observed between 880 to 1,010 meters
(2,880 and 3,310 ft) (Nowak 2005). The species’ habitat selection is not well understood and the
majority of available information is based upon anecdotal observation and limited radio-
telemetry data. Nonetheless, reliable observations have been made in both habitat blocks and
hibernation sites have been identified in the greater Flagstaff area (E. Nowak, pers. comm.).
Habitat Associations
Habitat types associated with C. cerberus include chaparral, Great Basin conifer woodland,
Madrean evergreen woodland, Petran montane conifer forest, and occasionally Arizona upland
desertscrub (Brennan and Holycross 2006). Relative to other rattlesnakes at Tonto National
Monument, C. cerberus utilizes more mesic, dense upland habitats in remote areas (Nowak and
Arundel 2009). Telemetry studies in the Monument indicate that individuals spend most of their
time within Arizona sycamore and desert riparian scrub (Nowak 2005; Nowak and Arundel
2009). Individuals were also found within jojoba-mixed scrub. Mixed-grass mixed-scrub was
also used by C. cerberus, but not significantly more than expected based on habitat availability.
These two non-riparian habitat types were used for hibernation sites. Important microhabitat
includes rock outcroppings, boulders, and woody debris for thermoregulation, ecdysis, and
foraging (Schofer 2007). Prey includes birds, lizards, and small mammals. Telemetry locations in
Tonto National Monument were more often located on north- or east-facing aspects with a mean
slope of approximately 23% (range for 2005 study was 8-35%). However, seasonal shifts in
aspect probably reflect thermoregulation. Hibernation sites were generally in north- or west-
facing rocky talus slopes associated with washes (Nowak and Arundel 2009).
Spatial Patterns
Based on limited spatial studies of the species, C. cerberus occupies larger home ranges than
other rattlesnake species (Schofer 2007; Nowak and Schofer 2005). This is thought to reflect
sparseness of mates (females) across the landscape, rather than habitat or forage limitations
(Schofer 2007). Average home range size in Schofer’s 2007 telemetry study of 5 males was 25
ha with one individual utilizing 56 ha. Nowak (2009) documented annual home range sizes of
2.63 ha for a non-pregnant female, and averages of 1.99 ha for a pregnant female (over several

49
San Francisco Peaks – Mogollon Rim Linkage Design
years) and 27.15 ha for males, with a maximum of 91.2 ha for a male. She recommends that any
animal that must be translocated be moved no more than 100 meters within the same habitat type
of its original location.
Conceptual Basis for Model Development
Habitat suitability model – Individuals will move through more developed areas of National
Parks and Monuments where they have been studied, but do not remain in populated areas.
Important topographical features include canyon bottoms, dry rocky slopes, and rock slides
(Brennan and Holycross 2006). Nowak (2009) estimated meaningful distance-to-feature classes
based on her experience with this species and other herpetofauna. C. cerberus probably responds
to human developed areas, free water, and rock outcroppings differentially at distances of 1-10m,
10-50m, 50-100m, 100-250m, and greater than 250 meters. Land cover received an importance
weight of 45%, while elevation, topography, and distance from roads received weights of 15%,
30%, and 10%, respectively. For specific scores of classes within each of these factors see Table
3. Species experts also noted that the Arizona black rattlesnake depends on rocky outcroppings
in basalt and other substrates for hibernacula. We were not able to develop an adequate data
layer to capture these microhabitat features at our scale of interest, but species experts indicated
that a model based on available data layers, while likely overestimating suitable habitat, would
still be of value and enhance our linkage design (E. Nowak, personal comm.).
Patch size & configuration analysis – No data were found in the literature; model parameters
were provided by regional species experts. Based on the input of species experts we defined
minimum potential breeding patch size as 10 hectares, and minimum potential population core
size as 116 hectares. To determine potential breeding patches and potential population cores, the
habitat suitability model for this species was first averaged using a 3 x 3 pixel square
neighborhood moving window analysis.
Biologically best corridor analysis – We did not model a biologically best corridor for this
species. Based on expert opinion regarding likely dispersal distance data Arizona black
rattlesnake is considered a “corridor dweller” requiring more than a generation to traverse the
distance between wildland blocks.
Results & Discussion
Union of biologically best corridors – While we did not model a biologically best corridor for
this species, the habitat suitability model indicates that significant high-quality habitat exists for
Arizona black rattlesnake in both wildland blocks and in the linkage design itself, in particular in
upland forested habitats within the western portion of Strand A and most of Strands B and C
(Figure 19). Similarly, abundant population cores exist throughout much of both wildland blocks
and the strands of the linkage design within the species’ dispersal distance, indicating that the
linkage design should facilitate successful movement of Arizona black rattlesnakes between
wildland blocks over multiple generations.
Our suitability model likely overestimates the amount of suitable habitat in the linkage planning
area for this species since we were unable to incorporate a data layer for rocky outcroppings. We
obtained georeferenced occurrence data from species expert Erika Nowak and her colleagues in
an effort to validate our model; these data are sensitive and thus not presented here. The
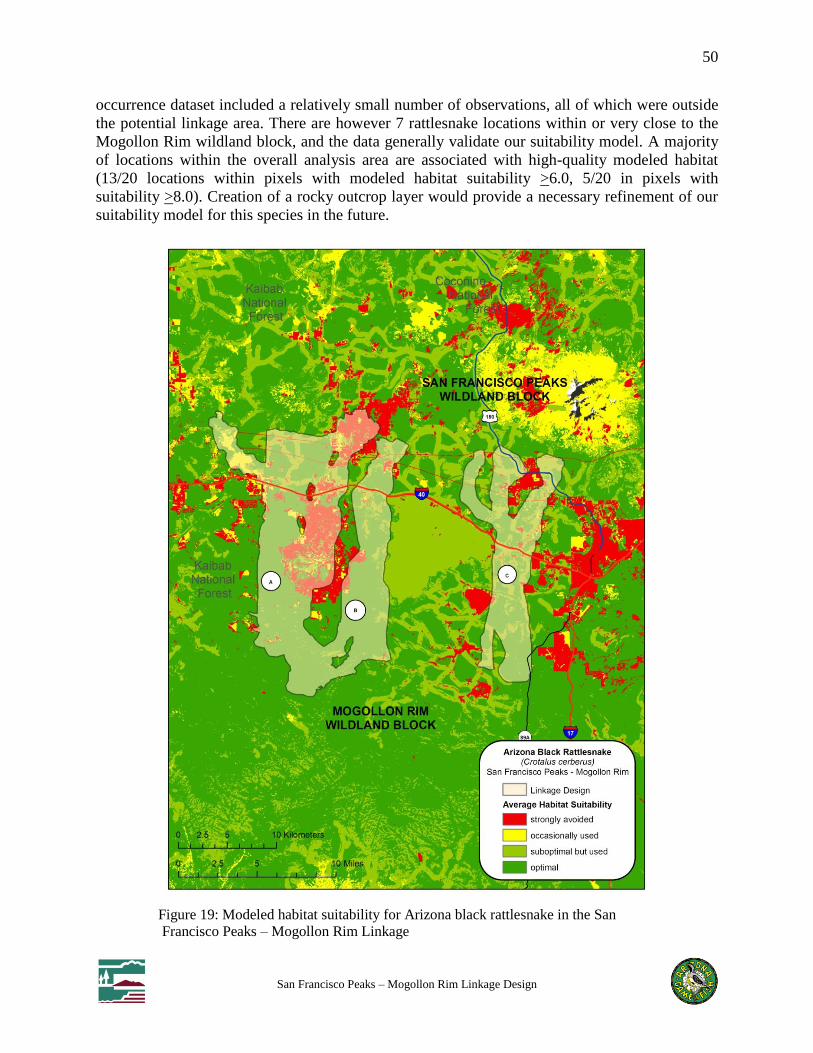
50
San Francisco Peaks – Mogollon Rim Linkage Design
occurrence dataset included a relatively small number of observations, all of which were outside
the potential linkage area. There are however 7 rattlesnake locations within or very close to the
Mogollon Rim wildland block, and the data generally validate our suitability model. A majority
of locations within the overall analysis area are associated with high-quality modeled habitat
(13/20 locations within pixels with modeled habitat suitability >6.0, 5/20 in pixels with
suitability >8.0). Creation of a rocky outcrop layer would provide a necessary refinement of our
suitability model for this species in the future.
Figure 19: Modeled habitat suitability for Arizona black rattlesnake in the San
Francisco Peaks – Mogollon Rim Linkage

51
San Francisco Peaks – Mogollon Rim Linkage Design
Badger (Taxidea taxus)
Justification for Selection
Because of their large home ranges, many
parks and protected lands are not large
enough to ensure protection of a badger
population, or even an individual
(NatureServe 2005). Consequently, badgers
have suffered declines in recent decades in
areas where grasslands have been converted
to intensive agricultural areas, and where prey
animals such as prairie dogs and ground
squirrels have been reduced or eliminated
(NatureServe 2005). Badgers are also
threatened by collisions with vehicles while attempting to cross highways intersecting their
habitat (New Mexico Department of Game and Fish 2004, NatureServe 2005).
Distribution
Badgers are found throughout the western United States, extending as far east as Illinois,
Wisconsin, and Indiana (Long 1973). They are found in open habitats throughout Arizona.
Habitat Associations
Badgers are primarily associated with open habitats such as grasslands, prairies, and shrublands,
and avoid densely wooded areas (NMGF 2004). They may also inhabit mountain meadows,
marshes, riparian habitats, and desert communities including creosote bush, juniper and
sagebrush habitats (Long & Killingley 1983). They prefer flat to gentle slopes at lower
elevations, and avoid rugged terrain (Apps et al. 2002).
Spatial Patterns
Overall yearly home range of badgers has been estimated as 8.5 km2 (Long 1973). Goodrich and
Buskirk (1998) found an average home range of 12.3 km2 for males and 3.4 km
2 for females,
found male home ranges to overlap more than female ranges (male overlap = 0.20, female =
0.08), and estimated density as 0.8 effective breeders per km2. Messick and Hornocker (1981)
found an average home range of 2.4 km2 for adult males and 1.6 km
2 for adult females, and
found a 20% overlap between a male and female home range. Nearly all badger young disperse
from their natal area, and natal dispersal distances have been recorded up to 110 km (Messick &
Hornocker 1981).
Conceptual Basis for Model Development
Habitat suitability model – Badgers prefer grasslands and other open habitats on flat terrain at
lower elevations. They do not show an aversion to roads (Apps et al. 2002), which makes them
sensitive to high road mortality. Vegetation received an importance weight of 65%, while
elevation, topography, and distance from roads received weights of 7%, 15%, and 13%,
respectively. For specific scores of classes within each of these factors, see Table 3.

52
San Francisco Peaks – Mogollon Rim Linkage Design
Patch size & configuration analysis – We defined minimum potential breeding patch size as 200
hectares, which is an average of the home range found for both sexes by Messick and Hornocker
(1981), and equal to the female home range estimated by Goodrich and Buskirk (1998), minus 1
standard deviation. Minimum potential population core size was defined as 1000 hectares,
approximately enough area to support 10 effective breeders, allowing for a slightly larger male
home range size and 20% overlap of home ranges (Messick and Hornocker 1981). To determine
potential breeding patches and population cores, the habitat suitability model for this species was
first averaged using a 200m-radius moving window analysis due to the species’ large spatial
requirements.
Biologically best corridor analysis – We used the methods described in Appendix A to identify
the biologically best corridor for this species.
Results & Discussion
Initial biologically best corridor – Modeling results indicate that optimal and suitable habitat for
badger is concentrated within the western portion of the potential linkage area in grassland
habitats of Garland and Government Prairies and Pittman Valley, and to a lesser extent in the
area south of Camp Navajo and Rogers Lake (Figure 20). Most of the highest quality habitat in
this area is encompassed by the BBC. Population cores exist throughout most of the area
encompassed by Strand A, and in grassland habitats in both wildland blocks, though these are
generally restricted in the Mogollon Rim block to its northern portions.
Union of biologically best corridors – The additional area encompassed by the linkage design
captures a small amount of additional suitable and optimal habitat for badger primarily in the
portion of Strand B that intersects Garland Prairie. The primary threats to this species’
connectivity and persistence are most likely Interstate 40 and future housing development in its
relatively flat grassland habitats.

53
San Francisco Peaks – Mogollon Rim Linkage Design
Figure 20: Modeled habitat suitability and biologically best corridor for badger
in the San Francisco Peaks – Mogollon Rim Linkage

54
San Francisco Peaks – Mogollon Rim Linkage Design
Black bear (Ursus americanus)
Justification for Selection
Black bears require a variety of habitats to
meet seasonal foraging demands and have
naturally low population densities, making
them especially vulnerable to habitat
fragmentation (Larivière 2001).
Distribution
Black bears are widely distributed throughout
North America, ranging from Alaska and
Canada to the Sierra Madre Occidental and
Sierra Madre Oriental of Mexico (Larivière 2001). In Arizona, they are found primarily in
forested areas from the South Rim of the Grand Canyon to mountain ranges in the southeastern
part of the state (Hoffmeister 1986).
Habitat Associations
Black bears are primarily associated with mountainous ranges throughout Arizona. Within these
areas they use a variety of vegetation types, ranging from semidesert grasslands to encinal
woodlands and montane conifer forests (Hoffmeister 1986). Encinal woodlands and conifer-oak
woodlands are optimal habitat, providing food such as acorns (LeCount 1982; LeCount et al.
1984; Cunningham and Ballard 2004). In autumn, black bears use grass and shrub mast as well
as prickly pear found in desert scrub (S. Cunningham, personal comm.). In many locations
throughout Arizona, black bears are found in riparian communities (Hoffmeister 1986), and
prefer to bed in locations with 20-60% slopes (S. Cunningham, personal comm.).
Spatial Patterns
Individual black bears do not have territorial interactions, and home ranges of both sexes
commonly overlap. Home ranges are generally larger in locations or years of low food
abundance, and smaller when food is plentiful and have been observed to range from 2 - 170 km2
(Larivière 2001). Daily foraging movements are also dependent on food supply, and have been
observed to range from 1.4 – 7 km (Larivière 2001). Males have larger dispersal distances than
females, as females stay close to their natal range, and males must migrate to avoid larger males
as their mother comes back into estrus (Schwartz and Franzmann 1992). Depending on
vegetation, females may disperse up to 20 km, while males often move 20-150 km (S.
Cunningham, personal comm.).
Conceptual Basis for Model Development
Habitat suitability model – Cover is the most important factor for black bears, so vegetation was
assigned an importance weight of 75%. Elevation and topography each received a weight of
10%, and distance from roads received a weight of 5%. Lee Luedeker of the Arizona Game and
Fish Department reviewed the factor weights and suitability scores obtained from
CorridorDesign.Org and adjusted these to reflect regional habitat associations for this species.

55
San Francisco Peaks – Mogollon Rim Linkage Design
For specific scores of classes within each of these factors, see Table 3 for habitat suitability
scores.
Patch size & configuration analysis – We defined minimum potential breeding patch size as
1000 hectares, since this is the minimum amount of optimum habitat necessary to support a
female and cub (Bunnell & Tait 1981; S. Cunningham, personal comm.). Minimum potential
population core size was defined as 5000 hectares, or five times the minimum patch size. To
determine potential habitat patches and cores, the habitat suitability model for this species was
first averaged using a 200m-radius moving window analysis due to the species’ large spatial
requirements.
Biologically best corridor analysis – We used the methods described in Appendix A to identify
the biologically best corridor for this species.
Results & Discussion
Initial biologically best corridor – Modeling results indicate that optimal and suitable habitat for
black bear is found throughout the potential linkage area, with the highest quality habitat found
in forested areas with high topographic relief such as the head of Sycamore Canyon (southern
portion of Strands A & B), the western portion of Camp Navajo around Volunteer Mountain
(Strand B), and Woody Ridge (Strand C; Figure 21). Most of the highest quality habitat is
encompassed by the three strands of the BBC. Potential population cores were identified
throughout the potential linkage area including within the BBC and in both habitat blocks.
A large portion of Camp Navajo between Strands B and C was modeled as not suitable due to its
classification as “developed – medium to high intensity” in the land cover layer, although black
bear have regularly been observed in the western and eastern/southeastern areas of the Camp.
We obtained trail camera data from Janet Lynn of Camp Navajo to validate the black bear BBC
(shown in Figure 21). The middle strand of the BBC captured all of the observations collected on
the forested western uplands on the Camp, while not surprisingly those collected from the
Camp’s southern and eastern areas were not included in the BBC which avoids highly developed
areas. It is also worth noting that Rogers Lake is classified as “playa” in the land cover layer, a
class which was rated as non-habitat for black bear by species experts, though black bear are
known to use forested upland habitats surrounding this feature and may utilize this area to move
between Woody Ridge and Camp Navajo (see “Non-modeled areas important to wildlife
movement”).
.
Union of biologically best corridors – The additional area encompassed by the linkage design
captures additional suitable habitat for black bear: in scattered areas of Strand A; in the southern
end of Strand B and the area where this strand overlaps Volunteer Canyon; and in several high-
relief areas of Strand C, such as along Woody Ridge and near Wing Mountain in this strand’s
northwestern “lobe.” Given that black bear is a wide-ranging species vulnerable to human
conflict, the greatest threats to connectivity and persistence of black bear populations in the
linkage planning area are most likely Interstate 40, continued habitat fragmentation due to urban
and rural housing development within the linkage strands, and potential changes in training
activities on Camp Navajo.

56
San Francisco Peaks – Mogollon Rim Linkage Design
Figure 21: Modeled habitat suitability and biologically best corridor for black bear
in the San Francisco Peaks – Mogollon Rim Linkage. Blue points represent
locations of Camp Navajo black bear observations. (Note: Much of Camp Navajo
is designated “developed” in the land cover layer and thus was modeled as
“avoided” for this species).

57
San Francisco Peaks – Mogollon Rim Linkage Design
Bobcat (Lynx rufus)
Justification for Selection
Bobcats are the most common felid in
North America. Fur trapping remains an
important cause of mortality for the
species. They are also susceptible to
vehicle collisions, intraspecific
competition, and disease (Fuller et al.
1995). Bobcats are known habitat
generalists that sometimes utilize
residential areas adjacent to large
undeveloped areas (Harrison 1998). They
may be able to coexist with some
development when a minimum amount of
functional natural habitat remains (Riley et al. 2003). However, rampant urbanization can be
detrimental to populations. For example, the disappearance of bobcats in Illinois coincided with
human settlement and associated habitat loss (Woolf and Hubert 1998).
Distribution
Bobcats occur over a broad geographic range, including most of the U.S., as far north as Canada,
and south into Mexico. They are found throughout Arizona (Hoffmeister, 1986), though they are
probably rare on the eastern plains and at higher altitudes in the northern mountains (Findley et
al., 1975).
Habitat Associations
Bobcats are primarily associated with broken country where cliffs and rock outcrops are
interspersed with open grassland, woods, or desert. In Arizona, they occur from the base to the
tops of most desert ranges, in mesquite woods, in arrowweed thickets, among cottonwoods, in
open desert miles from "typical" habitat, and in juniper woodland, oak-manzanita, and ponderosa
pine (Hoffmeister, 1986). Bobcats are very flexible in their habitat requirements, needing only
adequate prey and cover for hunting and escape (Harrison, pers. comm.).
Spatial Patterns
Bobcats are generally solitary and territorial (Riley 2006). Observed home ranges for one
breeding pair ranged from 2 to over 50 km2. Home range size varies greatly with prey density
and habitat quality (Harrison, pers. comm.). In Marin County, California, Riley (2006) found that
roads represented home range boundaries for 75% of radio-collared bobcats that lived near them,
males had larger average home range requirements than females, and the spatial requirements for
both genders varied widely according to whether they were located in an urban or rural
landscape (mean home range size (MCP 95%) of males: urban zone 6.4 km2, rural zone 13.5
km2, females: urban zone 1.3 km
2, rural zone5.3 km
2). Dispersal distances for young bobcats
average near 25 km, while they have been recorded up to 182 km (Kamler and Gipson 2000).

58
San Francisco Peaks – Mogollon Rim Linkage Design
Conceptual Basis for Model Development
Habitat suitability model – Bobcats occur across a wide spectrum of vegetation types. While
bobcats show some unwillingness to cross major roads, there is a dearth of information on their
use of habitat in relation to distance to roads, though Riley (2006) found that roads frequently
represented their home range boundaries. Vegetation received an importance weight of 80%,
elevation 5%, topography 15%, and distance from roads 0%. Lee Luedeker of the Arizona Game
and Fish Department reviewed the factor weights and suitability scores obtained from
CorridorDesign.Org and adjusted these to reflect regional habitat associations for this species.
For specific scores of classes within each of these factors, see Table 3.
Patch size & configuration analysis – We defined minimum potential breeding patch size as
2,000 hectares (Anderson and Lovallo 2003). Minimum potential population core size was
defined as 30,000 hectares (Harrison, pers. comm.), approximately enough area to support 20
effective breeders over a 10 year period provided the population is not harvested.
Biologically best corridor analysis – We used the methods described in Appendix A to identify
the biologically best corridor for this species.
Results & Discussion
Initial biologically best corridor – Modeling results indicate that optimal and suitable habitat for
bobcat is found throughout the potential linkage area for this generalist species (Figure 22).
Much of the highest-quality habitat is included within the three strands of the BBC. Most of the
potential linkage area was identified as a potential population core including within the BBC as
were most areas of both habitat blocks.
Union of biologically best corridors – The additional area encompassed by the linkage design is
almost entirely comprised of high-quality habitat for bobcat, save for larger open grassland
habitats in Strand A (Garland Prairie and Pittman Valley in the strand’s northwestern “lobe”).
Because there is ample habitat for this species and it can coexist with moderate levels of human
activity, the greatest threats to its connectivity and persistence are most likely Interstate 40 and
habitat fragmentation in the event of significant future housing development within the linkage
design.

59
San Francisco Peaks – Mogollon Rim Linkage Design
Figure 22: Modeled habitat suitability and biologically best corridor for bobcat
in the San Francisco Peaks – Mogollon Rim Linkage

60
San Francisco Peaks – Mogollon Rim Linkage Design
Elk (Cervus elaphus)
Justification for Selection
Elk are seasonal migrants that require large tracts
of land to support viable populations. They are
prey for large carnivores such as mountain lion,
and are susceptible to human disturbance and
busy roads.
Distribution
By the late 1800’s, native elk (Cervus elaphus
merriami) were believed to be extinct in Arizona.
Re-introduction efforts in the early 1900’s
established stable populations of non-indigenous
Rocky Mountain elk (Cervus elaphus nelsoni) in
virtually all historic elk habitat in the state (Britt
and Theobald 1982). Arizona elk populations have expanded to an estimated total of 35,000
post-hunt adult animals (Arizona Game and Fish Department 2009b). Elk are most commonly
found in woodlands and forests of northern Arizona extending from the Hualapai Reservation
south and eastward along the Mogollon Rim to the White Mountains and into western New
Mexico (Severson and Medina 1983). Within the linkage planning area, elk occur within the
juniper and shrub oak habitat types.
Habitat Associations
Elk are “intermediate feeders” capable of utilizing a mix of grasses, herbs, shrubs, and trees
depending on the season and availability. Although capable of living in a range of habitats from
desert chaparral and sagebrush steppe to tundra, elk are most commonly associated with forest
parkland ecotones that offer a mix of forage and cover (Thomas et al. 1988; O’Gara and Dundes
2002). Elk are negatively impacted by roads, and have shown avoidance behavior up to 400 m
(Ward et al. 1980), 800 m (Lyon 1979) and 2.2 km (Rowland et al. 2004) from roads. Telemetry
data from the Arizona Game and Fish Department indicate significant avoidance of high-volume
roadways including Interstate Routes 17 and 40 in the linkage planning area (Gagnon et al. 2007,
AGFD 2010, 2011a, 2012a).
Spatial Patterns
In Arizona, elk move annually between high elevation summer range (7,000 to 10,000 ft) and
lower elevation winter range (5,500 to 6,500) (Arizona Game and Fish Department 2009b). Elk
avoid human activity unless in an area secure from predation in which they are tolerant of human
proximity (Morgantini and Hudson 1979, Geist 2002, Lyon and Christensen 2002).
Conceptual Basis for Model Development
Habitat suitability model –Vegetation received an importance weight of 75%, elevation and
topography were each weighted 0%, and distance from roads received a weight of 25%. Tom
McCall of the Arizona Game and Fish Department reviewed the factor weights and suitability
scores obtained from CorridorDesign.Org and adjusted these to reflect regional habitat
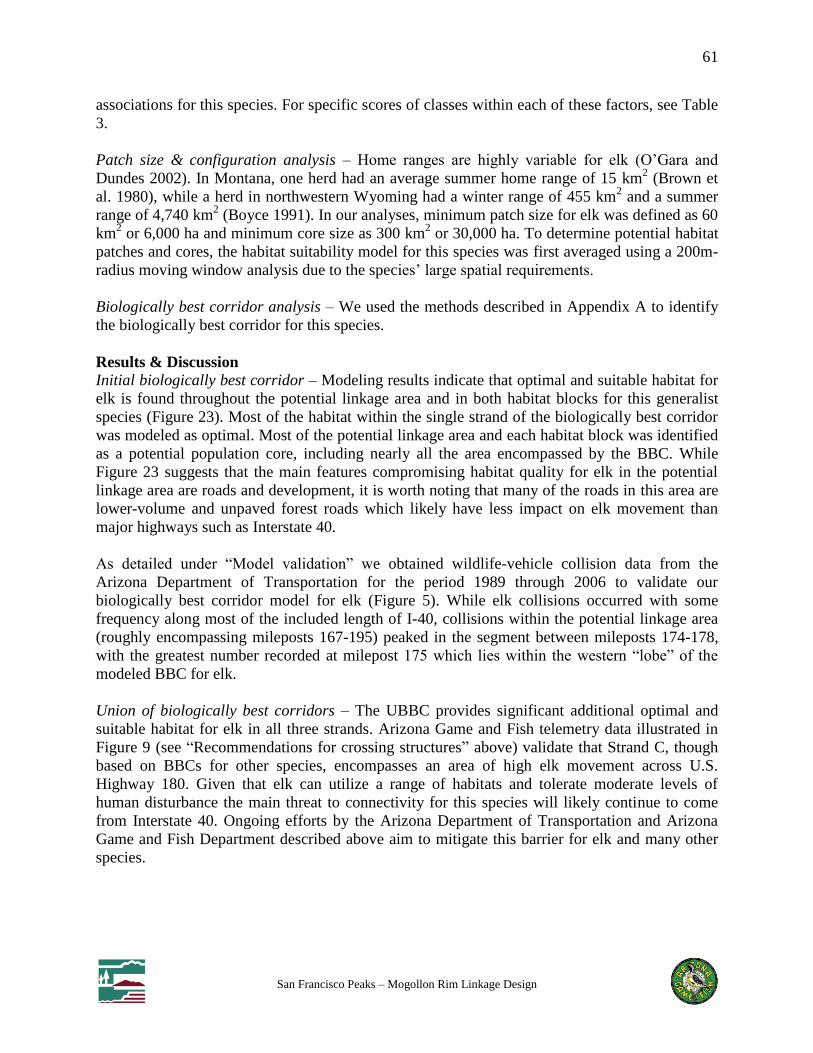
61
San Francisco Peaks – Mogollon Rim Linkage Design
associations for this species. For specific scores of classes within each of these factors, see Table
3.
Patch size & configuration analysis – Home ranges are highly variable for elk (O’Gara and
Dundes 2002). In Montana, one herd had an average summer home range of 15 km2 (Brown et
al. 1980), while a herd in northwestern Wyoming had a winter range of 455 km2 and a summer
range of 4,740 km2 (Boyce 1991). In our analyses, minimum patch size for elk was defined as 60
km2 or 6,000 ha and minimum core size as 300 km
2 or 30,000 ha. To determine potential habitat
patches and cores, the habitat suitability model for this species was first averaged using a 200m-
radius moving window analysis due to the species’ large spatial requirements.
Biologically best corridor analysis – We used the methods described in Appendix A to identify
the biologically best corridor for this species.
Results & Discussion
Initial biologically best corridor – Modeling results indicate that optimal and suitable habitat for
elk is found throughout the potential linkage area and in both habitat blocks for this generalist
species (Figure 23). Most of the habitat within the single strand of the biologically best corridor
was modeled as optimal. Most of the potential linkage area and each habitat block was identified
as a potential population core, including nearly all the area encompassed by the BBC. While
Figure 23 suggests that the main features compromising habitat quality for elk in the potential
linkage area are roads and development, it is worth noting that many of the roads in this area are
lower-volume and unpaved forest roads which likely have less impact on elk movement than
major highways such as Interstate 40.
As detailed under “Model validation” we obtained wildlife-vehicle collision data from the
Arizona Department of Transportation for the period 1989 through 2006 to validate our
biologically best corridor model for elk (Figure 5). While elk collisions occurred with some
frequency along most of the included length of I-40, collisions within the potential linkage area
(roughly encompassing mileposts 167-195) peaked in the segment between mileposts 174-178,
with the greatest number recorded at milepost 175 which lies within the western “lobe” of the
modeled BBC for elk.
Union of biologically best corridors – The UBBC provides significant additional optimal and
suitable habitat for elk in all three strands. Arizona Game and Fish telemetry data illustrated in
Figure 9 (see “Recommendations for crossing structures” above) validate that Strand C, though
based on BBCs for other species, encompasses an area of high elk movement across U.S.
Highway 180. Given that elk can utilize a range of habitats and tolerate moderate levels of
human disturbance the main threat to connectivity for this species will likely continue to come
from Interstate 40. Ongoing efforts by the Arizona Department of Transportation and Arizona
Game and Fish Department described above aim to mitigate this barrier for elk and many other
species.

62
San Francisco Peaks – Mogollon Rim Linkage Design
Figure 23: Modeled habitat suitability and biologically best corridor for elk in
the San Francisco Peaks – Mogollon Rim Linkage

63
San Francisco Peaks – Mogollon Rim Linkage Design
Gunnison’s prairie dog (Cynomys gunnisoni)
Justification for Selection
Gunnison’s prairie dog is one of five extant
prairie dog species, relatives of the ground
squirrel that live colonially. As a burrowing
ecosystem engineer, the Gunnison’s prairie dog
(GPD) provides and enhances habitat for a
number of grassland species including
endangered black-footed ferrets (Mustela
nigripes), burrowing owls (Athene cunicularia),
reptiles, invertebrates, and raptors. GPD is an
appropriate focal species for wildlife linkages
because it represents connectivity for a broader
suite of grass- and shrubland species.
Distribution
Gunnison’s prairie dog is found in the Four Corners region that includes northern Arizona,
southwestern Colorado, northwestern New Mexico, and southeastern Utah. Currently, GPDs are
found at elevations of 1,370 m (4,500 ft) in high desert grasslands to 3,650 m (12,000 ft) in the
mountains. A 2004 petition to federally list the species was denied due to insufficient
information. A number of conservation assessments were produced as a result, and state
management has increased (Seglund et al. 2005; Underwood 2007). In 2008, US Fish & Wildlife
Service announced that while some GPD populations in Colorado and New Mexico would be
considered for listing, those in Arizona and Utah did not warrant listing. The GPD is an Arizona
Species of Greatest Conservation Need (Arizona Game and Fish Department 2012b). Major
threats include plague (Yersinia pestis), poisoning and other methods of extirpation, recreational
shooting, and habitat loss.
Habitat Associations
Generally, GPD are found in grasslands, shrublands, and subalpine meadows (particularly in
northern Arizona). Relatively little habitat research has focused on this species of prairie dog,
which forms smaller, less dense groups than black-tailed prairie dogs (C. ludovicianus) in more
varied vegetation types. In a statewide study of GPD and pocket gopher (Thomomys bottae)
habitats, Gallie (2001) found prairie dog colonies in fine (high in clay) to medium coarse (high in
sand) textured soils. Well-drained soil is important for burrow integrity. Wagner and Drickamer
(2004) found Arizona’s GPD colonies in association with deep soils (mean = 1.26m), flat slopes,
and low rock cover. These conditions allow burrow construction and hibernation below the frost
layer in winter. Fitzgerald and Lechleitner (1974) found colonies in Colorado only where slopes
were less than 15%.
Gunnison’s prairie dogs feed primarily on grasses (Fitzgerald and Lechleitner 1974) as well as
forbs, sedges, and occasionally insects (Underwood 2007). Species commonly found within GPD
colonies include Bromus tectorum, Oryzopsis hymenoides, Aristida purpurea, Muhlenbergia
spp., Sporobolus aeroides, Scleropogon brevifolius, Bouteloa gracilis, Hilaria jamesii,
Agropyron smithii, A. trachycaulum, Koleria cristata, Festuca spp., Atriplex jonesii, A.

64
San Francisco Peaks – Mogollon Rim Linkage Design
canescens, Artemesia tridenta, A. frigida, Sarcobatus verminculatus, Potentilla fruticosa,
Chrysothmnus spp., Descurainia spp., Cardaria draba, Lepidium virginicum, Cryptantha spp.,
Senecio spp., Sisymbrium altissimum, Penstemon spp., and Lappula redowski. Shalaway and
Slobodchikoff (1988) found that prairie dogs in northern Arizona feed on locally abundant
plants, switching species seasonally with plant phenology. Diverse plant communities ensure
year-round food availability.
GPD can obtain water exclusively from moist vegetation (Vorhies 1945, cited in Underwood
2007), but will drink from artificial or natural sources when they are available (Fitzgerald and
Lechleitner 1974). Colonies associated with moist vegetation or wetlands tend to be more
productive (Seglund et al 2005). However, GPD colonies are not found in basins that experience
periodic flooding (Belitsky 1991). Crocker-Bedford (1976) found a negative correlation between
animal density and elevation, attributing this trend to the relationship between vegetative
productivity and elevation (cited in Underwood 2007).
Seglund et al. (2005) modeled potential habitat based on elevations 1,500-3,700m (4,921-12,139
ft), 0-20% slope, and 23 landcover classes. The authors considered forest, woodland, dense
shrubland, marshland, and wetland to be unsuitable habitats.
Spatial Patterns
This species lives in somewhat territorial clans; a network of associated clans is referred to as a
colony. In a statewide study of GPD in Arizona, Wagner and Drickamer (2003) found 76 active
colonies from 1.2 to 959.1 ha in size (mean = 59.6 ha, most were <20 ha). Belitsky (1991) found
colonies in the Aubrey Valley, AZ from 10 to 4,400 ha in size. In Arizona’s Petrified Forest
National Park, Hoogland (1999) studied a colony with 21-23 clans (from year to year), each
0.16-1.82 ha in area with 1 to 19 individuals. Juvenile dispersal was generally to an adjacent
clan, but up to 529 meters. The black-tailed prairie dog, a better studied species, has an estimated
maximum travel distance of 10 km (Knowles 1985, cited in Wagner and Drickamer 2003). The
species experts consulted for this effort assigned a mean dispersal distance of 300m for GPD.
Colonies may have as many as 50 individuals (Hoffmeister 1986), but populations fluctuate with
outbreaks of plague, poisoning, or drought events.
Conceptual Basis for Model Development
Habitat suitability model – Agricultural lands can be considered very poor habitat because GPD
are usually eradicated there. However, high density colonies have been found in the productive
areas surrounding agricultural lands (Seglund et al. 2005). Livestock grazing can diminish
habitat quality and is similarly associated with eradication efforts (Arizona Game and Fish
Department 2012b). Roads increase access for recreational shooters (Reading and Matchett
1997), however some developed areas are thought to provide refuge from predators. Black-tailed
prairie dogs will use primitive roads for dispersal, but Reading and Matchett (1997) found no
relationship between distance to roads and animal density or colony area. Lands open to mining
and energy exploration can be directly degraded but also can be so disturbed or noisy as to
inhibit GPD vocal communication (Clark 1986). Belitsky (1991) observed that GPD colonies in
his study area were not located within highway or railroad right-of-ways. Land cover and
topography seem to be important for GPD habitat quality, while proximity to standing water
does not seem to directly determine habitat suitability. Steep slopes may serve as barriers to

65
San Francisco Peaks – Mogollon Rim Linkage Design
movement. Land cover received an importance weight of 45%, while elevation, topography, and
distance from roads received weights of 25%, 30%, and 0%, respectively. For specific scores of
classes within each of these factors see Table 3.
Patch size & configuration analysis – Gunnison’s prairie dogs currently tend to occur in isolated
metapopulations (Wagner and Drickamer 2003). Distance to nearest clan is likely an important
factor in local range expansion. Based on the input of species experts we defined minimum
potential breeding patch size as 0.07 hectares, and minimum potential population core size as 1.5
hectares. To determine potential habitat patches and cores, the habitat suitability model for this
species was first averaged using a 3 x 3 pixel square neighborhood moving window analysis.
Biologically best corridor analysis – We did not model a biologically best corridor for this
species. Based on expert opinion regarding likely dispersal distance Gunnison’s prairie dog is
considered a “corridor dweller” requiring more than a generation to traverse the distance
between wildland blocks.
Results & Discussion
Union of biologically best corridors – The habitat suitability model indicates that significant
areas of high-quality habitat for Gunnison’s prairie dog exist in the linkage area, primarily in the
western portion in Garland and Government Prairies and Pittman Valley, and more centrally on
Camp Navajo (Figure 24). Most optimal and suitable habitat in the western portion is
encompassed by Strands A and B of the linkage design, with the exception of a relatively
developed portion of Garland Prairie lying between them. High-quality habitat on Camp Navajo
was not included in the linkage design; much of the land on Camp is classified as “developed
medium-high” though sizeable prairie dog colonies exist there. Suitable habitat in the wildland
blocks is more limited and somewhat isolated, especially in the Mogollon Rim block where it is
restricted to relatively small and scattered grassland areas near the block’s northern boundary.
Population cores exist and overlap these same areas of high-quality habitat, however there are
many areas within Strand A where the distance between breeding patches and population cores
exceeds the species’ estimated 300m mean dispersal distance. Thus Gunnison’s prairie dog is
vulnerable in the linkage area to habitat fragmentation from human development. The results
also illustrate the critical importance of human-occupied areas such as Camp Navajo and
Garland Prairie to GPD. An educational program stressing landowner tolerance of Gunnison’s
prairie dog colonies and conservation-oriented policies in the Flagstaff and Coconino County
land use plans will be essential to ensuring to the species’ long-term persistence and dispersal
between wildland blocks.

66
San Francisco Peaks – Mogollon Rim Linkage Design
Figure 24: Modeled habitat suitability for Gunnison’s prairie dog in the San
Francisco Peaks – Mogollon Rim Linkage

67
San Francisco Peaks – Mogollon Rim Linkage Design
Mule deer (Odocoileus hemionus)
Justification for Selection
Mule deer are widespread throughout
Arizona, and are an important prey species
for carnivores such as mountain lion,
jaguar, bobcat, and black bear (Anderson &
Wallmo 1984). Road systems may affect
the distribution and welfare of mule deer
(Sullivan and Messmer 2003, Dodd et al.
2010).
Distribution
Mule deer are found throughout most of
western North America, extending as far east as Nebraska, Kansas, and western Texas. In
Arizona mule deer are found throughout the state, except for the Sonoran desert in southwestern
Arizona where mule deer numbers are very low (Anderson and Wallmo 1984).
Habitat Associations
Mule deer in Arizona are categorized into two groups based on the habitat they occupy. In
northern Arizona mule deer inhabit yellow pine, spruce-fir, buckbrush, snowberry, and aspen
habitats (Hoffmeister 1986). The mule deer found in the pine and spruce-fir live there from April
to the beginning of winter, when they move down to the pinyon-juniper zone (Hoffmeister
1986). Elsewhere in the state, mule deer live in desert shrub, chaparral or even more xeric
habitats, which include scrub oak, mountain mahogany, sumac, skunk bush, buckthorn, and
manzanita (Wallmo 1981; Hoffmeister 1986).
Spatial Patterns
The home ranges of mule deer vary depending upon the availability of food and cover
(Hoffmeister 1986). Swank (1958) reports that home ranges of mule deer vary from 2.6 to 5.8
km2, with bucks’ home ranges averaging 5.2 km
2 and females' home ranges slightly smaller
(Hoffmeister 1986). Average home ranges for desert mule deer are larger. Deer that require
seasonal migration movements use approximately the same winter and summer home ranges in
consecutive years (Anderson & Wallmo 1984). Dispersal distances for male mule deer have been
recorded from 97 to 217 km, and females have moved 180 km (Anderson & Wallmo 1984). Two
desert mule deer yearlings were found to disperse 18.8 and 44.4 km (Scarbrough & Krausman
1988).
Conceptual Basis for Model Development
Habitat suitability model – Vegetation has the greatest role in determining deer distributions in
desert systems followed by topography (J. Marshal, pers. comm.). A similar pattern holds for
mule deer in forested areas of northern Arizona, though different associations with vegetation
types are observed (C. Lutch, pers. comm.). Carl Lutch of the Arizona Game and Fish
Department reviewed the factor weights and suitability scores obtained from CorridorDesign.Org
and adjusted these to reflect regional habitat associations for this species. Land cover received an
importance weight of 65%, while elevation, topography, and distance from roads received

68
San Francisco Peaks – Mogollon Rim Linkage Design
weights of 0%, 30%, and 5%, respectively. For specific scores of classes within each of these
factors, see Table 3.
Patch size & configuration analysis – Minimum breeding patch size for mule deer was defined
as 9 km2 or 900 hectares and minimum population core size as 45 km2 or 4,500 hectares. To
determine potential breeding patches and population cores, the habitat suitability model for this
species was first averaged using a 200m-radius moving window analysis given the species’ large
spatial requirements.
Biologically best corridor analysis – We used the methods described in Appendix A to identify
the biologically best corridor for this species.
Results & Discussion
Initial biologically best corridor – Modeling results indicate that large areas of optimal and
suitable habitat for mule deer are found throughout the potential linkage area and in both habitat
blocks (Figure 25). The biologically best corridor included three strands of comparable habitat
quality, and nearly all of this was modeled as optimal or suitable except for scattered small and
generally isolated areas in each strand. Most of the potential linkage area and of each habitat
block was identified as a potential population core, including nearly all the area encompassed by
the BBC. Areas modeled as low suitability were the more open habitats of Garland and
Government Prairies and a number of small areas classified as medium- or highly-developed,
and these areas, along with Rogers Lake and the north-central portion of Camp Navajo, were not
included as population cores.
As detailed under “Model validation” above we obtained mule deer telemetry data from
biologists in the Arizona Game and Fish Department Contracts Branch in an effort to validate
our initial biologically best corridor model. While this dataset was based on only 13 individuals
collected as part of a study of mule deer movements north and west of Flagstaff (Dodd et al.
2010), there is considerable overlap between the telemetry fixes obtained in the potential linkage
area and the easternmost strand of the mule deer biologically best corridor (Figure 4). In order to
create a more functional mule deer corridor and support future highway mitigation efforts, we
appended a small polygon encompassing additional mule deer telemetry points adjacent to the
initial BBC north and south of U.S. Highway 180. This adjustment was added to the
northwestern lobe of the easternmost strand of the initial mule deer BBC (Figure 25).
We also obtained wildlife-vehicle collision data from the Arizona Department of Transportation
for the period 1989 through 2006 to validate our mule deer biologically best corridor (see Figure
5a in “Model validation” section). While mule deer collisions occurred with some frequency
along most of the included length of I-40, collisions within the potential linkage area (roughly
encompassing mileposts 167- 195) peaked in the segment at mileposts 190-191, which lies
within the easternmost strand of the modeled BBC for mule deer.
Union of biologically best corridors – The UBBC provides significant additional optimal and
suitable habitat for mule deer in all three strands and large additional areas that could serve as
potential population cores. The westernmost of the three northern “lobes” of Strand C also
includes additional mule deer telemetry points (Figure 25). The main threats to connectivity for

69
San Francisco Peaks – Mogollon Rim Linkage Design
this species in the planning area will likely come from Interstate 40 and future urban and rural
development. Ongoing efforts by the Arizona Department of Transportation and Arizona Game
and Fish Department described above to develop crossing structures along I-40 aim to mitigate
this barrier for mule deer. Also, the underpass where the BNSF Railroad passes south under
Interstate 40 near the U.S. Naval Observatory in Strand C, which corresponds to a large cluster
of mule deer telemetry locations just north of this highway, may represent a potential bottleneck
for this and other species. Future efforts should focus on maintaining and possibly improving this
underpass to maintain connectivity in Strand C.
Figure 25: Modeled habitat suitability and biologically best corridor for mule
deer in the San Francisco Peaks – Mogollon Rim Linkage

70
San Francisco Peaks – Mogollon Rim Linkage Design
Northern leopard frog (Rana pipiens)
Justification for Selection Leopard frogs are aquatic species that require
habitat connectivity for dispersal. The northern
leopard frog, the most widespread of Arizona’s
six leopard frog species, is experiencing
population decline, likely due to drought and
groundwater depletion, predation and
competition by nonnative species, habitat loss,
and other human impacts (Blomquist and Sredl
2002; Stebbins 2003; Smith and Keinath 2004;
AGFD 2012b). Pope et al. (2000) found that this
species relies on habitat complementation, a
variety of habitat types with connectivity
between, for its various life stages. With its broad geographic distribution and sensitivity to
human disturbance, the northern leopard frog is an appropriate focal species for connectivity
modeling.
Distribution
The northern leopard frog is found in the Great Basin region of northern and central Arizona,
west to Nevada and Washington, north to southern and southeastern Canada, and east to New
Jersey (AGFD 2002a). In several states throughout its range, the northern leopard frog is a
species of special concern. While the northern leopard frog is not federally listed, US Fish &
Wildlife Service reviewed a petition to list the species as threatened in the western United States
in 2009 (Federal Register 2009). The Southern Mountain population is listed in Canada and
several Canadian provinces.
Habitat Associations
Northern leopard frogs are commonly found in grassland, brushland, woodland, forests, and
high-elevation forests. These vegetation types may occur within Great Basin desertscrub, Plains
and Great Basin grassland, Great Basin conifer woodland, and Petran montane conifer forests,
Madrean Evergreen forest, Mohave desertscrub, semidesert grassland, subalpine grassland,
Petran subalpine conifer forest, and all aquatic/riparian habitats (Brennan and Holycross 2006;
AGFD 2006a). Inhabited areas usually include permanent waters with rooted vegetation and/or
lakes, ponds, canals, cattle tanks, ditches, marshes, springs, and streams (AGFD 2002a; Brennan
and Holycross 2006).
Habitat needs may change seasonally; winter habitat includes lakes, streams, and ponds, summer
habitat includes more upland foraging for adults, and breeding habitat requires shallow ponds
(Smith and Keinath 2004). Another common name for the species is “meadow frog” because it
often occurs in grasslands or fields of perennial forage crops in the non-breeding season
(Stebbins 2003; Merrell 1977). Vegetative cover probably reduces predation as well as moisture
loss through their permeable skin (Mazerolle and Desroches 2005). Ephemeral waters are likely
used for dispersal as well as non-breeding habitat (Blomquist and Sredl 2002).

71
San Francisco Peaks – Mogollon Rim Linkage Design
Northern leopard frogs are found at elevations of 0 to 3353 meters (0-11,000 ft) throughout their
range (Stebbins 2003), while AGFD has observed them at elevations from 805-2,790 meters
(2,640 to 9,155 ft) in Arizona (unpublished data). Northern leopard frogs escape to water when
disturbed and use deep water for hibernation in the winter (Stebbins 2003; Brennan and
Holycross 2006). In modeling suitable habitat, Southwest ReGAP used the following
topographical features preferred: valley flats; toe slopes, bottoms, and swales; gently sloping
ridges and hills; nearly level plateau or terrace (http://fws-nmcfwru.nmsu.edu/swregap/). Young
frogs use drainages and vegetated lands for dispersal movements (Seburn et al. 1997).
Spatial Patterns
Northern leopard frogs are solitary outside the breeding season, and may or may not be territorial
during the breeding season (Harding 1997; Rorabaugh 2005). Few studies have estimated home
ranges.
Conceptual Basis for Model Development
Habitat suitability model – Roads contribute directly to mortality by vehicle collisions (Merrell
1970), but also have indirect impacts that include siltation and water pollution from runoff
(Smith and Keinath 2007). Carr and Fahrig (2001) found that roads within 1.5 km of breeding
ponds negatively affected leopard frog population density. Mazerolle and Desrochers (2005)
found that undisturbed substrates with vegetative cover facilitated northern leopard frog
movements through the landscape. Conversely, barren and agricultural lands created by peat-
mining were avoided, decreased homing success, and accelerated desiccation in frogs. Species
experts consulted to parameterize the suitability model for this species stressed the importance of
including a perennial water layer in modeling (e.g. S. MacVean, pers. comm.). Thus land cover
received an importance weight of 15%, while elevation, topography, distance from roads, and
distance from water received weights of 0%, 25%, 10%, and 50%, respectively. For specific
scores of classes within each of these factors see Table 3.
Patch size & configuration analysis – Studies of typical dispersal distances for this species have
yielded varying results. In Minnesota, adults traveled up to 1.6 km from hibernation sites to
breeding sites (Merrell 1970). Dole (1971) found that young frogs usually settle within 800 m of
natal sites, although he recorded one individual 5.2 km away, while Seburn et al. (1997) found
dispersal distances of up to 8 km in Canada. According to Smith and Keinath (2007), research
gaps include causes of mortality, juvenile dispersal, and effects of human disturbance on
individuals. Based on the input of species experts we defined minimum potential breeding patch
size as 0.01 hectares, and minimum potential population core size as 0.1 hectares. To determine
potential habitat patches and cores, the habitat suitability model for this species was first
averaged using a 3 x 3 pixel square neighborhood moving window analysis.
Biologically best corridor analysis – We did not model a biologically best corridor for this
species. Based on expert opinion regarding likely dispersal distance northern leopard frog is
considered a “corridor dweller” requiring more than a generation to traverse the distance
between wildland blocks.

72
San Francisco Peaks – Mogollon Rim Linkage Design
Results & Discussion
Union of biologically best corridors – As expected given the scattered distribution of perennial
water in the linkage planning area, optimal and suitable habitat for northern leopard frog is
restricted to isolated patches in both the potential linkage area and the two wildland blocks
(Figure 26). High-quality habitat is largely associated with stock tanks and small lakes and to a
much lesser extent drainages, and somewhat more suitable habitat is found in Strand A than in
the other two strands. All areas of high-quality habitat are associated with population cores,
given the small spatial requirements of the species. Given the wide variation in dispersal
distances reported in prior studies (from 0.8 to 8.0 km), an important unanswered question is
whether the average distance between habitat patches in the linkage design is adequate to ensure
movement between wildland blocks across multiple generations. Interpatch distances in the
linkage design vary greatly, from as little as .1 km to 4 km. Given that this species is being
actively considered for reintroduction efforts within the linkage planning area it will be
important to collect further data on northern leopard frog dispersal distance in the region, and
compare this to the distribution of potential habitat patches when considering relocation sites.
Northern leopard frogs are also vulnerable to predation from non-native aquatics and their
successful reintroduction will depend on eradication and exclusion of such species.

73
San Francisco Peaks – Mogollon Rim Linkage Design
Figure 26: Modeled habitat suitability for northern leopard frog in the San
Francisco Peaks – Mogollon Rim Linkage

74
San Francisco Peaks – Mogollon Rim Linkage Design
Porcupine (Erethizon dorsatum)
Justification for Selection
The porcupine’s range has been reduced in some areas due to
changes in human distribution and land use (Woods 1973).
Porcupines are frequently killed by automobiles while
crossing roads (Woods 1973).
Distribution
Porcupines are widespread in much of North America, from
Alaska and northern Canada to parts of northern Mexico
(Woods 1973). The porcupine’s range includes most of
Arizona in forested, mountainous regions of the state as well
as riparian areas in lower elevations; they are considered
absent or rare in desert areas (Hoffmeister 1986).
Habitat Associations
Porcupines inhabit montane and subalpine forests that include ponderosa pine, spruce-fir, aspen,
pinyon, juniper, and oak in higher elevations. They also live in cottonwood-willow forests of
riparian areas and mesquite thickets of semidesert shrublands (New Mexico Department of Game
and Fish 2004). In Arizona, they also occur in grassland, chaparral or desert scrub (Hoffmeister
1986). Porcupines consume bark from trees in these areas, as well as mistletoe, pine needles, oak
leaves, acorns, fungi, buckbrush, and the fruit of prickly pear cactus (New Mexico Department of
Game and Fish 2004). Porcupines seek out rock piles, rocky slopes, mine shafts, and caves for
shelter (Hoffmeister 1986).
Spatial Patterns
Home ranges of porcupines are restricted, with summer range larger than winter range (Woods
1973). Average summer home range is 14 hectares (Marshall et al. 1962), while winter home
range is up to 5 hectares (Smith 1979). Average yearly home range has been estimated as 70 ha
(Roze 1989). They will occupy the same dens for many years and even generations (Hoffmeister
1986). Individuals move an average of 1.5 kilometers to and from their winter den (Woods
1973). Dispersal among porcupines is female-biased, with juvenile female porcupines dispersing
an average of 3.7 km while juvenile males generally remain within their natal ranges (Sweitzer
and Berger 1998).
Conceptual Basis for Model Development
Habitat suitability model – Land cover received an importance weight of 87%, while elevation,
topography, and distance from roads received weights of 0%, 3%, and 10%, respectively. For
specific scores of classes within each of these factors see Table 3.
Patch size & configuration analysis – Minimum patch size for porcupine was defined as 50 ha
and minimum core size as 250 ha. To determine potential habitat patches and cores, the habitat
suitability model for this species was first averaged using a 3x3 pixel square neighborhood
moving window analysis.

75
San Francisco Peaks – Mogollon Rim Linkage Design
Biologically best corridor analysis – We used the methods described in Appendix A to identify
the biologically best corridor for this species.
Results & Discussion
Initial biologically best corridor – Modeling results indicate that abundant optimal habitat for
porcupine is found throughout the potential linkage area and in both habitat blocks (Figure 27).
Only open habitats (e.g. Garland and Government Prairies, Rogers Lake) and areas classified as
developed (e.g. north-central areas of Camp Navajo, areas with developed housing) were
modeled as not suitable. The great majority of the habitat within both strands of the biologically
best corridor was modeled as optimal. Most of the potential linkage area and of each habitat
block was identified as a potential population core including nearly all of the area encompassed
by the BBC. Areas not modeled as potential population cores corresponded to areas modeled as
not suitable as described immediately above.
Union of biologically best corridors – The UBBC provides significant additional optimal and
suitable habitat for porcupine in all three strands. The main threat to persistence and connectivity
for this species is likely major roadways (Interstate 40) and habitat fragmentation from future
housing and other development. It will be important to consider the needs of smaller species such
as porcupines when developing and maintaining crossing structures in the linkage design area.
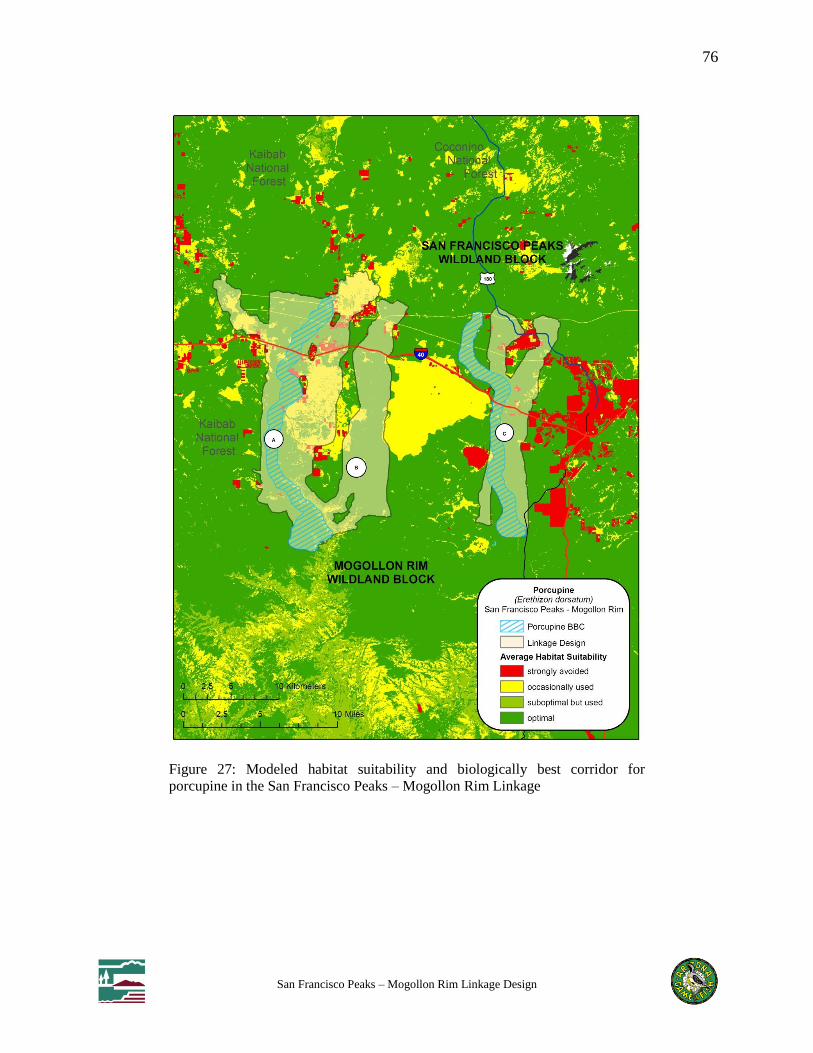
76
San Francisco Peaks – Mogollon Rim Linkage Design
Figure 27: Modeled habitat suitability and biologically best corridor for
porcupine in the San Francisco Peaks – Mogollon Rim Linkage

77
San Francisco Peaks – Mogollon Rim Linkage Design
Pronghorn (Antilocapra americana)
Justification for Selection
Pronghorn are known to be susceptible to
habitat degradation and human
development (AGFD 2002b). One
example of harmful development is right
of way fences for highways and railroads,
which are the major factor affecting
pronghorn movements across their range
(Ockenfels et al. 1997). Existence of
migration corridors is critical to
pronghorn survival for allowing
movement to lower elevation winter
ranges away from high snowfall amounts
(Ockenfels et al. 2002).
Distribution
Pronghorn range through much of the western United States, and are found throughout the
grasslands of Arizona (A. Munig, personal comm., Hoffmeister 1986).
Habitat Associations
Pronghorn are found in areas of grasses and scattered shrubs with rolling hills or mesas (Ticer
and Ockenfels 2001, New Mexico Department of Game and Fish 2004). They inhabit shortgrass
plains as well as riparian areas of sycamore and rabbitbrush, and oak savannas (New Mexico
Department of Game and Fish 2004). In winter, pronghorn rely on browse, especially sagebrush
(O’Gara 1978). Pronghorn prefer gentle terrain, and avoid rugged areas (Ockenfels et al. 1997).
In many areas woodland and coniferous forests are also generally avoided, especially when high
tree density obstructs vision (Ockenfels et al. 2002). In northern Arizona somewhat different
associations with vegetation types have been observed, with pronghorn sometimes utilizing and
moving through ponderosa pine or other forest types with significant cover (T. McCall, pers.
comm., J. Lynn, pers. comm.). Also for visibility, pronghorn prefer slopes that are less than 30%
(Yoakum et al. 1996).
Spatial Patterns
In northern populations, home range has been estimated to range from 0.2 to 5.2 km2, depending
on season, terrain, and available resources (O’Gara 1978). However, large variation in sizes of
home and seasonal ranges due to habitat quality and weather conditions make it difficult to apply
data from other studies (O’Gara 1978). Other studies report home ranges that average 88 km2
(Ockenfels et al. 1994) and 170 km2 in central Arizona (Bright & Van Riper III 2000), and in the
75 – 125 km2 range (n=37) in northern Arizona (Ockenfels et al. 1997). The Sonoran pronghorn
subspecies is known to require even larger tracts of land to obtain adequate forage (AGFD
2002c). One study of collared Sonoran pronghorn found the home range of 4 males to range
from 64 km2 – 1,214 km
2 (avg. 800 km
2), while females ranged from 41 km² - 1,144 km
2 (avg.
465.7 km2) (AGFD 2002c). Another study of Sonoran pronghorn found home range to range
from 43 to 2,873 km2, with mean home range size of 511 + 665 SD km
2 (n=22), which is much

78
San Francisco Peaks – Mogollon Rim Linkage Design
larger than other pronghorn subspecies (Hervert et al. 2005). One key element in pronghorn
movement is distance to water. One study found that 84% of locations were less than 6 km from
water sources (Bright & Van Riper III 2000), and another reports collared pronghorn locations
from 1.5 – 6.5 km of a water source (Yoakum et al. 1996). Habitats within 1 km of water appear
to be key fawn bedsite areas for neonate fawns (Ockenfels et al. 1992).
Conceptual Basis for Model Development
Habitat suitability model – Tom McCall of the Arizona Game and Fish Department reviewed the
factor weights and suitability scores obtained from CorridorDesign.Org and adjusted these to
reflect regional habitat associations for this species. Vegetation received an importance weight of
45%, while elevation, topography, and distance from roads received weights of 0%, 37%, and
18%, respectively. For specific scores of classes within each of these factors see Table 3.
Patch size & configuration analysis – Minimum patch size for pronghorn was defined as 50 km2
or 5,000 ha and minimum core size as 250 km2 or 25,000 ha. To determine potential habitat
patches and cores, the habitat suitability model for this species was first averaged using a 200m-
radius moving window analysis due to the species’ large spatial requirements.
Biologically best corridor analysis – We used the methods described in Appendix A to identify
the biologically best corridor for this species.
Results & Discussion
Initial biologically best corridor – Modeling results indicate that significant amounts of optimal
and suitable habitat for pronghorn exist throughout the potential linkage area and in both habitat
blocks, with the highest quality habitat concentrated in grassland areas such as Garland and
Government Prairies and lands south of Camp Navajo (Figure 28). Suitable habitat is generally
limited in the Mogollon Rim block to its northern portion where topographic relief is less
pronounced. Large areas of potential population cores also exist throughout the analysis area and
their distribution mirrors that of optimal and suitable habitat, and includes most of the area
encompassed by the BBC except where this traverses the developed areas of Parks and Spring
Valley just north of Interstate 40.
Union of biologically best corridors – The UBBC provides significant additional optimal and
suitable habitat for pronghorn in all three strands. Pronghorn are highly vulnerable to habitat
fragmentation from roads, fencing, and housing development and are threatened in the area of
the linkage design by all of these. Interstate 40 represents perhaps the greatest single threat to
persistence and connectivity for this species. As discussed in detail above (see
“Recommendations for crossing structures”) there may be an opportunity in the future to develop
a wildlife overpass for pronghorn on I-40 within the modeled BBC, but this will depend upon
significant funding and habitat restoration to realize. Pronghorn would also benefit from removal
and retrofitting of fencing to wildlife-friendly specifications throughout the linkage planning
area, particularly in more open grassland areas including areas not encompassed by the strands of
the linkage design where significant additional habitat exists for this species.
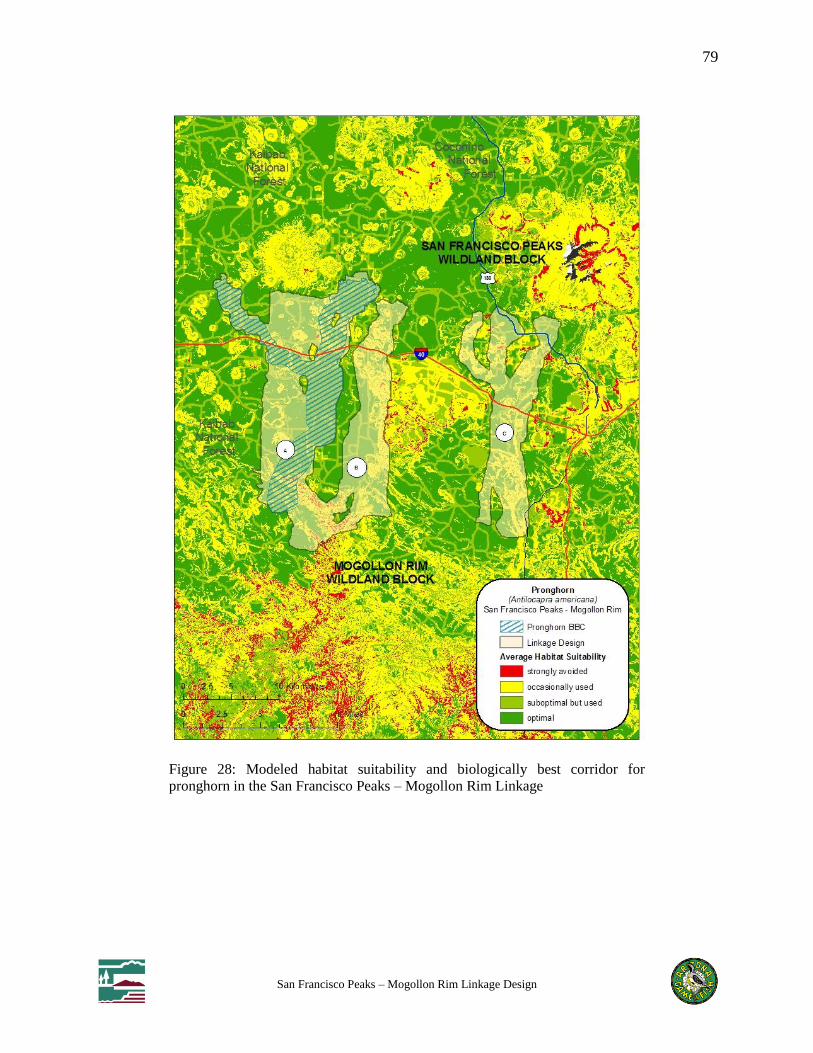
79
San Francisco Peaks – Mogollon Rim Linkage Design
Figure 28: Modeled habitat suitability and biologically best corridor for
pronghorn in the San Francisco Peaks – Mogollon Rim Linkage

80
San Francisco Peaks – Mogollon Rim Linkage Design
APPENDIX C: NON-MODELED SPECIES WITHIN LINKAGE DESIGN
The linkage design provides habitat for many species not modeled
which are of conservation concern to state and federal
management agencies, such as the Mexican spotted owl (Strix
occidentalis lucida), listed threatened under the Endangered
Species Act. Table 4 reflects the diverse ecological benefits to
plants, animals, and the ecosystems on which they depend that
can result from conservation efforts within the linkage design. We
recommend integrating this linkage design into agency land
management plans and conservation programs to help realize
these benefits.
Table 4: Non-modeled species occurring in the linkage design which are of conservation concern to state
and federal management agencies (Source: Heritage Database Management System, Arizona Game and
Fish Department). Key: ESA = Endangered Species Act, USFS = US Forest Service, BLM = US Bureau Of Land
Management, State = Arizona Game And Fish Department, SC = Species Of Concern, LT = Listed As Threatened, S = Sensitive,
WSC = Wildlife Species Of Concern, SR = Salvage Restricted, Collection Only With Permit.
CATEGORY NAME COMMON NAME ESA USFS BLM STATE Vertebrate Idionycteris phyllotis Allen’s lappet-browed bat SC S
Vertebrate Myotis occultus Arizona myotis SC
Vertebrate Haliaeetus leucocephalus (wintering) bald eagle SC S S WSC
Vertebrate Eptesicus fuscus big brown bat
Vertebrate Tadarida brasiliensis Brazilian free-tailed bat
Vascular plant Cystopteris bulbifera bulblet fern
Vascular plant Phacelia serrata cinder phacelia SC
Vascular plant Clematis hirsutissima clustered leather flower S
Vascular plant Astragalus troglodytes creeping milk vetch
Vascular plant Penstemon nudiflorus Flagstaff beardtongue S
Vascular plant Hedeoma diffusa Flagstaff false pennyroyal S SR
Vertebrate Myotis thysanodes fringed myotis SC
Vertebrate Lasiurus cinereus hoary bat
Vascular plant Agrimonia gryposepala hook-nosed agrimony
Vertebrate Myotis evotis long-eared myotis SC
Vascular plant Ivesia multifoliolata many-leaved ivesia
Vertebrate Strix occidentalis lucida Mexican spotted owl LT WSC
Vertebrate Accipiter gentilis Northern goshawk SC S S WSC
Vertebrate Pandion haliaetus osprey S WSC
Vertebrate Antrozous pallidus pallid bat
Vascular Plant Hesperochiron pumilus pygmy Western waterleaf
Vascular Plant Astragalus rusbyi Rusby’s milk-vetch S
Vertebrate Lasionycteris noctivagans silver-haired bat
Vertebrate Myotis auriculus Southwestern myotis
Vertebrate Cathartes aura turkey vulture
Vascular Plant Talinum validulum Tusayan flame flower SC SR
Vascular Plant Rubus leucodermis Western raspberry
Vascular Plant Nuphar luteum ssp. polysepalum
yellow pond lily
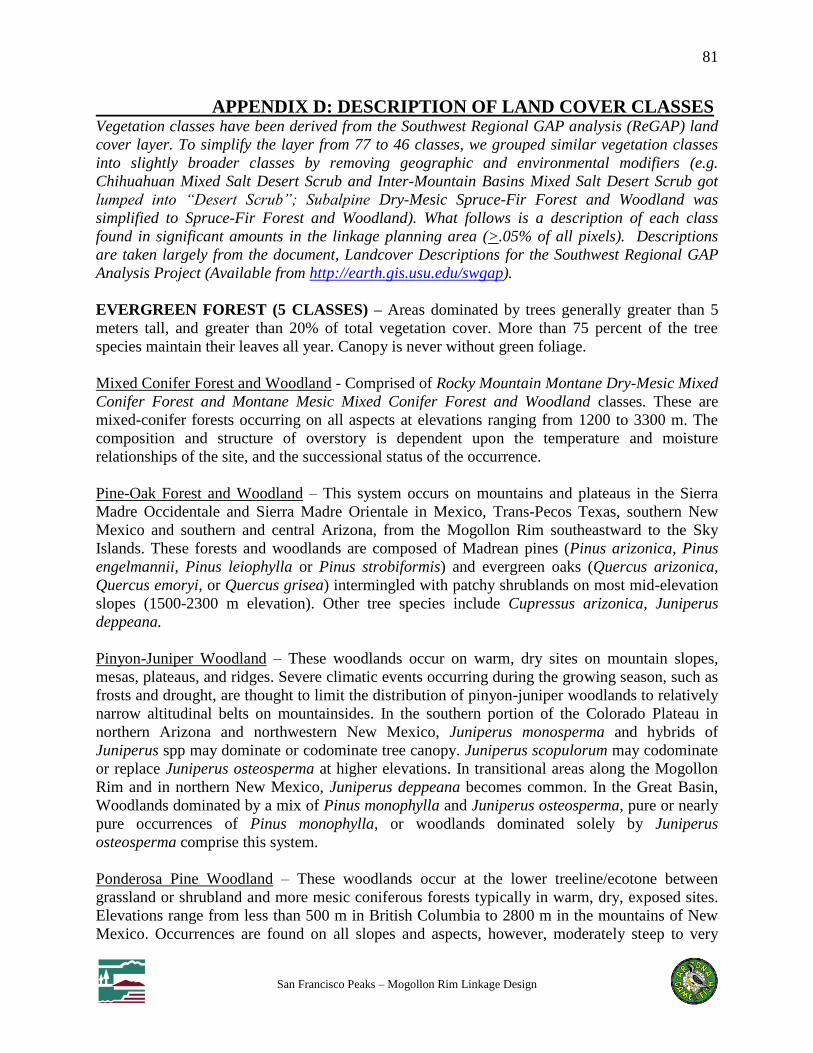
81
San Francisco Peaks – Mogollon Rim Linkage Design
APPENDIX D: DESCRIPTION OF LAND COVER CLASSES Vegetation classes have been derived from the Southwest Regional GAP analysis (ReGAP) land
cover layer. To simplify the layer from 77 to 46 classes, we grouped similar vegetation classes
into slightly broader classes by removing geographic and environmental modifiers (e.g.
Chihuahuan Mixed Salt Desert Scrub and Inter-Mountain Basins Mixed Salt Desert Scrub got
lumped into “Desert Scrub”; Subalpine Dry-Mesic Spruce-Fir Forest and Woodland was
simplified to Spruce-Fir Forest and Woodland). What follows is a description of each class
found in significant amounts in the linkage planning area (>.05% of all pixels). Descriptions
are taken largely from the document, Landcover Descriptions for the Southwest Regional GAP
Analysis Project (Available from http://earth.gis.usu.edu/swgap).
EVERGREEN FOREST (5 CLASSES) – Areas dominated by trees generally greater than 5
meters tall, and greater than 20% of total vegetation cover. More than 75 percent of the tree
species maintain their leaves all year. Canopy is never without green foliage.
Mixed Conifer Forest and Woodland - Comprised of Rocky Mountain Montane Dry-Mesic Mixed
Conifer Forest and Montane Mesic Mixed Conifer Forest and Woodland classes. These are
mixed-conifer forests occurring on all aspects at elevations ranging from 1200 to 3300 m. The
composition and structure of overstory is dependent upon the temperature and moisture
relationships of the site, and the successional status of the occurrence.
Pine-Oak Forest and Woodland – This system occurs on mountains and plateaus in the Sierra
Madre Occidentale and Sierra Madre Orientale in Mexico, Trans-Pecos Texas, southern New
Mexico and southern and central Arizona, from the Mogollon Rim southeastward to the Sky
Islands. These forests and woodlands are composed of Madrean pines (Pinus arizonica, Pinus
engelmannii, Pinus leiophylla or Pinus strobiformis) and evergreen oaks (Quercus arizonica,
Quercus emoryi, or Quercus grisea) intermingled with patchy shrublands on most mid-elevation
slopes (1500-2300 m elevation). Other tree species include Cupressus arizonica, Juniperus
deppeana.
Pinyon-Juniper Woodland – These woodlands occur on warm, dry sites on mountain slopes,
mesas, plateaus, and ridges. Severe climatic events occurring during the growing season, such as
frosts and drought, are thought to limit the distribution of pinyon-juniper woodlands to relatively
narrow altitudinal belts on mountainsides. In the southern portion of the Colorado Plateau in
northern Arizona and northwestern New Mexico, Juniperus monosperma and hybrids of
Juniperus spp may dominate or codominate tree canopy. Juniperus scopulorum may codominate
or replace Juniperus osteosperma at higher elevations. In transitional areas along the Mogollon
Rim and in northern New Mexico, Juniperus deppeana becomes common. In the Great Basin,
Woodlands dominated by a mix of Pinus monophylla and Juniperus osteosperma, pure or nearly
pure occurrences of Pinus monophylla, or woodlands dominated solely by Juniperus
osteosperma comprise this system.
Ponderosa Pine Woodland – These woodlands occur at the lower treeline/ecotone between
grassland or shrubland and more mesic coniferous forests typically in warm, dry, exposed sites.
Elevations range from less than 500 m in British Columbia to 2800 m in the mountains of New
Mexico. Occurrences are found on all slopes and aspects, however, moderately steep to very

82
San Francisco Peaks – Mogollon Rim Linkage Design
steep slopes or ridgetops are most common. Pinus ponderosa is the predominant conifer;
Pseudotsuga menziesii, Pinus edulis, and Juniperus spp. May be present in the tree canopy.
Spruce-Fir Forest and Woodland – Engelmann spruce and subalpine fir forests comprise a
substantial part of the subalpine forests of the Cascades and Rocky Mountains from southern
British Columbia east into Alberta, south into New Mexico and the Intermountain region. They
are the matrix forests of the subalpine zone, with elevations ranging from 1525 to 3355 m (5000-
11,000 feet). Sites within this system are cold year-round, and precipitation is predominantly in
the form of snow, which may persist until late summer. Despite their wide distribution, the tree
canopy characteristics are remarkably similar, with Picea engelmannii and Abies lasiocarpa
dominating either mixed or alone. Pinus contorta is common in many occurrences and patches of
pure Pinus contorta are not uncommon, as well as mixed conifer/Populus tremuloides stands.
Xeric species may include Juniperus communis, Linnaea borealis, Mahonia repens, or
Vaccinium scoparium.
DECIDUOUS FOREST (1 CLASS) – Areas dominated by trees generally greater than 5 meters
tall, and greater than 20% of total vegetation cover. More than 75 percent of the tree species shed
foliage simultaneously in response to seasonal change.
Aspen Forest and Woodland - Elevations generally range from 1525 to 3050 m (5000-10,000
feet), but occurrences can be found at lower elevations in some regions. Distribution of this
ecological system is primarily limited by adequate soil moisture required to meet its high
evapotranspiration demand, and secondarily is limited by the length of the growing season or
low temperatures. These are upland forests and woodlands dominated by Populus tremuloides
without a significant conifer component (<25% relative tree cover).
GRASSLANDS-HERBACEOUS (3 CLASSES) – Areas dominated by graminoid or
herbaceous vegetation, generally greater than 80% of total vegetation. These areas are not
subject to intensive management such as tilling, but can be utilized for grazing.
Juniper Savanna – The vegetation is typically open savanna, although there may be inclusions of
more dense juniper woodlands. This savanna is dominated by Juniperus osteosperma trees with
high cover of perennial bunch grasses and forbs, with Bouteloua gracilis and Pleuraphis jamesii
being most common. In southeastern Arizona, these savannas have widely spaced mature juniper
trees and moderate to high cover of graminoids (>25% cover). The presence of Madrean
Juniperus spp. such as Juniperus coahuilensis, Juniperus pinchotii, and/or Juniperus deppeana is
diagnostic.
Montane-Subalpine Grassland – This Rocky Mountain ecological system typically occurs
between 2200-3000 m on flat to rolling plains and parks or on lower sideslopes that are dry, but
may extend up to 3350 m on warm aspects. An occurrence usually consists of a mosaic of two
or three plant associations with one of the following dominant bunch grasses: Danthonia
intermedia, Danthonia parryi, Festuca idahoensis, Festuca arizonica, Festuca thurberi,
Muhlenbergia filiculmis, or Pseudoroegneria spicata. These large-patch grasslands are
intermixed with matrix stands of spruce-fir, lodgepole, ponderosa pine, and aspen forests.

83
San Francisco Peaks – Mogollon Rim Linkage Design
Semi-Desert Grassland and Shrub Steppe – Comprised of Semi-Desert Shrub Steppe and
Piedmont Semi- Desert Grassland and Steppe. Semi-Desert Shrub is typically dominated by
graminoids (>25% cover) with an open shrub layer, but includes sparse mixed shrublands
without a strong graminoid layer. Steppe Piedmont Semi-Desert Grassland and Steppe is a
broadly defined desert grassland, mixed shrub-succulent or xeromorphic tree savanna that is
typical of the Borderlands of Arizona, New Mexico and northern Mexico [Apacherian region],
but extends west to the Sonoran Desert, north into the Mogollon Rim and throughout much of
the Chihuahuan Desert. It is found on gently sloping bajadas that supported frequent fire
throughout the Sky Islands and on mesas and steeper piedmont and foothill slopes in the
Chihuahuan Desert. It is characterized by typically diverse perennial grasses. Common grass
species include Bouteloua eriopoda, B. hirsuta, B. rothrockii, B. curtipendula, B. gracilis,
Eragrostis intermedia, Muhlenbergia porteri, Muhlenbergia setifolia, Pleuraphis jamesii,
Pleuraphis mutica, and Sporobolus airoides, succulent species of Agave, Dasylirion, and Yucca,
and tall shrub/short tree species of Prosopis and various oaks (e.g., Quercus grisea, Quercus
emoryi, Quercus arizonica).
SCRUB-SHRUB (5 CLASSES) – Areas dominated by shrubs; less than 5 meters tall with shrub
canopy typically greater than 20% of total vegetation. This class includes true shrubs, young
trees in an early successional stage or trees stunted from environmental conditions.
Chaparral – This ecological system occurs across central Arizona (Mogollon Rim), western New
Mexico and southwestern Utah and southeast Nevada. It often dominants along the mid-
elevation transition from the Mojave, Sonoran, and northern Chihuahuan deserts into mountains
(1000-2200 m). It occurs on foothills, mountain slopes and canyons in dryer habitats below the
encinal and Pinus ponderosa woodlands. Stands are often associated with more xeric and coarse-
textured substrates such as limestone, basalt or alluvium, especially in transition areas with more
mesic woodlands.
Creosotebush-White Bursage Desert Scrub – This ecological system forms the vegetation matrix
in broad valleys, lower bajadas, plains and low hills in the Mojave and lower Sonoran deserts.
This desert scrub is characterized by a sparse to moderately dense layer (2-50% cover) of
xeromorphic microphyllous and broad-leaved shrubs. Larrea tridentata and Ambrosia dumosa
are typically dominants, but many different shrubs, dwarf-shrubs, and cacti may codominate or
form typically sparse understories.
Desert Scrub (misc) – Comprised of Succulent Desert Scrub, Mixed Salt Desert Scrub, and Mid-
Elevation Desert Scrub. Vegetation is characterized by a typically open to moderately dense
shrubland.
Gambel Oak-Mixed Montane Shrubland – This ecological system occurs in the mountains,
plateaus and foothills in the southern Rocky Mountains and Colorado Plateau, including the
Uinta and Wasatch ranges and the Mogollon Rim. These shrublands are most commonly found
along dry foothills, lower mountain slopes, and at the edge of the western Great Plains from
approximately 2000 to 2900 m in elevation, and are often situated above pinyon-juniper
woodlands. The vegetation is typically dominated by Quercus gambelii alone or codominant
with Amelanchier alnifolia, Amelanchier utahensis, Artemisia tridentata, Cercocarpus

84
San Francisco Peaks – Mogollon Rim Linkage Design
montanus, Prunus virginiana, Purshia stansburiana, Purshia tridentata, Robinia neomexicana,
Symphoricarpos oreophilus, or Symphoricarpos rotundifolius. There may be inclusions of other
mesic montane shrublands with Quercus gambelii absent or as a relatively minor component.
This ecological system intergrades with the lower montane-foothills shrubland system and shares
many of the same site characteristics.
Mesquite Upland Scrub – This ecological system occurs as upland shrublands that are
concentrated in the extensive grassland-shrubland transition in foothills and piedmont in the
Chihuahuan Desert. Vegetation is typically dominated by Prosopis glandulosa or Prosopis
velutina and succulents. Other desert scrub that may codominate or dominate includes Acacia
neovernicosa, Acacia constricta, Juniperus monosperma, or Juniperus coahuilensis. Grass cover
is typically low.
WOODY WETLAND (1 CLASS) – Areas where forest or shrubland vegetation accounts for
greater than 20 percent of vegetative cover and the soil or substrate is periodically saturated with
or covered with water.
Riparian Woodland and Shrubland – This system is dependent on a natural hydrologic regime,
especially annual to episodic flooding. Occurrences are found within the flood zone of rivers, on
islands, sand or cobble bars, and immediate streambanks. In mountain canyons and valleys of
southern Arizona, this system consists of mid- to low-elevation (1100-1800 m) riparian corridors
along perennial and seasonally intermittent streams. The vegetation is a mix of riparian
woodlands and shrublands. Throughout the Rocky Mountain and Colorado Plateau regions, this
system occurs within a broad elevation range from approximately 900 to 2800 m., as a mosaic of
multiple communities that are tree-dominated with a diverse shrub component.
BARREN LANDS (3 CLASSES) – Barren areas of bedrock, desert pavement, scarps, talus,
slides, volcanic material, glacial debris, sand dunes, strip mines, gravel pits and other
accumulation of earthen material. Generally, vegetation accounts for less than 15% of total
cover.
Mixed Bedrock Canyon and Tableland – The distribution of this ecological system is centered on
the Colorado Plateau where it is comprised of barren and sparsely vegetated landscapes
(generally <10% plant cover) of steep cliff faces, narrow canyons, and open tablelands of
predominantly sedimentary rocks, such as sandstone, shale, and limestone. Some eroding shale
layers similar to Inter-Mountain Basins Shale Badland (CES304.789) may be interbedded
between the harder rocks. The vegetation is characterized by very open tree canopy or scattered
trees and shrubs with a sparse herbaceous layer.
Playa – This system is composed of barren and sparsely vegetated playas (generally <10% plant
cover) found across the Intermountain western U.S. and warm deserts of North America. Playas
form with intermittent flooding, followed by evaporation, leaving behind a saline residue. Salt
crusts are common throughout, with small saltgrass beds in depressions and sparse shrubs around
the margins. Subsoils often include an impermeable layer of clay or caliche. Large desert playas
tend to be defined by vegetation rings formed in response to salinity. In northern Arizona

85
San Francisco Peaks – Mogollon Rim Linkage Design
includes less saline high-elevation ephemeral wetlands with >10% plant cover including a mix of
grasses and emergent species.
Volcanic Rock Land and Cinder Land – This ecological system occurs in the Intermountain
western U.S. and is limited to barren and sparsely vegetated volcanic substrates (generally <10%
plant cover) such as basalt lava (malpais), basalt dikes with associated colluvium, basalt cliff
faces and uplifted "backbones," tuff, cinder cones or cinder fields. It may occur as large-patch,
small-patch and linear (dikes) spatial patterns. Vegetation is variable and includes a variety of
species depending on local environmental conditions, e.g., elevation, age and type of substrate.
At montane and foothill elevations scattered Pinus ponderosa, Pinus flexilis, or Juniperus spp.
trees may be present.
DEVELOPED AND AGRICULTURE (2 CLASSES) –
Developed, Medium - High Intensity – Developed, Medium Intensity: Includes areas with a
mixture of constructed materials and vegetation. Impervious surface accounts for 50-79 percent
of the total cover. These areas most commonly include single-family housing units. Developed,
High Intensity: Includes highly developed areas where people reside or work in high numbers.
Examples include apartment complexes, row houses and commercial/industrial. Impervious
surfaces account for 80 to 100 percent of the total cover.
Developed, Open Space - Low Intensity – Open Space: Includes areas with a mixture of some
construction materials, but mostly vegetation in the form of lawn grasses. Impervious surfaces
account for less than 20 percent of total cover. These areas most commonly include large-lot
single-family housing units, parks, golf courses, and vegetation planted in developed settings for
recreation, erosion control, or aesthetic purposes. Developed, Low intensity: Includes areas with a
mixture of constructed materials and vegetation. Impervious surfaces account for 20-49 percent
of total cover. These areas most commonly include single family housing units.
OPEN WATER (1 CLASS) – All areas of open water, generally with less than 25% cover of
vegetation or soil.

86
San Francisco Peaks – Mogollon Rim Linkage Design
APPENDIX E: CREATING A PERENNIAL WATERS DATASET Northern leopard frogs are dependent upon perennial water sources for breeding and
intermittently wet drainages for dispersal. In order to model habitat connectivity for this species,
we needed an accurate and up to date spatial dataset for bodies of water within the analysis area.
Various data sources were available, but none were complete to a degree that local experts felt
comfortable using for the model. Given the stakeholder support for modeling this species, its
population decline, and its surrogacy for additional aquatic species, we decided to create a waters
dataset for use in developing our corridor model. While other focal species depend on water
sources for survival, to adjust the factor weights to include a fifth factor would have required
reviews by multiple experts for each species model. It was determined that the suitability models
for all but the Northern leopard frog would not be re-run with this additional dataset. The
following methods were used to create a perennial waters dataset:
1) Gathered available water datasets from the following parties:
Arizona Department of Environmental Quality
Arizona Department of Water Resources
Arizona Game & Fish Department
Northern Arizona University
US Department of Commerce & US Census Bureau
US Fish & Wildlife Service
US Geological Survey
2) Clipped all data sources to within 1km of the analysis area and stored in file geodatabase.
3) Surveyed the data for quality by reading metadata, consulting data users, and comparing
datasets against maps and against each other. Extracted most reliable and unique perennial
waters information.
Notes and decision points:
NHD data was the most comprehensive and was used as a starting point. NHD has separate
shapefiles for streams and waterbodies (including tanks, ponds, springs, etc). All other datasets
were compared against this one to capture additional water sources. Data sources >7 years old
and without metadata were not used. Sources that seemed to include ephemeral water sources
and non-unique perennial sources were dismissed. Due to variability in collection techniques and
projections, spatial errors seemed extensive. We used a distance of 50 meters between points to
determine unique locations. In other words, if two datasets represented a small water body
differing by only 30 meters on the ground, we considered these to be representative of a single
water feature.
4) Created a single point shapefile including NHD data, AGFD wildlife waters, ADWR springs
locations, and AGFD leopard frog locations.
5) Created a single polygon shapefile including NHD waterbodies, TIGER geographic
waterbodies, and NHD data for major rivers and creeks.
6) Created a single line shapefile based on ADEQ’s perennial waters data.

87
San Francisco Peaks – Mogollon Rim Linkage Design
Creation of single raster file from which distance bands were calculated:
1) Changed all ‘Resolution’ field entries to 2 and used this as value field (added field to
PerennialADEQ1kmCLIP). Provided matching data field for subsequent merges.
2) Created separate GRID files for line data, polygon data, and point data at 30 meter cell size.
3) Used “mosaic” tool to combine GRID files into single raster file “Waters_All” in the
geodatabase.

88
San Francisco Peaks – Mogollon Rim Linkage Design
APPENDIX F: LITERATURE CITED
Allen, C.D., A.K. Macalady, H. Chenchouni, D. Bachelet, N. McDowell, M. Vennetier, T.
Kitzberger, A. Rigling, D. D. Breshears, E.H. Hogg, P. Gonzalez, R. Fensham, Z.
Zhangm, J. Castro, N. Demidova, J.-H. Lim, G. Allard, S. W. Running, A. Semerci, and
N. Cobb. 2010. A global overview of drought and heat-induced tree mortality reveals
emerging climate change risks for forests. Forest Ecology and Management 259:660-
684.
American Sportfishing Association. 2007. State and national economic effects of fishing,
hunting, and wildlife-related recreation on U.S. Forest Service managed lands. Report
prepared for the U.S. Forest Service, Division of Wildlife, Fish and Rare Plants.
Anderson, E. M., and M. J. Lovallo. 2003. Bobcat and lynx (Lynx rufus and Lynx canadensis).
Pp. 758–786 in Wild mammals of North America: biology, management, and
conservation (G. A. Feldhamer, B. C. Thompson, and J. A. Chapman, eds.). 2nd ed.
Johns Hopkins University Press, Baltimore, Maryland.
Anderson, A.E., and O.C. Wallmo. 1984. Mammalian Species 219: 1-9. Mule deer.
Apps, C.D., N.J. Newhouse, and T.A. Kinley. 2002. Habitat associations of American badgers in
southeastern British Columbia. Canadian Journal of Zoology 80: 1228-1239.
Arizona Game and Fish Department. 2002a. Rana pipiens. Unpublished abstract compiled and
edited by the Heritage Data Management System, Arizona Game and Fish Department,
Phoenix, AZ. 6 pp.
Arizona Game and Fish Department. 2002b. Antilocapra americana mexicana. Unpublished
abstract compiled and edited by the Heritage Data Management System, Arizona Game
and Fish Department, Phoenix, AZ. 6 pp.
Arizona Game and Fish Department. 2002c. Antilocapra americana sonoriensis. Unpublished
abstract compiled and edited by the Heritage Data Management System, Arizona Game
and Fish Department, Phoenix, AZ. 6 pp.
Arizona Game and Fish Department. 2006a. Arizona’s comprehensive wildlife conservation
strategy 2005-2015. Arizona Game and Fish Department, Phoenix, Arizona. 32 pp.
Arizona Game and Fish Department. 2006b. Guidelines for culvert construction to accommodate
fish & wildlife movement and passage. Arizona Game and Fish Department, Phoenix,
Arizona. 12 pp. Available at:
http://www.azgfd.gov/hgis/pdfs/CulvertGuidelinesforWildlifeCrossings.pdf.
Arizona Game and Fish Department. 2008. Guidelines for bridge construction or maintenance
to accommodate fish & wildlife movement and passage. Arizona Game and Fish
Department, Phoenix, Arizona. 11 pp. Available at:
http://www.azgfd.gov/hgis/pdfs/BridgeGuidelines.pdf.
Arizona Game and Fish Department. 2009a. Wildlife friendly guidelines: Community and
project planning. Arizona Game and Fish Department, Phoenix, Arizona. 43 pp.
Available at: http://www.azgfd.gov/pdfs/w_c/WildlifeFriendlyDevelopment.pdf.
Arizona Game and Fish Department. 2009b. http://www.gf.state.az.us/h_f/game_elk.shtml.
Arizona Game and Fish Department. 2010. Elk movements associated with a high-traffic
highway Interstate 17, Arizona. Quarterly report prepared by Arizona Game and Fish
Department Research Branch, July 12, 2010, Phoenix, Arizona.
89
San Francisco Peaks – Mogollon Rim Linkage Design
Arizona Game and Fish Department. 2011a. Elk movements associated with Interstate-40,
Williams to Twin Arrows, Arizona. Progress report prepared by Arizona Game and Fish
Department Research Branch, Phoenix, Arizona.
Arizona Game and Fish Department. 2011b. The Coconino County Wildlife Connectivity
Assessment: Report on Stakeholder Input. Arizona Game and Fish Department, Phoenix,
Arizona. 52 pp. Available at: http://www.azgfd.gov/w_c/conn_Coconino.shtml.
Arizona Game and Fish Department. 2011c. Wildlife compatible fencing. Arizona Game and
Fish Department, Phoenix, Arizona. 34 pp. Available at:
http://www.azgfd.gov/hgis/documents/110125_AGFD_fencing_guidelines.pdf.
Arizona Game and Fish Department. 2012a. Evaluation of a wildlife fencing retrofit along
Interstate-17; Munds Park to Woods Canyon. Quarterly progress report presented by
Arizona Game and Fish Department Wildlife Contracts Branch to Arizona Department of
Transportation Research Center, March 30, 2012.
Arizona Game and Fish Department. 2012b. Arizona’s state wildlife action plan: 2012-2022.
Arizona Game and Fish Department, Phoenix, Arizona.
Arizona Wildlife Linkages Workgroup. 2006. Arizona’s Wildlife Linkages Assessment.
Available at: http://www.azdot.gov/Highways/OES/AZ_Wildlife_Linkages/index.asp.
Barnum, S.A. 2003. Identifying the best locations along highways to provide safe crossing
opportunities for wildlife: a handbook for highway planners and designers. Colorado
Department of Transportation.
Beier, P. 1995. Dispersal of juvenile cougars in fragmented habitat. Journal of Wildlife
Management 59:228–237.
Beier, P. 2006. Effects of artificial night lighting on terrestrial mammals. In C. Rich and T.
Longcore (eds)., Ecological consequences of artificial night lighting, pp. 19–42.
Washington, D.C.: Island Press.
Beier, P., E. Garding, and D. Majka. 2008. Arizona Missing Linkages: Gila Bend – Sierra
Estrella Linkage Design. Report to Arizona Game and Fish Department. School of
Forestry, Northern Arizona University, Flagstaff, AZ.
Beier, P., and S. Loe. 1992. A checklist for evaluating impacts to wildlife corridors. Wildlife
Society Bulletin 20: 434-40.
Beier, P., D. Majka, and T. Bayless. 2006. Arizona Missing Linkages: Santa Rita – Tumacacori
Linkage Design. Report to Arizona Game and Fish Department. School of Forestry,
Northern Arizona University, Flagstaff, AZ.
Beier, P., D. Majka, and E. Garding. 2007. Arizona Missing Linkages: Munds Mountain – Black
Hills Linkage Design. Report to Arizona Game and Fish Department. School of Forestry,
Northern Arizona University, Flagstaff, AZ.
Beier, P., D. Majka, and J. Jenness. 2007. Conceptual steps for designing wildlife corridors.
Available at: http://corridordesign.org/dl/docs/ConceptualStepsForDesigningCorridors.pdf
Beier, P. & R.F. Noss. 1998. Do habitat corridors provide connectivity? Conservation Biology
12:1241-1252.
Belitsky, D.W. 1991. Evaluation of potential black-footed ferret reintroduction site in the Aubrey
Valley, Coconino County, Arizona. Special Report. Arizona Game and Fish Department,
Phoenix, Arizona. 16 pp.
Bennett, A.F. 1999. Linkages in the landscape: The role of corridors and connectivity in wildlife
conservation. IUCN, Gland.

90
San Francisco Peaks – Mogollon Rim Linkage Design
Blair, R.B. 1996. Land use and avian species diversity along an urban gradient. Ecological
Applications 6:506-519.
Blair, R.B. 1999. Birds and butterflies along an urban gradient: surrogate taxa for assessing
biodiversity? Ecological Applications 9:164-170.
Blair, R.B., and A.E. Launer. 1997. Butterfly diversity and human land use: species assemblages
along an urban gradient. Biological Conservation 80:113-125.
Blomquist, S.M. and M.J. Sredl. 2002. Inventory, assessment, and management of the northern
leopard frog (Rana pipiens) on Kaibab National Forest, North Kaibab Ranger District.
Nongame and Endangered Wildlife Program Technical Report 190. Arizona Game and
Fish Department, Phoenix, Arizona.
Boyce, M.S. 1991. Migratory behavior and management of elk (Cervus elaphus). Applied
Animal Behaviour Science 29: 239-250.
Brennan, T.C. and A.T. Holycross. 2006. A field guide to amphibians and reptiles in Arizona.
Arizona Game and Fish Department, Phoenix, AZ.
Bright, J.L., and C. Van Riper III. 2000. Habitat selection by pronghorn antelope at Wupatki
National Monument. Arizona. Proceedings of Pronghorn Workshop 17: 77-85.
Britt, T.L. and D.P. Theobald, eds. 1982. Provincial, reservation and state status reports.
Proceedings of the Western States Elk Workshop. Western Association of Fish and Wildlife
Agencies. Phoenix, AZ. 166 pp.
Brudin III, C.O. 2003. Wildlife use of existing culverts and bridges in north central
Pennsylvania. ICOET 2003.
Bunnell, F.L., and D.E.N. Tait. 1981. Population dynamics of bears-implications. Pages 75 - 98
in C. W. Fowler and T. D Smith, Eds. Dynamics of Large Mammal Populations. John
Wiley and Sons, New York, New York. USA.
Cain, A.T., V.R. Tuovila, D.G. Hewitt, and M.E. Tewes. 2003. Effects of a highway and
mitigation projects on bobcats in Southern Texas. Biological Conservation 114: 189-197.
Carr, L.W. and L. Fahrig. 2001. Effect of road traffic on two amphibian species of differing
vagility. Conservation Biology. 15(4): 1071-1078.
City of Flagstaff. 2013. Draft Flagstaff Regional Plan 2030: Place matters. Public hearing draft,
August 2013. Accessed on August 12, 2013 at:
http://www.flagstaffmatters.com/_pdfs/chapters/Flagstaff-Regional-Plan.pdf.
Clark, T.W. 1986. Some guidelines for management of the black-footed ferret. Great Basin
Naturalist Memoirs, 8:160-168.
Clevenger, A.P., B. Chruszcz, and K. Gunson. 2001. Drainage culverts as habitat linkages and
factors affecting passage by mammals. Journal of Applied Ecology 38: 1340-1349.
Clevenger, A.P., B. Chruszcz, and K.E. Gunson. 2003. Spatial patterns and factors influencing
small vertebrate fauna road-kill aggregations. Biological Conservation 109: 15-26.
Clevenger et al. 2005
Clevenger, A.P., and N. Waltho. 2000. Factors influencing the effectiveness of wildlife
underpasses in Banff National Park, Alberta, Canada. Conservation Biology 14: 47-56.
Clevenger, A.P., and N. Waltho. 2005. Performance indices to identify attributes of highway
crossing structures facilitating movement of large mammals. Biological Conservation
121: 453-464.
Clevenger, A.P., and J. Wierzchowski. 2006. Maintaining and restoring connectivity in
landscapes fragmented by roads. In KR Crooks and MA Sanjayan, editors, Connectivity
Conservation. Cambridge University Press.

91
San Francisco Peaks – Mogollon Rim Linkage Design
Clevenger, A.P., J. Wierzchowski, B. Chruszcz, and K. Gunson. 2002. GIS-generated, expert-
based models for identifying wildlife habitat linkages and planning mitigation passages.
Conservation Biology 16:503-514.
Coconino County Comprehensive Planning Partnership (CCCPP). 2003. Coconino County
Comprehensive Plan. Coconino County Community Development Department,
Flagstaff, Arizona. Available at http://www.coconino.az.gov/comdev.aspx?id=142.
Conover, M.R., Pitt, W.C., Kessler, K.K., DuBow, T.J., and Sanborn, W.A. 1995. Review of
human injuries, illnesses, and economic losses caused by wildlife in the United States.
Wildlife Society Bulletin 23(3): 407-414.
Conservation Biology Institute (CBI). 2005. Analysis of General Plan-2020 San Diego County.
Encinitas, Ca. 27pp.
CorridorDesign.Org. 2012. GIS tools and information for designing wildlife corridors.
http://corridordesign.org/.
Courchamp, F. and G. Sugihara. 1999. Modeling the biological control of an alien predator to
protect island species from extinction. Ecological Applications 9(1): 112-123.
Crocker-Bedford, D.C. 1976. Food interaction between Utah prairie dogs and cattle. M.S. Thesis.
Utah State University, Logan, Utah.
Crooks, K., and M. Soule 1999. Mesopredator release and avifaunal extinctions in a fragmented
system. Nature 400: 563-566.
Crother, B.I., J. Boundy, F.T. Burbrink, and J.A. Campbell. 2008. Squamata - Snakes in
Standard English and Scientific Names Committee (Eds.) Scientific and standard English
names of amphibians and reptiles of North America North of Mexico, with comments
regarding confidence in our understanding, sixth edition. Society for the Study of
Amphibians and Reptiles: Shoreview, MN, USA. Cunningham, S.C., and W. Ballard. 2004. Effects of wildfire on black bear demographics in
central Arizona. Wildlife Society Bulletin 32: 928-937.
Dodd, N.L. 2003. Landscape-scale habitat relationships to tassel-eared squirrel population
dynamics in north-central Arizona. Arizona Game and Fish Department Technical
Guidance Bulletin No. 6, Phoenix, Arizona, 28pp.
Dodd, C.K, W.J. Barichivich, and L.L. Smith. 2004. Effectiveness of a barrier wall and culverts
in reducing wildlife mortality on a heavily traveled highway in Florida. Biological
Conservation 118: 619-631.
Dodd, N.L., J.W. Gagnon, S. Sprague, S. Boe, and R.E. Schweinsburg. 2010. Wildlife accident
reduction study and monitoring: Arizona State Route 64. Final report No. 626 prepared
by Arizona Game and Fish Department for Arizona Department of Transportation,
August 2010.
Dodd, N.L., J.W. Gagnon, S. Sprague, S. Boe, and R.E. Schweinsburg. 2011. Assessment of
pronghorn movements and strategies to promote highway permeability: U.S. Highway
89. Report No. FHWA-AZ-10-619 prepared by Arizona Game and Fish Department for
Arizona Department of Transportation.
Dodd, N.L., S.S. Rosenstock, C.R. Miller, and R.E. Schweinsburg. 1998. Tassel-eared squirrel
population dynamics in Arizona: index techniques and relationships to habitat condition.
Arizona Game and Fish Department Technical Report 27, Phoenix, Arizona, 49pp.
Dole, J.W. 1971. Dispersal of recently metamorphosed leopard frogs, Rana pipiens. Copeia
1971:221-8.

92
San Francisco Peaks – Mogollon Rim Linkage Design
Donnelly, R., and J.M. Marzluff. 2004. Importance of reserve size and landscape context to
urban bird conservation. Conservation Biology 18:733-745.
Eggers, B., Matern, A., Drees, C., Eggers, J., Hardtle, W., & Assman, T. 2009. Value of semi-
open corridors for simultaneously connecting open and wooded habitats: A case study with
ground beetles. Conservation Biology 24:256-266.
Evink, G.L. 2002. Interaction between roadways and wildlife ecology. National Academy Press,
Washington, D.C.
Farentinos, R.C. 1972. Social dominance and mating activity in the tassel-eared squirrel (Sciurus
aberti ferreus). Animal Behavior 20: 316-326.
Farentinos, R.C. 1979. Changes in home range size of tassel-eared squirrels (Sciurus aberti). The
Southwestern Naturalist 24(1): 49-61.
Federal Register. 2009. Volume 74, Number 125. Endangered and Threatened Wildlife and
Plants; 90-Day Finding on a Petition to List the Northern Leopard Frog (Lithobates
[=Rana] pipiens) in the Western United States as Threatened. Page 31389-31401.
Findlay, C.S., and J. Houlahan. 1997. Anthropogenic correlates of species richness in
southeastern Ontario wetlands. Conservation Biology 11(4): 1000-1009.
Findley, J.S., A.H. Harris, D.E. Wilson, and C. Jones. 1975. Mammals of New Mexico.
University of New Mexico Press, Albuquerque, New Mexico. xxii + 360 pp.
Fitzgerald, J.P. and R.R. Lechleitner. 1974. Observations on biology of Gunnison’s prairie dog in
central Colorado. American Midland Naturalist 92:146-163.
Forman, R. T. T., D. Sperling, J. A. Bissonette, A. P. Clevenger, C. D. Cutshall, V. H. Dale, L.
Fahrig, R. France, C. R. Goldman, K. Heanue, J. A. Jones, F. J. Swanson, T. Turrentine,
and T. C. Winter. 2003. Road Ecology: Science and Solutions. Island Press, Washington,
D. C. 481 pp.
Friesen, L.E., P.F.J. Eagles, and R.J. Mackay. 1995. Effects of residential development on forest-
dwelling neotropical migrant songbirds. Conservation Biology 9:1408-1414.
Fuller, T.K., Berendzen, S.L., Decker, D.A., & Cardoza, J.E. 1995. Survival and cause- specific
mortality rates of adult bobcats (Lynx rufus). American Midland Naturalist 134:404-408.
Gagnon, J.W., N.L. Dodd, S.C. Sprague, K. Ogren, and R. Schweinsburg. 2010. Preacher
Canyon wildlife fence and crosswalk enhancement project evaluation: State Route 260.
Final Report - Project JPA 04-088, prepared by Arizona Game and Fish Department for
Arizona Department of Transportation.
Gagnon, J. W., S. Sprague, N. L. Dodd, C. Loberger, R. E. Nelson III, S. Boe, and R. E.
Schweinsburg. 2012. Research report on elk movements associated with Interstate 40
(Williams to Winona). Prepared for Arizona Department of Transportation Design
concept study and environmental assessment, I-40 Bellemont to Winona. Project No. NH
040-C(211)S, 40 CN 183 H7586 01L. Arizona Game and Fish Department, Phoenix, AZ.
Gagnon, J.W., T. Theimer, N. L. Dodd, and R. E. Schweinsburg. 2007. Traffic volume alters elk
distribution and highway crossings in Arizona. Journal of Wildlife Management 71:2318-
2323. Gallie, J.A. 2001. Ecological interactions and habitat use by Gunnison’s prairie dogs and Botta’s
pocket gophers. MS Thesis, Northern Arizona University, Flagstaff, Arizona.
Germaine, S.S., S.S. Rosenstock, R.E. Schweinsburg, and W.S. Richardson. 1998. Relationships
among breeding birds, habitat, and residential development in greater Tucson, Arizona.
Ecological Applications 8:680-691.
Germaine, S.S., and B.F. Wakeling. 2001. Lizard species distributions and habitat occupation
along an urban gradient in Tucson, Arizona, USA. Biological Conservation 97:229-237.

93
San Francisco Peaks – Mogollon Rim Linkage Design
Geist, V. 2002. Adaptive behavioral strategies. In Toweill, D. E. & Thomas, J. W. eds. North
American elk ecology and management. Smithsonian Press, Wash D.C. pp 389-433.
Gilbert-Norton, L., Wilson, R., Stevens, J.R., Beard, K.H. 2010. A meta-analytical review of
corridor effectiveness. Conservation Biology 24:660-668.
Glick, P., A. Staudt, and B. Stein. 2009. A new era for conservation: Review of climate change
adaptation literature. National Wildlife Federation, Reston, VA.
Goodrich, J.M., and S.W. Buskirk. 1998. Spacing and ecology of North American badgers
(Taxidea taxus) in a prairie-dog (Cynomys leucurus) complex. Journal of Mammalogy
78: 171-179.
Haddad, N.M., Browne, D.R., Cunningham, A., Danielson, B.J., Levy, D.J., Sargent, S., and
Spira, T. 2003. Corridor use by diverse taxa. Ecology 84:609-615.
Halloran, M.E. and M. Bekoff. 1994. Nesting behavior of Abert squirrels (Sciurus aberti).
Ethology 97: 236-248.
Hannah, L., Midgley, G. F., Lovejoy, T., Bond, W. J., Bush, M., Lovett, J. C., Scott, D., and
Woodward, F. I. 2002. Conservation of biodiversity in a changing climate. Conservation
Biology 16:264-268.
Harding, J. 1997. Amphibians and Reptiles of the Great Lakes Region. Ann Arbor, Michigan:
The University of Michigan Press.
Harrison, R. L. 1998. Bobcats in residential areas: distribution and homeowner attitudes.
Southwestern Naturalist 43:469–475.
Hastings, B., R.L. Knight, and W.C. Gilgert. 2006. Conservation value of clustered housing
developments. City of Boulder Open Space and Mountain Parks Independent Research
Report No. 5024, Boulder, CO.
Henle, K., Lindenmayer, D. B., Margules, C. R., Saunders, D. A. and Wissel, C. 2004. Species
survival in fragmented landscapes: Where are we now? Biodiversity and Conservation
13: 1–8.
Hervert, J.J., J.L. Bright, R.S. Henry, L.A. Piest, and M.T. Brown. 2005. Home-range and
habitat-use patterns of Sonoran pronghorn in Arizona. Wildlife Society Bulletin 33: 8-15.
Hoffmeister, D.F. 1986. Mammals of Arizona. The University of Arizona Press, Arizona.
Hoogland, J. L. 1999. Philopatry, dispersal, and social organization of Gunnison’s prairie dogs.
Journal of Mammalogy 80(1): 243-251.
Hutton, K. A., J.L. Koprowski, V.L. Greer, M.I. Alanen, C.A. Schauffert, and P.J. Young. 2003.
Use of mixed-conifer and spruce-fir forests by an introduced population of Abert’s
squirrels (Sciurus aberti). The Southwestern Naturalist 48(2):257-260.
Intergovernmental Panel on Climate Change (IPCC). 2007. Climate change 2007: Synthesis
report. Summary for policymakers. IPCC Secretariat, Geneva, Switzerland.
Ironside, K.E., N.S. Cobb, K.L. Cole, M. Peters, J. Eischeid, G. Garfin. 2010. Plausible future
effects of climate change on ponderosa pine. Presentation to The Nature Conservancy,
New Mexico, accessed at:
http://nmconservation.org/dl/5_Ironside_ClimateChange_PIPO.pdf.
Kamler, J.F. and P.S. Gipson. 2000. Home range, habitat selection, and survival of Bobcats, Lynx
rufus, in a Prairie Ecosystem in Kansas. Canadian Field-Naturalist 114 (3): 388-94.
Keith, J.O. 2003. Abert squirrel (Sciurus aberti): A technical conservation assessment. USDA
Forest Service, Rocky Mountain Region. Acccessed at:
www.fs.fed.us/r2/projects/scp/assessments/abertsquirrel.pdf.

94
San Francisco Peaks – Mogollon Rim Linkage Design
Knickerbocker, T.J. and J. Waithaka. 2005. People and elephants in the Shimba Hills, Kenya.
Pp. 224-238 in R. Woodroffe, S. Thirgood and A. Rabinowitz (eds.), People and
Wildlife: Conflict or Co-existence? Cambridge University Press, Cambridge, UK.
Lambeck, R.J. 1997. Focal species: a multi-species umbrella for nature conservation.
Conservation Biology 11; 859. Larivière, S. 2001. Ursus americanus. Mammalian Species 647: 1-11.
Laurance, W.F. 1991. Ecological correlates of extinction proneness in Australian tropical rain forest
mammals. Conservation Biology 5:79-89.
LeCount, A.L. 1982. Characteristics of a central Arizona black bear population. Journal of
Wildlife Management 46:861-868.
LeCount A.L., R.H. Smith, and J.R. Wegge. 1984. Black Bear habitat requirements in central
Arizona. Federal Aid Final Report. Arizona Game and Fish Department. Phoenix. USA.
Lema, M.F. 2001. Dynamics of Abert’s squirrel populations: home range, seasonal movements,
survivorship, habitat use, and sociality. MS Thesis, Northern Arizona University,
Flagstaff, Arizona.
Levey, D., B.M. Bolker, J.T. Tewksbury, S. Sargent, and N. Haddad. 2005. Effects of Landscape
Corridors on Seed Dispersal by Birds. Science 309: 146-148.
Liddle, M. 1997. Recreation ecology: The ecological impact of outdoor recreation and
ecotourism. 639 pp. Chapman and Hall: New York.
Little, S.J. 2003. The influence of predator-prey relationships on wildlife passage evaluation.
ICOET 2003.
Loberger, C. D., T. C. Theimer, S. S. Rosenstock, and C. S. Wightman. 2011. Use of
restoration-treated ponderosa pine forest by tassel-eared squirrels. Journal of
Mammalogy. 92(5):1021-1027.
Long, C.A. 1973. Taxidea taxus. Mammalian Species 26: 1-4.
Long, C.A., and C.A. Killingley. 1983. The badgers of the world. Charles C. Thomas Publishing,
Springfield, IL.
Lyon, L.J. 1979, Habitat effectiveness for elk as influenced by roads and cover. Journal of
Forestry October 1979: 658-660
Lyon, L.J. and A.G. Christianson. 2002. Elk and land management, in Toweill, D. E. & Thomas,
J. W. eds. North American elk ecology and management. Smithsonian Press, Wash D.C.
pp 557-581.
Malo, J.E., F. Suarez, and A. Diez. 2004. Can we mitigate animal-vehicle accidents using
predictive models. Journal of Applied Ecology 41: 701-710.
Marlon, J.R., P.J. Bartlein, D.G. Gavin, C.J. Long, R.S. Anderson, C.E. Briles, K.J. Brown, D.
Colombaroli, D.J. Hallett, M.J. Power, E.A. Scharf, and M.K. Walsh. 2012. Long-term
perspective on wildfires in the western USA. Proceedings of the National Academy of
Sciences 109(9): E535-E543.
Marshall, W. H., G. W. Gullion, and S. Schwab. 1962. Early summer activities of porcupines as
determined by radio- positioning techniques. Journal of Wildlife Management 26:75-79.
Mata, C., I. Hervas, J. Herranz, F. Suarez, and J.E. Malo. 2005. Complementary use by
vertebrates of crossing structures along a fences Spanish motorway. Biological
Conservation 124: 397-405.
May, S.A. and T.W. Norton. 1996. Influence of fragmentation and disturbance on the
potential impact of feral predators on native fauna in Australian forest
ecosystems. Wildlife Research 23(4): 387-400.
95
San Francisco Peaks – Mogollon Rim Linkage Design
Mazerolle, M.J. and A. Desrochers. 2005. Landscape resistance to frog movement. Canadian
Journal of Zoology. 83: 455-464.
McDonald, W., and C.C. St Clair. 2004. Elements that promote highway crossing structure use
by small mammals in Banff National Park. Journal of Applied Ecology 41: 82-93.
Mearns, L.O. 2010. Future regional climate change in Arizona: Concepts and scenarios.
Presentation to TNC Workshop, Four Forests Restoration Initiative Region, Flagstaff, AZ
April 7, 2010.
Merenlender, A. M., K.L. Heise, and C. Brooks. 1998. Effects of sub-dividing private property
on biodiversity in California’s north coast oak woodlands. Transactions of the Wildlife
Society 34:9-20.
Merenlender, A.M., S.E. Reed, and K.L. Heise. 2009. Exurban development influences
woodland bird composition. Landscape and Urban Planning 92:255-263.
Merrell, D.J. 1970. Migration and gene dispersal in Rana pipiens. American Zoologist 10:47-52.
Merrell, D.J. 1977. Life history of the leopard frog, Rana pipiens, in Minnesota. Bell Museum of
Natural History, University of Minnesota Occasional Papers No. 15.
Messick, J.P., and M.G. Hornocker. 1981. Ecology of the badger in southwestern Idaho. Wildlife
Monographs 76.
Millennium Ecosystem Assessment. 2005. Ecosystems and human well-being: Current status and
trends working group. Island Press, Washington, D.C.
Morgantini, L.E., and R.J. Hudson. 1979. Human disturbance and habitat selection in elk. In
Boyce, M.S. and L.D. Hayden-Wing, eds., North American Elk: Ecology, Behavior and
Management. University of Wyoming. pp 132-139.
Moritz, M.A., M.-A. Parisien, E. Batllori, M.A. Krawchuk, J. Van Dorn, D.J. Ganz, and
K.Hhayhoe. 2012. Climate change and disruptions to global fire activity. Ecosphere
3(6):1-22.
NatureServe. 2005. Arlington, Virginia. Available at : http://www.natureserve.org/explorer.
New Mexico Department of Game & Fish. 2004. Biota Information System of New Mexico.
New Mexico Department of Game & Fish electronic database, BISON, Version 1/2004,
Santa Fe, New Mexico. Available at:
http://nmnhp.unm.edu/bisonm/bisonquery.php.
Ng, S.J., J.W. Dole, R.M. Sauvajot, S.P.D. Riley, and T.J. Valone. 2004. Use of highway
undercrossings by wildlife in southern California. Biological Conservation 115: 499-507.
Nickerson, M.A. and C.E. Mays. 1969. A preliminary herpetofaunal analysis of the Graham
(Pinaleño) Mountain Region, Graham Co., Arizona with ecological comments.
Transactions of the Kansas Academy of Science 72(4): 492-505.
Noss, R.F. 1983. A regional landscape approach to maintain diversity. BioScience 33:700-706.
Noss, R.F. 1987. Corridors in real landscapes: A reply to Simberloff and Cox. Conservation
Biology 1: 159-164.
Noss, R.F. and Daly, K.M. 2006. Incorporating connectivity into broad-scale conservation
planning. Pp. 587-619 in K.R. Crooks and M.A.Sanjayan, eds. Connectivity conservation.
Cambridge University Press, Cambridge, U.K.
Noss, R.F. and Harris, L.D. 1986. Nodes, networks, and MUMs: Preserving diversity at all
scales. Environmental Management 10:299-309.
Noss, R.F., Quigley, H.B., Hornocker, M.G., Merrill, T., and Paquet, P.C. 1996. Conservation
biology and carnivore conservation in the Rocky Mountains. Conservation Biology
10:949-963.

96
San Francisco Peaks – Mogollon Rim Linkage Design
Nowak, E.M. 2005. Ecology of the Arizona black rattlesnake (Crotalus [viridis] cerberus) at
Tonto National Monument, Arizona. Final Report to Desert Southwest Cooperative
Ecosystem Studies Unit.
Nowak, E. M. 2009. Ecology and management of venomous reptilian predators. Unpublished
Ph.D. dissertation, Northern Arizona University, Flagstaff, Arizona.
Nowak, E.M. and T. Arundel. 2009. Co-occurrence of syntopic venomous reptiles at Tonto
National Monument, Arizona, U.S.A. Technical Report prepared for the National Park
Service. U.S. Geological Survey, Southwest Biological Science Center, Flagstaff, AZ.
Nowak, E.M., and J. X. Schofer. 2005. Initial surveys to locate Arizona Black Rattlesnakes
(Crotalus organus cerberus) in Arizona National Parks and Monuments. USGS
Southwest Biological Science Center, Colorado Plateau Research Station report to
Western National Parks Association. [Technical Report].
Ockenfels, R.A., A.A. Alexander, C.L. Dorothy Ticer, and W.K. Carrel. 1994. Home ranges,
movement patterns and habitat selection of pronghorn in central Arizona. Arizona Game
and Fish Technical Report 13. Phoenix, AZ.
Ockenfels, R. A., W. K. Carrel, and C. van Riper III. 1997. Home ranges and movements of
pronghorn in northern Arizona. Biennial Conference of Research on Colorado Plateau 3:
45-61.
Ockenfels, R.A., C.L. Dorothy, and J.D. Kirkland. 1992. Mortality and home range of pronghorn
fawns in central Arizona. Proceedings of the Pronghorn Antelope Workshop 15: 78-92.
Ockenfels, R.A., L.W. Luedeker, L.M. Monroe, and S.R. Roe. 2002. A Pronghorn
Metapopulation in northern Arizona. Proceedings of the 20th Biennial Pronghorn
Workshop 20:42-59.
Odell, E.A., and R.L. Knight. 2001. Songbird and medium-sized mammal communities
associated with exurban development in Pitkin County, Colorado. Conservation Biology
15:1143-1150.
O’Gara. 1978. Antilocapra americana. Mammalian Species 90: 1-7.
O’Gara, B.W., and R.G. Dundes 2002. Distribution: past and present. In Toweill, D. E. &
Thomas, J. W. eds., North American elk ecology and management. Smithsonian Press,
Wash D.C. pp 67-119.
Overpeck, J. and B. Udall. 2010. Dry times ahead. Science 328:1642-1643.
Patton, D.R., R.L. Wadleigh, and H.G. Hudak. 1985. The effects of timber harvesting on the
Kaibab squirrel. Journal of Wildlife Management 49: 14-19.
Perault, D.R. and Lomolino, M.V. 2000. Corridors and mammal community structure across a
fragmented, old growth forest landscape. Ecological Monographs 70:401-422.
Perry, G. and R.N. Fisher. 2006. Night lights and reptiles: Observed and potential effects. Pp.
169–191 in C. Rich and T. Longcore (eds.), Ecological consequences of artificial night
lighting. Island Press,Washington, D.C.
Pope, S.E., L. Fahrig, and H.G. Merriam. 2000. Landscape complementation and metapopulation
effects on leopard frog populations. Ecology 81(9): 2498-2508.
Prather, J. W., N. L. Dodd, B. G. Dickson, H. M. Hampton, Y. Xu, E. N. Aumack, and T. D.
Sisk. 2006. Landscape models to predict the influence of forest structure on tassel-eared
squirrel populations. Journal of Wildlife Management 70(3): 723-731.
Reading, R.P. and R. Matchett. 1997. Attributes of black-tailed prairie dog colonies in
northcentral Montana. Journal of Wildlife Management 61(3): 1997.

97
San Francisco Peaks – Mogollon Rim Linkage Design
Reed, S. E., H. E. Kretser, M. J. Glennon, L. Pejchar and A. M. Merenlender. 2012. Faunal
biodiversity at the urban-rural interface: Current knowledge, research priorities, and
planning strategies. In B. G. Lockaby, W. Zipperer and D. N. Laband, (eds.). Urban-
Rural Interfaces: Linking People and Nature.
Rich, C. and T. Longcore, eds. 2006. Ecological Consequences of Artificial Night Lighting.
Island Press, Washington D.C.
Riley, S. P. D. 2006. Spatial ecology of bobcats and gray foxes in urban and rural zones of a
national park. Journal of Wildlife Management 70(5):1425-1435.
Riley, S.P.D., C. Bromley, R.H. Poppenga, L. Whited, R.M. Sauvajot. 2007. Anticoagulant
exposure and notoedric mange in bobcats and mountain lions in urban Southern
California. Journal of Wildlife Management 71(6): 1874-1884.
Riley, S. P. D., R. M. Sauvajot, D. Kamradt, E. C. York, C. Bromley, T. K. Fuller, and R. K.
Wayne. 2003. Effects of urbanization and fragmentation on bobcats and coyotes in urban
southern California Conservation Biology 17: 566-576.
Rorabaugh, J.C. 2005. Rana pipiens Schreber, 1782. Northern leopard frog. Pages 570-577 in
M.J. Lannoo (Ed.), Amphibian declines: the conservation status of United States species.
University of California Press, Berkeley, CA.
Rosen, P.C., and C. H. Lowe. 1994. Highway mortality of snakes in the Sonoran Desert of
southern Arizona. Biological Conservation 68: 143-148.
Rottenborn, S.C. 1999. Predicting impacts of urbanization on riparian bird communities.
Biological Conservation 88:289-299.
Rowland, M.M., M.J. Wisdom, B.K. Johnson, and M.A. Penninger. 2004. Effects of roads on
elk: implications for management in forested ecosystems. Transactions of the North
American Wildlife and Natural Resource Conference 69.
Roze, U. 1989. The North American porcupine. Smithsonian Institution Press, Washington, D.C.
Ruediger, B. 2001. High, wide, and handsome: designing more effective wildlife and fish
crossings for roads and highways. ICOET 2001.
Scarbrough, D.L., and P.R. Krausman. 1988. Sexual selection by desert mule deer. Southwestern
Naturalist 33: 157-165.
Schofer, Justin X. 2007. Habitat use, thermal biology, and natural history of the Arizona black
rattlesnake, Crotalus cerberus. MS Thesis, Northern Arizona University, Flagstaff,
Arizona.
Schwartz, C.C. and A.W. Franzmann. 1992. Dispersal and survival of subadult black bears from
the Kenai Peninsula, Alaska. Journal of Wildlife Management 56: 426-431.
Seager, R.S., M. Ting, I. Held, Y. Kushnir, J. Lu, G. Vecchi, H.-P. Huang, N. Harnik, A.
Leetmaa, N.-C. Lau, C. Li, J. Velez, N. Naik. 2007. Model projections of an imminent
transition to a more arid climate in southwestern North America. Science 316: 1181-
1184.
Seburn, C.N.L., D.C. Seburn, and C.A. Paszkowski. 1997. Northern leopard frog (Rana pipiens)
dispersal in relation to habitat. In Amphibians in decline: Canadian studies of a global
problem. D.M. Green (editor). Society for the Study of Amphibians and Reptiles, St.
Louis, Mo., pp. 64–72.
Seglund, Amy E., A.E. Ernst, and D.M. O’Neill. 2005. Gunnison’s prairie dog conservation
assessment. Western Association of Fish and Wildlife Agencies. Laramie, Wyoming.
Unpublished Report. 87pp.

98
San Francisco Peaks – Mogollon Rim Linkage Design
Severson, K.E. and A.L. Medina. 1983. Deer and elk habitat management in the Southwest.
Journal of Range Management Monograph No. 2, 64 pp.
Shalaway, S. and C. N. Slobodchikoff. 1988. Seasonal change in the diet of prairie dogs. Journal
of Mammalogy 69: 835-841.
Silberman, J. 2003. The Economic Importance of Fishing and Hunting. Economic data on fishing
and hunting for the State of Arizona and for each Arizona County. Arizona State
University School of Management, Tempe, Arizona.
Smith, B.E. and D. Keinath. 2004. Species assessment for the northern leopard frog (Rana
pipiens) in Wyoming. Prepared for United States Department of the Interior, Bureau of
Land Management, Wyoming State Office, Cheyenne, Wyoming. 104 pp.
Smith, B.E. and D.A. Keinath. 2007. Northern Leopard Frog (Rana pipiens): A technical
conservation assessment. [Online]. USDA Forest Service, Rocky Mountain Region.
Available: http://www.fs.fed.us/r2/projects/scp/assessments/northernleopardfrog.pdf
[11.12.2009].
Smith G.W. 1979. Movements and home range of the porcupine in northeastern Oregon.
Northwest Science 53:277-282.
Southwick Associates. 2003. Economic analysis of nonconsumptive wildlife recreation in
Arizona. Report prepared for the Arizona Game and Fish Department in conjunction
with the Responsive Management project, “Arizona residents’ attitudes toward nongame
wildlife.” Arizona Game and Fish Department, Phoenix, Arizona.
States, J.S., W.S. Gaud, W.S. Allred, and W.J. Austin. 1988. Foraging patterns of tassel-eared
squirrels in selected ponderosa pine stands. In: Symposium proceedings, Management of
amphibians, reptiles, and small mammals in North America. USDA, Forest Service.
General Technical Report. RM-166. Fort Collins, CO: 425-431.
Stebbins, R.C. 2003. A field guide to western reptiles and amphibians. Third edition. Houghton
Mifflin Company, Boston, MA.
Strahlberg, D., and B. Williams. 2002. Effects of residential development and landscape
composition on the breeding birds of Placer County’s foothill oak woodlands. USDA
Forest Service Gen. Tech. Rep. PSW-GTR-184.Sweitzer, R.A. and J. Berger. 1998.
Evidence for female-biased dispersal in North American porcupines (Erethizon
dorsatum). Journal of Zoology 244: 159-166.
Sullivan T.L., and T.A. Messmer. 2003. Perceptions of deer-vehicle collision management by
state wildlife agency and department of transportation administrators. Wildlife Society
Bulletin 31:163-173.
Swank, W.G. 1958. The mule deer in Arizona chaparral and an analysis of other important deer
herds: a research and management study. Arizona Game and Fish Department, Federal
Aid Project Arizona W-71-R, Wildlife Bulletin 3, Phoenix, Ariz. 109pp.
Sweitzer, R.A. and J. Berger. 1998. Evidence for female-biased dispersal in North American
porcupines (Erethizon dorsatum). Journal of Zoology 244: 159-166.
The Wildlife Society (TWS). 2004. Global climate change and wildlife in North America.
Technical Review 04-2. The Wildlife Society, Bethesda, MD.
Theimer, T., S. Sprague, E. Eddy, and R. Benford. 2012. Genetic variation of pronghorn across
US Route 89 and State Route 64. Report No. FHWA-AZ-12-659 prepared for Arizona
Department of Transportation.
Thomas, J.W., D.A. Leckenby, M. Henjum, R.J. Pedersen, L.D. Bryant. 1988. Habitat-
effectiveness index for elk on Blue Mountain Winter Ranges. General Technical Report

99
San Francisco Peaks – Mogollon Rim Linkage Design
PNW-GTR-218. Portland, OR: U.S. Department of Agriculture, Forest Service, Pacific
Northwest Research Station. 28 p.
Ticer, C. and R.A. Ockenfels. 2001. A validation of Arizona's landscape-level pronghorn habitat
model. Proceedings of the 19th
Biennial Pronghorn Antelope Workshop, pp. 63-70.
Towry, R.K. 1984. Wildlife habitat requirements. Pages 72-209 in R.L. Hoover and D.L. Wills,
eds. Managing forested lands for wildlife. Colorado Division of Wildlife, Denver, CO.
Underwood, J. 2007. Interagency management plan for Gunnison’s prairie dogs in Arizona.
Nongame and Endangered Wildlife Program. Arizona Game and Fish Department,
Phoenix, Arizona.
U.S. Census Bureau. 2011. 2010 Census Data. Available at:
http://2010.census.gov/2010census/data/.
U.S. Department of Agriculture (USDA), U.S. Forest Service, Kaibab National Forest Travel
Management Webpage. Accessed May 30, 2012 at:
http://www.fs.usda.gov/wps/portal/fsinternet/!ut/p/c4/04_SB8K8xLLM9MSSzPy8xBz9C
P0os3gjAwhwtDDw9_AI8zPyhQoY6BdkOyoCAGixyPg!/?ss=110307&navtype=BRO
WSEBYSUBJECT&cid=fsm91_050257&navid=130110000000000&pnavid=130000000
000000&position=Project.Html&ttype=detail&pname=Kaibab%2520National%2520For
est-%2520Projects.
U.S. Fish and Wildlife Service. 1981. Standards for the development of Suitability Index
Models. Division of Ecological Services. Government Printing Office, Washington D.C.,
USA.
U.S. Fish and Wildlife Service. 2013. Electronic Code of Federal Regulations 50 eCFR 17.11.
Accessed Feb 1, 2013. http://www.ecfr.gov.
U.S. Global Change Research Program (USGCRP). 2009. Global climate change impacts in the
United States. A state of knowledge report. Cambridge University Press, NY.
van der Zee, F.F., J. Wiertz, C.J.F. ter Braak, R.C. van Apeldoorn and J. Vink. 1992. Landscape
change as a possible cause of the badger Meles meles L. decline in the Netherlands.
Biological Conservation 61: 17-22.
Vos, C.C., J. Verboom, P.F.M. Opdam, and C.J.F. Ter Braak. 2001. Toward ecologically scaled
landscape indices. The American Naturalist 183: 24-41.
Wagner, D.M. and L.C. Drickamer. 2003. Distribution, habitat use, and plague in Gunnison’s
prairie dogs in Arizona. Arizona Game and Fish Department, Heritage Grant I20009.
Wagner, D.M. and L.C. Drickamer. 2004. Abiotic habitat correlates of Gunnison’s prairie dog in
Arizona. Journal of Wildlife Management 68(1): 188-197.
Wallmo, O.C. 1981. Mule and black-tailed deer of North America. University of Nebraska Press.
Lincoln and London. 605 pp.
Ward, A.L., N.E. Fornwalt, S.E. Henry, and R.A. Hodorff. 1980. Effects of highway operation
practices and facilities on elk, mule deer, and pronghorn antelope. Rocky Mountain forest
and Range Experiment Station, Ft., Collins, CO Report FHWA-RD-79-143.
Westerling, A.L., H.G. Hidalgo, D.R. Cayan, and T.W. Swetnam. 2006. Warming and earlier
spring increase western U.S. forest fire wildfire activity. Science 313: 940-943.
Wilcox, B.A. and Murphy, D.D. 1985. Conservation strategy: The effects of fragmentation on
extinction. American Naturalist 125: 879-887.
Wildlands Network. 2009. Climate disruption and connectivity: A strategy for nature
protection. Prepared by Barbara Dugelby for Wildlands Network, Titusville, FL.

100
San Francisco Peaks – Mogollon Rim Linkage Design
Wood, D.J.A., J.L. Koprowski, and P.W.W. Lurz. 2007. Tree squirrel introduction: A theoretical
approach with population viability analysis. Journal of Mammalogy 88(5): 1271-1279.
Woodroffe, R. and L.G. Frank. 2005. Lethal control of African lions (Panthera leo): Local and
regional population impacts. Animal Conservation 8(1): 91-98.
Woods, C.A. 1973. Erethizon Dorsatum. Mammalian Species. 29: 1-6.
Woolf, A and Hubert, GF. 1998. Statue and Management of Bobcats in the United States over
Three Decades: 1970 – 1990. Wildlife Society Bulletin vol. 26, n 2, p 287-293.
Wortman-Wunder, E. 2012. Do subdivisions designed for conservation actually help wildlife?
High Country News, May 28, 2012. Accessed online at
http://www.hcn.org/issues/44.9/do-subdivisions-designed-for-conservation-actually-help-
wildlife.
Yanes, M., J.M. Velasco, and F. Suárez. 1995. Permeability of roads and railways to vertebrates:
the importance of culverts. Biological Conservation 71: 217-222.
Yoakum, J.D., B.W. O’Gara, and V.W. Howard. 1996. Pronghorn on western rangelands. Pages
211-216 In P.R. Krausman, ed. Rangeland Wildlife. Society for Range Management,
Denver, Colorado.


