COCOPS Executive Survey on Public Sector Reform in Europe Research Report Gerhard Hammerschmid Anca Oprisor Vid Štimac May 2013 Coordination for Cohesion in the Public Sector of the Future (COCOPS): www.cocops.eu
Transcript
COCOPS Executive Survey on Public Sector Reform in Europe
Research Report
Gerhard Hammerschmid
Anca Oprisor
Vid Štimac
May 2013
Coordination for Cohesion in the Public Sector of the Future (COCOPS): www.cocops.eu
About COCOPS
The COCOPS project (Coordinating for Cohesion in the Public Sector of the Future) seeks to
comparatively and quantitatively assess the impact of New Public Management-style reforms in
European countries, drawing on a team of European public administration scholars from 11
universities in 10 countries. It analyses the impact of reforms in public management and public
services that address citizens’ service needs and social cohesion in Europe. Evaluating the extent and
consequences of NPM’s alleged fragmenting tendencies and the resulting need for coordination is a
key part of assessing these impacts. It is funded under the European Union’s 7th Framework
Programme as a Small or Medium-Scale Focused Research Project (2011-2014).
About the Authors
Prof. Dr. Gerhard Hammerschmid is Associate Dean and Professor of Public & Financial Management
at the Hertie School of Governance, Berlin.
Anca Oprisor and Vid Štimac are Research Associates at the Hertie School of Governance, Berlin.
The research leading to these results has received funding from the European Union’s Seventh
Framework Programme under grant agreement No. 266887 (Project COCOPS), Socio-economic
I.6.2. Survey pre-testing and pilot ............................................................................................... 20
I.6.3. Data collection phase ......................................................................................................... 21
II.Data processing and final sample ................................................................................................ 27
II.1. Data cleaning ............................................................................................................................. 27
II.2. Data harmonization ................................................................................................................... 28
II.3. Data validation .......................................................................................................................... 29
II.4. Final sample ............................................................................................................................... 30
III. Survey results ............................................................................................................................. 33
IV. Dissemination of results ............................................................................................................ 46
V. Bibliography ................................................................................................................................. 47
VI. List of figures and tables ............................................................................................................ 50
VII. Annex ......................................................................................................................................... 51
COCOPS WP3 Survey Research Report – May 2013 Page 5
Designing a questionnaire fitting to the goals of the research project, and at the same time, to the
various research interests and experience of the COCOPS teams and the national administrative
context.
In order to ensure the collection of high quality comparative data/results, with regards to the methodology of
the survey the team also used as reference a set of internationally established guidelines for implementing
cross-national surveys (e.g. the cross cultural survey guidelines developed by the Institute for Social Research,
University of Michigan, but also experiences from other research networks at the EU level such as the COST-
Action network or the EU-CONSENT network). In particular, most of the suggested steps/phases for cross-
cultural surveys from the University of Michigan were followed (see figure 1), while also being adapted to the
specific context and needs of the COCOPS survey.
Figure 1. Main steps in the design and implementation of the COCOPS survey. Adapted from ‘Guidelines for Best Practice in Cross-Cultural Surveys’, Institute for Social Research, University of Michigan
More concretely, the following steps lead up to the current status quo:
Kick off meeting, core survey team: Paris, May 2011
o Meeting of the core survey team (Hertie School of Governance Berlin, CNRS Paris, Cardiff
University, Erasmus University Rotterdam, University of Bergen)
o First agreements on research design, questionnaire and sample principles
Mapping national administrations: July-August 2011
o Based on the same template, all partners provided a first overview of their national
administrations (main levels, structures, numbers) and a proposal for the national sample and
most appropriate access strategy.
COCOPS WP3 Survey Research Report – May 2013 Page 6
COCOPS meeting at the Annual Conference of the European Group for Public Administration:
Bucharest, September 2011
o Discussing questionnaire concept, sample principles, and methodological issues related to the
survey design and implementation
Core survey team meetings – Berlin, October 2011 & Berlin, December 2011
o Collection/discussion of other existing surveys
o Operationalization of interesting variables and items
o Discussion on structure and questions/items to be selected
o Agreement on preliminary questionnaire text
Coordinating preliminary version with other team members, October-December 2011
o Feedback on first draft version with regard to appropriateness for national contexts and other
WPs
o Integrating feedback and updating questionnaire
Pretesting draft version, core survey team: December 2011-January 2012
o A first external test of the survey: 5-10 practitioners and colleagues in each of the core team
countries were asked to give their feedback on the English survey text and to check
understanding and quality of questions
Final feedback round with all partners: January-February 2012
o Feedback on questionnaire and choice of optional questions
o Final adjustments to the questionnaire, based on feedback from the teams
English survey text ready, circulated to teams for translation: 28th
February 2012
Decision on sample and access strategies for each country: February-March 2012
Translation of survey into 9 languages: March-mid April 2012
o Translation of survey text and online fill-in guidelines
o Necessary adjustments following translation check
Setting up 10 country web-pages: March-May 2012
Collecting contact data for invitations, securing official approvals: February-May 2012
Pilot, all partners: April-mid May 2012
o Around 10 practitioners in each country
o Testing both translation and functionality of the webpage
o Adjustments made to the text and webpage based on feedback from respondents
Final checks with teams: May 2012
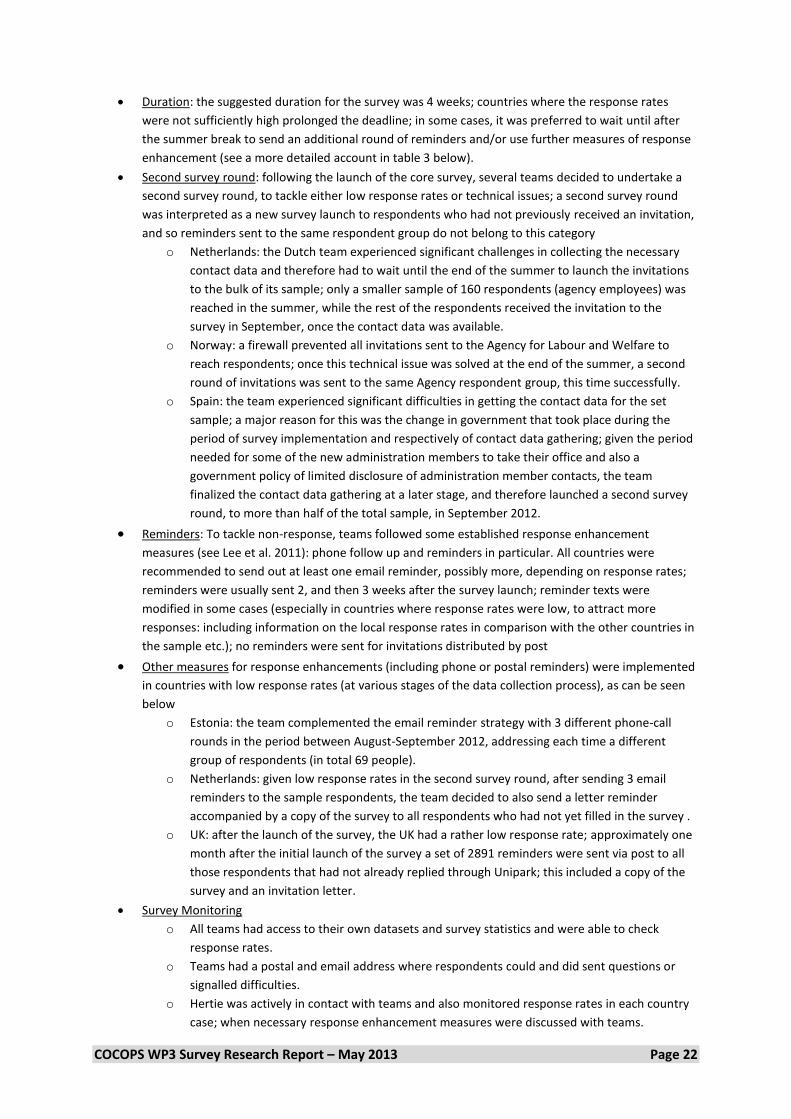
Launch of survey: mid-May-beginning of June 2012; surveys ran until 31 July 2012
Measures to enhance response rates: September-October 2012
Data cleaning, harmonization and validation: October-November 2012
o Cleaning the data and ensuring that all items are coded correctly and consistently
o Validation of the country data by each team
All surveys closed: November 2012
Survey also launched in Austria and Portugal (non-COCOPS countries): November 2012
Finalizing national datasets and creating comparative dataset: December 2012
Writing ten national reports based on first survey results in each country: December 2012 – April
2013
Writing the cross-national report, based on the integrated dataset: March – June 2013
Dissemination of survey data: January – end of 2013
COCOPS WP3 Survey Research Report – May 2013 Page 7
I.3. Survey design and content
The result of the first, design phase of the Work package was a 12-page survey with 31 core questions, which
was distributed during two survey rounds (May-July 2012, and September-November 2012), electronically or
via post, to over 21,000 high ranking civil servants in ten European countries based on a joint sample
specification.
As mentioned before, the main research goals of the survey were clearly set by the overall COCOPS research
framework. The aim of the survey was to capture experiences and perceptions of public sector executives as
key knowledge carriers in the public sector in Europe on:
the current status of management, coordination and administration reforms (especially NPM style
reforms)
the effects of NPM-style reforms on performance, but also on other factors such as public sector
values/identities, coordination or social cohesion
the impact of the financial crisis
Lastly, the survey also aimed to explore various factors influencing and shaping these perceptions/experiences,
such as: institutional/organisational context (e.g. country, policy field, organisation type, size of organisation,
socio-demographic factors (education, age, work experience), and individual values and attitudes.
The driving principles behind the survey were established during the design phase of survey. As such, the
content of the questionnaire was shaped by the following factors/considerations:
Building the survey on a theory-driven basis, integrating different research disciplines and interests:
the content of the questionnaire therefore links with central research concepts in different disciplines
such as public administration, public policy, organisation theory, management theory and psychology;
the survey mirrors this diversity and allows for a broad spectrum of research papers and analyses
based on the resulting data.
A major theoretical framework underlying the survey/questionnaire is the distinction of three different
reform paradigms (New Public Management, Public Governance and The Neo-Weberian State) as
suggested by Pollitt and Bouckaert (2011). The survey tries to capture how far these three different
reform paradigms have spread on the three different levels.
Allowing for analysis of different levels/perspectives: the survey combines questions at macro-level
(institutional/policy field), meso-level (organisational level of ministry or agency) and micro-level
(individual executive)
Based on the overall research goals and a literature review (see Hammerschmid/ Van de Walle 2011) a
set of key topics/issues was developed (e.g. public sector ethos/perception of work,
political/administration relation, social cohesion decentralization/management autonomy,
target/performance management, coordination/network governance) as the basis for the
questionnaire items.
The survey design process took as reference for methodological issues, topics/issues and operationalisation of
variables of interest other public administration executive surveys . Some of the examples include:
Well established elite studies, such as the Aberbach et al. 1981 and Derlien 1988
The COBRA/CRIPO survey on autonomy, steering and performance of agencies
The EU-Consent survey on the reform and future of the EU Commission (see Bauer et al. 2009)
The UDITE survey on Leadership experiences of local government CEOs (see Mouritzen and Svara 2002)
A survey on the Future of Government Service (SFGS) by the Woodrow Wilson School of Public and
International Affairs, Princeton University (Volcker et al. 2009)
COCOPS WP3 Survey Research Report – May 2013 Page 8
In addition, findings from meta-analyses of survey research in public administration (e.g. Lee et. al 2011), the
current status of comparative public administration (e.g. Fitzpatrick et al. 2011; Pollitt 2011) also informed the
design process.
The survey also combined experiences from previous major public sector executive surveys in Norway
(Christensen and Lægreid 1996, 2007), Austria and Germany (Hammerschmid and Meyer 2005, Meyer and
Hammerschmid 2006 or Hammerschmid et al. 2010), and elements of previous surveys as part of the COST-
CRIPO project.
Based on these considerations and in several steps the survey team developed an overall concept with certain
clusters of questions/variables (see figure 2), which can be linked for future research in a flexible form
depending on the specific research interests:
Figure 2. Central issues/content of the questionnaire
A look at the various relationships between these sets of variables (see figure 3) already allows to foresee
interesting directions of future research, for instance:
What factors do influence the perception of central aspects of the work/organisation context such as
What individual/organisational/institutional factors do explain the relevance of NPM at
individual/organisational/policy field level (r2/r5)
What factors (organisational context, various reforms at organisational and policy field level, severity
of financial crisis) do have a positive / negative impact on social cohesion/organisational social capital
(r6/r7)
What factors do influence the internal/external use of performance indicators (r2/r5)
How do organisational/contextual factors and previous NPM reforms (eg. spread of performance
management) have an influence on the way public administrations do cope with the financial crisis?
(r4/r9)
I. Institutional/organizational context
• Country (q0)
• Organization type (q1)
• Policy f ield (q2)
• Size of organization (q3)
II. Socio-demographics (individual)
• Hierarchy level (q4)
• Gender (q26)
• Age (q27)
• Education level (q28)
• Subject of degree (q29)
III. Values & motivation (indiv. dispositions)
• Identity / sellf -understanding (q4)
• PA value preferences (q23)
• Motivation (q24)
extrinsic, intrinsic, altruistic
• Social value preferences / ESS (q25)
• Psychological attitudes (q25)
(locus of control, risk attitude)
IV. Perception of work/organization context
• Goal ambiguity (q8 1-4)
• Degree of management autonomy (q6)
• Interaction/coordination frequency with dif f . actors (q10)
• Coordination quality (q11)
• Degree of policization (q12)
• Organizational culture (q15)
V. Perception of relevance of NPM / post NPM reforms
Individual level
• Use of performance indicators for different purposes (q9)
Organizational level
• Relevance of dif ferent management instruments (q7)
• Relevance of performance management (q8 5-9)
• Coordination solutions (q13)
Policy field level
• Importance of reform trends (q17)
(NPM, (Neo-)Weberian, NPG)
• Dynamics of public sector reform (q18)
VII. Perception of outcomes/effects variables:
Individual level
• Job satisfaction (q15 1-4)
• Organizational committment (q15 5-9)
• Identity (q4)
Organizational level
• Social capital/trust (q14)
Policy field level
• Dif ferent performance dimensions 5 years (q19)
Overall
• Overall pa assessment 5 years (q16)
VI. Perception of financial crisis
Severity/dynamics
• Overall saving strategy (q20)
• Cutback measures organ. level (q21)
Impact
• Institutional arrangements
COCOPS WP3 Survey Research Report – May 2013 Page 9
It also becomes clear that certain variables can be used both as independent or dependent variables, e.g.
identity as a factor explaining the perception of management reforms vs. identity changes as a consequence of
certain reforms.
Figure 3. Various relationships/causalities between the variables
I.4. Questionnaire and country variations
As previously mentioned, one of the key concerns of the survey team1 was to ensure a high quality for the
survey, by building it on a strong methodological basis, according to established standards of elite and public
administrations surveys, but also ensuring in an original manner its representativeness for the country
administrations involved. Therefore, the survey was first of all based on a set of key principles regarding
methodology agreed on through discussions and meetings of the survey team and feedback with all COCOPS
teams, which then guided the development of the questionnaire:
Creating one joint questionnaire, to be distributed to the central ministries and the two policy sectors
(health and employment) with only few, country specific questions added, depending on the relevance
of proposed questions from the perspective of the local teams.
Collecting three types of information/data regarding:
o Characteristics of the individuals and their position, identity, preferences etc. (as control
variables)
o Management practices/reforms in the respondents´ employing organisation/government
o Perceived outcomes of the work of the employing organisation and the policy field.
These aspects were intended to cover the wider range of topics allowing researchers to then
explore developments, and in particular NPM reforms, in the public sector across Europe,
together with data that could offer explanations regarding these developments.
1
Hertie School of Governance Berlin, CNRS Paris, Cardiff University, Erasmus University Rotterdam, University of Bergen
r9
r2
r3r4
r5r8
r6
r6
r7
r1
COCOPS WP3 Survey Research Report – May 2013 Page 10
Focusing on current management practice rather than past reforms and placing less emphasis on
normative assessments (´How it should be´) and views on the future of the public sector (It was
considered by the team that the first were easier to observe through direct experience by the
respondents, and a more reliable research path than exploring normative aspects, subjective beliefs
etc).
Avoiding questions asking directly for a specific impact of certain management practices on particular
outcomes, as well as questions on causalities (to avoid putting pressure on respondents, but also to
avoid producing subjective, hard to verify replies).
Describing management practices and outcomes generically, simply and clearly, avoiding public
management jargon, to ensure a clear understanding of the concepts used in the survey by the
respondents targeted.
Referring to a standard period of 5 years throughout the entire survey when time periods are
mentioned in the questions. Any longer period of time would have been too long, respondents might
have not been in their positions as long and would not have realistically been able to make correct
judgements. With regards to the time span used, see also the Special Eurobarometre 370, on
assessment on how government works.
Employing 7-point scales for answers. Starting from the examples of other public administration
surveys (see the surveys mentioned above), the survey team considered that a 7-point scale would
allow for sufficient variation in responses, while not burdening respondents with irrelevant scale
values, as would have been the case if a longer, 9- or10-point, scale had been applied to most
questions.
The ´Don’t know / cannot answer´ option was used scarcely /; following discussion among the project
members, it was decided to preferably allow respondents to skip questions rather than allow for this
‘opt-out’ alternative and thus to complicate the later analysis of results.
Refraining from open questions, to avoid interpretation issues during the data validation and analysis
phase; in some instances respondents were offered the possibility to choose item ‘Other’ and offer
further information, but these were mostly limited to situations where a full coverage of the national
context would not have been possible through the item formulation.
Use multi-item variables, reflecting the complex research dimensions of the survey
In areas covered by the survey, well-established item operationalizations already existed, the survey
tried to take them up and use them either directly or with little variation. Some examples from which
specific items have been (partially or completely) taken include:
o OECD ‘Classification of the Functions of Government’ (COFOG): policy fields in question 2
o Special Eurobarometer 370, on Social climate, assessment about how public administration is
run: question 16 in particular
o Leana/Pil 2006, and Nahapiet/Ghoshal, 1998, on organisational social capital with a
distinction of structural, relational and cognitive dimensions: see question 14
o Allen/Meyer 1990, organisational commitment types: selected items in question 15
o Public Service Employee Survey (Treasury Board Canada 2008): selected items in question 15
o Rotter score for ´locus of control´ (Carpenter and Seki 2006): see question 25
o International Social Survey Program 2005, work motivation/orientation bases more generally
o European Social Survey, items related to ‘Human Values’
COCOPS WP3 Survey Research Report – May 2013 Page 11
I.4.1. Structure of the questionnaire
Based on the research goals, principles and content areas described above, the questionnaire for the
´Executives Survey on Public Sector Reform in Europe. Views and Experiences from Senior Executives´ is
structured in four parts:
Part I: General Information 4 questions with 31 items
Part II: Management and Work Practice of Your Organisation 11 questions with 97 items
Part III: Public Sector Reform and the Fiscal Crisis 7 questions with 61 items
Part IV: Attitudes, Preferences, and Personal Information 9 questions with 47 items
As mentioned above, a few concerns emerged throughout the survey design phase, and during the feedback
rounds with the COCOPS teams: The potential negative effects on response rates of a survey that was too
lengthy; the need to adapt to the limitations of the survey as research instrument, and that of reflecting the key
NPM developments and concepts; grant requirements. To address these issues, some of the topics and
questions proposed in the initial design phases were dropped from the survey. In particular, the sections on
normative aspects of public administration and the public sector of the future, as well as questions regarding
individual opinions and characteristics (e.g. belonging to political parties, ideological positioning) were dropped;
they were seen as too difficult to interpret in relation to NPM impacts and especially the latter as too sensitive
for respondents.
Special attention was given to the order of the survey sections. As it was expected that a bigger number of drop
outs would be observed towards the end of the survey, priority was given to control questions that would offer
information on the nature of the respondent´s organisation, also considered as appropriate introductory
questions (Part I), and to core issues related to NPM (Part II: Management and Work Practice of Your
Organisation).
The introduction text was created in order to both clarify the objectives of the survey, but also to motivate
respondents to participate. Other accompanying texts, introducing the various sections, or defining
´organisation´ and ´policy area´2 were meant to ensure a standard understanding of key concepts and survey
approaches across all respondents, regardless of their country or administrative structure/culture.
Please find the core questionnaire as separate attachment (Annex I).
I.4.2. Country variations – core questions
While the intention was to keep all country versions homogenous, certain differences could not be avoided if
the surveys were to look convincing and plausible to local respondents. Respecting established cross-national
survey standards (see in particular ‘Guidelines for Best Practice in Cross-Cultural Surveys’, Institute for Social
2 To avoid misinterpretations of these crucial concepts leading the respondents’ positioning towards the survey, the following two definitions were offered at the beginning of the survey: ‘Your organisation refers to the organisational entity for which you work. Usually, it is a ministry (in the UK this is a ‘Department’) or an agency. It is never only a section, division, or subunit within a ministry or agency. Agencies or other subordinate bodies that have autonomy versus the Ministry should be regarded as their own organisation and not as part of the Ministry.’ ‘Your policy area refers to the wider set of policy topics or issues to which your own work mainly contributes. It usually coincides with the policy issue in which your organisation is designing and implementing policy.’
COCOPS WP3 Survey Research Report – May 2013 Page 12
Research, University of Michigan), teams were allowed to adapt their country versions to fit national context,
and especially, to match national administrative structures, but had to clearly protocol all deviations.
In this context, especially questions 1 (´´What type of organisation do you work for?´´) and 4 (´´What kind of
position do you currently hold?``) offered particular difficulties. Keeping in mind concerns for comparability,
teams were nonetheless allowed to modify (add or delete) items in such a way that they would fit
administrative structures, but could also later be clearly re-coded along the original items in order to secure
equivalence. This was the case for the government level dimension proposed by question 1 (e.g. differentiating
central, state/regional and other subnational level), which was not applicable to many countries. The
agreement with teams was that in the phase of data harmonization, they would provide a clear explanation of
the equivalence of these terms, in order to ensure that the final dataset could be used in a comparable manner.
With regards to the introductory definition of organisation and policy area, for many countries the terms were
self-explanatory and in some surveys the definition was not even included; for others the definition needed to
be adapted to the specific administrative structures.
Other slight modifications were also made in the introductory text, to make it more relevant or motivating for
national audiences (underlining for instance the large scope of the survey, its European, comparative
dimension, or the relevance of its insights for understanding the changes in public administrations).
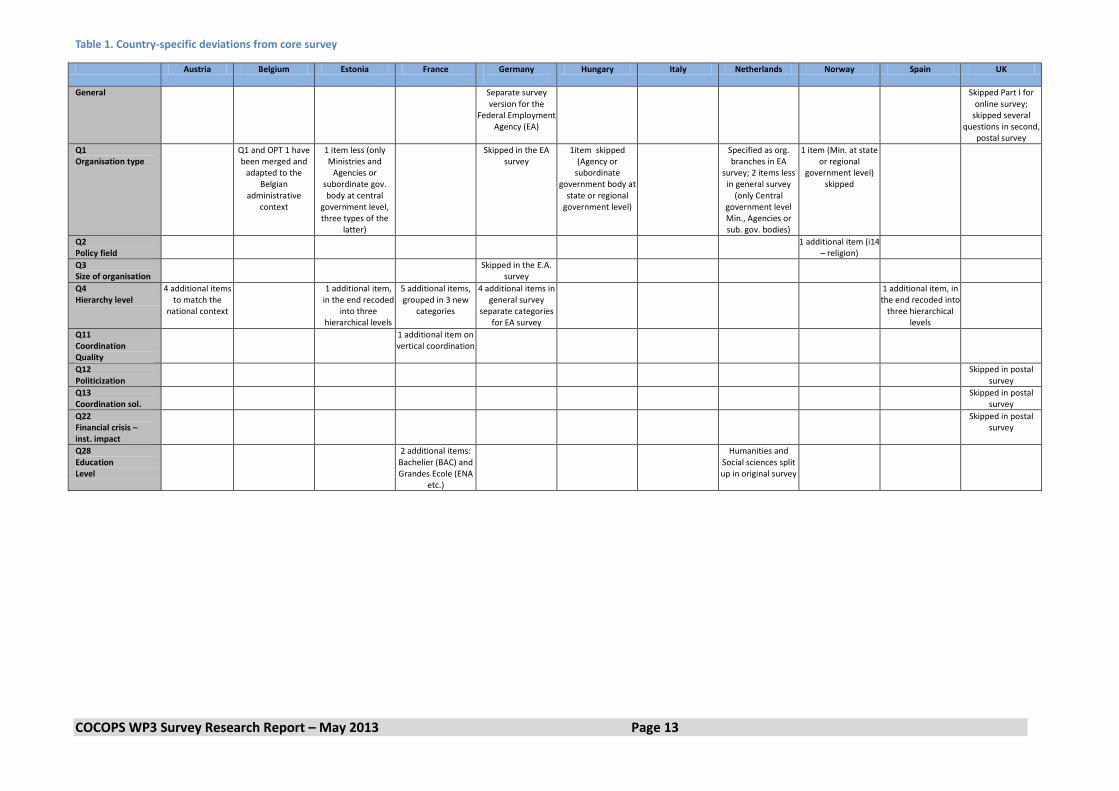
Please see below a summary of the country variations to the core survey text.
I.4.3. Country variations – optional questions
While concerns for the survey length and other research limitations mentioned above (see section 1.4.1) did
not allow for the use of all questions initially discussed by the survey team, it was felt that a few of these were
of particular interest for some of the teams involved and, while not relevant for the survey in its entirety, could
offer relevant insights from narrower, national contexts. Therefore a list of optional questions was proposed,
containing suggestions from teams, which had been excluded in the core survey. COCOPS teams were invited to
select a maximum of 3 questions from this pool to be used in their national surveys, in addition to the core
questionnaire.
Please see table 2 for a list of questions used by each team, and a more detailed description of the optional
question in the attached Annex II.
COCOPS WP3 Survey Research Report – May 2013 Page 13
Table 1. Country-specific deviations from core survey
Austria Belgium Estonia France Germany
Hungary Italy Netherlands Norway Spain UK
General Separate survey version for the
Federal Employment Agency (EA)
Skipped Part I for online survey;
skipped several questions in second,
postal survey
Q1 Organisation type
Q1 and OPT 1 have been merged and
adapted to the Belgian
administrative context
1 item less (only Ministries and
Agencies or subordinate gov. body at central
government level, three types of the
latter)
Skipped in the EA survey
1item skipped (Agency or
subordinate government body at
state or regional government level)
Specified as org. branches in EA
survey; 2 items less in general survey
(only Central government level Min., Agencies or sub. gov. bodies)
1 item (Min. at state or regional
government level) skipped
Q2 Policy field
1 additional item (i14 – religion)
Q3 Size of organisation
Skipped in the E.A. survey
Q4 Hierarchy level
4 additional items to match the
national context
1 additional item, in the end recoded
into three hierarchical levels
5 additional items, grouped in 3 new
categories
4 additional items in general survey
separate categories for EA survey
1 additional item, in the end recoded into
three hierarchical levels
Q11 Coordination Quality
1 additional item on vertical coordination
Q12 Politicization
Skipped in postal survey
Q13 Coordination sol.
Skipped in postal survey
Q22 Financial crisis – inst. impact
Skipped in postal survey
Q28 Education Level
2 additional items: Bachelier (BAC) and Grandes Ecole (ENA
etc.)
Humanities and Social sciences split up in original survey
COCOPS WP3 Survey Research Report – May 2013 Page 14
Table 2. Optional questions used by teams
Austria Belgium Estonia France Germany Hungary Italy Nether-lands
Norway Spain UK
OPT1 Government tier
X
OPT2 Organisational task
X
OPT3 Accountable for
OPT4 Impact IGOs
X
X
OPT5 Contextual factors
X X
OPT6 General context
X
OPT7 Size of cuts
X
X
X
OPT8 Crisis: unions consulted
X
X
OPT9 Left – Right
X
OPT10 Member union/ party
X
OPT11 Get survey results
X
X
X
COCOPS WP3 Survey Research Report – May 2013 Page 15
I.5. Sampling and access strategy
I.5.1. General sampling principles and country variation
The COCOPS survey follows the tradition of elite studies (see for instance Aberbach et al. 1981; Putnam 1976;
Derlien 1988; Mouritzen and Svara 2002; Trondal 2010). In these studies, administrative elites are considered
to be members of organisations with expected higher reliability, knowledge or experience, usually senior
bureaucrats. This type of approach has been debated intensively over the last years (eg. Moyser andWagstaffe
1987; Enticott et al. 2008; Walker and Enticott 2004). Defenders of this method argue that top managers
should be surveyed because they have the best vantage point for viewing the entire organisational system
(Enticott 2004, p. 320), and that addressing questions to anyone other than the chief executive will lead to
considerably less accurate information than might have been presumably assumed. On the other hand, elite
surveys can nonetheless introduce significant sources of bias. Elite surveys only focus on one actor’s
perception, which cannot necessarily be taken as representative for the whole organisation. Chief executives
may have a vested interest in reporting favourable outcomes from new policy initiatives in order to present a
positive and successful image. They also can be expected to have different interests, needs and experiences
than frontline bureaucrats or simply overestimate results (Frazier and Swiss 2008).
In trying to balance these positions in practice, the target population of the COCOPS survey was defined as: top
and medium-high level civil servants who, in their respective positions, are most likely to hold the relevant
knowledge regarding (NPM-type of) reforms and developments within the public sector. The COCOPS survey
did therefore target the higher ranking managers in the respective public administrations, taking the point that
persons on this level are more likely to have an overview of existing NPM type of instruments and practices in
public administration. However, in order to address such representativeness and social desirability issues, the
survey covers the entire population defined, usually stopping at those tiers that are more regularly in charge of
service delivery, and thus outside the scope of the survey.
Given the expected differences in the national administrations, some variation in the country samples was
accepted. The guiding principle in creating the survey sample was to a lesser extent that of ensuring similarity,
but rather that of achieving comparability between all of the samples.3 Therefore, this general definition was
applied at each country level in order to include the relevant organisations and administrative tiers, according
to a commonly agreed set of principles, as will be described in more detail below.
Other key methodological concerns considered were:
Fitness of intended use: sampling respondents that would be best positioned to offer relevant insights into NPM reforms, according to the survey goals
Full census avoiding random samples
Non-response
Quality of responses In order to establish the degree of variation and the sample definition in each country, the first step taken was
a mapping of the administrative structures of all the participant countries, with the help of a template
developed by the coordinating research team. This standardized mapping template requested from teams both
qualitative and quantitative information regarding their respective country administrations in each of the areas
of focus in the survey (central government, employment and health), and in particular: the type and number of
organisations and respectively, the approximate number of civil servants at each administrative tier included in
the population definition, along with information on the overall number of potential contacts corresponding to
3 For a methodological background to this, see the recommendations of the ‘Guidelines for Best Practice in Cross-Cultural
Surveys’, Institute for Social Research, University of Michigan, regarding flexibility in samples designs; and also European Social Survey Round 4 Sampling Guidelines.
COCOPS WP3 Survey Research Report – May 2013 Page 16
the definition; as well as information regarding expected response rates, recommended ways of access and
availability of the contact data about the targeted organisations and respondents.
The mapping exercise offered a helpful overview on public administration structures in all participating
countries; more importantly it also confirmed the initial set of sampling principles agreed upon and raised a
few general conclusions regarding both sampling and access, which were discussed with all teams during the
COCOPS meeting in Bucharest, September 2011. The most important of these points were: the inclusion of
state secretaries (considered to be too political in some countries), and achieving a representative and
sufficiently large sample in the health and employment sectors (which were from the beginning
proportionately smaller than general government in the administrations)4. This space for 'maneouvre' was,
however, still created in a manner that would not affect the overall comparability of the sample.
Two other aspects that were taken into consideration when tackling potential adaption of the national
samples: varying expected response rates5 and the project terms of reference (which stated a minimum of 300
valid responses per country). As a result, the minimum target in each country was set around 1200 respondents
(a number that was confirmed as realistic following the mapping exercise).
Based on the initial mapping exercise and discussion with all participating teams, a core body of sampling
principles was reached, which were followed by all national teams:
A. Central government:
Within all central government ministries the two top-administrative levels (below politically appointed
state secretaries) were to be addressed. Whether or not to address the level of state secretaries and
their deputies, given the high degree of politicization and low number of persons at this level, was left
to the choice of each team. In some particular cases, where deemed necessary by the teams, the third
level was also approached or allowed for answers.
All central government agencies were included, but restricted to the first two executive levels
(directors/board members/deputies + level below).
State-owned enterprises and audit courts were not included due to their different task profile.
In case expected numbers of respondents were too low to achieve these criteria, teams were advised
to also use a forwarding strategy, if and where appropriate: asking respondents in higher
organisational levels to forward the questionnaire to subordinate levels. Or, in particular cases, if
deemed appropriate by the teams, they could also target third administrative levels in central
government ministries.
B. Employment
The central government ministry level was targeted, according to the definition above
For central government employment agencies the first two hierarchical levels were targeted, along
with the heads of larger regional-agencies in countries with a more ramified and complex
administrative structure
Regional and state government ministries and agencies were also included to the extent that they
were relevant, in order to reach a higher number of executives, following the same rules as defined for
central government levels (i.e. the two top hierarchical levels). However, public sector bodies at the
local government level and service delivery organisations were out of the scope of this survey and
were therefore generally not targeted
4 The countries that opted for including state secretaries in their sample were Estonia, Germany and Spain.
5 Based on previous survey experience (see I.3) and recommendations from the teams, average expected response rates for
the COCOPS national surveys were established at around 20-25%.
COCOPS WP3 Survey Research Report – May 2013 Page 17
C. Health
The central government ministry level, agencies and the state and regional levels were targeted in the
same way as described for the employment field.
In the health sector in particular, in certain countries special organisations such as committees were
also involved in health policy; provided that such committees were equipped with their own budget
and staff, and were proven to be policy-relevant, they were also included in the sample with their first
two executive levels.
As in the employment sector, bodies at the local government level were not covered and in addition,
health insurances and hospitals, and bodies that were not directly involved in policy making processes
were also excluded from the sample.
In all participating countries the entire target population was covered; hence, there was full census avoiding
random sampling.
I.5.2. Access and data collection strategies
The mapping overview also showed the variation in preferred access strategies in each country. Based on this
and given a concern for non-response, country teams were offered flexibility in their strategies of reaching
respondents. The key criteria in the decision were the previous team experience with survey implementation
and their expectations regarding administrative cultures. For instance, previous surveys (eg. Hammerschmid et
al. 2010) showed that in more hierarchical and legalistic contexts a strategy of reaching respondents via post
would be significantly more effective than trying to reach respondents via email invitations, and would render
far higher response rates. In countries such as Norway, however, such an access path was considered by the
local team unlikely to be successful, and preference was given to email invitations.
Together with the coordinating team, the various national teams therefore decided on an access strategy that
would fit best to the specific context and sample specification. Points and options to be taken into
consideration were:
Accessibility of names, emails and addresses at the various sample levels
Invitations via email or post, or possibly a mixed strategy between these two (considering
administrative culture)
Personalized access with individualized access codes , versus anonymous access to the survey
Accessing respondents directly or via superiors (superiors could have both a motivating effect, but the
survey could also be blocked, respondents potentially being less inclined to answer due to anonymity
concerns)
Ethical considerations and need for centralised approvals
Possible endorsement from national or international/European institutions
Regarding the time period for the running of the survey, any aspects that might influence response
rates (such as elections, holidays etc.)
As the personalized/anonymous version is more complex and also requires some additional information, the
anonymous access version was the default option offered to teams; with it the invitation sent contained a
general, non-personalized link, which was open for access to all respondents. Respondents could not close and
continue the survey, which had to be therefore filled in one go. It was also more difficult to monitor survey
completion from the perspective of the managing team, but unlike a personalized link, this could easily be
included in postal invitations, where necessary, or forwarded by respondents to their employees.
The personalized option consisted of offering each respondent a unique link to their country´s survey, which
they could access repeatedly, allowing for interruptions and for the re-opening of the survey, until the
COCOPS WP3 Survey Research Report – May 2013 Page 18
respondent would have filled it in completely; this allowed for more flexibility from the perspective of
respondents, but also gave the survey team the possibility to send targeted reminders and to make a better
analysis of non-response behaviour; the concern here was a potential perception of anonymity risks on the part
of respondents (although, given the very working protocol of the software used, any linkage between a given
respondent and their answers would not have been possible). Due to the technical difficulty associated with
the creation and management of the personalized invitations, this process was managed entirely by Hertie, and
invitations were sent using Unipark software, based on the sample data provided by teams; in the case of
anonymous access, teams were in full control of the invitations, although in close collaboration with the Hertie
team – to minimize potential inconsistencies across teams and similar risks linked to the email distribution,
Hertie advised all teams to use a standard mail-merge function available in Microsoft Outlook.
Starting from the common sample definition, different countries adapted their samples and access strategies,
in close coordination and agreement with the lead survey team. Regardless of the chosen data collection
mode, the survey was self-administered with strong support from the coordinating Hertie team.
As the survey aimed at a full census, teams have gathered all of the contact information needed to access all
respondents in the population. The process has been different in each country, depending of the availability of
such – normally quite sensitive – data. Some of the data was readily available through civil service official
directories. In other cases, the data had to be collected either individually from organization websites, or by
contacting individual organizations in order to receive the contact data (which would otherwise not be made
public). In cases where the full contact (for instance the name of the person occupying a respective position)
was not available, the invitations were sent, but not personalized.
I.5.3. Survey webpage
Regardless of the chosen access strategy, a web-version of the survey was set up in the respective language(s)
for each participating country. The link to the survey (as mentioned above, either a personalized, or an
anonymous-access link) was included in the invitations sent, so that all respondents had the possibility to visit
the webpage and fill in the questionnaire online; alternatively, as the invitation clearly stated, respondents
could go online, download and print the questionnaire, and after filling it in, send it to the national
coordination team via post or fax.6
In order to ensure a standardized survey design and thus mitigate any effects due to differences in web
structure and design, the Hertie team created all the country versions centrally, by using a well-established
survey software, tailored for use of academic research: Unipark (see http://www.unipark.com/). Each country
version was built using the questionnaire translations provided, and in close collaboration with the respective
teams. Also, once the survey was launched, all teams received access to the survey, allowing them to check the
response rates, but not allowing them to intervene in the survey implementation. To avoid any inconsistencies
or technical problems, Hertie also managed the survey infrastructure and covered any technical issues raised –
although all other aspects related to the local implementation of the survey stayed with the country team. Each
webpage created had a corresponding dataset, where all respective responses were gathered (in case surveys
had been received by the local team they were filled in online by the country team and fed into the dataset).
For countries that had more than one page, the datasets were merged together after the closing of the survey,
to create a unitary country dataset for all responses.
6 This option was offered in all countries with the exception of Estonia, where the local team felt that
COCOPS WP3 Survey Research Report – May 2013 Page 25
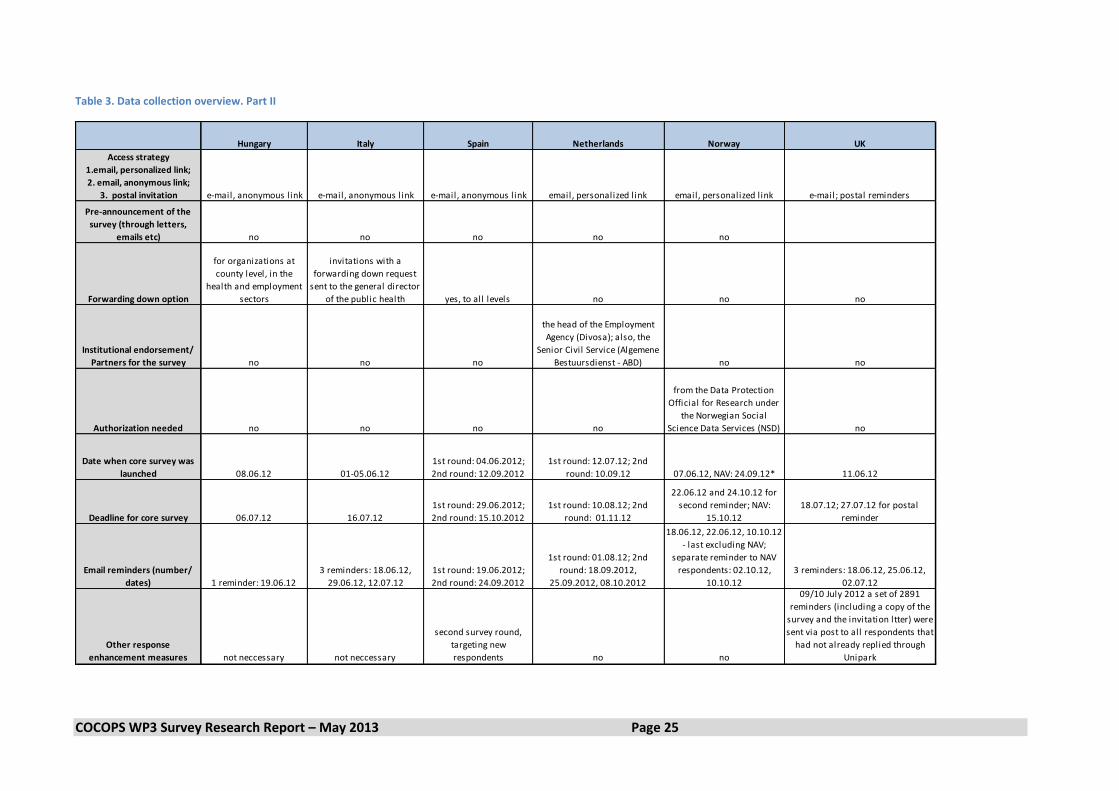
Table 3. Data collection overview. Part II
Hungary Italy Spain Netherlands Norway UK
Access strategy
1.email, personalized link;
2. email, anonymous link;
3. postal invitation e-mail, anonymous link e-mail, anonymous link e-mail, anonymous link email, personalized link email, personalized link e-mail; postal reminders
Pre-announcement of the
survey (through letters,
emails etc) no no no no no
Forwarding down option
for organizations at
county level, in the
health and employment
sectors
invitations with a
forwarding down request
sent to the general director
of the public health yes, to all levels no no no
Institutional endorsement/
Partners for the survey no no no
the head of the Employment
Agency (Divosa); also, the
Senior Civil Service (Algemene
Bestuursdienst - ABD) no no
Authorization needed no no no no
from the Data Protection
Official for Research under
the Norwegian Social
Science Data Services (NSD) no
Date when core survey was
launched 08.06.12 01-05.06.12
1st round: 04.06.2012;
2nd round: 12.09.2012
1st round: 12.07.12; 2nd
round: 10.09.12 07.06.12, NAV: 24.09.12* 11.06.12
Deadline for core survey 06.07.12 16.07.12
1st round: 29.06.2012;
2nd round: 15.10.2012
1st round: 10.08.12; 2nd
round: 01.11.12
22.06.12 and 24.10.12 for
second reminder; NAV:
15.10.12
18.07.12; 27.07.12 for postal
reminder
Email reminders (number/
dates) 1 reminder: 19.06.12
3 reminders: 18.06.12,
29.06.12, 12.07.12
1st round: 19.06.2012;
2nd round: 24.09.2012
1st round: 01.08.12; 2nd
round: 18.09.2012,
25.09.2012, 08.10.2012
18.06.12, 22.06.12, 10.10.12
- last excluding NAV;
separate reminder to NAV
respondents: 02.10.12,
10.10.12
3 reminders: 18.06.12, 25.06.12,
02.07.12
Other response
enhancement measures not neccessary not neccessary
second survey round,
targeting new
respondents no no
09/10 July 2012 a set of 2891
reminders (including a copy of the
survey and the invitation ltter) were
sent via post to all respondents that
had not already replied through
Unipark
COCOPS WP3 Survey Research Report – May 2013 Page 26
A difficult situation, deserving a separate explanation, occurred in the case of Belgium. With a rather small
original sample of 1105 respondents and only 86 valid responses, Belgium had the lowest rate of all
participating countries. Several reasons might possibly account for this:
The complexity of the bilingual federal Belgian administrative structure, making the design of the
access strategy particularly difficult.
The lack of contact data in the case of a large part of the sample; to respond to this, invitations were
sent in both Dutch and French as follows:
a. when all necessary contact information (including position in the organisation, gender etc.)
was available, personalized email invitations were sent through the Unipark system
b. when only the name and email were known, more general email invitations were sent
through Outlook by the local team
c. when a name but no email could be found, invitation letters and copies of the questionnaire
in both languages were sent by post
d. when neither name nor email, only a position could be found, the team was forced to rely on
a forwarding request to the heads of the organisations of those respective respondents; this
was the case for 63% of the sample respondents in federal government, and respectively 35%
of the entire sample.
Considering the low response rates, and the limited possibility for statistical analysis this offers, as well as
concerns regarding the impact on the integrated dataset, it was jointly decided by the teams not to include the
Belgian responses in the integrated dataset, and therefore in the comparative analysis or materials from the
survey. Instead of Belgium the Austrian data based on exactly the same procedure as in all the core COCOPS
countries was now included in the dataset so that this is now composed of 10 countries.
As a result, in the following sections of this Report, dealing with responses and survey results, the Belgian
results are not included.
COCOPS WP3 Survey Research Report – May 2013 Page 27
II. Data processing and final sample
For a number of methodological reasons described below, the raw responses needed to undergo a process of
revision. The following sections provide a description of the steps taken to create first a valid dataset for each
country, and then an integrated dataset.
II.1. Data cleaning
To begin with, there is a discrepancy between the number of completed surveys indicated by the Unipark
system and the number of respondents kept in the final sample. There are two reasons for this and both cause
distortions in opposite directions.
On the one hand, the Unipark system is unable to distinguish between a respondent viewing a question and
actually answering it. This implies that a respondent clicking through the entire survey without answering any
of the questions is listed as having completed the survey. This causes an upward bias in the reported number of
completions. On the other hand, a respondent that answers all the questions except the last few – which for
most practical purposes can be considered a completed survey – is listed as not having completed it. This
causes a downward bias in the reported number of completions. This section stipulates a simple rule for
dropping respondents from the sample.
Before describing the data cleaning procedure we note that
while the Unipark system cannot distinguish between a
view and an answer, in most cases a more thorough
analysis of the data allows us to do so. For instance, a
respondent failing to answer a 7-point Likert scale item (e.g.
“Not at all … To a large extent”) will be assigned a value
equal to 0 for that question, which the Unipark system doesn’t recognize it as a non-answer. Valid answers
however result in values ranging from 1 to 7, implying that any 0 is in fact a missing value. An exception are the
‘Quoted’/’Not quoted’ type questions (e.g. policy fields) where we are unable to observe the difference
between a ‘Not quoted’ and a non-answer.
The cleaning procedure involves dropping all respondents who failed to answer at least 25% of the survey
items. In other words, if more than 75% of the items are missing the observation is dropped from the database.
Table 4 below gives the number of cases before and after the cleaning rule is applied.
Table 4. Number of valid observations before and after cleaning
Data cleaning procedure
Country before* After % dropped
Austria 834 637 23.62%
Estonia 464 321 30.82%
France 1,667 1193 28.43%
Germany 627 566 9.73%
Hungary 626 351 43.93%
Italy 745 343 53.96%
Norway 541 436 19.40%
The Netherlands 390 293 24.87%
Spain 720 321 55.42%
UK 484 353 27.07%
Total 7098 4814 32.17%
* This is the number of first page visits, which equals the number of unique ‘observations’ in the raw data.
Cleaning rule for observation removal
A case, or respondent, is dropped if she or he answered less than 25% of the items.
COCOPS WP3 Survey Research Report – May 2013 Page 28
Figure 4 below depicts the item response rates for the selected countries after the cleaning rule was applied. In
some instances, respondents arguably had a valid reason for skipping a question. For example, Question 10
item 5 where we inquire about the frequency of interaction between the respondent and subordinate agencies
and bodies was left blank by many subjects (see minor ‘dips’ at q10_6 in Figure 4 below). However, in these
instances the respondent usually was employed in an organisation with no subordinate body or agency.
Furthermore, the downward spikes in the item response rates also include respondent missing values such as
‘Cannot assess’. Note that these were not counted as ‘missing’ when applying the cleaning rule.
Figure 4. Item response rates after cleaning
II.2. Data harmonization
In order to produce a comparable integrated dataset, a key condition is that all items under each question
across all survey countries, to be comparable. Given the questionnaire variations described in earlier sections
(see chapter I.4.) a necessary step in the data processing process was to harmonize the existing country
datasets. There were two areas of focus where recoding was necessary:
Country variations: items which were adapted to the national administrative context and so differed in
the respective country surveys; all of these needed recoding under one of the items in the original
survey; the optional questions were not a part of this process, as there was no actual item variation
involved.
Open items: all items that were left open for respondents; some of the answers provided by
respondents were indeed left under the category ´other´; however, as it became obvious from the first
data overview, some answers were equivalent to one of the existing survey items, and could be
recoded to fit these.
For both of these areas the harmonization process consisted of a set of standardized steps, guided by Hertie,
but, as with all the preceding ones, in close cooperation with the teams.
1. Creation by Hertie of a template (one containing country variation, the second – the open items)
where the recoding could be entered by teams:
60%
65%
70%
75%
80%
85%
90%
95%
100%
q1
q5
_3q
5_8
q6
_5q
7_2
q7
_7q
7_1
2q
8_3
q8
_8q
9_4
q1
0_1
q1
0_6
q1
0_1
1q
11
_2q
12
_2q
13
_2q
13
_7q
14
_4q
14
_9q
15
_5q
16
q1
7_5
q1
7_1
0q
17
_15
q1
8_5
q1
8_1
0q
19
_4q
19
_9q
19
_14
q2
3_3
q2
4_2
q2
4_7
q2
5_3
q2
5_8
q3
0_2
UK Germany France
Spain Italy Estonia
Norway The Netherlands Hungary
Austria
COCOPS WP3 Survey Research Report – May 2013 Page 29
The templates included a full overview of existing items with the initial recoding, question by
question; and next to them a blank template for each of these items, where teams could
enter the new recoding values, if appropriate; detailed instructions regarding this process
were offered in the introduction to the template.
An additional goal of the template, apart from recoding items, was also an extra check for any
missing values or items from the list.
2. Countries filling in the recoding information
3. Check and adjustments was performed by Hertie or further discussion with the team when necessary.
4. Adapting the datasets and recoding a) varying items and b) open items, according to the input
received from teams.
The country specific variables (original variables, before recoding) were kept in the national dataset along with
the recoded variables and the optional questions; the integrated database however only included the variables
based on the core questionnaire and without the optional questions.
II.3. Data validation
Following the harmonization phase each national team received a word document with
descriptives/frequencies for each question, and asked to check its country data/results for plausibility and
possible errors or inconsistencies that could have intervened in the cleaning and harmonization phase
(excluded were questions asking for respondents´ personal opinions, which could not be verified for validity).
Based on feedback from the teams, Hertie integrated the modifications needed and produced a final, validated
national dataset, which was then used for the integrated dataset.
The key results of the data harmonization and validation phases were therefore:
A country dataset (in STATA, or if required by teams, in other formats) for each of the participating
country containing:
o all harmonized items
o all original country items (before recoding)
An integrated dataset containing:
o all harmonized items for all countries
o no country specific items
A finalized Codebook, including the operationalization of all variables/items (see this document
attached separately)
The Codebook, together with the present Research Report (including the frequencies for all variables/items)
are part of the Deliverable D.3.5. submitted to the European Commission following the project terms of
reference, and are also available on the COCOPS project website: www.cocops.eu. The actual national and
integrated datasets will be made available under the conditions set out in the Data sharing policy jointly agreed
by the project members (for conditions of the policy please see section IV below).
COCOPS WP3 Survey Research Report – May 2013 Page 30
II.4. Final sample
Table 5 below provides a per-country overview of the number and type of invitations sent along with central
response information, and the number of responses received following the cleaning procedure.
Table 5. Total response rates per country
Country Invitations Sent* Survey
completions Response rate %
Austria 1745 637 36.50
Estonia 913 321 35.16
France 5297 1193 22.52
Germany 2295 566 24.66
Hungary 1200 351 29.25
Italy 1703 343 20.14
Netherlands 977 293 29.99
Norway 1299 436 33.56
Spain 1778 321 18.05
UK 3100 353 11.39
Total 20307 4814 23.71
*The invitations sent represent the final number of invitations that has reached respondents, after the exclusion of any failure deliveries, wrong addresses etc.
A look at research literature based on public administration executive surveys shows considerable variations of
response rates across countries, as well as generally lower response rates than those usually expected in
population surveys, due to several reasons such as anonymity concerns, higher sensitivity of the data gathered,
high work pressure of executives and the increasing prevalence of surveys addressed to them. Response rates
for executive surveys in Europe in the past did reach up to 61% (Danish state administration; Vrangbaek 2009)
or 56% (European Commission survey, albeit based on direct contacts and interviews; Bauer et al. 2009), but
are mostly in the area of 25-35%: e.g.-Austria 41.5% (Meyer and Hammerschmid 2006), Austria/Vienna 38.5%
(Meyer et al. 2013), Netherlands 33% (Vos en Weterhoudt 2008), Catalonia 30% (Esteve et al. 2012),
Netherlands 30.2% (Van der Wal and Buberts 2008), Germany 29.8% (Kröll 2013), Germany 24.3%
(Hammerschmid et al. 2010) or Netherlands 19.5% (Torenvlied and Akkerman 2012). Also for the US we find
rather similar response rates with e.g. a response rate of 46.4% for the large scale and often used NASP-IV
survey (e.g. Moynihan et al. 2011), an executive survey on the Future of Government with 33% (Volcker et al.
2009) but mostly in the range of 30 to 35% as reported by Hays and Kearney (2001); there is also a visible
decrease of response rates in time, as shown by Burke et al. (2008): the response rates for a longitudinal survey
of state government they conducted went progressively down from 68% in 1968 to 29% in 2004). Another large
scale European comparative survey, the UDITE survey of local government elites, conducted in the mid-90s,
had an overall response rate of 33%, with great differences between countries (e.g. 7% in Spain, 27% in Italy,
compared to 56% in the UK, 75% in Norway and 80% in Sweden) (Mouritzen and Svara 2002).
The overall response rate of 23.71% for the COCOPS survey is rather consistent with response rates from other
executives surveys in the public administration and is especially based on a full census and not any sampling
strategy.
Table 6 below also provides a more detailed overview of invitations and response rates for the three sectors of
interest to the COCOPS project, namely central government, health and employment services. As to be
expected, central government has by far the largest share of responses in real numbers, but shows somewhat
COCOPS WP3 Survey Research Report – May 2013 Page 31
lower response rate compared to the health and employment fields (although the latter are smaller, they have
been targeted more intensively, which explains the higher response rates for these sectors in most countries).
Table 6. Total response rates per policy field
Central government area* Health Employment
Country Invitations
Sent Survey
completed Response
rate % Invitations
Sent Surveys
completed Response
rate % Invitations
Sent Surveys
completed Response
rate %
Austria 1219 450 36.92 242 116 47.93 286 71 24.83
Estonia 809 270 33.37 52 38 73.08 52 21 40.38
France 4765 870 18.26 423 190 44.92 411 155 37.71
Germany 1595 331 20.75 240 53 22.08 460 192 41.74
Hungary 781 204 26.12 212 42 19.81 207 108 52.17
Italy 720 130 18.06 707 136 19.24 276 80 28.99
Netherlands n.a 176 n.a. n.a 25 n.a. n.a 92 n.a.
Norway 1055 312 29.57 155 84 54.19 89 48 53.93
Spain 1282 222 17.32 201 47 23.38 295 55 18.64
UK 2120 278 13.11 164 29 17.68 816 50 6.13
Total
14346 3243 21.38 2396 760 30.68 2892 872 26.97
*We refer to 'central government‘ as the sum of responses from all policy sectors except those from health and employment – whereas the latter two are treated separately. **Please note that respondents had the possibility of opting for more items regarding their policy field; as a result, the total sum of responses in the three separate policy fields, and the sum of total integrated responses (Table 5) do not fully match match.
With regard to the more detailed policy fields (see also question 2 on page 35) we find a relatively even
distribution of all policy fields in the sample of around 10% and rather lows shares only for defense (2.6%),
foreign affairs (3.7%) and recreation and culture (5.6%). The low shares for defense and foreign affairs can be
explained with a generally more closed culture of these two policy fields – making them clearly under-
represented in the overall sample –, whereas the low share of the latter is due to the relatively low relevance
of this sector at central government level.
With regard to hierarchical levels, a comparison of initial invitations sent out and responses received (see Table
8) shows that the distribution of respondents closely matches the distribution in the full target population. The
sample is balanced and no particular hierarchical level is either over- or under-represented. What should be
noted however is that we can find some under-/overrepresentations on single country levels such as an over-
representation of top-level executives in Germany, of second level executives in Estonia and lower-level
executives in Norway – aspects which should be taken in to consideration for more closer analyses and
interpretations.
Table 7. Invitations and final response shares per hierarchical level
Hierarchical level Invitations sent Responses
Top hierarchical level in organisation 23% 22%
Second hierarchical level in organisation 41% 40%
Third hierarchical level in organisation 36% 38%
Total 100% 100%
COCOPS WP3 Survey Research Report – May 2013 Page 32
Looking at the sample representativeness in terms of organization type (Table 9), we find that ministries (at
central level), are somewhat under-represented, while the responses from agencies (at central level) are
somewhat higher than expected – but overall we feel a balance is kept between these aspects and
generalizations can be made with regards to the population targeted.
Table 8. Invitations and final response shares per organization type
Organization type Invitations Sent Responses
Ministry at central government level 45% 33%
Agency or subordinate government body at central government level (including health & employment) 27% 35%
Ministry at state or regional government level 15% 16%
Agency or subordinate at Land (government body at state or regional government) level 9% 11%
Ministry or other public sector body at other subnational level 3% 5%
Total 100% 100%
An important aspect, which sets the COCOPS survey apart from most other executives surveys in public
administration is that fact that it represents a full census of the target population defined and that there has
been no sampling process. We cannot claim full representativeness for the data and the results cannot be
generalized to entire target population of senior public sector executives in European administrations.
However the response rates are well in line with other public sector executive surveys, cover a substantial part
of the targeted population and the distribution of respondents with regard to policy field, hierarchical level and
organization type rather closely matches the distribution in the full target pollution and can be regarded as a
good proxy and by far the most representative dataset for European public administrations collected up till
now.
A few notes referring to the use of data. Throughout the reports describing national and cross-national results
the teams have referred to the ‘COCOPS overall sample‘ or to their national samples. As the survey currently
includes validated results from ten European countries, we believe these results to be a solid basis for analyzing
trends and developments across different public sectors and administrative traditions in Europe. Nonetheless,
as not all European countries are included and full representativeness cannot be claimed, we have to refrain
from making further generalizations to all European public administrations and encourage all researchers using
this data to take this into consideration for their interpretations.
The survey team also underlines that the results reflect the opinions and perceptions of the civil servants
surveyed, with any potential limitations such data might have. Nonetheless, we take the position of Aberbarch,
Putnam and Rockman that, ‘opportunities permitting’, beliefs are reliable predictors of actual behavior (1981:
32), and can be considered a proxy for civil servants‘ actions and decisions.
COCOPS WP3 Survey Research Report – May 2013 Page 33
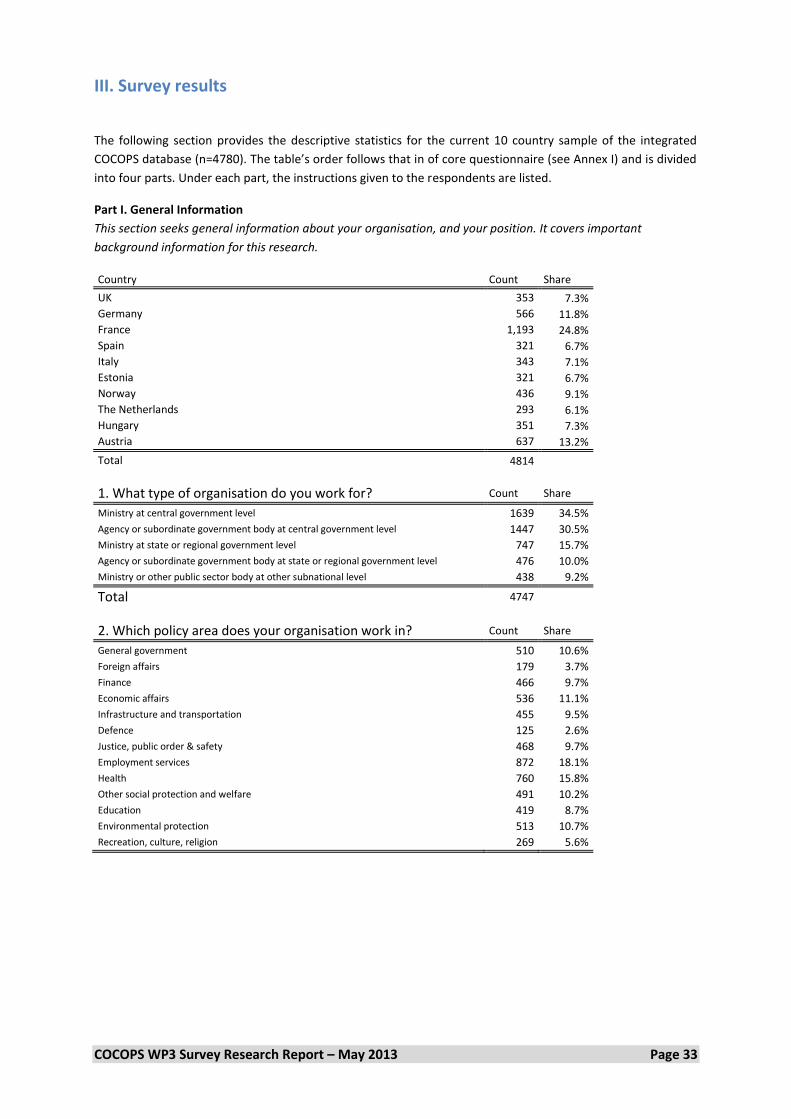
III. Survey results
The following section provides the descriptive statistics for the current 10 country sample of the integrated
COCOPS database (n=4780). The table’s order follows that in of core questionnaire (see Annex I) and is divided
into four parts. Under each part, the instructions given to the respondents are listed.
Part I. General Information
This section seeks general information about your organisation, and your position. It covers important
background information for this research.
Country Count Share
UK 353 7.3%
Germany 566 11.8%
France 1,193 24.8%
Spain 321 6.7%
Italy 343 7.1%
Estonia 321 6.7%
Norway 436 9.1%
The Netherlands 293 6.1%
Hungary 351 7.3%
Austria 637 13.2%
Total 4814
1. What type of organisation do you work for? Count Share
Ministry at central government level 1639 34.5%
Agency or subordinate government body at central government level 1447 30.5%
Ministry at state or regional government level 747 15.7%
Agency or subordinate government body at state or regional government level 476 10.0%
Ministry or other public sector body at other subnational level 438 9.2%
Total 4747
2. Which policy area does your organisation work in? Count Share
General government 510 10.6%
Foreign affairs 179 3.7%
Finance 466 9.7%
Economic affairs 536 11.1%
Infrastructure and transportation 455 9.5%
Defence 125 2.6%
Justice, public order & safety 468 9.7%
Employment services 872 18.1%
Health 760 15.8%
Other social protection and welfare 491 10.2%
Education 419 8.7%
Environmental protection 513 10.7%
Recreation, culture, religion 269 5.6%
COCOPS WP3 Survey Research Report – May 2013 Page 34
3. What is the approximate overall number of employees (in heads, not FTE) in your organisation?
Count Share
< 50 465 9.8%
50-99 398 8.4%
100-499 1560 32.8%
500-999 711 15.0%
1000-5000 811 17.1%
> 5000 809 17.0%
Total 4754
4. What kind of position do you currently hold? Count Share
Top hierarchical level in organisation 1126 25.0%
Second hierarchical level in organisation 1719 38.2%
Third hierarchical level in organisation 1657 36.8%
Total 4502
COCOPS WP3 Survey Research Report – May 2013 Page 35
Part II. Management and Work Practice of Your Organisation
In this section we are interested in how you perceive your job and work experience along a number of dimensions. Please base your answers on your own
experiences with your current job and observations of your current organisation. We want to know ‘how you perceive what is’, not ‘what you think should be’.
5. I mainly understand my role as public sector executive as Strongly
disagree - 1
2 3 4 5 6 Strongly agree - 7
N Mean
Ensuring impartial implementation of laws and rules 2.0% 3.0% 3.5% 7.2% 11.0% 23.3% 49.9% 4711 5.92
Getting public organisations to work together 1.6% 3.0% 6.3% 12.9% 21.5% 25.2% 29.5% 4684 5.43
View themselves as partners in charting the organisation’s direction 4.0% 10.6% 14.7% 21.7% 25.4% 17.8% 5.8% 4460 4.31
15. When thinking about my work and the organisation I work for
Strongly disagree -
1 2 3 4 5 6
Strongly agree - 7
N Mean
I get a sense of satisfaction from my work 1.3% 2.4% 4.1% 8.4% 21.0% 38.4% 24.4% 4491 5.58
I feel valued for the work I do 2.5% 5.1% 7.4% 11.9% 23.1% 32.9% 17.2% 4474 5.15
I regularly feel overloaded or unable to cope 19.8% 25.5% 14.2% 14.2% 11.6% 9.5% 5.2% 4479 3.22
I would recommend it as a good place to work 2.6% 5.0% 7.2% 14.2% 22.4% 29.9% 18.7% 4485 5.13
I really feel as if this organisation's problems are my own 5.5% 9.0% 9.6% 14.7% 19.8% 25.1% 16.3% 4474 4.75
I would be very happy to spend the rest of my career with this organisation 7.8% 9.8% 9.7% 16.8% 15.7% 21.7% 18.5% 4461 4.62
It would be very hard for me to leave my organisation right now, even if I wanted to 10.9% 15.3% 11.7% 16.3% 14.1% 18.3% 13.4% 4453 4.16
I was taught to believe in the value of remaining loyal to one organisation 7.7% 10.0% 7.9% 12.3% 13.7% 25.0% 23.6% 4436 4.83
Things were better when people stayed with one organisation for most of their career 34.2% 24.8% 12.9% 14.6% 5.9% 4.9% 2.7% 4423 2.59
COCOPS WP3 Survey Research Report – May 2013 Page 40
Part II. Public Sector Reform and the Fiscal Crisis
We are now interested in your views on and experiences with administrative reform in your country, and also how the recent fiscal crisis affected the
administration. Some questions are asking you for your personal evaluation of certain phenomena; others are purely interested in your observations. Again,
please draw on your personal experience as a senior executive in the public sector.
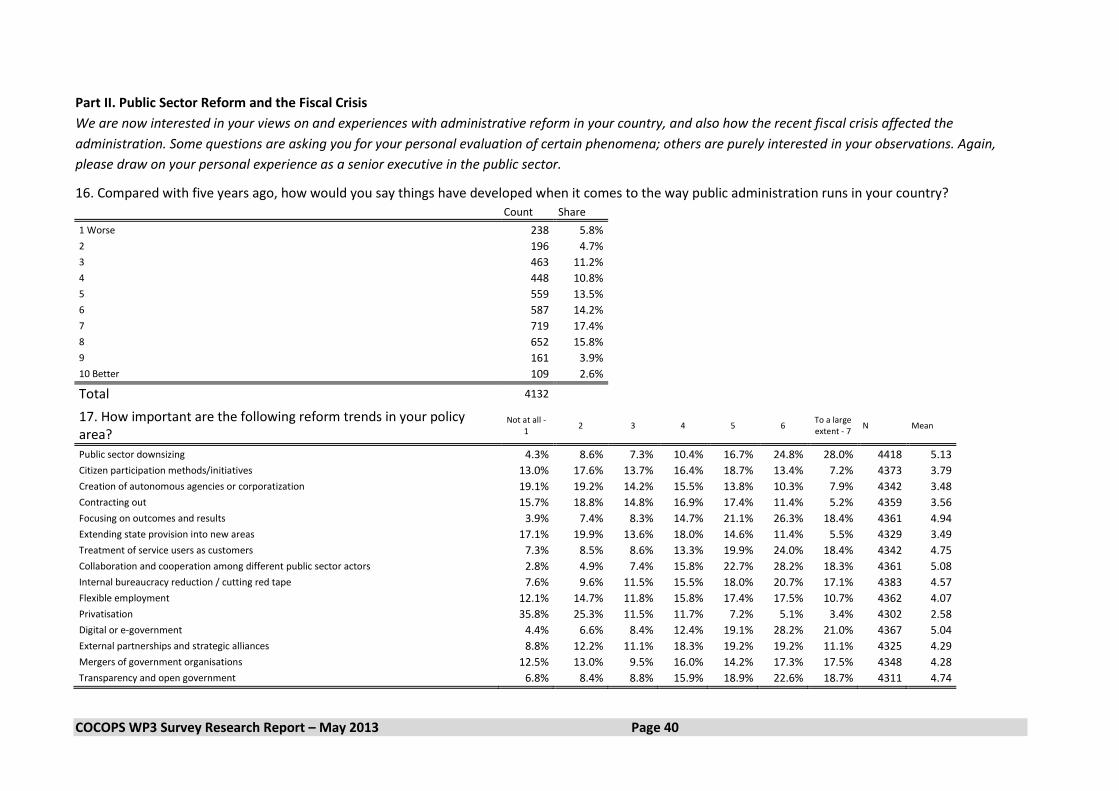
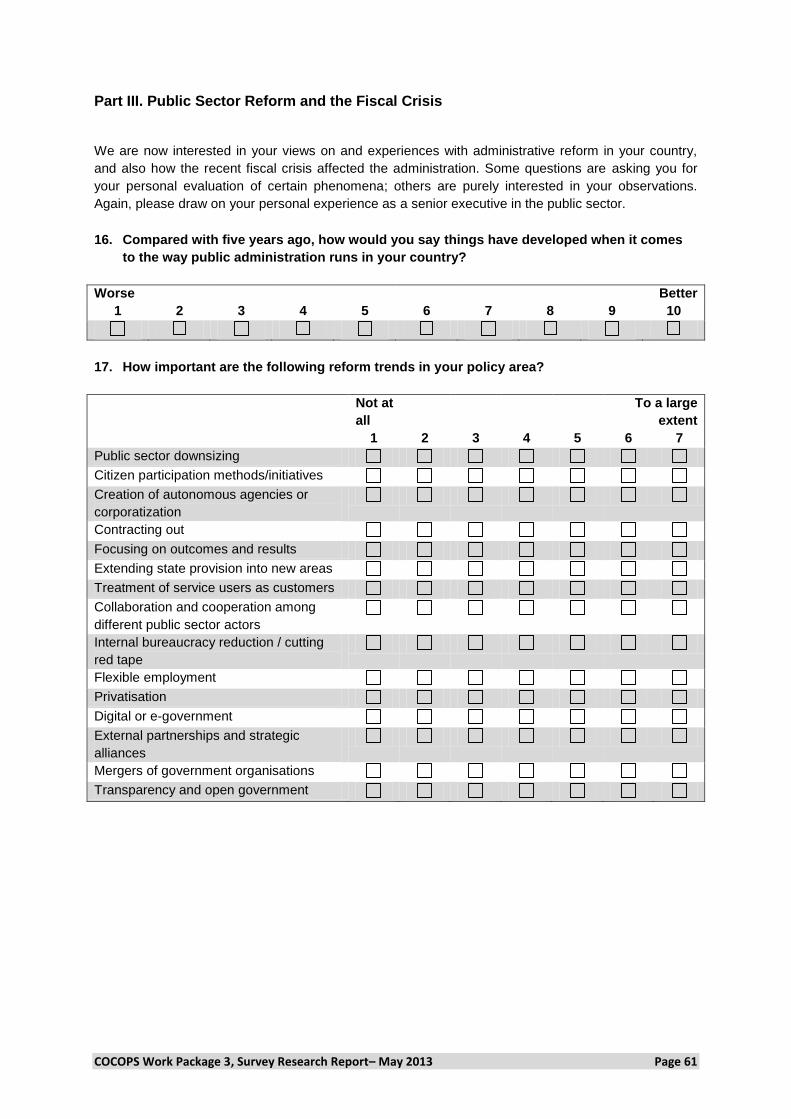
16. Compared with five years ago, how would you say things have developed when it comes to the way public administration runs in your country?
Count Share
1 Worse 238 5.8%
2 196 4.7%
3 463 11.2%
4 448 10.8%
5 559 13.5%
6 587 14.2%
7 719 17.4%
8 652 15.8%
9 161 3.9%
10 Better 109 2.6%
Total 4132
17. How important are the following reform trends in your policy area?
Staff motivation and attitudes towards work 7.2% 13.3% 20.2% 26.4% 22.0% 9.6% 1.3% 4270 3.77
Attractiveness of the public sector as an employer 8.9% 16.7% 19.7% 22.7% 19.4% 10.7% 2.0% 4281 3.67
Citizen trust in government 8.8% 16.8% 22.2% 30.4% 16.2% 4.9% 0.7% 4227 3.46
COCOPS WP3 Survey Research Report – May 2013 Page 42
20. In response to the fiscal crisis, how would you describe the broader approach to realising savings in your policy area (tick one only)
Count Share
Proportional cuts across-the-board over all areas 1294 30.4%
Productivity and efficiency savings 797 18.7% Targeted cuts according to priorities (reducing funding for certain areas, while maintaining it for the prioritized ones)
1725 40.5%
None / no approach required 447 10.5%
Total 4263
21. In response to the fiscal crisis, to what extent has your organisation applied the following cutback measures?
Reducing front line presence 23.9% 19.5% 11.4% 16.9% 13.0% 9.5% 5.8% 3716 3.27
Increased fees and user charges for users 46.9% 14.3% 7.3% 13.1% 9.1% 6.1% 3.2% 3656 2.54
22. As result of the fiscal crisis Strongly
disagree - 1 2 3 4 5 6
Strongly agree - 7 N Mean
The power of the Ministry of Finance has increased 3.4% 4.9% 4.7% 14.1% 20.9% 26.4% 25.6% 3542 5.26
Decision making in my organisation has become more centralized 5.3% 9.3% 8.4% 18.4% 19.7% 22.8% 16.2% 3554 4.71
The unit dealing with budget planning within my organisation has gained power 8.2% 10.7% 10.3% 19.9% 20.0% 19.8% 11.0% 3545 4.36
The conflict between departments has increased 12.6% 17.7% 13.1% 22.2% 17.9% 10.8% 5.7% 3549 3.70 The power of politicians (vs. non-elected public officials) in the decision making process has increased
9.6% 15.8% 12.9% 23.0% 17.2% 13.5% 7.9% 3524 3.95
The relevance of performance information has increased 5.9% 10.0% 10.3% 18.5% 24.1% 20.9% 10.3% 3535 4.49
COCOPS WP3 Survey Research Report – May 2013 Page 43
Part IV. Attitudes, Preferences and Personal Information
In this last section we are interested in some of your work and public sector-related values and views. Please base your answers on your general opinion and
personal values and views, i.e. they should not only relate to your immediate work experience and environment. The section closes with some questions that
provide very important background information for the research.
23. Public services often need to balance different priorities. Where would you place your own position?
COCOPS Work Package 3, Survey Research Report– May 2013 Page 53
RESEARCH BACKGROUND
This questionnaire is central to the project ´Coordinating for Cohesion in the Public Sector of the Future´ (COCOPS), the largest comparative public administration research project in Europe. The survey is being sent to more than 20.000 senior public sector executives in ten European countries and targets top-level decision makers and civil servants in central government and the fields of health and employment. COCOPS aims to explore and understand trends in public administration across Europe and their effects and implications for the public sector and society more generally. The project is funded through the European Commission 7
th Framework Program and carried out
by a team of researchers from eleven universities (for further information see www.cocops.eu). The questionnaire is addressed at senior executives, like yourself, to enquire about personal experiences and opinions on public management, public sector reforms and the impact of the fiscal crisis. It consists of the following four parts:
Part I: General Information
Part II: Management and Work Practice of Your Organisation
Part III: Public Sector Reform and the Fiscal Crisis
Part IV: Attitudes, Preferences, and Personal Information The questionnaire should take you around 30 minutes to complete. Finally, we want to assure you that this survey is STRICTLY ANONYMOUS. Your answers will be treated in COMPLETE CONFIDENCE and findings will be reported at an aggregate level only.
HOW TO COMPLETE THE QUESTIONNAIRE
Most questions ask you to indicate agreement or disagreement along a 7-point scale. To answer these questions please tick the scale point that best matches your experience or opinion. You can fill in the survey in printed paper format, or directly online, by going to [website]. In the case of a printed out questionnaire, please return it via post or fax to: [address] We would like to thank you for participating and would greatly appreciate receiving your answers by [date]. Should you have any questions regarding the survey, please do not hesitate to contact the above named country
coordinator.
Any queries you may have will be treated in strict confidence.