Page 1
1
Cognitive flexibility through metastable neural
dynamics is disrupted by damage to the structural
connectome
Abbreviated title: The connectome, metastability and cognitive flexibility
Author names and affiliations: Peter J. Hellyer 1,2 *, Gregory Scott 1 *, Murray
Shanahan 3, David J. Sharp 1, Robert Leech 1
* These authors contributed equally to the work presented in this report.
1. Computational, Cognitive, and Clinical Neuroimaging Laboratory, Division of
Brain Sciences, Faculty of Medicine, Imperial College London, Hammersmith
Hospital Campus, Du Cane Road, London, W12 0NN, UK
2. Centre for Neuroimaging Sciences, Institute of Psychiatry, Psychology and
Neuroscience, King’s College London.
3. Department of Computing, Imperial College London, 180 Queen’s Gate,
London, SW7 2RH, UK
Corresponding author: Robert Leech, Computational, Cognitive and Clinical
Neuroimaging Laboratory, 3rd Floor, Burlington Danes, Hammersmith Hospital, Du
Cane Road, London W12 0NN, UK. E-mail: [email protected] . Tel: +44 (0)207
594 7994
Number of pages: 47
Number of figures: 9,
Number of words: Abstract: 152 Introduction: 650 Discussion: 1,500
Conflict of Interest: The authors declare no competing financial interests.
Page 2
2
Acknowledgements: PJH was supported by a Medical Research Council Doctoral
Training Award. GS was supported by a clinical research fellowship awarded in the
Wellcome Trust-GlaxoSmithKline Translational Medicine Training Programme. We
would like to thank Frantisek Vasa for useful conversations on comparing simulated
and empirical networks, as well as thanking the participants who were involved in this
research.
Page 3
3
Abstract
Current theory proposes that healthy neural dynamics operate in a metastable
regime, where brain regions interact to simultaneously maximise integration and
segregation. Metastability may confer important behavioural properties, such as
cognitive flexibility. It is increasingly recognised that neural dynamics are constrained
by the underlying structural connections between brain regions. An important
challenge is, therefore, to relate structural connectivity, neural dynamics and
behaviour. Traumatic brain injury (TBI) is a pre-eminent structural disconnection
disorder, whereby traumatic axonal injury damages large-scale connectivity,
producing characteristic cognitive impairments, including slowed information
processing speed and reduced cognitive flexibility, that may be a result of disrupted
metastable dynamics. Therefore, TBI provides an experimental and theoretical model
to examine how metastable dynamics relate to structural connectivity and cognition.
Here, we use complimentary empirical and computational approaches to investigate
how metastability arises from the healthy structural connectome and relates to
cognitive performance. We found reduced metastability in large-scale neural
dynamics after TBI, measured with resting-state functional MRI. This reduction in
metastability was associated with damage to the connectome, measured using
diffusion MRI. Furthermore, decreased metastability was associated with reduced
cognitive flexibility and information processing. A computational model, defined by
empirically-derived connectivity data, demonstrates how behaviourally-relevant
changes in neural dynamics result from structural disconnection. Our findings
suggest how metastable dynamics are important for normal brain function and
contingent on the structure of the human connectome.
Page 4
4
Introduction
To understand how cognitive-emotional functions emerge from the brain and are
affected by disease requires an account of how neural ensembles act in concert to
generate behaviour (Uhlhaas and Singer, 2006; Deco et al., 2008; Chialvo, 2010;
Tognoli and Kelso, 2014). One approach is to consider the brain as a complex
system (Friston, 1997; Chialvo, 2010). In this framework, current theory suggests an
essential property of neural activity is metastability, a dynamical regime in which
neural ensembles are able to coordinate rapidly, flexibly engaging and disengaging
without becoming locked into fixed interactions (Friston, 1997; Shanahan, 2010;
Tognoli and Kelso, 2014). Metastability is thought to confer optimal information
processing capabilities, flexible behaviour and memory (Werner, 2007; Deco et al.,
2009a; Shanahan, 2010). However, there is little empirical evidence to support this
hypothesis. We have previously shown, with both empirical and computational
approaches that metastability at rest is higher than during a focused cognitive task
(Hellyer et al., 2014). During a task, high metastability may be undesirable, where
instead a specific configuration of brain systems is maintained over time (e.g., in
coordinating specific visual and motor systems to perform a visually cued motor
task).
Theoretical studies demonstrate that the emergence of metastable dynamics is
contingent on the coupling between modules of a dynamical system (Friston, 1997;
Strogatz, 2001; Shanahan, 2010; Cabral et al., 2011). In particular, dynamic patterns
of functional connectivity, consistent with metastable dynamics, emerge when
coupling has “small-world” topology with short average path lengths and high
clustering (Wildie and Shanahan, 2012) of modules. Recently, networks of
anatomical connections have been incorporated within computational simulations of
large-scale neural dynamics, suggesting metastable dynamics provide a link between
Page 5
5
structural and functional connectivity (Deco et al., 2009b; Honey et al., 2009; Cabral
et al., 2011; Hellyer et al., 2014).
The disruption of neural dynamics is thought to be important in brain disorders
(Uhlhaas and Singer, 2006), likely caused by abnormal structural connectivity
(Friston, 2002; Bassett and Bullmore, 2006; Cabral et al., 2012; Sharp et al., 2014).
Indeed, through the examination of brain disorders, we are able to explore the
importance of structural connectivity for the organisation of functional connectivity. A
large body of work has examined the link between focal damage to the brain, such as
in ischemic stroke, and cognition (Bird et al., 2004; Sharp et al., 2010a; Gratton et al.,
2012; Warren et al., 2014). However, structural disconnection is often intermingled
with gray matter damage (Sharp et al., 2011; Bonnelle et al., 2012). In contrast,
traumatic brain injury (TBI) frequently results in diffuse axonal injury (DAI), which
disrupts long-distance white matter tracts connecting brain regions (Sharp et al.,
2011; Johnson et al., 2013b; Johnson et al., 2013a) but with neuronal bodies
relatively spared. As such, it is a preeminent example of a white matter disconnection
disorder (Sharp et al., 2014). Damage to white matter connectivity in TBI alters the
spatiotemporal properties of functional brain networks (Kinnunen et al., 2011; Hellyer
et al., 2013; Caeyenberghs et al., 2014; Jilka et al., 2014), resulting in long-term
cognitive problems, including impairments in cognitive flexibility, memory and
information processing speed (Bonnelle et al., 2011; Kinnunen et al., 2011; Jilka et
al., 2014). Cognitive inflexibility after TBI may be observed as poor performance on
tests of task switching (Kinnunen et al., 2011; Hellyer et al., 2013; Caeyenberghs et
al., 2014; Jilka et al., 2014). Extreme inflexibility may manifest as perseveration, the
repetition of a particular response, such as a phrase or gesture, despite the cessation
of a stimulus. Therefore, TBI provides an ideal paradigm to examine how three
Page 6
6
important levels of description – structure, functional dynamics and behaviour –
converge.
Here, using empirical and computational approaches, we investigate how
metastability, defined as the standard deviation of the Kuramoto order parameter (as
in (Shanahan, 2010; Cabral et al., 2011)), arises from the structural connectome and
relates to behaviour. We test whether: (i) structural disconnection following TBI
(measured using diffusion tensor imaging) is associated with reduced metastability
(measured using resting-state fMRI); (ii) metastability is associated with behavioural
measures of cognitive flexibility, memory and information processing. Furthermore,
we use computational simulations to investigate the consequences of structural
disconnection on large-scale neural dynamics, to demonstrate how disconnection
following TBI results in altered metastability.
Page 7
7
Materials and Methods
Overview
Our experimental approach is split into three different sections, described in detail
below. An overview of the Methods is provided in Figures 1 and 2. In brief, firstly, we
use resting state functional MRI (fMRI) to estimate empirical measures of
metastability in healthy control subjects and in the presence of structural
disconnection in TBI patients (Figure 1A&C). Secondly, we use a diffusion tensor
imaging (DTI) approach to estimate both voxelwise (FA) and region of interest (ROI)
level connectivity for each subject (Figure 2). Finally, we employ a range of both
computational (using the Kuramoto model of phase oscillators) and empirical imaging
based approaches, to describe the relationship between structural connectivity,
metastability and neuropsychological performance (Figure 1C)
Image acquisition
Standard protocols were used to acquire functional, structural and diffusion tensor
MRI data using a Phillips Intera 3.0 Tesla MRI scanner, with an 8-array head coil,
and sensitivity encoding (SENSE) with an under sampling factor of 2. For each
participant, diffusion-weighted volumes with gradients applied in 64 non-collinear
directions were collected. The following parameters were used: 73 contiguous slices,
slice thickness=2mm, field of view 224mm, matrix 128×128 (voxel
size=1.75×1.75×2mm3), b value=1000 and four images with no diffusion weighting
(b=0s/mm2). Earplugs and padded headphones were used to protect participants’
hearing during the scanning procedure. We additionally collected a standard high-
resolution T1 image for segmentation and image co-registration. During the resting
state fMRI scan, subjects were asked to keep their eyes closed and to try not to fall
asleep. Functional volumes were collected using a T2*-weighted gradient-echo-
Page 8
8
planar imaging sequence with whole-brain coverage (repetition time/echo time,
2,000/30 ms; 31 ascending slices with thickness 3.25 mm, gap 0.75 mm, voxel size
2.5×2.5×5mm, flip angle 90°, field of view 280×220×123 mm, matrix 112×87).
Quadratic shim gradients were used to correct for magnetic field inhomogeneities
within the brain.
Participants
63 traumatic brain injury (TBI) patients (16 female, mean age ± SD: 37.4±12.37
years) and 26 healthy control subjects (12 female, mean age ± SD: 35.96±17.61
years) were scanned using standard functional and structural MRI protocols (see
below). The patients and controls overlapped with those used in Fagerholm et al (in
press, Brain), where group demographics are reported in more detail. At the group
level, patients and controls were matched for age (t87=-0.47, p=0.64) and gender. We
did not hypothesise that there would be any effects of handedness, and so did not
select subjects according to handedness. TBI patients were scanned in the chronic
phase, 5.48±3.33 (months ±SD) post injury. Injury severity of TBI patients was
classified according to the Mayo system (Malec et al., 2007): “Moderate-severe” (55
patients); “Mild (probable)” (5); and “Symptomatic (possible)” (3). 49 patients had a
clinically relevant episode of post-traumatic amnesia (PTA) following TBI. Where the
mechanism of injury was known, the mechanism was: road traffic accident (21
patients); assault (17); fall/syncope (15); sports injury/concussion (2); unknown (8).
All participants gave written consent, were checked for contraindications to MRI
scanning and had no history of significant neurological or psychiatric illness prior to
TBI. The Hammersmith, Queen Charlotte’s and Chelsea research ethics committee
awarded ethical approval for the study.
Page 9
9
Neuropsychological assessment
All but one patient (62, mean age ± SD: 37.53±12.45 years) performed a paper and
pencil, neuropsychological test battery. Our analysis focused on cognitive measures
shown previously to be sensitive to impairments following TBI: Associative memory
(AM), using the immediate recall and retention measure of the People Test from the
Doors and People Test (Baddeley, 1986, 1992; Baddeley et al., 1994) and Executive
function (EF), using the Trail Making Test alternating switch-cost index (Reitan,
1958). In addition, a subset of 49 patients also completed the computerised Choice
Reaction Time (CRT) task that assesses speed of processing (Rabbitt, 1966; Logan
et al., 1984). It was for technical reasons, for example, relating to equipment error,
that not all subjects completed all three neuropsychological tests.
Neuropsychological assessment was performed immediately prior to the MRI
scanning session by a trained experimenter; scoring for each test was performed
according to the protocols provided by the original publisher of each test and no
further selection based on neuropsychological outcome was performed. We present
all collected data for each of these groups (i.e., no statistical subsampling on the
basis of performance on any individual test has been performed).
Analysis of functional imaging data (Figure 1A)
Pre-processing of functional data was performed according to standard analysis
approaches: briefly, this included realignment of EPI images to remove the coarse
effects of motion between scans using FMRIB’s Motion correction tool MCFLIRT
(Smith et al., 2004). T1 images for each subject were segmented into 164 cortical
and subcortical regions using the Destreux Freesurfer atlas (Fischl et al., 2004). The
segmented T1 images were registered to the motion corrected data using boundary-
based registration (Greve and Fischl, 2009). Subsequently, mean BOLD time series
for each region of interest (ROI) were extracted from the resting state scans. We
Page 10
10
band-pass filtered the data between 0.01 and 0.2 Hz to remove sources of non-
neural noise and focus on slow modulations in BOLD, that have previously been
associated with intrinsic connectivity networks (Niazy et al., 2011). Such band-pass
filtering is an important step in transforming raw time series into phase space (see
below). To account for variance related to head motion or non-neural physiological
noise, during pre-processing we regressed out from the time course for each of the
164 ROIs, the six motion parameter time courses estimated by MCFLIRT (Smith et
al., 2004), the motion parameters squared as well as time series sampled from
regions of white-matter and cerebrospinal fluid. To further reduce the possibility that
effects are driven by head motion we controlled for motion at the group level, (i.e.
across subjects) by including the estimate of mean framewise displacement in
higher-level analyses as a regressor of no interest.
To facilitate comparison of measures of metastability and synchrony between the
computational model and empirical data, we transformed the empirical data into a
complex phase representation, so the same analysis can be applied to both the
empirical and computational simulation data. The transformation of functional
neuroimaging data into phase representation for analysis has been previously
performed using a variety of different approaches such as wavelet analysis
(Kitzbichler et al., 2009; Chang and Glover, 2010), as well as the computationally
simpler Hilbert transform on bandpass filtered data (Glerean et al., 2012). For
simplicity, we perform the latter on each of the bandpass filtered 164 ROI time series
from the empirical data, resulting in 164 phase time series. Measures of network
dynamics were either calculated on all regions simultaneously (global) or within
specific predefined intrinsic connectivity networks (local).
Page 11
11
Definition of intrinsic connectivity networks from functional imaging data
We defined a set of intrinsic connectivity networks (ICNs) from the resting state fMRI
data, to allow us to optimise the computational model and to define networks from
which to sample neural dynamics. To do this, we performed temporal concatenation
independent component analysis (ICA) on each of the 164 ROI mean BOLD time-
series for an independent group of 10 healthy control subjects, using FSL MELODIC
(Beckmann et al., 2005). The optimal decomposition estimated during Fast ICA
resulted in the identification of 15 independent networks. These ICNs were used to
tune the computational model (see below). Resulting components were thresholded
at z>2.3, and surviving brain regions were included in that network. Each of these
networks were then labelled by eye based on their resemblance to the canonical
ICNs produced by (Smith et al., 2009). This resulted in the identification of seven
canonical ICNs which were used in subsequent analyses (Visual, Auditory, Default
Mode, Dorsal Attention, Salience and both Left and Right fronto-parietal control
networks - Figure 3). These networks were used to sample metastability for both the
empirical and simulated data.
Estimation of healthy structural connectivity network (Figure 2A)
The mean location and probability of structural connections was estimated in a
further group of 10 independent healthy control subjects (Figure 2A). Structural T1
images were segmented into white matter and the same 164 cortical and subcortical
gray matter ROIs as used to sample the fMRI data, using Freesurfer (Greve & Fischl,
2009). This produced a mask for each region in each participant’s T1 native space.
Diffusion imaging data was reconstructed using the FSL diffusion toolkit using
standard protocols (Behrens et al., 2003b). We further modelled the probability
distribution of fibre direction within each voxel in order to account for crossing fibres
(Behrens et al., 2003a). Non-linear registration was used to calculate a warp-field
Page 12
12
between conformed Freesurfer space and the DTI b0 image, using the FSL non-
linear Image registration tool (Smith et al., 2004). The warp-field was then applied to
masks for white matter and each of the 164 cortical and subcortical ROIs using
nearest-neighbour interpolation. Individual gray matter masks were dilated by a
single voxel and multiplied by the white matter mask, in order to generate ROIs to be
used as seeds and targets for tractography at the boundary between white and gray
matter surfaces (Gong et al., 2009).
Probabilistic tractography, using 5000 random streamline samples per voxel was
used to estimate the connectivity matrix 𝐶 between each of the 164 other regions
alongside a spatial distribution of connective fibres between each region. The
probability of connections between two regions 𝐶(!,!) was defined as the proportion
of all fibres sent from region 𝑖 which successfully reached region 𝑗. As probabilistic
tractography cannot determine directionality of connections between cortical regions
and the size of seed and target ROIs may differ for each connection, we define
𝐶(!,!)as the mean of the forward and reverse connections between regions, i.e.
.𝐶(!,!) =!!(𝐶 !,! + 𝐶 !,! ). To minimise the number of false positive connections, a
thresholding approach was used to generate a binary matrix that retained
connections with a consistent probability across all subjects from the tractography
group (Gong et al., 2009). This resulted in a connectivity matrix with a density of
26%. This is comparable with previously published datasets such as (Hagmann et
al., 2008) – 26% and (van den Heuvel and Sporns, 2011) 14-21%. The relationship
between the number of streamlines and the underlying information propagating
properties of the tracts is unclear and this is likely to be a particular problem for long-
distance connections (Gigandet et al., 2008; Jones, 2010b, a). For this reason, we
binarized our reference connectivity dataset. The length matrix (i.e., the length of
tracts between pairs of regions) was estimated using the Euclidean distance between
Page 13
13
the centres of gravity of each individual ROI in standard MNI152 space. Euclidean
distance is inexact, since tracts are not likely to follow the shortest distance between
regions, but it is a good first approximation of the distances and has been used
extensively in a range of similar computational modelling approaches (Deco et al.,
2008; Deco et al., 2009b; Cabral et al., 2011).
Estimation of individual structural connectivity (Figure 2B)
Global and focal reductions of fractional anisotropy (FA) in TBI patients have been
shown to bias tractography estimation in TBI patients (Squarcina et al., 2012),
potentially resulting in spurious differences including false increases in structural
connections following injury. This previous work suggested that sampling FA along a
known tract distribution estimated from an independent group of healthy control
subjects is preferable to estimating tracts from TBI patients themselves. Therefore,
we sampled FA projected through a set of tracts linking the 164 regions, defined on
the independent group of 10 healthy controls. First, we used Tract-Based Spatial
Statistics (TBSS) (Smith et al., 2006) to align the FA map of each patient and control
subject to a common template. In order to reduce partial volume effects, these tracts
were then skeletonized, resulting in a voxel-wise map of the white matter skeleton for
each subject (Figure 4).
We used random permutation testing (Nichols and Holmes, 2002; Smith et al., 2004;
Winkler et al., 2014) to assess whether there was reduced FA in patients compared
to controls (Kinnunen et al., 2011; Hellyer et al., 2013). We fitted a general linear
model for each voxel within the skeleton. Whilst this approach gives a good overview
of spatial distribution of damage, we further wished to estimate integrity of individual
pre-defined ‘tracts’ for each patient and control, to define a structural connectivity
matrix. Therefore, mean FA values were calculated from masks generated at the
Page 14
14
intersection of voxels of the skeletonised map and each tract region of interest (as
defined using tractography on independent controls, see the previous section). This
resulted in a ‘tract integrity’ FA matrix for each patient and control (Figure 2C). In
order to define ‘damage’ to tracts, rather than use an arbitrary threshold of these
matrices (which is likely to remove valid tracts in both the patient and control
population with naturally low FA, due to factors such as crossing fibres), we
determined the tracts within which damage is likely, by estimating the normal
distribution (mean and standard deviation) of FA values for each connection within
the independent group of healthy controls (used to define the tractography). This
information was then used to z-transform the FA values for each tract within each
individual subject in the patient and control group. To simulate damage to the
connectivity matrix 𝐶 , if any edge from the scaled FA matrix for an individual fell
below a certain threshold (-1.6SD, which represents the position within the normal
Gaussian distribution, where an individual event is distinct from noise with a nominal
probability of approximately p<0.05) it was ‘lesioned’. Rather than removing the tract
(which is overly destructive given the nature of the traumatic axonal injury, where the
tract typically remains but shows evidence of damage) we instead reduced
connectivity by a fixed amount (Figure 2C). This has the effect that each connectivity
matrix has the same number of connections, while capturing any pattern of damage.
Results reported are for a reduction of 50%, but the results were robust to a range of
different damage values.
Page 15
15
Graph theoretic metrics for structural connectivity
In order to define changes in structural connectivity in relation to changes in
neural dynamics, we assessed large scale structural connectivity using measures
from graph theory, calculated using the Brain Connectivity Toolbox (Rubinov and
Sporns, 2010). These measures are described briefly below:
Degree (D).
𝐷! = 𝐶!,!
!
!!!
The degree of each node 𝐷! within a weighted graph C , is defined as the sum of all
directly connected edges to the node within the network. The mean degree defines
how strongly interconnected all nodes within the network are (Freeman, 1978).
Characteristic path length (𝑳)
𝐿! = 𝐷(𝑣,𝑤)!!!
𝑉(𝐶) − 1
Path length (𝐿!) is the average distance of an individual vertex to all its connected
neighbours (𝑣 ∈ 𝑉(𝐶)) in a network C , weighted by the inverse of the weight of
connectivity ( 𝐷 ) i.e. higher weight connections are interpreted as a shorter
connection length. The mean of this value across all nodes (𝐿) is the measure of
characteristic path length within a network (Watts and Strogatz, 1998).
Clustering coefficient (𝑲)
𝐾! =2𝑒!
𝑘!(𝑘! − 1)
The weighted clustering coefficient of a node (𝐾!) is the average connectivity strength
of all "triangles", i.e. all neighbours (𝑒!) which also directly connect to each other as
Page 16
16
pairs (𝑘!) around a specific node (i). The mean across nodes (𝐾) is used as a
measure of network clustering (Watts and Strogatz, 1998).
Small-worldness (𝝈)
𝜎 = 𝐾.𝐾!!
𝐿. 𝐿!!
Small-world networks have low characteristic path length and high clustering
coefficient. An often applied metric of 'small-worldness' is the small world index (𝜎 -
SWI), (Sporns, 2006; Humphries and Gurney, 2008). This compares the path length
(L) and clustering coefficient (K) to equivalent measures of a suitable Erdös-Rényi
random network (Humphries and Gurney, 2008) (𝐾 and 𝐿 repectively). If 𝜎 > 1, a
network is considered small-world.
Differences in 𝜎, and 𝐾 may be artifactually driven by reduction in the mean degree
of individual networks. In order to correct for this potential source of estimation error,
we controlled for variation of mean degree across each subject’s structural
connectivity graph by normalising the mean degree of each graph (i.e. dividing C by
the mean of connected vertices in 𝐷 ) before calculating 𝜎 , and 𝐾 . In this way,
changes in each of these measures will be driven by altered network topology, rather
than simply global changes in connectivity strength.
Computational simulation of neural dynamics (Figure 1B)
In order to explore the effect of structural disconnection on neural dynamics, we used
the simple Kuramoto model of coupled phase oscillators (Acebrón et al., 2005). We
chose this model, partly as it has been shown to be able to simulate macroscopic
neural dynamics related to underlying structural connectivity (Shanahan, 2010;
Cabral et al., 2011; Hellyer et al., 2014; Messe et al., 2014). It has also been shown
to capture the same essential aspects of macroscopic dynamics as far more complex
Page 17
17
models based on tens of thousands of simulated neurons (Bhowmik and Shanahan,
2013). Compared to such complex and computationally far more intensive models,
the Kuramoto model provides a good trade off between complexity and plausibility,
modelling a few key parameters of structural and functional relationships between
nodes. By using the less computationally intensive Kuramoto model we were able to
explore large parameter spaces and simulate many individual subjects’ dynamics.
The activity of each of the 164 brain regions (which we define here as a node) is
represented in our model by the phase of a Kuramoto oscillator. The phase of each
node over time is described by the Kuramoto equation (Kuramoto, 1984; Acebrón et
al., 2005):
dθ!dt
= ω! + 1
N + 1 C!,! sin(!
!!!
θ ! (t − D!,!) − θ!(t)) N = 164
The natural frequency ω defines the phase change of an un-coupled node per time-
step. In our simulations, as in previous work (Cabral et al., 2011), we fixed the natural
frequency to match known oscillations within the gamma frequency range (ω =
60Hz). The connectivity matrix C is a binary connectivity matrix determined by the
empirical strength of white matter connections, or lesioned using individual tract
integrity data (see above). The distance matrix D , determined by the empirical
length of connections between regions, imposes time delay on phase interactions
between nodes. This is analogous to the simulation of a delay caused by neural
conduction between regions of the brain.
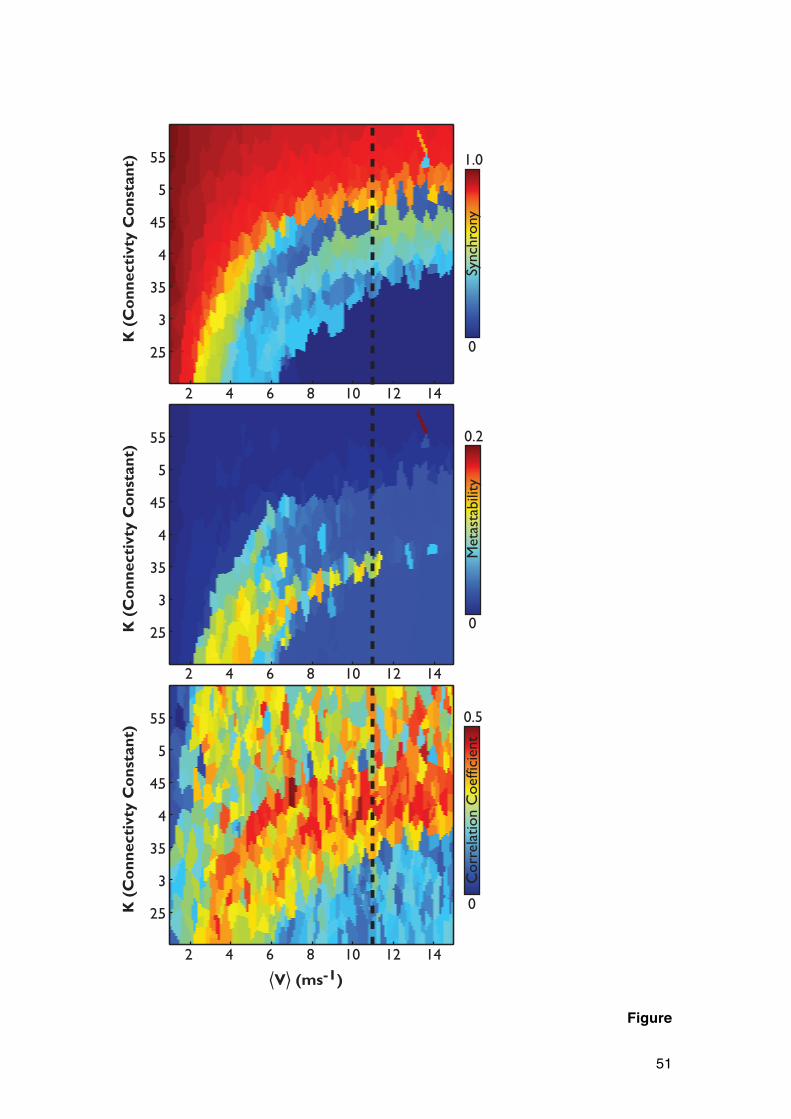
We introduce two control parameters to the coupling and delay of the network; the
global coupling parameter (k), and mean global velocity v , such that 𝐶 = 𝑘 𝐶 and
𝐷 = 𝐷 /𝑣. The behavior of the Kuramoto model in terms of global metastability and
synchrony, by modulation of the parameters 𝑘 and 𝑣, has been explored previously
(Shanahan, 2010; Cabral et al., 2011). For completeness, we also present a traversal
Page 18
18
of this parameter space (Figure 8), using the baseline binary connectivity dataset
defined using 10 healthy controls (see: ‘Estimation of healthy structural connectivity
network’ above). The presence of multiple local maxima of both metastability and
synchrony within the 𝑘, 𝑣 plane makes it challenging to optimise though a gradient-
descent approach. Therefore, we randomly selected 6000 pairs of model parameters
within the 𝑘, 𝑣 plane and executed the model for each pair. We then used nearest
neighbour interpolation to create the parameter space 𝑘, 𝑣 presented in Figure 8.
Validation of computational simulation
To validate the computational simulation against empirical functional connectivity
derived from fMRI BOLD data, we followed the approach to simulating BOLD activity
previously demonstrated in the literature (e.g.,(Cabral et al., 2011)), using the sine of
the high-frequency activity of the Kuramoto model as the neural input to the Balloon-
Windkessel haemodynamic model (Friston et al., 2000), low-pass filtered the
resulting time courses at <0.25 Hz, and downsampling to a 2 second sampling rate.
Unlike previous approaches to model validation that have assumed that the spatio-
temporal organisation of correlations within empirical fMRI BOLD time courses are
univariate, we used an ICA approach to compare empirical BOLD activity (defined
using the ICA decomposition described above) with the output of our computational
models. Simulated BOLD time-courses from each of the computational models were
decomposed into 15 spatially independent time-courses. Spatial components from
the empirical and modelled ICAs were then ‘matched’ using spatial correlation of their
maps. Since the order of components extracted by MELODIC varies, we determined
maximal correspondence between empirical and model components by calculating
the pair-wise spatial correlation between functional connectivity maps for all pairs of
components and reordering the resulting correlation matrix so as to maximize entries
along the diagonal. An evaluation function was defined as the mean correlation
Page 19
19
between the empirical spatial maps and the modeled spatial maps for the top n (here
n=5) matched components in the computational model compared to the empirical
data, providing an objective measure by which the fit of individual regions of the
global parameter space to empirical data may be compared against one another
(Figure 8). We present the results for ICA using 15 components in both empirical and
modelled data, and n = 5; however, varying each of these parameters produced
qualitatively similar results.
Synchrony and metastability measures of neural dynamics (Figure 1C)
The order parameters R t and Φ t can be jointly defined by:
R t e!! ! =1N
e!!!(!)!
!!!
Where N is the total number of regions within the network and the level of synchrony
between phase time courses is described by R t , in terms of how coherently phase
changes over time (Shanahan, 2010; Cabral et al., 2011). During fully synchronous
behaviour R t = 1; whereas R t = 0 where phase across all phase time series is
fully asynchronous. The phase of all the input phase time series is described by Φ t
but is not used in the present work. For both empirical and simulated timeseries, we
measured neural dynamics in terms of mean global synchrony (R) , and global
metastability as the standard deviation σ! of global synchrony across the same
period (Shanahan, 2010; Cabral et al., 2011). In addition to global measures of
dynamics, to evaluate measures of network dynamics in both the empirical and
simulated data, we calculated separate mean synchrony and metastability measures
for the phase timeseries of regions within the 7 empirical ICNs defined earlier (See
‘Definition of intrinsic connectivity networks from functional imaging data’)
Page 20
20
Results
Widespread disruption to the structural connectome after traumatic brain
injury
To demonstrate that white matter connectivity is disrupted following traumatic brain
injury (TBI) in the group of patients studied, we performed standard tract-based
spatial statistics (TBSS) to compare white matter integrity, measured by fractional
anisotropy (FA), between patients and healthy controls, using age and total gray
matter volume as covariates of no interest. In the between-group contrast of Patients
< Controls, there was widespread reduction in FA across the white matter skeleton
(Figure 4A). FA reduction was particularly pronounced in the inter-hemispheric fibres
of the corpus callosum (where damage was widespread, but most extensive in the
body and genu), as well as tracts within the superior longitudinal fasiculus,
corticospinal tract, and the anterior and posterior limbs of the internal capsule.
Additionally, a strong reduction of FA was observed within the fornix and corona
radiata. This distribution of widespread changes to white matter integrity is typical of
injury following TBI and is consistent with our previous TBSS-based findings
(Kinnunen et al., 2011).
To explore how network level measures of structural connectivity are changed
following TBI, we tested for group-wise differences between graph theoretical
measures of large-scale structural connectivity between healthy controls and TBI
patients using age as a covariate of no interest. There was a significant reduction in
patients compared to controls in small-worldness (t86=-3.10, p<0.01), clustering
coefficient (t86=-2.04, p<0.05) and mean degree (t86=-3.42, p<0.001). In addition,
patients had a significantly higher characteristic path length compared to healthy
controls (t86=3.07, p<0.01).
Page 21
21
Empirical measures of metastability of large-scale neural dynamics are
reduced following traumatic brain injury
We assessed the metastability of large-scale neural dynamics following TBI,
measured using 164 regional phase time courses derived from resting-state fMRI
BOLD data in both patients and controls (Figure 1A). We compared metastability
across the whole brain and within ICNs between patients and controls, including age,
gray matter volume and mean absolute movement as covariates of no interest.
Global metastability was significantly reduced in TBI patients compared to controls
(t84=-2.63, p<0.05 1-tailed), Figure 5. Patients also showed lower metastability in the
salience network (t84 = -3.68 p<0.001), a left fronto-parietal network (t84 = -2.41,
p<0.02) and dorsal attention network (t84 = -2.27, p<0.05); these survive multiple
comparison correction by FDR (q<0.1). A potential confound for measuring
widespread neural dynamics in the TBI patient population is the presence of cortical
contusions. Thirty-two patients in the TBI group were found to have focal gray matter
lesions, suggestive of cortical contusions, on T1-weighted structural imaging. It is
possible that these lesions affected the BOLD time courses extracted and the
resulting metastability calculations. We therefore repeated the calculation of global
metastability after removing brain regions whose anatomical segmentation
overlapped with focal lesions in any patients (Figure 4B) (i.e., time courses from
affected regions were not analysed in any patients or controls). Reduction in global
metastability in TBI patients compared to controls following this adjustment was
similar to the original analysis (t84=-2.63 p<0.01).
To establish whether the differences we report were due to changes in metastability
(i.e., temporal variability in how synchronous the brain is) rather than simple temporal
variability in the BOLD signal, we performed a follow up analysis. We calculated the
standard deviation of: a) the mean BOLD signal across all 164 regions; and b) the
Page 22
22
mean BOLD signal of each region. In a GLM using age, gray matter volume and
mean absolute displacement as covariates of no interest, we found no group-wise
effect in the standard deviation of the mean global BOLD signal (t84=0.22 p=0.82).
For each of the 164 regions, no single region showed a significant effect of group
(FDR correcting for multiple comparisons; even without correcting for multiple
comparisons only four regions had a group-wise effect with p lower than 0.05 with the
lowest value p=0.04).
Empirical measures of metastability after traumatic brain injury predict
cognitive performance
To investigate whether empirical measures of global metastability relate to the
cognitive impairments seen in the TBI population, we regressed measures of
metastability against measures of cognitive flexibility, associative memory, and
information processing speed, including age and mean absolute movement during
the fMRI run as covariates of no interest. In patients, there was a significant negative
relationship between global metastability and switch cost index (SCI, where higher
SCI suggests poorer flexibility) (t58=-2.21, p<0.05, Figure 6 Top) and median reaction
time (t44=-3.46, p<0.01, Figure 6 Middle). Global metastability was positively related
to immediate memory recall, i.e. improved performance (t58=2.49, p<0.05, Figure 6
Bottom), and retention (t58=2.780, p<0.01, Figure 6 Bottom). These results were from
a multiple regression model containing age, motion and total gray matter volume as
covariates of no interest. The results survive multiple comparison correction with
FDR (q<0.1).
Frontal disconnection following TBI predicts global measures of empirical
metastability
Page 23
23
We explored how regional structural disconnection may relate to metastability. We
calculated the mean FA across the whole white matter skeleton and compared it with
global metastability, in patients and controls, with age as a covariate of no interest.
We observed a significant main effect of group (t84=-2.12, p<0.05) and interaction
between group and FA (t84=2.04, p<0.05). We further explored this relationship at a
regional level, performing a voxelwise regression of metastability on FA within both
groups separately. In healthy control subjects, no region of the white matter skeleton
was significantly associated with global metastability. Within the patient group, there
was a significant association between global metastability and integrity of the white
matter skeleton, predominantly within the white matter linking the frontal lobe with the
thalamus through the anterior thalamic radiation (Figure 7). However, when the two
groups were compared directly, there were no voxels surviving multiple comparison
correction for a group by FA interaction, so these group differences should be treated
with some caution.
A computational simulation of macroscopic neural dynamics resembles
empirically-defined intrinsic connectivity networks
In order to explore how measures of metastable neural dynamics responds to
structural disconnection (i.e. after TBI), we explored a computational simulation of the
brain at rest using the Kuramoto model, constrained by the white matter structural
connectivity between 164 brain regions, defined using white matter tractography. We
validated the model by comparison with resting-state functional connectivity derived
from fMRI BOLD.
Previous work has explored the dynamics of the Kuramoto model in relation to the
strength and structure of coupling between nodes (Shanahan, 2010; Cabral et al.,
2011; Cabral et al., 2012; Wildie and Shanahan, 2012). This work suggests that the
model behaviour is highly sensitive to two constants, the global coupling parameter
Page 24
24
(K) and mean global velocity V , which is determined by a distance matrix D . In
order to understand the effects of these constants on our 164 node model, using
coupling defined by the reference binary reference connectivity matrix (see:
‘Estimation of healthy structural connectivity network’), we performed a parameter
space search using 6000 randomly generated pairs of parameters 𝑘, 𝑣 , within the
plane 𝑘(!…!) and 𝑉(!…!"). The behaviour of global metastability as well as mean
global synchrony of the system as a function of K is shown in (Figure 8). We
observed that for increasing values of K, the system tends towards maximum global
synchrony, after passing through an intermediate phase where metastability is
maximal. To reduce the complexity of further computations, we selected a point in
the V dimension based on plausible physiology, such that V =11ms-1, following
(Cabral et al., 2011).
For the model output for each 𝑘, 𝑣 pair, we used independent component analysis
(ICA) to decompose the 164 node time courses into a set of simulated ICNs. These
simulated ICNs were then correlated with a set of resting-state networks derived from
the empirical BOLD fMRI resting state data in the same 10 independent healthy
control subjects used in the tractography step (see Materials and Methods). We
found that the correlation between the simulated and empirically defined networks
was highest near the point of maximal metastability (Figure 8). The emergence of
functional networks around the region of maximal metastability suggests that such a
rich dynamical regime is an important organising principle of how structural
connectivity may allow functional networks to form in the brain.
Empirically-defined macroscopic structural disconnection leads to reduced
metastability in a simulation of macroscopic neural dynamics
To examine the effect of macroscopic structural disconnection following TBI on
simulated neural dynamics, we used individualised structural connectivity matrices in
Page 25
25
patients and controls (see Materials and Methods, Figure 2C) to define coupling
within the Kuramoto model (Figure 1B). Global metastability was calculated for
simulations of the model executed separately for each subject’s connectivity matrix.
Runs were repeated for a range of values of the coupling constant, K (Figure 9 Left).
In the region of ideal maximum metastability identified in the parameter search
(K=3.5, see above), global metastability was significantly reduced in patients
compared to controls (t84=-4.90, p<0.0001) (Figure 9 Right).
To further explore the effect of structural disconnection on simulated dynamics, we
applied the same analysis to compute metastability within subsets of regions
involved in canonical ICNs. Simulations using structural connectivity from individual
TBI patients had significantly lower metastability within the dorsal attention network
(t84=4.15, p<0.001), a right fronto-parietal network (t84=-1.99, p<0.05), default mode
network (t84=-3.75, p<0.001), salience network (t84=-3.62, p<0.001), primary auditory
(t84=-4.06, p<0.001) and low-level visual networks (t84=-2.45, p<0.02). Simulated
results were obtained from multiple regression using age and total gray matter
volume as covariates of no interest and are FDR corrected for multiple comparisons
(q<0.1).
We assessed how well the simulated metastability predicts empirical metastability.
Global empirical metastability was entered as the dependent variable of a linear
regression, with global simulated metastability as a predictor variable, and age, total
gray matter volume, and the motion estimate for the empirical data as covariates of
no interest. The overall model was able to significantly predict empirical measures of
metastability (F83 =5.95, R2 = 0.24, P<0.0001), with a significant effect of simulated
metastability (T83 = 3.30, P<0.001)
To evaluate the extent to which global simulated metastability is determined by
changes to macroscopic structural connectivity, we used linear regression with graph
Page 26
26
theoretical measures and group (patients or controls) as a covariate. This analysis
showed small world index (t84=2.91, p<0.001), clustering coefficient (t84=2.36,
p<0.05) and mean degree (t84=5.96, p<0.001), were significant positive predictors of
simulated global metastability. An increase in characteristic path length was
associated with reduced metastability (t84=-5.62, p<0.001).
Page 27
27
Discussion
We considered two interrelated questions: how does high-level behaviour arise from
the structural connectivity of the brain; and how does disruption of network structure
alter behaviour? Metastability has been suggested as a fundamental property of
neural dynamics, serving as a conceptual bridge between brain structure and
behaviour (Tognoli and Kelso, 2014). Here, we used traumatic brain injury (TBI) as a
model to interrogate the relationship between metastability (here defined as the
standard deviation of the Kuramoto order parameter), structural connectivity and
behaviour. Following TBI, metastability measured using fMRI is reduced compared to
age-matched healthy control subjects. The level of metastability relates to
behavioural impairment on a range of cognitive tasks. Importantly, using both
empirical and computational modelling, we show that reduction in metastability
following TBI is associated with damage to structural network topology, providing a
demonstration of how metastable dynamics relate to behaviour through structural
connectivity.
Diffuse axonal injury (DAI) is a common pathology in TBI, accounting for much of the
morbidity and mortality after injury, preferentially damaging long-distance tracts
(Adams et al., 1989; Geddes et al., 1997). We demonstrate a significant reduction in
the ‘small-worldness’ of the structural connectome in TBI patients compared to
controls, alongside a reduction in metastability. Previously, the relationship between
network topology and metastability has been shown in computational simulations
(Shanahan, 2010; Wildie and Shanahan, 2012); (Cabral et al., 2012). Our
computational findings, alongside empirical observations, provide further support for
a relationship between altered topology and metastable dynamics. We show that this
relationship depends on the amount of structural damage (e.g., mean FA and
average node strength) but also it depends on higher-order metrics such as
Page 28
28
clustering coefficient and small-worldness. The relationship between small-worldness
of the structural connectome and metastability makes intuitive sense. Short overall
path lengths facilitate increased global synchronization, while local modular
architecture may provide some reservoir of different states, preventing the system
from getting “stuck” in a synchronized state. However, the relationship between
network topology and metastability may not be straightforward, involving
heterogeneous time delays between nodes. Alternative descriptions of the network
structure may be more effective at relating damage to altered metastability (e.g., the
importance of scale-free, or rich club structure (Senden et al., 2014)); more
computational and theoretical work is needed.
Our modelling results support the empirical findings, demonstrating that alterations in
structural topology from TBI reduce simulated metastability. This suggests a
mechanistic link between reduction in small-worldness and neural dynamics. The
results of the simulations are consistent with computational models based on
abstract network architectures (Friston, 1997; Shanahan, 2010) and those defined by
anatomical connectivity (Deco et al., 2009b; Cabral et al., 2011). This work suggests
how network topology allows the emergence of metastability, implicating sparseness
(Friston, 1997) and small-worldness (Shanahan, 2010; Cabral et al., 2011; Cabral et
al., 2012; Wildie and Shanahan, 2012; Messe et al., 2014). More recently, networks
with “rich-club” organization have been shown to support a broad repertoire of
dynamic states (Senden et al., 2014). Such rich dynamics are reminiscent of the
emergence of metastability; however, such a link is speculative. Future work could
explore in more detail whether other graph theoretical properties, such as the
presence of a strong “rich club”, better explain the alterations in metastability that we
observed, leading to a more refined explanation of how complex neural dynamics
emerge from the network topology of the brain.
Page 29
29
Our FMRI empirical results were acquired at rest, in the absence of any explicit
behavioural requirements. The rest state is when metastability is likely to be best
suited to efficient cognitive flexibility. Rest, which must be distinguished from low
arousal states such as sleep or sedation, can be thought of as a “jack-of-all-trades”
state when the brain is in a broad exploratory regime. The dynamical regime during
at rest may constitute an upper limit for flexibility of the neural dynamics. We have
previously shown, with both empirical and computational approaches, that
metastability at rest is higher than during a focused cognitive task (Hellyer et al.,
2014). During a task, high metastability is less desirable, since a specific
configuration of brain systems is recruited (e.g., in coordinating specific visual and
motor systems to perform a visually cued motor task). However, the dynamical
regime during this task will still reflect the level of metastability at rest, in terms of
how the system can transition from rest to a task state efficiently and reliably. With
low metastability at rest (e.g. following TBI), the system is likely to take longer and be
less reliable, transitioning between cognitive states, showing a reduced repertoire of
brain configurations required to facilitate task performance.
Metastability may be consistent with other descriptions of the brain as a dynamical
system, such as self-organised criticality. Critical systems balance the competing
demands of information propagation around a system with the need to maintain
stable functional long and short scale functional relationships (Beggs and Plenz,
2003; Beggs, 2008). Such behaviours maximise information flow and capacity (Shew
and Plenz, 2013) which is likely important for efficient cognitive function. Previous
empirical work has provided evidence of metastable dynamics in systems
demonstrating signatures of self-organised criticality (Haldeman and Beggs, 2005;
Kitzbichler et al., 2009). A closely related question is whether metastable dynamics
underlie cognitive function at finer spatio-temporal scales, in common with other
Page 30
30
measurements of brain activity and structure that show “scale-free” properties
(Werner, 2007). Within the framework of self-organised criticality, an alteration in
metastability may accompany a shift away from the critical state, associated with a
decrease in efficiency of information storage, or processing capacity of the brain.
Such a description has an intuitive link to cognitive deficits post TBI. The extent to
which this change in metastable activity is invariant of scale (i.e. is present at the
level of microscopic neural circuits as well as the macroscopic scale) is unclear. If
metastability is indicative of a self-organised critical system then it may be expected
that the macroscopic dynamics changes described here may cascade across all
spatial and temporal scales of the brain - from local neuronal circuits to the systems
level description explored here. Examination of neural dynamics at a range of spatial
and temporal scales using electrophysiological or optogenetic approaches in
behaving animal models (e.g. Scott et al., 2014) may therefore be helpful in exploring
these mechanisms in more detail.
We found reduction in metastability related to cognitive impairments on three tasks
assessed: cognitive flexibility, speed of information processing and associative
memory. The switch cost index of the Trail Making Test, which involves rapidly and
accurately switching between competing task demands, assesses cognitive flexibility
and intuitively maps onto reduced metastability (which reflects reduced dynamical
flexibility). This relationship may help explain perseveration following TBI: structural
damage to white matter tracts limits the metastability of the brain which limits
cognitive flexibility. However, the relationship between metastability and behaviour
was not specific to cognitive flexibility, being present for the other two measures
tested. All three tasks involve the integration of information across large-scale brain
networks (Sharp et al., 2010b; Spreng and Grady, 2010; Bonnelle et al., 2011; Erika-
Florence et al., 2014; Jilka et al., 2014). These tasks require communication between
Page 31
31
sensory, motor and cognitive control regions, so altered global metastability may
affect them all. This suggests large-scale metastability may be an important
dynamical mechanism underlying general cognitive function. However, there may be
different ways metastability can break down, evident as altered dynamics within
specific brain networks, resulting in different profiles of impairments. The prominence
of frontal network damage relating to metastability supports the clinically-established
association between cognitive inflexibility and frontal lesions. Future work, with a
larger group of patients, performing a broader range of behavioural tasks in the
scanner, and imaging with higher temporal resolution would better characterize both
across-subject variance in network metastability and associated patterns of
behavioural impairment, beyond the domains studied here. Information about altered
neural dynamics could provide a sensitive biomarker to stratify patients and be used
to design individualized treatments, involving electrical stimulation, pharmacological
intervention or neurofeedback (Sharp et al., 2014).
There are a number of limitations to the work. Our results show a relationship
between metastability, individual cognitive performance and underlying structure in
the TBI patients rather than in both the patients and controls. This may in part be
because we had limited behavioural data on the healthy control subjects; also
patients tend to be much more variable (in terms of behavioural impairment, neural
dynamics and structure), and therefore relationships may be easier to detect.
However, we also acknowledge that the lack of relationships in the healthy controls
mean we can not claim that metastability is important for understanding individual
differences in cognitive performance or structural network topology, beyond the
patient group. A second limitation is based on the constraints inherent in tractography
measured with diffusion MR. The structural connectivity matrices and graphs
generated were undirected, in so much as feed-forward and feed-back connectivity of
Page 32
32
individual regions had a uniform effect on node-node functional interaction, which is
unlikely to be the case in vivo. In addition, long distance connections, for example
inter-hemispheric pathways, may be difficult to resolve accurately since uncertainty in
streamline location increases with the length of the tract (Jones, 2010b, a). The
computational model, a system of coupled oscillators, is obviously a dramatic
simplification of brain function. For example, the simulation is built on a relatively low-
dimensional connectivity matrix of 164 regions. However, despite these limitations,
the simulation provides important insights into the relationship between brain
structure and function, broadly consistent with empirical findings. Such models, at
least at the level of global network dynamics, replicate the broad changes in BOLD
seen with fMRI, even though the model is based only on network topology (Deco et
al., 2008; Deco et al., 2009b; Cabral et al., 2011; Cabral et al., 2012; Messe et al.,
2014), with no modelling of the functional specialisation of individual nodes. These
limitations mean that precise, quantitative comparisons between the simulations and
the brain were not expected, although perform surprisingly well. Future work could
consider whether our findings generalise to other computational oscillators models at
comparable scales, such as the Wilson-Cowan model. Difficulties with the
measurement of BOLD fMRI signal, such as partial volume effects, regional
differences in vascular reactivity or susceptibility artefacts would also make
quantitative comparisons challenging. Finally, the data we present here was collected
in eyes closed state. Recent work has suggested subjects may not consistently
remain conscious throughout an extended resting scan (Tagliazucchi and Laufs,
2014). This opens up the possibility that subjects varied in whether they drifted in and
out of sleep and this could have affected empirical measurements of metastability.
Therefore, future work, should exclude this possibility, with the use of concurrent
EEG to directly detect sleep states (Tagliazucchi and Laufs, 2014).
Page 33
33
In summary, we found large-scale structural disconnection is associated with
reduced metastability, linked to impaired cognitive flexibility and other behavioural
impairments. The link between damaged structural connectivity following TBI and
reduced metastability (demonstrated both in empirical and simulated data) provides
evidence that metastability is contingent on the integrity of the underlying structural
network topology. This suggests a mechanistic link between structure, neural
dynamics and behaviour. The results indicate a compelling link between brain
structure and function, and suggest the framework of metastable dynamics offers an
account for understanding the brain in health and disease.
Page 34
34
References
Acebrón J, Bonilla L, Pérez Vicente C, Ritort F, Spigler R (2005) The
Kuramoto model: A simple paradigm for synchronization phenomena.
Reviews of Modern Physics 77:137-185.
Adams JH, Doyle D, Ford I, Gennarelli TA, Graham DI, McLellan DR (1989)
Diffuse axonal injury in head injury: definition, diagnosis and grading.
Histopathology 15:49-59.
Baddeley A (1986) Working Memory. Oxford: Clarendon Press.
Baddeley A (1992) Working memory. Science 255:556-559.
Baddeley AD, Emslie H, Nimmo-Smith I (1994) Doors and people: A test of
visual and verbal recall and recognition: Thames Valley Test Company.
Bassett DS, Bullmore E (2006) Small-world brain networks. The
Neuroscientist : a review journal bringing neurobiology, neurology and
psychiatry 12:512-523.
Beckmann CF, DeLuca M, Devlin JT, Smith SM (2005) Investigations into
resting-state connectivity using independent component analysis.
Philos Trans R Soc Lond B Biol Sci 360:1001-1013.
Behrens TE, Johansen-Berg H, Woolrich MW, Smith SM, Wheeler-Kingshott
CA, Boulby PA, Barker GJ, Sillery EL, Sheehan K, Ciccarelli O,
Thompson AJ, Brady JM, Matthews PM (2003a) Non-invasive mapping
of connections between human thalamus and cortex using diffusion
imaging. Nat Neurosci 6:750-757.
Behrens TEJ, Woolrich MW, Jenkinson M, Johansen-Berg H, Nunes RG,
Clare S, Matthews PM, Brady JM, Smith SM (2003b) Characterization
Page 35
35
and propagation of uncertainty in diffusion-weighted MR imaging.
Magnetic Resonance in Medicine 50:1077-1088.
Bhowmik D, Shanahan M (2013) Metastability and inter-band frequency
modulation in networks of oscillating spiking neuron populations. PloS
one 8:e62234.
Bird CM, Castelli F, Malik O, Frith U, Husain M (2004) The impact of
extensive medial frontal lobe damage on 'Theory of Mind' and
cognition. Brain 127:914-928.
Bonnelle V, Ham TE, Leech R, Kinnunen KM, Mehta MA, Greenwood RJ,
Sharp DJ (2012) Salience network integrity predicts default mode
network function after traumatic brain injury. Proceedings of the
National Academy of Sciences of the United States of America
109:4690-4695.
Bonnelle V, Leech R, Kinnunen KM, Ham TE, Beckmann CF, De Boissezon
X, Greenwood RJ, Sharp DJ (2011) Default Mode Network Connectivity
Predicts Sustained Attention Deficits after Traumatic Brain Injury. J
Neurosci 31:13442-13451.
Cabral J, Hughes E, Sporns O, Deca G (2011) Role of local network
oscillations in resting-state functional connectivity. NeuroImage 57:130
- 139.
Cabral J, Hugues E, Kringelbach ML, Deco G (2012) Modeling the outcome of
structural disconnection on resting-state functional connectivity.
NeuroImage 62:1342-1353.
Page 36
36
Caeyenberghs K, Leemans A, Leunissen I, Gooijers J, Michiels K, Sunaert S,
Swinnen SP (2014) Altered structural networks and executive deficits in
traumatic brain injury patients. Brain structure & function 219:193-209.
Chang C, Glover GH (2010) Time–frequency dynamics of resting-state brain
connectivity measured with fMRI. NeuroImage 50:81-98.
Chialvo DR (2010) Emergent complex neural dynamics. Nature Physics
6:744-750.
Deco G, Rolls ET, Romo R (2009a) Stochastic dynamics as a principle of
brain function. Progress in Neurobiology 88:1--16.
Deco G, Jirsa VK, Robinson PA, Breakspear M, Friston K (2008) The
Dynamic Brain: From Spiking Neurons to Neural Masses and Cortical
Fields. PLoS Comput Biol 4:e1000092.
Deco G, Jirsa V, McIntosh AR, Sporns O, Kotter R (2009b) Key role of
coupling, delay, and noise in resting brain fluctuations. Proc Natl Acad
Sci U S A 106:10302-10307.
Erika-Florence M, Leech R, Hampshire A (2014) A functional network
perspective on response inhibition and attentional control. Nature
communications 5:4073.
Fischl B, van der Kouwe A, Destrieux C, Halgren E, Segonne F, Salat DH,
Busa E, Seidman LJ, Goldstein J, Kennedy D, Caviness V, Makris N,
Rosen B, Dale AM (2004) Automatically parcellating the human
cerebral cortex. Cerebral cortex 14:11-22.
Freeman LC (1978) Segregation in Social Networks. Sociol Method Res
6:411-429.
Page 37
37
Friston KJ (1997) Transients, metastability, and neuronal dynamics.
NeuroImage 5:164-171.
Friston KJ (2002) Dysfunctional connectivity in schizophrenia. World
psychiatry : official journal of the World Psychiatric Association (WPA)
1:66-71.
Friston KJ, Mechelli A, Turner R, Price CJ (2000) Nonlinear responses in
fMRI: the Balloon model, Volterra kernels, and other hemodynamics.
Neuroimage 12:466-477.
Geddes JF, Vowles GH, Beer TW, Ellison DW (1997) The diagnosis of diffuse
axonal injury: implications for forensic practice. Neuropathol Appl
Neurobiol 23:339-347.
Gigandet X, Hagmann P, Kurant M, Cammoun L, Meuli R, Thiran JP (2008)
Estimating the confidence level of white matter connections obtained
with MRI tractography. PLoS One 3:e4006.
Glerean E, Salmi J, Lahnakoski JM, Jaaskelainen IP, Sams M (2012)
Functional magnetic resonance imaging phase synchronization as a
measure of dynamic functional connectivity. Brain connectivity 2:91-
101.
Gong G, He Y, Concha L, Lebel C, Gross DW, Evans AC, Beaulieu C (2009)
Mapping anatomical connectivity patterns of human cerebral cortex
using in vivo diffusion tensor imaging tractography. Cerebral cortex
19:524-536.
Gratton C, Nomura EM, Perez F, D'Esposito M (2012) Focal brain lesions to
critical locations cause widespread disruption of the modular
Page 38
38
organization of the brain. Journal of cognitive neuroscience 24:1275-
1285.
Greve DN, Fischl B (2009) Accurate and robust brain image alignment using
boundary-based registration. NeuroImage 48:63--72.
Hagmann P, Cammoun L, Gigandet X, Meuli R, Honey CJ, Wedeen VJ,
Sporns O (2008) Mapping the structural core of human cerebral cortex.
PLoS biology 6:e159.
Haldeman C, Beggs JM (2005) Critical branching captures activity in living
neural networks and maximizes the number of metastable States. Phys
Rev Lett 94:058101.
Hellyer PJ, Leech R, Ham TE, Bonnelle V, Sharp DJ (2013) Individual
prediction of white matter injury following traumatic brain injury. Annals
of Neurology 73:489-499.
Hellyer PJ, Shanahan M, Scott G, Wise RJ, Sharp DJ, Leech R (2014) The
control of global brain dynamics: opposing actions of frontoparietal
control and default mode networks on attention. The Journal of
Neuroscience 34:451-461.
Honey CJ, Sporns O, Cammoun L, Gigandet X, Thiran JP, Meuli R, Hagmann
P (2009) Predicting human resting-state functional connectivity from
structural connectivity. Proc Natl Acad Sci U S A 106:2035-2040.
Humphries MD, Gurney K (2008) Network 'Small-World-Ness': A Quantitative
Method for Determining Canonical Network Equivalence. Plos One 3.
Page 39
39
Jilka S, Scott G, Ham TE, Pickering A, Bonnelle V, Braga R, Leech R, Sharp
DJ (2014) Damage to the Salience Network and Interactions with the
Default Mode Network. The Journal of Neuroscience 34:10798-10807.
Johnson VE, Stewart W, Smith DH (2013a) Axonal pathology in traumatic
brain injury. Experimental neurology 246:35-43.
Johnson VE, Stewart JE, Begbie FD, Trojanowski JQ, Smith DH, Stewart W
(2013b) Inflammation and white matter degeneration persist for years
after a single traumatic brain injury. Brain : a journal of neurology
136:28-42.
Jones DK (2010a) Precision and Accuracy in Diffusion Tensor Magnetic
Resonance Imaging. Topics in Magnetic Resonance Imaging 21:87-99.
Jones DK (2010b) Challenges and limitations of quantifying brain connectivity
in vivo with diffusion MRI. Imaging in Medicine 2:341-355.
Kinnunen KM, Greenwood R, Powell JH, Leech R, Hawkins PC, Bonnelle V,
Patel MC, Counsell SJ, Sharp DJ (2011) White matter damage and
cognitive impairment after traumatic brain injury. Brain 134:449-463.
Kitzbichler MG, Smith ML, Christensen SoR, Bullmore E (2009) Broadband
criticality of human brain network synchronization. PLoS Computational
Biology 5:e1000314.
Kuramoto Y (1984) Chemical oscillations, waves, and turbulence. New York:
Springer.
Logan GD, Cowan WB, Davis KA (1984) On the ability to inhibit simple and
choice reaction time responses: a model and a method. Journal of
experimental psychology 10:276-291.
Page 40
40
Malec JF, Brown AW, Leibson CL, Flaada JT, Mandrekar JN, Diehl NN,
Perkins PK (2007) The mayo classification system for traumatic brain
injury severity. J Neurotrauma 24:1417-1424.
Messe A, Rudrauf D, Benali H, Marrelec G (2014) Relating structure and
function in the human brain: relative contributions of anatomy,
stationary dynamics, and non-stationarities. PLoS Comput Biol
10:e1003530.
Niazy RK, Xie J, Miller K, Beckmann CF, Smith SM (2011) Spectral
characteristics of resting state networks. Progress in brain research
193:259-276.
Nichols TE, Holmes AP (2002) Nonparametric permutation tests for functional
neuroimaging: a primer with examples. Human brain mapping 15:1-25.
Rabbitt P (1966) Errors and error correction in choice reaction tasks. J Exp
Psychol 71:264-272.
Reitan R (1958) The validity of the Trail Making test as an indicator of organic
brain damage. Perceptual and Motor Skills 8:271-276.
Rubinov M, Sporns O (2010) Complex network measures of brain
connectivity: uses and interpretations. Neuroimage 52:1059-1069.
Scott G, Fagerholm ED, Mutoh H, Leech R, Sharp DJ, Shew WL, Knopfel T
(2014) Voltage imaging of waking mouse cortex reveals emergence of
critical neuronal dynamics. The Journal of neuroscience : the official
journal of the Society for Neuroscience 34:16611-16620.
Page 41
41
Senden M, Deco G, de Reus MA, Goebel R, van den Heuvel MP (2014) Rich
club organization supports a diverse set of functional network
configurations. Neuroimage 96:174-182.
Shanahan M (2010) Metastable chimera states in community-structured
oscillator networks. Chaos: An Interdisciplinary Journal of Nonlinear
Science 20:013108}.
Sharp DJ, Scott G, Leech R (2014) Network dysfunction after traumatic brain
injury. Nature reviews Neurology 10:156-166.
Sharp DJ, Turkheimer FE, Bose SK, Scott SK, Wise RJ (2010a) Increased
frontoparietal integration after stroke and cognitive recovery. Ann
Neurol 68:753-756.
Sharp DJ, Bonnelle V, De Boissezon X, Beckmann CF, James SG, Patel MC,
Mehta MA (2010b) Distinct frontal systems for response inhibition,
attentional capture, and error processing. Proceedings of the National
Academy of Sciences of the United States of America 107:6106-6111.
Sharp DJ, Beckmann CF, Greenwood R, Kinnunen KM, Bonnelle V, De
Boissezon X, Powell JH, Counsell SJ, Patel MC, Leech R (2011)
Default mode network functional and structural connectivity after
traumatic brain injury. Brain : a journal of neurology 134:2233-2247.
Shew WL, Plenz D (2013) The functional benefits of criticality in the cortex.
The Neuroscientist : a review journal bringing neurobiology, neurology
and psychiatry 19:88-100.
Smith SM, Jenkinson M, Johansen-Berg H, Rueckert D, Nichols TE, Mackay
CE, Watkins KE, Ciccarelli O, Cader MZ, Matthews PM, Behrens TE
Page 42
42
(2006) Tract-based spatial statistics: voxelwise analysis of multi-subject
diffusion data. Neuroimage 31:1487-1505.
Smith SM, Fox PT, Miller KL, Glahn DC, Fox PT, Mackay CE, Filippini N,
Watkins KE, Toro R, Laird AR, Beckmann CF (2009) Correspondence
of the brain's functional architecture during activation and rest.
Proceedings of the National Academy of Sciences of the United States
of America 106:13040--13045.
Smith SM, Jenkinson M, Woolrich MW, Beckmann CF, Behrens TE,
Johansen-Berg H, Bannister PR, De Luca M, Drobnjak I, Flitney DE,
Niazy RK, Saunders J, Vickers J, Zhang Y, De Stefano N, Brady JM,
Matthews PM (2004) Advances in functional and structural MR image
analysis and implementation as FSL. Neuroimage 23 Suppl 1:S208-
219.
Sporns O (2006) Small-world connectivity, motif composition, and complexity
of fractal neuronal connections. Biosystems 85:55-64.
Spreng RN, Grady CL (2010) Patterns of brain activity supporting
autobiographical memory, prospection, and theory of mind, and their
relationship to the default mode network. Journal of cognitive
neuroscience 22:1112-1123.
Squarcina L, Bertoldo A, Ham TE, Heckemann R, Sharp DJ (2012) A robust
method for investigating thalamic white matter tracts after traumatic
brain injury. Neuroimage 63:779-788.
Strogatz SH (2001) Exploring complex networks. Nature 410:268-276.
Page 43
43
Tagliazucchi E, Laufs H (2014) Decoding wakefulness levels from typical fMRI
resting-state data reveals reliable drifts between wakefulness and
sleep. Neuron 82:695-708.
Tognoli E, Kelso JAS (2014) The Metastable Brain. Neuron 81:35-48.
Uhlhaas PJ, Singer W (2006) Neural synchrony in brain disorders: relevance
for cognitive dysfunctions and pathophysiology. Neuron 52:155-168.
van den Heuvel MP, Sporns O (2011) Rich-club organization of the human
connectome. J Neurosci 31:15775-15786.
Warren DE, Power JD, Bruss J, Denburg NL, Waldron EJ, Sun H, Petersen
SE, Tranel D (2014) Network measures predict neuropsychological
outcome after brain injury. Proc Natl Acad Sci U S A 111:14247-14252.
Watts DJ, Strogatz SH (1998) Collective dynamics of 'small-world' networks.
Nature 393:440-442.
Werner G (2007) Metastability, criticality and phase transitions in brain and its
models. Bio Systems 90:496--508.
Wildie M, Shanahan M (2012) Metastability and chimera states in modular
delay and pulse-coupled oscillator networks. Chaos: An
Interdisciplinary Journal of Nonlinear Science 22:043131.
Winkler AM, Ridgway GR, Webster MA, Smith SM, Nichols TE (2014)
Permutation inference for the general linear model. Neuroimage
92:381-397.
Page 44
44
Legends
Figure 1: Overview of experimental design. A, fMRI was used to estimate global
measures of network dynamics during rest in 63 Patients and 26 Controls. B, We
used a computational model to simulate neural dynamics using dynamic systems
framework constrained by structural connectivity. C We used a Hilbert transformation
of the fMRI data and the phase output of the computational model to compare the
global dynamics of empirical data and the dynamics of a computational model
constrained by white matter structural connectivity.
T1 weighted Structural
Image
ii) Segmentation
& boundary based registration
A Empirical Functional Imaging
B Computational Modelling
iii) Simulation of network activity
C Measures of network dynamics
EmpiricalICNs
ContinuousfMRI
Resting State
i) Motion Correction
Cluster Construction
Estimation of Phase Synchonyh
Time (Seconds)Mean Synchrony
Metastability
Sync
hron
y
1
0543210
iii) Timecourse extraction
BOLD
Sig
nal
Time (TR)164 ROI timecourses
0 50 100
Phas
e
Time (TR)0 50 100
iii) Filtering
& Hilbert Transform
Estimation of Phase Synchony
IndividualisedConnectivity Matrix
63 Patients / 26 Controls
DistanceMatrix
!
-!
!2(t)
!1(t) !3(t)C1,3
C3,1C2,3
C3,2C1,2
C2,1
Page 45
45
Figure 2: Estimation of structural disconnection in traumatic brain injury
patients versus controls. A, To define a standardised connectivity matrix to
perform computational simulation, probabilistic tractography was performed in 10
independent age matched healthy control subjects, resulting in a binary connectivity
graph and spatial estimates of probable tract location for each connected edge (see
materials and methods). B, Measures of tract integrity (FA) were estimated in each of
the 63 Patients and 26 healthy controls by generating a ‘skeleton’ for each subject
using the pre-processing steps of TBSS. C, For each edge of the reference
connectivity matrix, each subject’s FA skeleton was projected though the spatial
mask for each edge, resulting in a 164 region ‘white matter integrity’ matrix for each
subject. C, For each subject, the reference binary connectivity map was weighted
according to relative reduction in tract integrity in each individual subject (see
materials and methods), resulting in a individual weighted connectivity matrix for
each of the 63 TBI patients and 26 Healthy controls.
DTI / ProbabilisticTractography (igj)
White MatterFA SkeletonsFA Matrices
63 Patients / 26 Healthy Controls
10 Healthy Controls
164
164
IndividualisedConnectivity Matrices
T1 weighted Structural
Image
‘Normal’ ConnectivityMatrix
Segmentation
& boundary based registration
Normalisation & Thresholding
Diffusion Tensor Imaging
Diffusion Tensor Imaging
TBSS
A Probabilistic Tractography B Estimation of Damage
C Simulated Disconnection
Page 46
46
Figure 3: Independent component analysis (ICA) of fMRI data in macroscopic
ROIs. ICA was used to decompose ROI data from 164 cortical and subcortical
regions of the brain in 10 healthy control subjects into 15 components. Here, 7 of the
z=20
z=26 z=0 z=40
z=20
Default Mode Salience
Fronto-ParietalLeft Right
Dorsal Attention
z=14 z=12
Visual Auditory
L
Page 47
47
resulting components which best resembled canonical ‘resting state networks’ have
been reconstructed into Montréal Neurological Institute (MNI) 152 space according to
the 164 region model with a Gaussian blur of 3mm (isotropic) for ease of
visualisation.
Figure 4: Structural brain damage following traumatic brain injury. A)
Widespread white matter disruption following traumatic brain injury measured by
TBSS of Fractional anisotropy (FA). Contrasts between traumatic brain injury <
healthy control subjects (Red-Yellow). Contrasts overlaid on a standard Montréal
Neurological Institute 152 T1 1 mm brain and the mean FA skeleton (in green),
thresholded at P ≤ 0.05, corrected for multiple comparisons using Threshold Free
x=-17x=12
z=-3z=-14 z=39z=26L
Z=0 Z=-20 X=-6
L
7
1
Subjects
A
B
5
2.3
Z-Score
Page 48
48
Cluster Enhancement (TFCE) (Smith et al., 2006). B) Lesion probability maps of
cortical contusions across 63 TBI patients. Estimated by a neuroradiologist on the T1
structural images. The colour bar indicates the number of patients who had lesions at
each site, overlaid on a standard Montréal Neurological Institute 152 T1 2 mm brain.
Figure 5: Empirical Metastability at rest is significantly reduced in patients
compared to controls. Mean measures of metastability (±1SEM) estimated using
phase transformed functional time-course extracted from 63 Patients and 26 Control
subjects suggest that global measures of metastability are reduced following TBI.
Metastability
0.2
0.1
0.15
0.05 Auditory DorsalAttention
Salience VisualFronto - Parietal
RightLeftDefaultMode
Global
**
*** *
**
TBIControl
Page 49
49
Figure 6: Global
0
20
40
60
80
100
120
140
CRT
(M
edia
n R
eact
ion
Tim
e)
0.04 0.06 0.08 0.1 0.12 0.14 0.160
20
40
60
80
100
120
140
160
180
200
0.04 0.06 0.08 0.1 0.12 0.14 0.1610
12
14
16
18
20
22
24
26
28
30
Global Metastability
Logi
cal M
emor
y (I
mm
edia
te R
ecal
l, R
eten
tion
)
0.4
0.5
0.6
0.7
0.8
0.9
Trai
lmak
ing
(Sw
itch
Cos
t In
dex) r=-0.38, p<0.01
r=-0.34, p<0.01
r=0.34, p<0.01
r=0.31, p<0.05
Page 50
50
Metastability predicts behavioural outcome. Measures of global metastability
during rest significantly correlate with scores of task-switching (Top, Red n=62),
Information Processing speed (Middle, Purple, n=49), and Logical Memory (Bottom,
Blue and Green, n=62).
Figure 7: Empirical metastability in patients is associated with cortical
connectivity within the frontal lobes. Multiple regression of empirical global
metastability (Red-Yellow) with skeletonised FA values in 63 TBI patients (age
included as a covariate of no interested). Results overlaid on a standard Montréal
Neurological Institute 152 T1 1 mm brain and the mean fractional anisotropy skeleton
(in green), thresholded at P ≤ 0.05, corrected for multiple comparisons using
Threshold Free Cluster Enhancement (TFCE) (Smith et al., 2006).
x=-16x=20
z=-3z=-14 z=26
L
5
2.3
Z-Score
Page 51
51
Figure
2 4 6 8 10 12 14
2.5
3
3.5
4
4.5
5
5.5
K (
Con
nect
ivty
Con
stan
t) 1.0
0
Sync
hron
y
2 4 6 8 10 12 14
2.5
3
3.5
4
4.5
5
5.5
K (
Con
nect
ivty
Con
stan
t)
0.2
0
Met
asta
bilit
y
2 4 6 8 10 12 14
2.5
3
3.5
4
4.5
5
5.5
!V" (ms-1)
K (
Con
nect
ivty
Con
stan
t)
0.5
0
Cor
rela
tion
Coe
ffici
ent
Page 52
52
8: A large-scale neural network model predicts functional connectivity where
metastability is maximised. Plots of a parameter space exploration of the
Kuramoto model the using 6000 randomly generated pairs of the coupling and delay
parameters 𝑘, 𝑣 , within the plane 𝑘(!…!) and 𝑉(!…!") , here expressed as mean
velocity (ms-1). Global Synchrony (Top). Global Metastability (Middle), and
Correlations of the 5 best-matching simulated and empirical ICNs (Bottom). For ease
of further computation we set velocity at a biologically plausible value (Cabral et al.,
2011), which equates to ~ 11ms-1 (dashed line)
Figure 9: Simulated global metastability is decreased in traumatic brain injury
patients compared to controls A, Mean metastability (±1SEM) for in patients
(n=63) and controls (n=26) in the computational model for a range of different
coupling strengths (K). v = 11ms -1. B, Mean measures of metastability estimated
within the model (±1SEM) for 63 patients and 26 healthy control subjects suggest
that global measures of metastability simulated from structural connectivity in TBI
patients are reduced compared to healthy controls.
3 3.1 3.2 3.3 3.4 3.5 3.6 3.7 3.8 3.9 40.02
0.03
0.04
0.05
0.06
0.07
0.08
0.09
0.1
0.11
0.12
Met
asta
bilit
y
Connectivity Constant (K)
TBIControl
Auditory DorsalAttention
Salience VisualFronto - Parietal
RightLeftDefaultMode
Global0.05
0.10
0.15
0.20
******
*
*
***
***
***