76
NICTA Copyright 2010 1 From imagination to impact Using Information to Drive Decisions Cognitive Load Measurement Through Multimodal Behaviours Dr. Fang Chen [email protected]
NICTA Copyright 2010 1
From imagination to impact
Using Information to Drive Decisions
Cognitive Load Measurement
Through Multimodal Behaviours
Dr. Fang Chen [email protected]

NICTA Copyright 2010 2
About NICTA
• National ICT Australia
– Federal and state funded research company established in 2002
– The largest research organisation in Australia dedicated to ICT
– ~750 staff/students working in 5 labs across major capital cities
– Headquarters at Australian Technology Park (ATP)
About NICTA

NICTA Copyright 2010 3
• Decision Support for Incident
Management
– Cognitive Load Measurement and
Management in complex real-life situations
– Optimising joint human-system integration via
cognition-aware adaptive Interfaces
• Human Performance Improvement
– Cognitive Load Measurement in the field (e.g.
athletes)
– Skill Acquisition, Field Training/Lab training
– Real-time feedback of performance
Making Sense of Data Theme @ ATP

NICTA Copyright 2010 4
• Collaborative human-machine interaction
– NICTA/DSTO/CSIRO
– Information sharing technology that can help
geographically distributed teams collaborate more
effectively
– How to improve the productivity of teams and team
members‟ awareness of co-workers Group
Behaviour
• Geographical data mining
– Analysing movement of objects (e.g. cars, people,
animals) and trying to find interesting patterns such
as where animals meet to form a flock
• Multimodal interfaces
– Different input/output technologies
– Multimodal information interpretation and fusion
– Human multimodal behaviour patterns
Making Sense of Data Theme @ ATP

NICTA Copyright 2010 5
• Definition – Level of perceived effort
associated with learning, thinking and reasoning (including perception, memory, language, etc)
– Available „space‟ in working memory in comparison to the „space‟ needed by a user to complete the task successfully
Cognitive Load Theory [Sweller et al. 98]:

NICTA Copyright 2010 6
Need for CL Measurement
• Overloading or underloading of cognitive
processing:
– Degradation of performance, and/or
– Failures of learning and performing, and/or
– Source of performance errors.
• CL measurement is crucial for:
– Minimising the amount of cognitive effort required,
– Maintaining the right level of CL,
– Achieving adaptive system response,
– Improving user performance.

NICTA Copyright 2010 7
• Subjective (self-report) measures
– Users rank their experienced level of load on single or
multiple rating scales;
– Consistent and reliable over time
• Lickert Scales
• Semantic Differential Scales
• NASA-TLX
• Performance measures
– Testing, error rates, accuracy, time to response etc…
– Do not always reflect load levels; load may increases
well in advance of performance degradation
State-of-the-Art CL Measurement
NICTA Copyright 2010 8
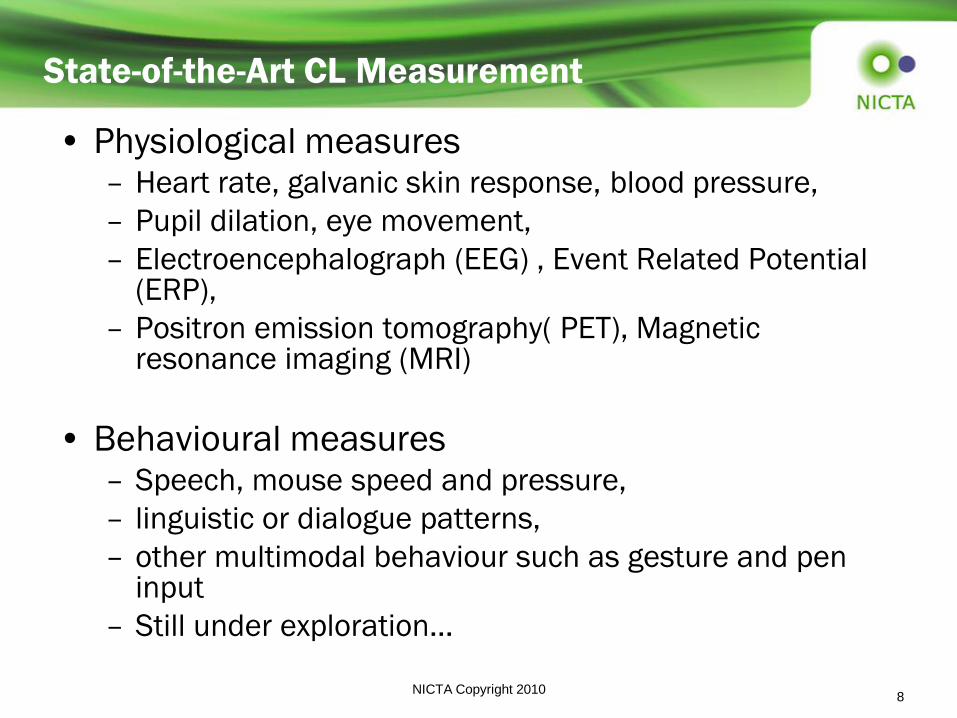
State-of-the-Art CL Measurement
• Physiological measures – Heart rate, galvanic skin response, blood pressure,
– Pupil dilation, eye movement,
– Electroencephalograph (EEG) , Event Related Potential (ERP),
– Positron emission tomography( PET), Magnetic resonance imaging (MRI)
• Behavioural measures – Speech, mouse speed and pressure,
– linguistic or dialogue patterns,
– other multimodal behaviour such as gesture and pen input
– Still under exploration…

NICTA Copyright 2010 9
Ideal Measurement
• Expected measurement should be
– Accurate
– Objective
– Real-time (online)
– Non-intrusive (for most scenarios)
– Reliable
• Solutions
– Behavioural methods are suitable but depend on the task scenario
– Physiological methods can be used if possible
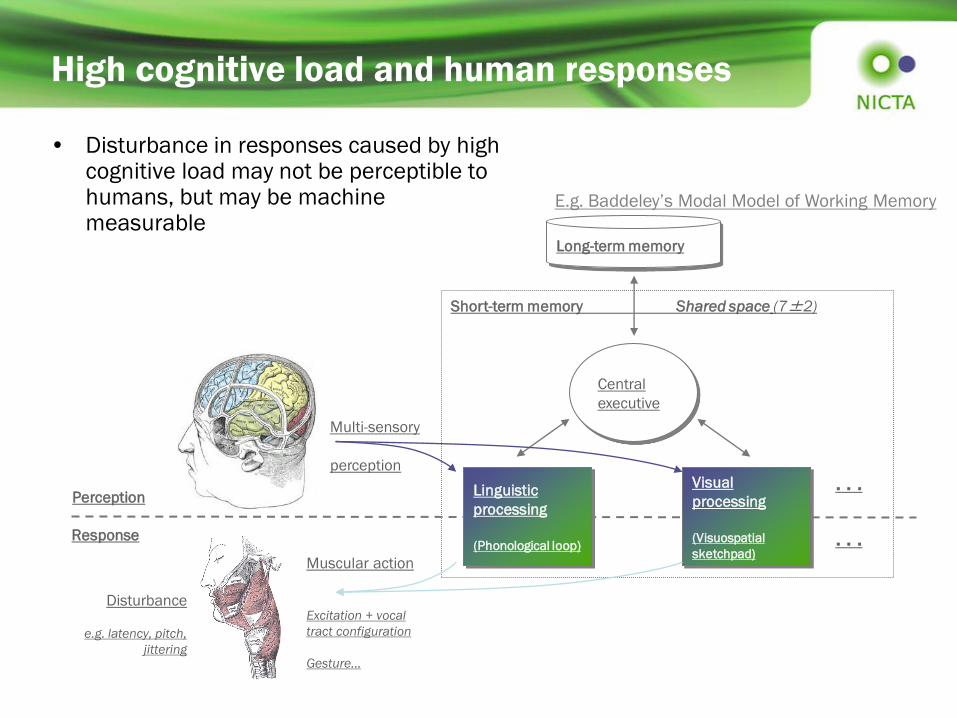
High cognitive load and human responses
• Disturbance in responses caused by high cognitive load may not be perceptible to humans, but may be machine measurable
Long-term memory
Short-term memory Shared space (7±2)
Visual
processing
(Visuospatial
sketchpad)
Linguistic
processing
(Phonological loop)
Central
executive
Perception
Response
Muscular action
Excitation + vocal
tract configuration
Gesture…
Multi-sensory
perception
. . .
. . .
Disturbance
e.g. latency, pitch,
jittering
E.g. Baddeley‟s Modal Model of Working Memory
NICTA Copyright 2010 11
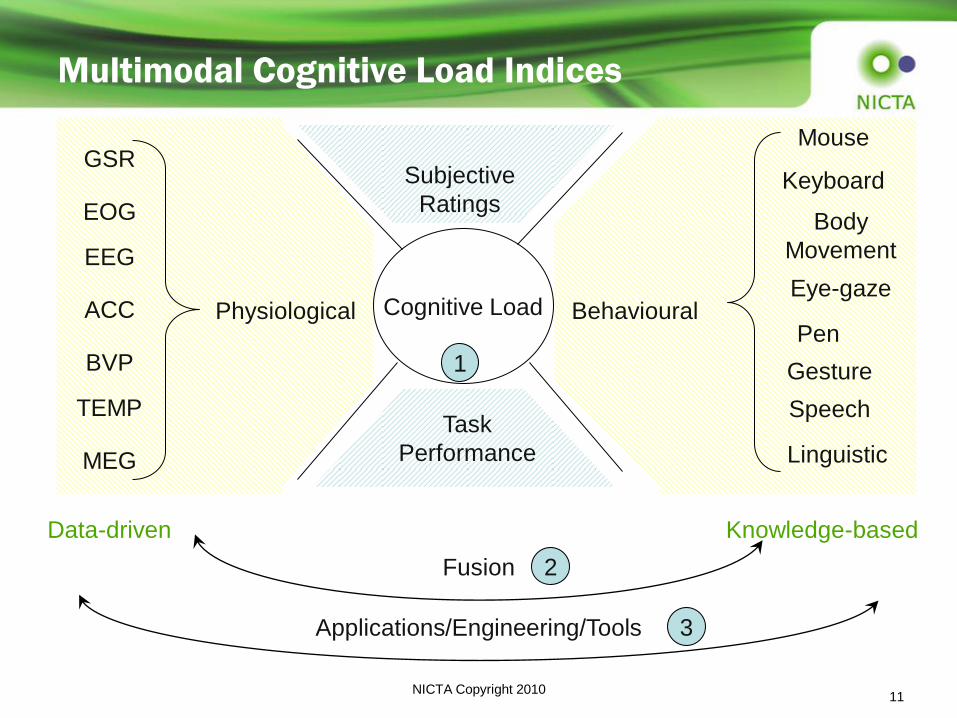
Multimodal Cognitive Load Indices
Cognitive Load
Subjective
Ratings
Task
Performance
Physiological
Behavioural
GSR
EOG
EEG
ACC
BVP
TEMP
MEG
Mouse
Keyboard
Body
Movement
Eye-gaze
Pen
Gesture
Speech
Linguistic
Fusion
Data-driven Knowledge-based
Applications/Engineering/Tools
1
2
3

NICTA Copyright 2010 12
• Real-time Operational Load Management – Cognitive load assessment in simulated environment
– Assessment of the operational processes
– Identification of training needs
• System/Device/Web Usability Evaluation (User Centered)
• Adaptive Interaction Design
• Staff Recruitment CLM
Science/Technology
Usability, Hearing aids,
cochlear implants,
Health Monitoring and
rehabilitation…
Traffic Management Road Traffic (RTA,
Transurban)
Air Traffic Control
Emergency Centres Bushfire, Ambulance, SES
Call Centres
Simulations
/Training (CAE)
Defence/Military
Applications of CLM
NICTA Copyright 2010 13
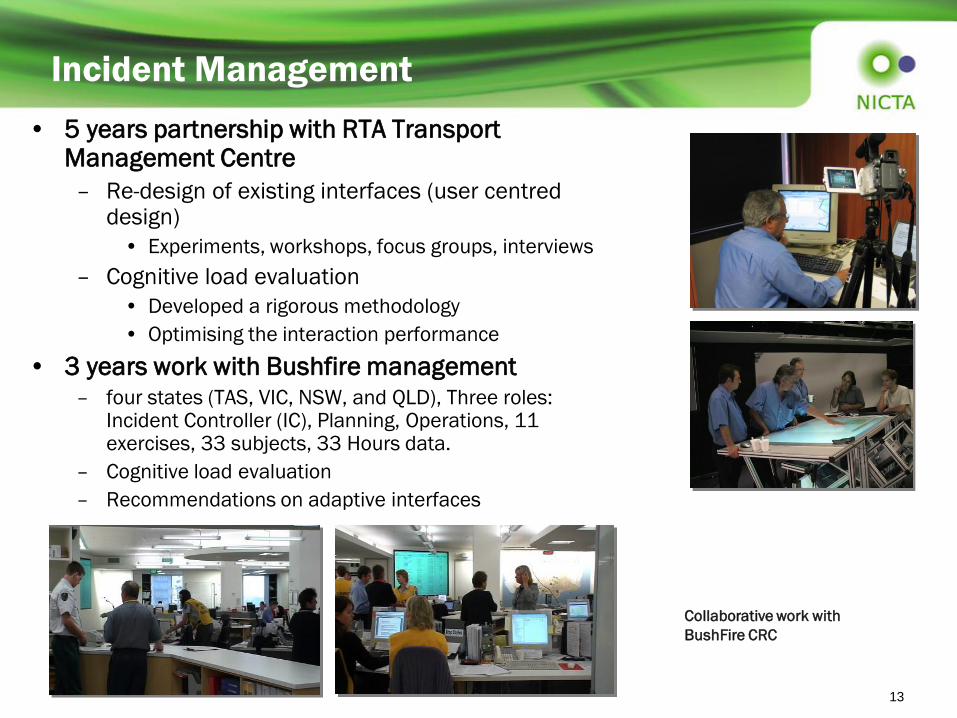
Incident Management
• 5 years partnership with RTA Transport Management Centre
– Re-design of existing interfaces (user centred design)
• Experiments, workshops, focus groups, interviews
– Cognitive load evaluation
• Developed a rigorous methodology
• Optimising the interaction performance
• 3 years work with Bushfire management – four states (TAS, VIC, NSW, and QLD), Three roles:
Incident Controller (IC), Planning, Operations, 11 exercises, 33 subjects, 33 Hours data.
– Cognitive load evaluation
– Recommendations on adaptive interfaces
Collaborative work with
BushFire CRC

NICTA Copyright 2010 14
CLM in Air Traffic Control
1 2 3 4 5 6 7 8 9 10
Low
workload
Could accomplish
everything easily.
Moderate workload
Could accomplish
everything, but took some
effort.
High
workload
Could accomplish everything, but was
difficult and took considerable effort.
Assistance would not be needed.
Extreme
workload
Extremely difficult to
accomplish
everything.
Assistance would
be needed.
Accuracy: ATC area 1 100.0% ATC area 2 85.7% ATC area 3 83.3%
Based on: 3 airports, 7-8 operators per airport, 3x30min sessions for each operator
Collaborative
work with
NICTA QLD

NICTA Copyright 2010 15
Education interface / Training tool
Exploring the application of
technological approaches to
distant learning & skill learning
Collaborative
work with UNSW
Collaborative
work with AIS
NICTA Copyright 2010 16
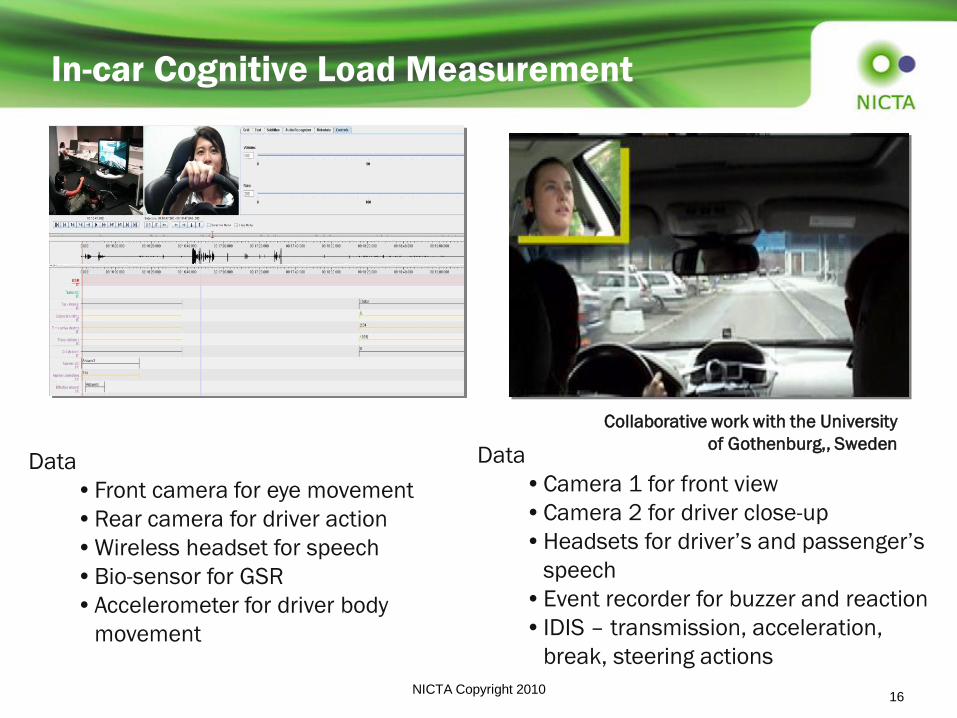
In-car Cognitive Load Measurement
Collaborative work with the University
of Gothenburg,, Sweden Data
•Front camera for eye movement
•Rear camera for driver action
•Wireless headset for speech
•Bio-sensor for GSR
•Accelerometer for driver body
movement
Data
•Camera 1 for front view
•Camera 2 for driver close-up
•Headsets for driver‟s and passenger‟s
speech
•Event recorder for buzzer and reaction
• IDIS – transmission, acceleration,
break, steering actions

NICTA Copyright 2010 17
Research Outputs
• 130 Publications (since 2005) on HCI, and Cognitive Load Modelling and Measurement – Book Chapters
– Journals
– Conferences including: CHI, IUI, INTERACT, MMSP, ICASSP and InterSpeech
• Patents – Measuring Cognitive Load (Multimodal), filed in Australia, US,
Canada.
– Measuring Cognitive Load (Speech Content Analysis), filed in Australia, US
– Speech Front Eng, filed in Australia
NICTA Copyright 2010 18
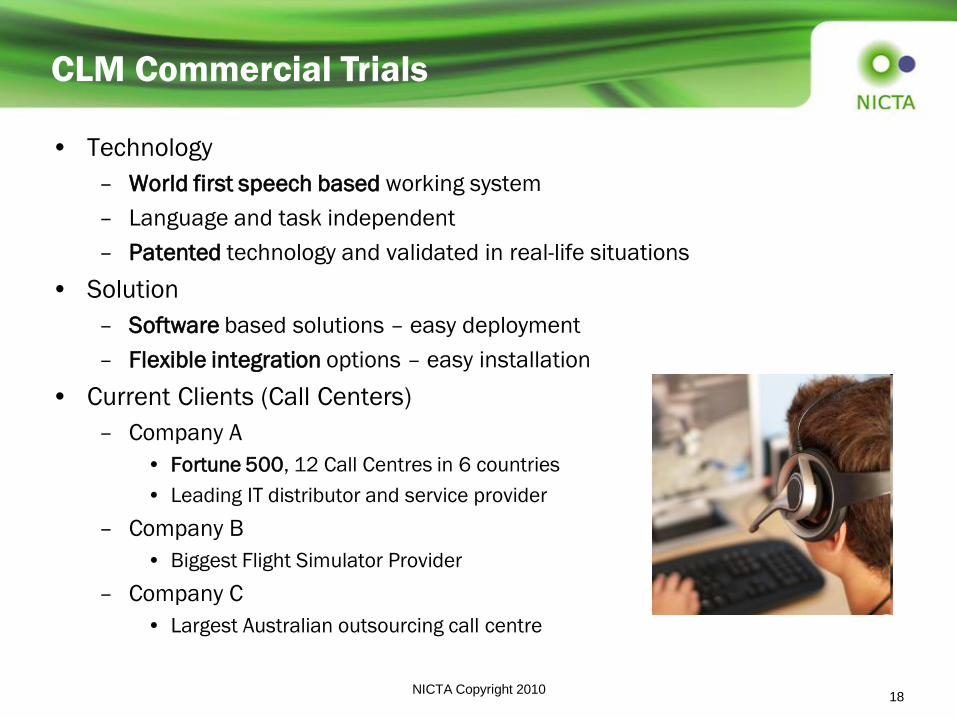
• Technology
– World first speech based working system
– Language and task independent
– Patented technology and validated in real-life situations
• Solution
– Software based solutions – easy deployment
– Flexible integration options – easy installation
• Current Clients (Call Centers)
– Company A
• Fortune 500, 12 Call Centres in 6 countries
• Leading IT distributor and service provider
– Company B
• Biggest Flight Simulator Provider
– Company C
• Largest Australian outsourcing call centre
CLM Commercial Trials

NICTA Copyright 2010 19
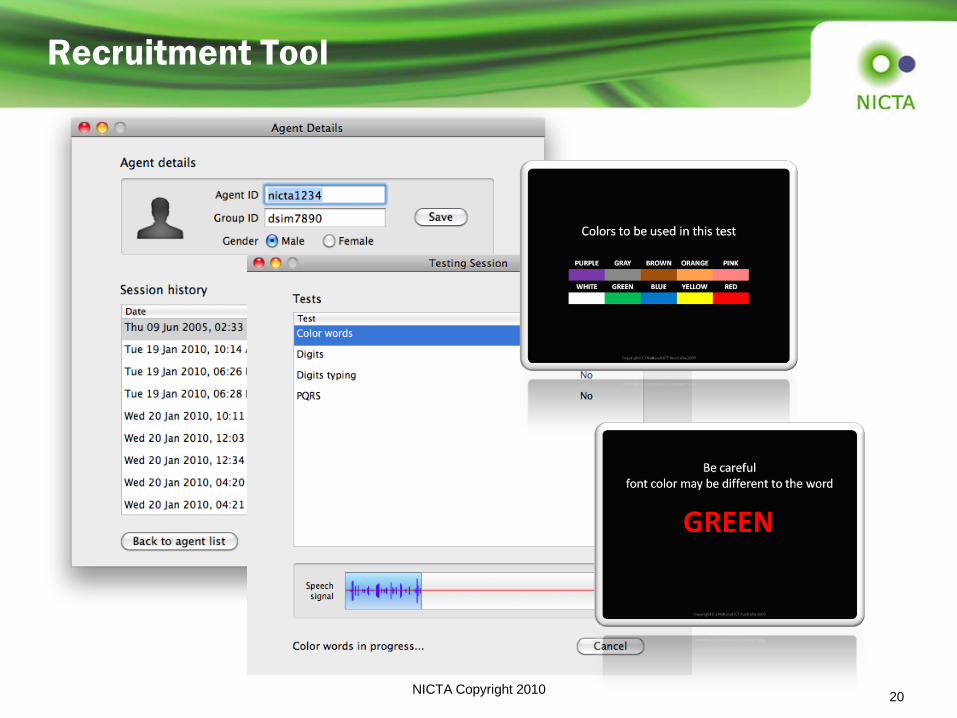
Our Solutions – BrainGauge
Solution to measure and predict agent capability as a:
• Recruitment Tool
– Assess the candidate‟s capability of performing task under high
pressure
• Capability Tracking Tool
– Identify training needs
– Ensure optimal job/task allocation
• Cognitive Load Monitoring Tool
– As a dashboard for load management
http://www.braingauge.com.au/
NICTA Copyright 2010 20
Recruitment Tool
NICTA Copyright 2010 21
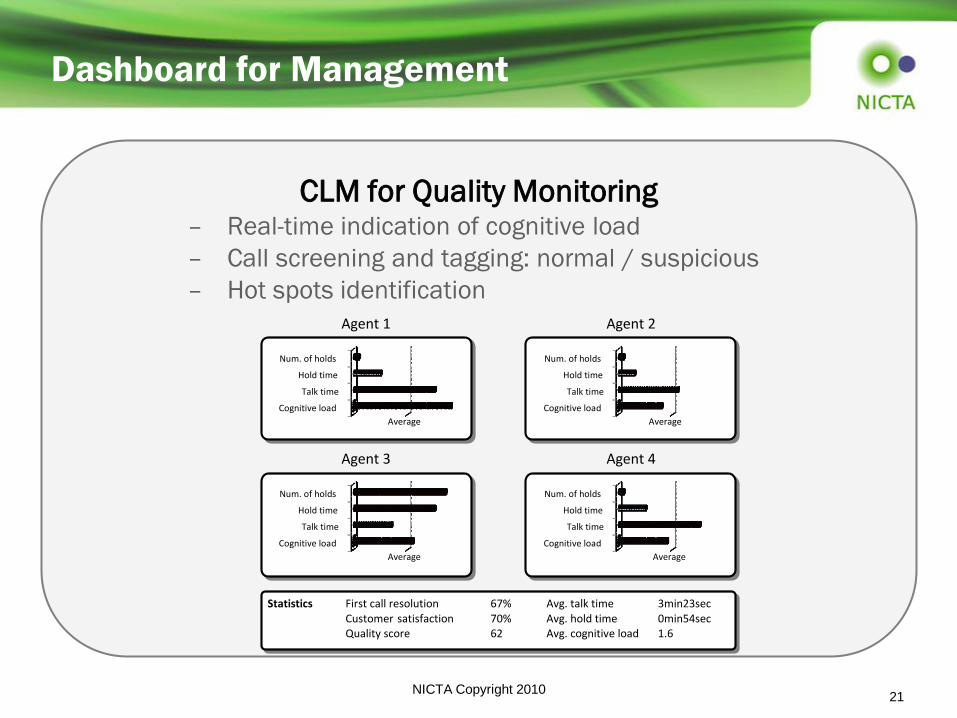
Dashboard for Management
CLM for Quality Monitoring – Real-time indication of cognitive load
– Call screening and tagging: normal / suspicious
– Hot spots identification
Cognitive load Talk time
Hold time Num. of holds
Average
Agent 1
Cognitive load Talk time
Hold time Num. of holds
Average
Agent 2
Cognitive load Talk time
Hold time Num. of holds
Average
Agent 3
Cognitive load Talk time
Hold time Num. of holds
Average
Agent 4
Statistics First call resolution
First call
67% Avg. talk time 3min23sec Customer satisfaction 70% Avg. hold time 0min54sec Quality score 62 Avg. cognitive load 1.6
NICTA Copyright 2010 22
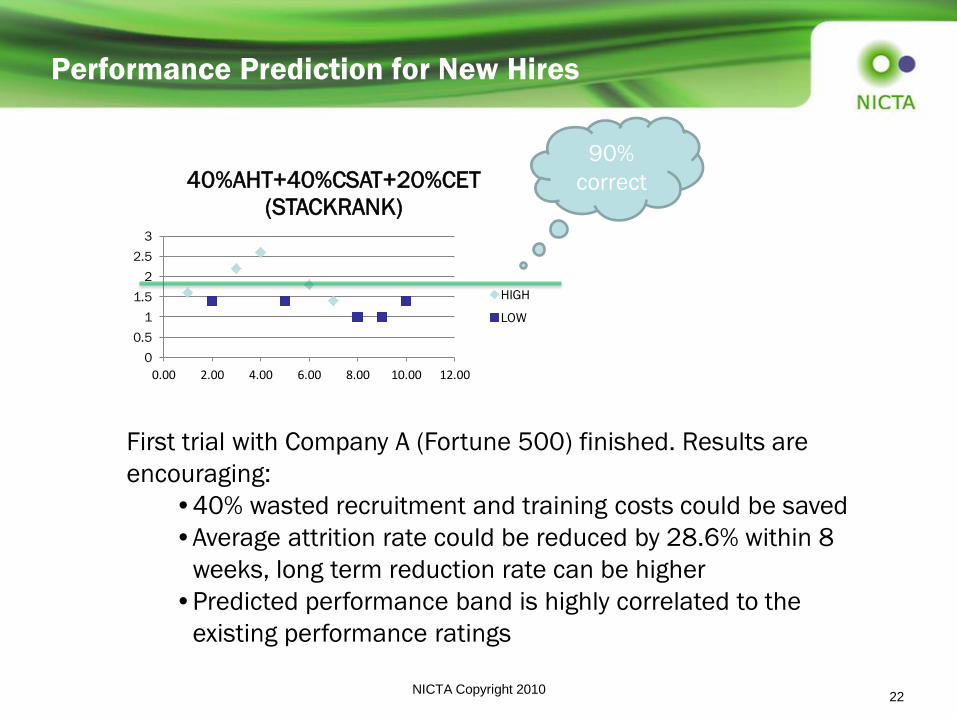
Performance Prediction for New Hires
0
0.5
1
1.5
2
2.5
3
0.00 2.00 4.00 6.00 8.00 10.00 12.00
40%AHT+40%CSAT+20%CET
(STACKRANK)
HIGH
LOW
90%
correct
First trial with Company A (Fortune 500) finished. Results are
encouraging:
•40% wasted recruitment and training costs could be saved
•Average attrition rate could be reduced by 28.6% within 8
weeks, long term reduction rate can be higher
•Predicted performance band is highly correlated to the
existing performance ratings

NICTA Copyright 2010 23
Exploring Speech Features
CLM Research

NICTA Copyright 2010 24
Speech-based Measurement
• Advantages – Passive
– Non-contact
– Easy to deploy, cost effective
– Online
• Why speech?
– Prior art shows sensitivity in the speech modality
– Non-intrusive, relatively easy to collect, e.g. phone calls, interactions, conversations
– Objective measure, not easily manipulated by the user
– Real-time analysis is possible (for some speech signal features)
– Widely available, in a number of application scenarios
• Challenges – Quantitative and consistent features
– Automatic feature extraction
– The variation of the working memory capacity among different people

NICTA Copyright 2010 25
Related Literature
• Existing research
– In 1999, Berthold investigated potential speech features which could indicate the high cognitive load in a user modelling context
• Two features, higher frequencies of sentence fragments and the decreased articulation rates, proved to be closely related to high levels of cognitive load.
– In 2001, Muller conducted a similar experiment with time pressure as the primary source of cognitive load in a navigation task
• A dynamic Bayesian network was used for learning the patterns related to speech features.
• Six speech features were utilised, including disfluencies, articulation rate, utterance content quality, number of syllables, silent and filled pauses (err/uhm etc)
– In 2006, Further investigation was carried out by Jameson, under an extra condition of background acoustic distraction
– All of them focused on feature analysis without much research on automatic measurement
NICTA Copyright 2010 26
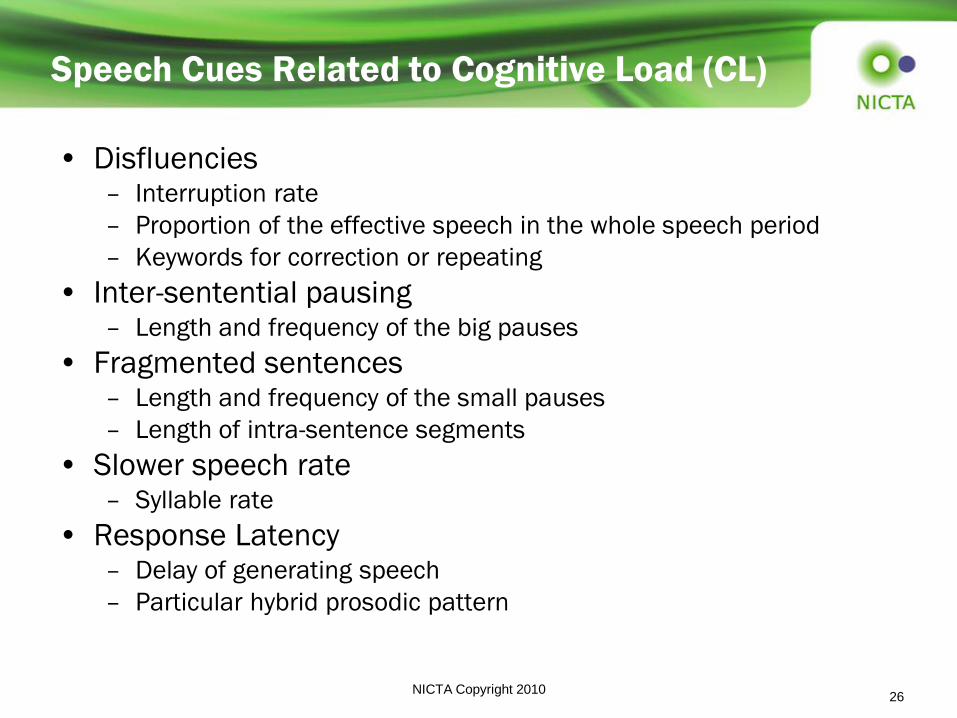
Speech Cues Related to Cognitive Load (CL)
• Disfluencies – Interruption rate
– Proportion of the effective speech in the whole speech period
– Keywords for correction or repeating
• Inter-sentential pausing – Length and frequency of the big pauses
• Fragmented sentences – Length and frequency of the small pauses
– Length of intra-sentence segments
• Slower speech rate – Syllable rate
• Response Latency – Delay of generating speech
– Particular hybrid prosodic pattern

NICTA Copyright 2010 27
Experiment Sp1
• Experimental Setup
– The task is about handling traffic accidents via voice control
– The voice control interface is designed as a keyword command
system
• Available Data
– 5 subjects
– 4 task difficulty levels for each subject
– 3 sub-tasks for each difficulty level
– For each subject, the length of all tasks is about 30 minutes, with lots
of silence
– For each action in tasks, the subject only speaks a limited number of
individual words
NICTA Copyright 2010 28
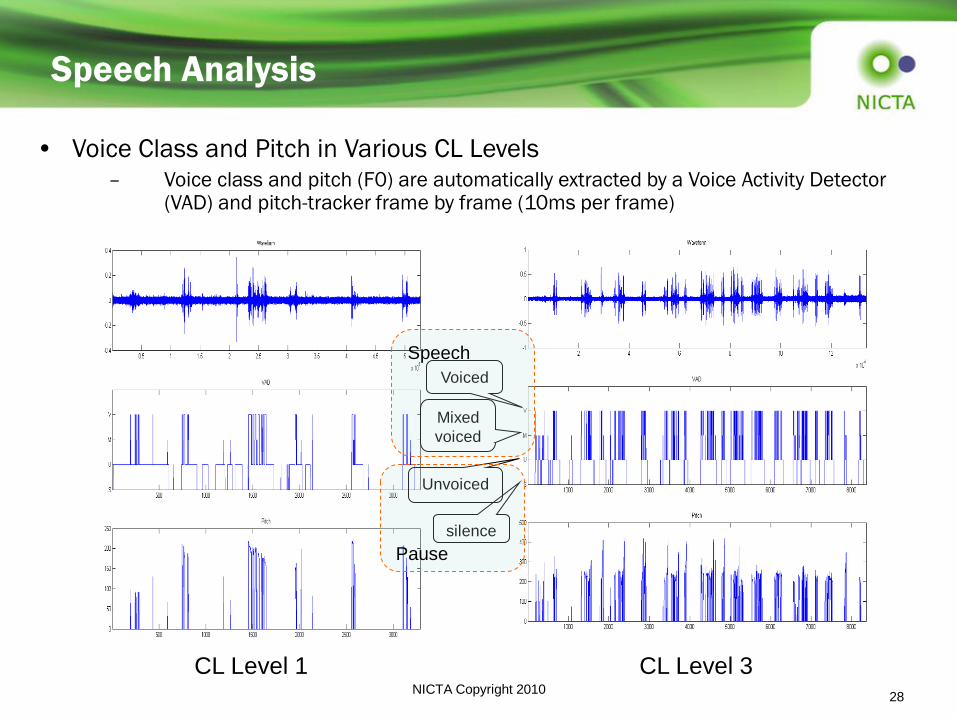
Speech Analysis
• Voice Class and Pitch in Various CL Levels – Voice class and pitch (F0) are automatically extracted by a Voice Activity Detector
(VAD) and pitch-tracker frame by frame (10ms per frame)
CL Level 1 CL Level 3
Voiced
Mixed
voiced
Unvoiced
silence
Speech
Pause

NICTA Copyright 2010 29
Speech Analysis
Descriptives
avg_norm
5 .386700 .0776803 .0347397 .290247 .483153 .2988 .4665
5 .439700 .0512980 .0229411 .376005 .503395 .3548 .4873
5 .524700 .0429227 .0191956 .471404 .577996 .4515 .5558
5 .648900 .0929231 .0415565 .533521 .764279 .5300 .7908
20 .500000 .1198338 .0267956 .443916 .556084 .2988 .7908
1.00
2.00
3.00
4.00
Total
N Mean Std. Dev iat ion Std. Error Lower Bound Upper Bound
95% Conf idence Interval f or
Mean
Minimum Maximum
• Statistics of Pause-rate

NICTA Copyright 2010 30
Descriptives
avg_norm
5 .328700 .1740147 .0778217 .112632 .544768 .0880 .4960
5 .427900 .0818800 .0366178 .326233 .529567 .3455 .5400
5 .552700 .0733850 .0328188 .461581 .643819 .5018 .6730
5 .690700 .1433840 .0641233 .512665 .868735 .5843 .9345
20 .500000 .1806638 .0403976 .415447 .584553 .0880 .9345
1.00
2.00
3.00
4.00
Total
N Mean Std. Dev iat ion Std. Error Lower Bound Upper Bound
95% Conf idence Interval f or
Mean
Minimum Maximum
Speech Analysis
• Statistics of the Rate of Pitch Peak

NICTA Copyright 2010 31
Experiment Sp2
• A user study with two controlled levels of cognitive load
– Elicit natural speech from users
The Sun
The Sun has "burned" for more than 4.5 billion years and will continue to do so for several billion more. It is a massive collection of gas, mostly hydrogen and helium. Because it is so massive, it has immense gravity, enough gravitational force to hold all of hydrogen and helium together (and to hold all of the planets in their orbits around the Sun!). The Sun does not "burn" like wood burns – it is a gigantic nuclear reactor….
• A reading and comprehension task
– General knowledge (avoid the
expertise effect)
– Reading the extract
– Answer open-ended questions
• Give a short summary of the story
in at least five whole sentences.
• What was the most interesting
point in this story?.
• Describe at least two other points
highlighted in this story.

NICTA Copyright 2010 32
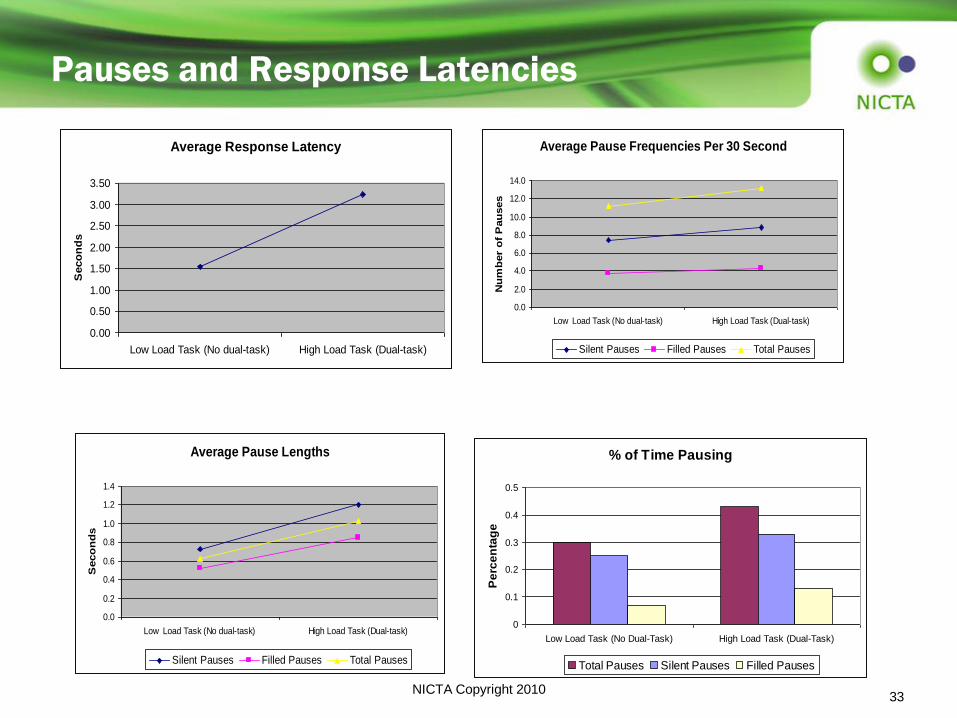
Experiment Sp2
• Cognitive Load Level Design
– Lexile Framework for Reading (200L 1st grade, 1700L grad)
• Syntactic and semantic complexity, vocabulary
– Text with same difficulty for both conditions
– Aural dual task, counting numbers during reading and answering
• Participants
– High Load Condition: with dual-task; 15 subjects
(7 male and 8 female)
– Low Load Condition: without dual-task; 9 subjects
(5 male and 4 female).
Task Load Level Lexile Rating Dual Task
Low 1300L No
High 1300L Yes
NICTA Copyright 2010 33
Pauses and Response Latencies
Average Pause Lengths
0.0
0.2
0.4
0.6
0.8
1.0
1.2
1.4
Low Load Task (No dual-task) High Load Task (Dual-task)
Seco
nd
s
Silent Pauses Filled Pauses Total Pauses
Average Pause Frequencies Per 30 Second
0.0
2.0
4.0
6.0
8.0
10.0
12.0
14.0
Low Load Task (No dual-task) High Load Task (Dual-task)
Nu
mb
er
of
Pau
ses
Silent Pauses Filled Pauses Total Pauses
Average Response Latency
0.00
0.50
1.00
1.50
2.00
2.50
3.00
3.50
Low Load Task (No dual-task) High Load Task (Dual-task)
Seco
nd
s
% of Time Pausing
0
0.1
0.2
0.3
0.4
0.5
Low Load Task (No Dual-Task) High Load Task (Dual-Task)
Pe
rce
nta
ge
Total Pauses Silent Pauses Filled Pauses
NICTA Copyright 2010 34
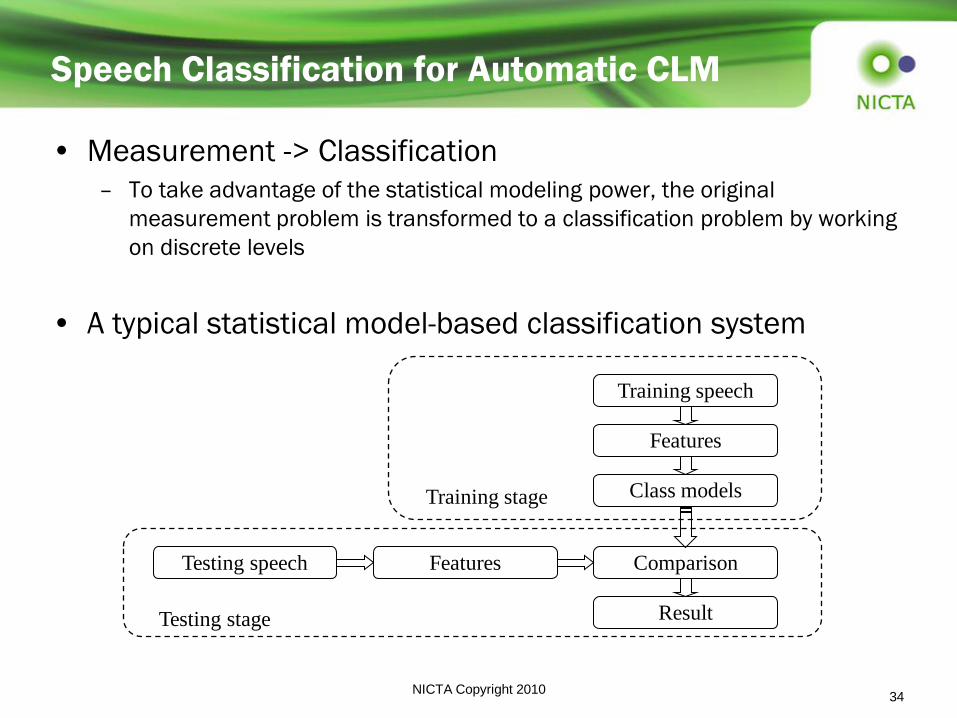
Speech Classification for Automatic CLM
• Measurement -> Classification
– To take advantage of the statistical modeling power, the original
measurement problem is transformed to a classification problem by working
on discrete levels
• A typical statistical model-based classification system
Training speech
Features
Class models
Comparison
Result
Features Testing speech
Testing stage
Training stage
NICTA Copyright 2010 35
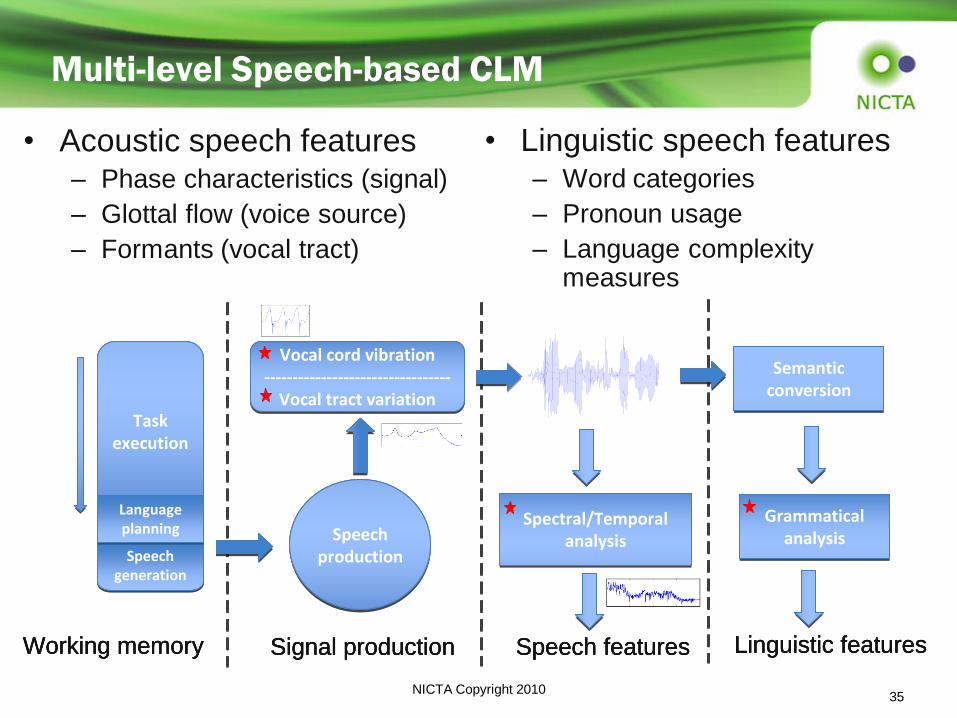
Multi-level Speech-based CLM
• Acoustic speech features – Phase characteristics (signal)
– Glottal flow (voice source)
– Formants (vocal tract)
• Linguistic speech features – Word categories
– Pronoun usage
– Language complexity measures
Task execution
Task execution
Speech generation
Speech generation
Speech production
Speech production
Vocal cord vibration---------------------------------
Vocal tract variation
Vocal cord vibration---------------------------------
Vocal tract variation
Spectral/Temporal analysis
Spectral/Temporal analysis
Working memory Signal production Speech features
Language planning
Language planning
Semantic conversion
Semantic conversion
Linguistic features
Grammatical analysis
Grammatical analysis
Task execution
Task execution
Speech generation
Speech generation
Speech production
Speech production
Vocal cord vibration---------------------------------
Vocal tract variation
Vocal cord vibration---------------------------------
Vocal tract variation
Spectral/Temporal analysis
Spectral/Temporal analysis
Working memory Signal production Speech features
Language planning
Language planning
Semantic conversion
Semantic conversion
Linguistic features
Grammatical analysis
Grammatical analysis
NICTA Copyright 2010 36
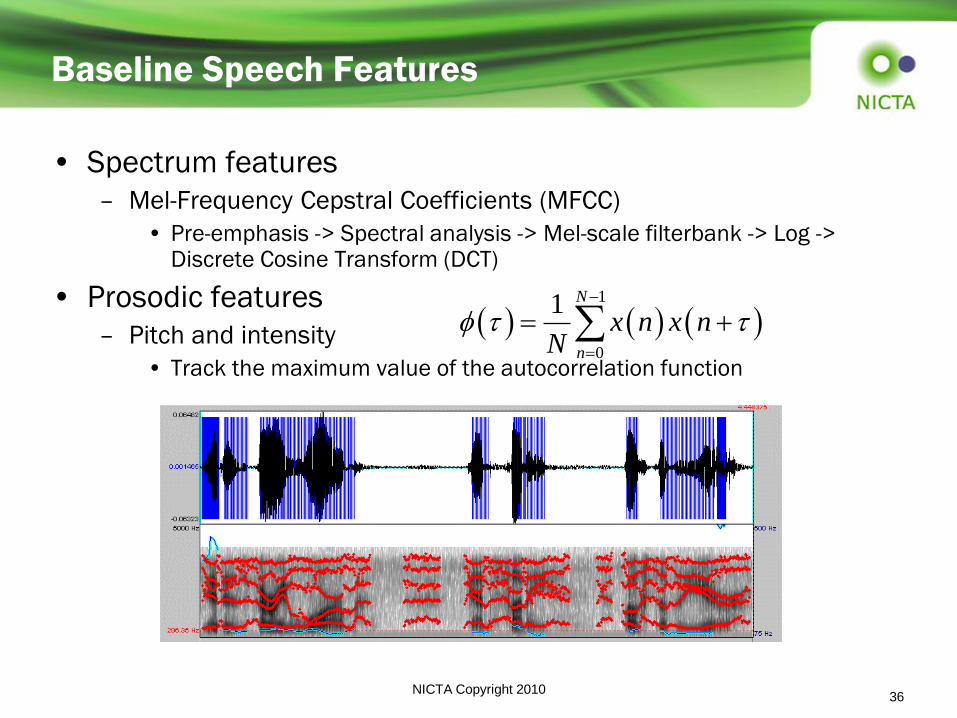
Baseline Speech Features
• Spectrum features
– Mel-Frequency Cepstral Coefficients (MFCC)
• Pre-emphasis -> Spectral analysis -> Mel-scale filterbank -> Log -> Discrete Cosine Transform (DCT)
• Prosodic features
– Pitch and intensity
• Track the maximum value of the autocorrelation function
1
0
1 N
n
x n x nN
NICTA Copyright 2010 37
Exploring Linguistic Features
CLM Research
NICTA Copyright 2010 38
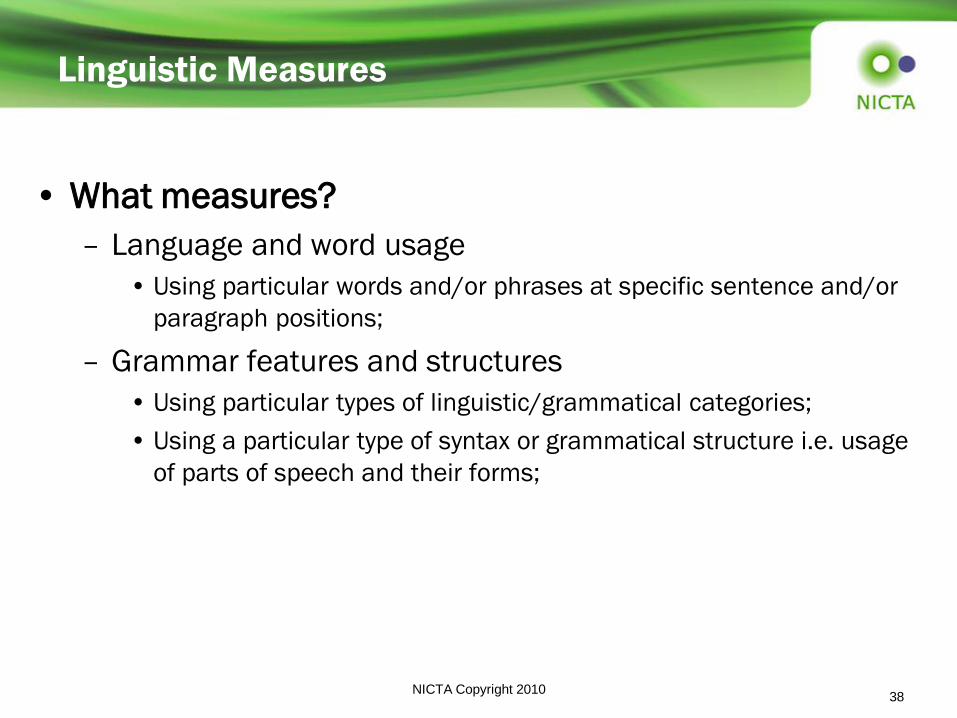
Linguistic Measures
• What measures?
– Language and word usage
• Using particular words and/or phrases at specific sentence and/or
paragraph positions;
– Grammar features and structures
• Using particular types of linguistic/grammatical categories;
• Using a particular type of syntax or grammatical structure i.e. usage
of parts of speech and their forms;

NICTA Copyright 2010 39
Bushfire Data – Some Hypotheses
• More and longer pauses under high load task.
• More use of:
– Negative emotions, swear words, perceptive and cognitive phrases,
feelings and inclusive words etc.
• Less use of:
– Positive emotions, complex words, long sentences, etc.
• More disagreements and less agreements
• More hesitations and incomplete sentences
• More use of plural pronouns and less use of singular ones.

NICTA Copyright 2010 40
Bushfire Data – Linguistic Analysis
• Linguistic word categories:
• WC: Total number of words used by the user.
• WPS: Number of words used per sentence.
• LW: Number of long words, i.e. words with at least six letters
• AW: Prepositions and Conjunction words, e.g. about, along, although, because, etc.
• NE: Words that denote negative emotions, e.g. annoy, angry, messy, sorry, stupid etc.
• Cog: Words that represent the human cognitive processes, i.e. think, consider, etc.
• Inc: Inclusive words, e.g. and, both, each, including, plus, with etc.
• Per: Perception words, e.g. vision, beauty, quite, rough, cold, etc.
• Feel: Words that denote feelings, e.g. hard, difficult, heavy, loose, sharp, tight, wet etc.
+ increasing trend, – decreasing trend

NICTA Copyright 2010 41
Bushfire Data – Linguistic Analysis
• Pronoun usage and agreement
– Singular decrease
– Plural increase
– Agreements decrease
– Disagreements increase

NICTA Copyright 2010 42
• Language complexity measures
• Measured by two major factors:
– Semantic difficulty: observes the use of words, their frequencies, and
their lengths (both in syllables as well as alphabets/characters).
– Syntactic complexity: observes primarily the sentence length, which
is considered as the best indicator of text or language complexity.
– Complexity increases
– Lexical Density decreases
Bushfire Data – Linguistic Analysis
Complexity
Measures
Sentence
Length
No of
Words Syllables
Complex
Words
Full
Comprehension
Lexical Density
Complex Word Ratio
Gunning Fog Index
Flesch-Kincaid Grade
SMOG Grade
Lexile Level

NICTA Copyright 2010 43
Fire Management Lab Experiment
• Collaborative task using TouchTable.
• 10 groups x 4 members = 40 subjects
– 30 Commanders + 10 Leaders
– 39 subjects data available (1 leader‟s data
missing)
• Speech Transcriptions completed in ELAN
format.
• Analysis completed, results are available:
– Subjective Ratings
– Pronouns
– Word Category Features
– Language Complexity

NICTA Copyright 2010 44
Results: Subjective Ratings
• ANOVA, significant for p<0.05
• t-Test, significant for p<0.05
Difficulty/Load L1 L2 L3 p
Individual 3.41 3.66 6.95 0.0000
Group 3.25 3.30 6.50 0.0000
Self Rating of Cognitive Load
3.413.66
6.95
3.25 3.30
6.50
1
2
3
4
5
6
7
8
9
L1 L2 L3
Individual
Group
Difficulty/Load Low High Diff % p
Individual 3.53 6.95 96.9% 0.0000
Group 3.27 6.50 98.8% 0.0000
NICTA Copyright 2010 45
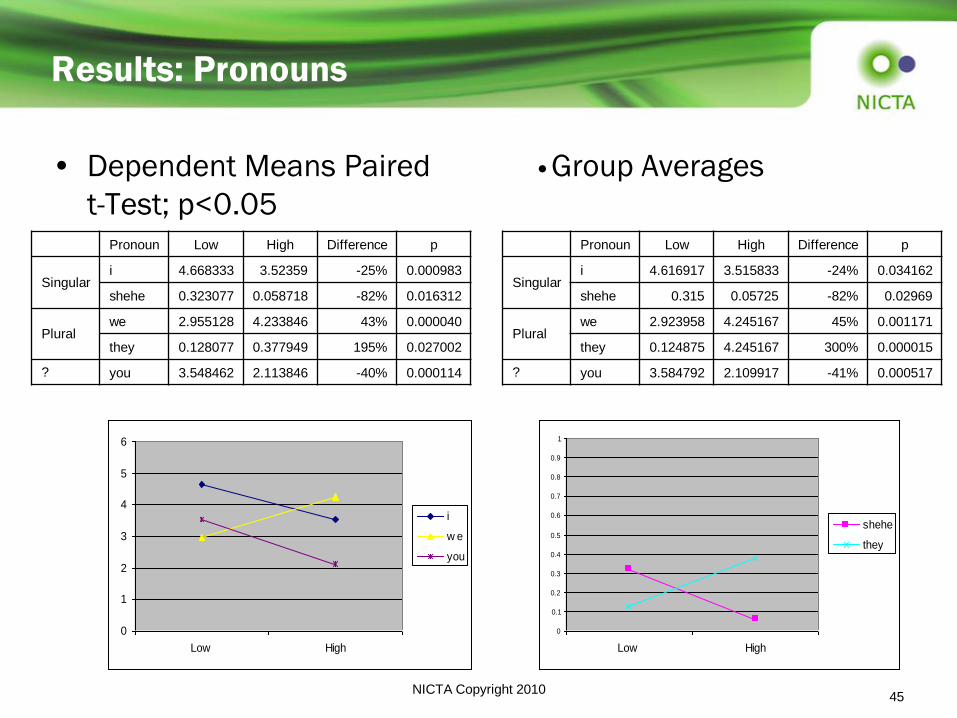
Results: Pronouns
• Dependent Means Paired ● Group Averages
t-Test; p<0.05 Pronoun Low High Difference p
Singular i 4.668333 3.52359 -25% 0.000983
shehe 0.323077 0.058718 -82% 0.016312
Plural we 2.955128 4.233846 43% 0.000040
they 0.128077 0.377949 195% 0.027002
? you 3.548462 2.113846 -40% 0.000114
0
1
2
3
4
5
6
Low High
i
w e
you
0
0.1
0.2
0.3
0.4
0.5
0.6
0.7
0.8
0.9
1
Low High
shehe
they
Pronoun Low High Difference p
Singular i 4.616917 3.515833 -24% 0.034162
shehe 0.315 0.05725 -82% 0.02969
Plural we 2.923958 4.245167 45% 0.001171
they 0.124875 4.245167 300% 0.000015
? you 3.584792 2.109917 -41% 0.000517

NICTA Copyright 2010 46
Results: Word Category Features
• Dependent Means Paired t-Test; p<0.05
• All subjects combined ● Group averages
Feature Low High Diff. % p
WC 179.20513 322.3846 79.90% 0.000000
WPS 4.7287179 6.12641 29.56% 0.000000
LW 10.045 11.16744 11.17% 0.010884
PE 5.7374359 3.816923 -33.47% 0.000006
Cog 12.176282 14.16513 16.33% 0.00066
Percept 2.3328205 3.251282 39.37% 0.002222
Feel 2.0210256 2.747692 35.96% 0.00716
AW 8.3403846 6.772564 -18.80% 0.001417
Incl 4.5896154 5.633077 22.74% 0.003247
Agree 7.3533333 5.259744 -28.47% 0.000322
Disagree 2.0671795 2.607949 26.16% 0.04693
tentative 1.4274359 1.737949 21.75% 0.104407
certain 0.4225641 0.417436 -1.21% 0.963104
NE 2.5246154 2.95641 17.10% 0.156248
swear 0.2452564 0.394615 60.90% 0.116099
achieve 1.4594872 1.133333 -22.35% 0.174984
Feature Low High Diff. % p
WC 178.02917 322.5583 81.18% 0.000006
WPS 4.7025833 6.111833 29.97% 0.000104
LW 9.9977917 11.15717 11.60% 0.052639
PE 5.7249583 3.832417 -33.06% 0.000841
Cog 12.129375 14.12717 16.47% 0.000807
Percept 2.32175 3.27425 41.03% 0.013577
Feel 2.0145 2.776083 37.81% 0.008585
AW 8.335625 6.842917 -17.91% 0.027287
Incl 4.5595833 5.639 23.67% 0.006942
Agree 7.4460833 5.363417 -27.97% 0.003938
Disagree 2.1547917 2.583667 19.90% 0.253849
tentative 1.419625 1.720333 21.18% 0.072956
certain 0.4257917 0.418 -1.83% 0.937023
NE 2.5301667 3.0115 19.02% 0.241955
swear 0.239125 0.403667 68.81% 0.167324
achieve 1.455 1.127917 -22.48% 0.327861

NICTA Copyright 2010 47
Language Complexity Measures
• Dependent Means Paired t-Test; p<0.05
• All subjects combined ● Group averages
Feature Low High Diff. % p
Lexical Density % 44.86128 32.94256 -26.57% 0.000000
Lexical Density Sampled 53.72679 48.9959 -8.81% 0.000047
Complex Words Sampled 4.128205 5.153846 24.84% 0.001933
Complex Word Ratio 0.080047 0.088346 10.37% 0.024017
Gunning Fog Index 4.946667 5.731538 15.87% 0.000003
Flesch-Kincaid Grade 0.790256 1.391282 76.05% 0.000004
SMOG Grade 6.11141 6.723077 10.01% 0.000000
Lexile Level 966.0256 1074.615 11.24% 0.040432
Feature Low High Diff. % p
Lexical Density % 44.84529 32.80858 -26.84% 0.000006
Lexical Density Sampled 53.62221 48.88183 -8.84% 0.000076
Complex Words Sampled 4.091667 5.15 25.87% 0.033549
Complex Word Ratio 0.079898 0.088423 10.67% 0.028544
Gunning Fog Index 5.016625 5.77225 15.06% 0.001852
Flesch-Kincaid Grade 0.775417 1.379833 77.95% 0.000577
SMOG Grade 6.103875 6.7215 10.12% 0.000277
Lexile Level 969 1072.167 10.65% 0.04277

NICTA Copyright 2010 48
Exploring Pen Input
CLM Research

NICTA Copyright 2010 49
Pen Input Features
• High cognitive load can be reflected in communicative signals (production)
• Symptoms of cognitive load,
– depending on the application (e.g. blackberry, tablet etc)
– Geometric and temporal features (shape and trajectory)
– Interactive features (when it is used and for what)
– Content analysis (what is being drawn)
NICTA Copyright 2010 50
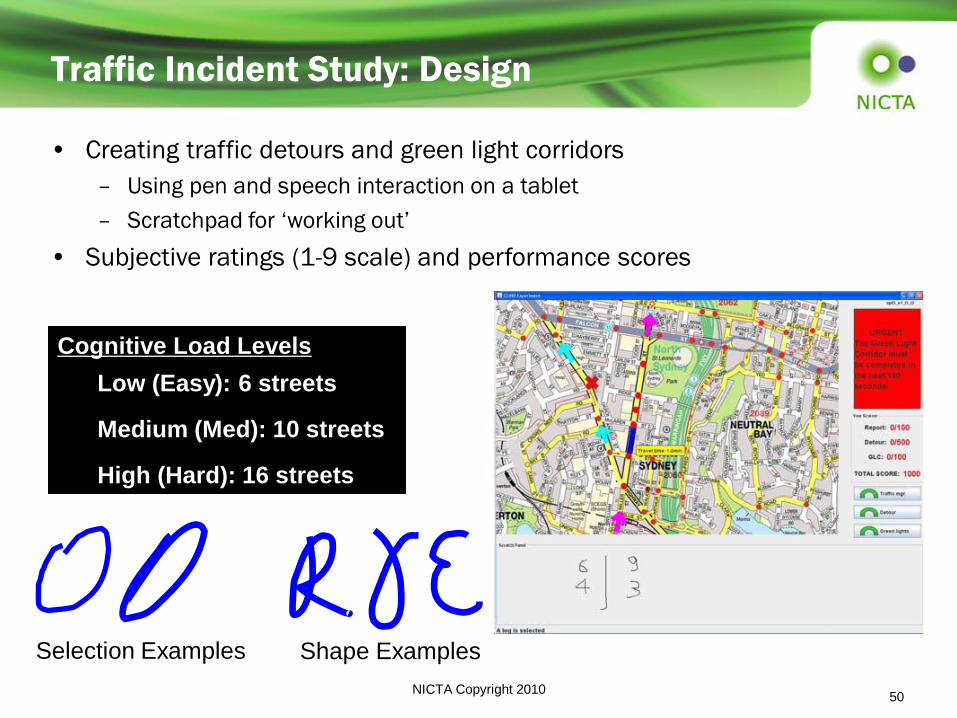
Traffic Incident Study: Design
• Creating traffic detours and green light corridors
– Using pen and speech interaction on a tablet
– Scratchpad for „working out‟
• Subjective ratings (1-9 scale) and performance scores
Cognitive Load Levels
Low (Easy): 6 streets
Medium (Med): 10 streets
High (Hard): 16 streets
Selection Examples Shape Examples
NICTA Copyright 2010 51
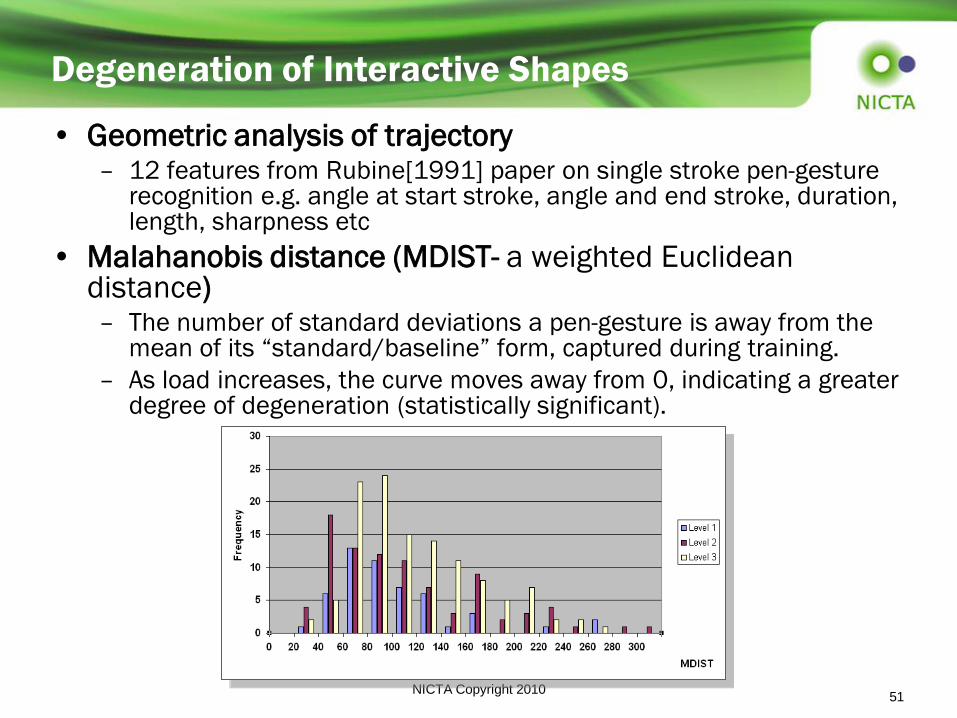
Degeneration of Interactive Shapes
• Geometric analysis of trajectory – 12 features from Rubine[1991] paper on single stroke pen-gesture
recognition e.g. angle at start stroke, angle and end stroke, duration, length, sharpness etc
• Malahanobis distance (MDIST- a weighted Euclidean distance) – The number of standard deviations a pen-gesture is away from the
mean of its “standard/baseline” form, captured during training.
– As load increases, the curve moves away from 0, indicating a greater degree of degeneration (statistically significant).

NICTA Copyright 2010 52
Use of the Scratchpad
• Scratchpad as a cognitive tool
– Use of note-taking as an external memory aid
• High usage expected during high cognitive load
– Organisational marks for understanding, clarification, planning.
– Diagramming as a strategy for generating and discarding hypotheses
– Content Analysis:
Alphanumeric -> Symbolic,
Organisational -> Diagrammatic
• Results
– Significantly increased usage ad CL increases (manual freq)
– Automated trajectory frequency count and rate per second significantly increasing
– Use of diagramming doubles between low load tasks and high load tasks (manual freq)
– Increased evidence of symbolic and organisational marks, as well as spatial representations when cognitive load is high
NICTA Copyright 2010 53
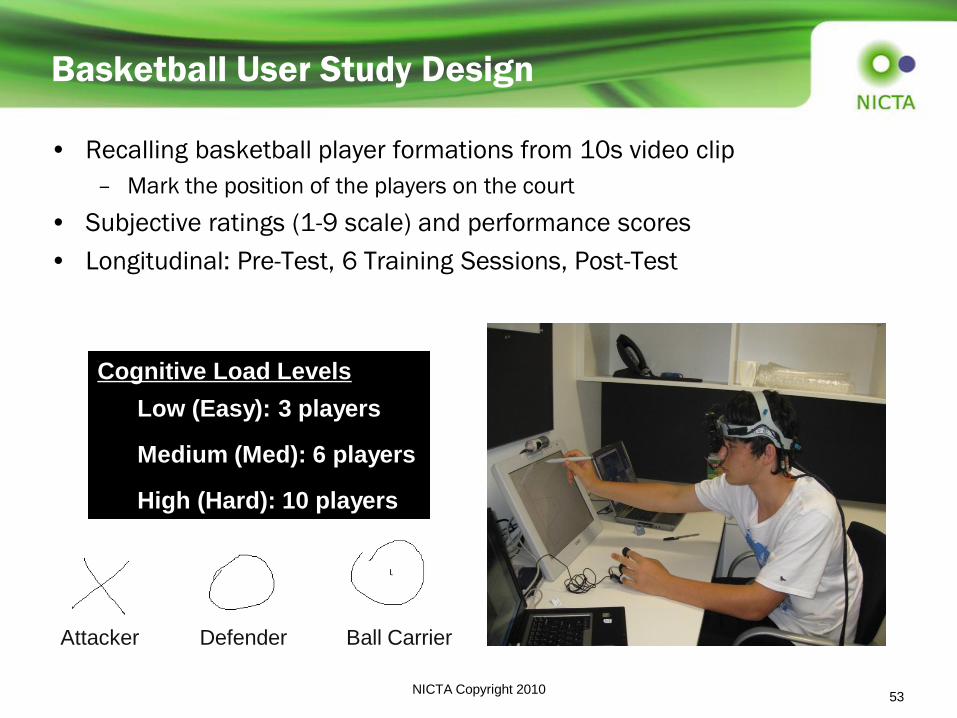
Basketball User Study Design
• Recalling basketball player formations from 10s video clip
– Mark the position of the players on the court
• Subjective ratings (1-9 scale) and performance scores
• Longitudinal: Pre-Test, 6 Training Sessions, Post-Test
Attacker Defender Ball Carrier
Cognitive Load Levels
Low (Easy): 3 players
Medium (Med): 6 players
High (Hard): 10 players

NICTA Copyright 2010 54
Basketball User Study

Pen-Input Results – Trajectory Durations
• Circles and Cross shapes
• Trajectory analysis
– Significant trends of decrease in
trajectory duration as CL ↑
– Significant trends of decrease in
trajectory velocity as CL ↑,
• Except in Ball Carrier
0.2
0.25
0.3
0.35
0.4
0.45
Low Med High
Cognitive Load
Sp
eed
(p
ixels
/ms)
Pre-Test Ball
Pre-Test Circle
Pre-Test Cross
150
200
250
300
350
400
450
500
550
600
650
Low Med High
Cognitive Load
Du
rati
on
(m
s)
Pre-Test Cross
Pre-Test Circle
Pre-Test Ball

NICTA Copyright 2010 56
Feature Analysis: Length
Hypothesis: Gesture length will
change as subjects master
the task.
Gesture length (related to gesture
duration) decreased from pre-
test to post-test.
Repeated measures ANOVA
shows significant effect of
expertise (decreasing length
from pre to post).
• Changes from Pre-test to Post-test
Defenders (Circle) - Length
0.2
50.2
100.2
150.2
200.2
250.2
LOW MED HIGH
Cognitive Loas
Du
rati
on
(m
s)
PRE
POST
0
50
100
150
200
250
pre
cross
post
cross
pre ball
carrier
post ball
carrier
Subject 8 Gesture Length
easy
medium
hard
NICTA Copyright 2010 57
Exploring Eye Movement
CLM Research

Eye Activity Results
• Video-based measure
• Low to Medium load
• As cognitive load
increases,
– Blink latency ↑
– Mean pupil size ↑
– Fixation duration ↑
– Saccade size ↓
– All significantly
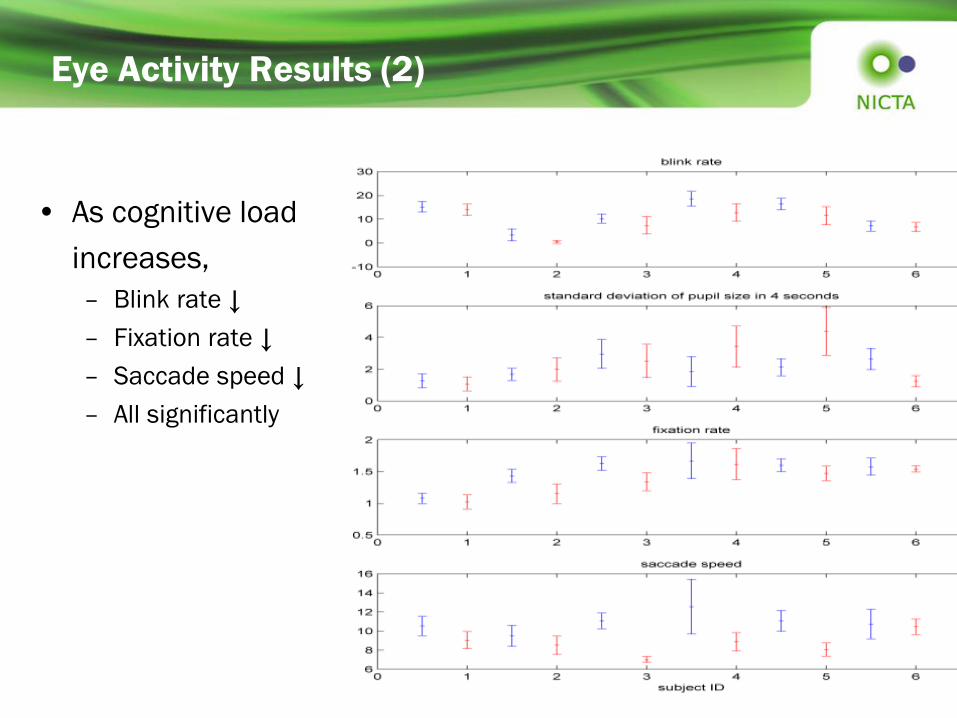
Eye Activity Results (2)
• As cognitive load
increases,
– Blink rate ↓
– Fixation rate ↓
– Saccade speed ↓
– All significantly

NICTA Copyright 2010 60
Exploring Multimodality
CLM Research

NICTA Copyright 2010 61
Experiment
• Hypothesis: – Users are more likely to use complementary multimodal productions
as cognitive load increases
– Users will tend to rely on one modality more as cognitive load increases
• Method:
– Wizard of OZ scenario:
• speech and gesture interface for a series of map based tasks;
• task increasing in difficulty by varying quantity of content and time-pressure
– Conditions for Speech Only interaction, Gesture Only interaction and Multimodal
– Videotape participants, record audio, record answers, post-hoc introspection questionnaire

NICTA Copyright 2010 62
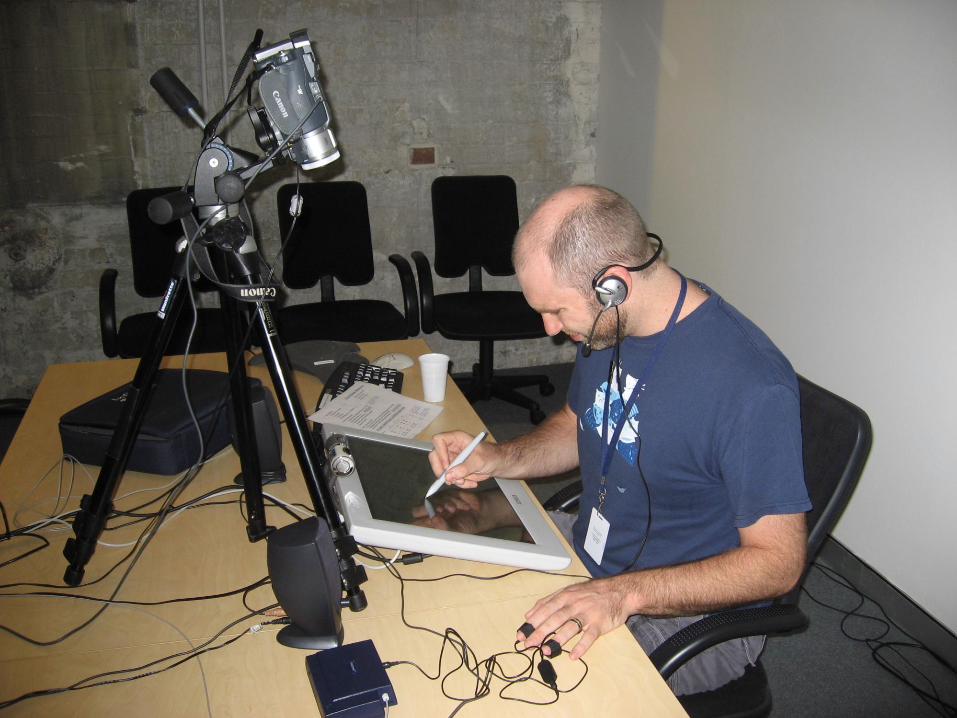
Experiment Design
• Task:
– Incident Management Response
E.g. A major accident on corner of X and Y.
– Operators are required to deploy necessary crews and implement
policies and procedures
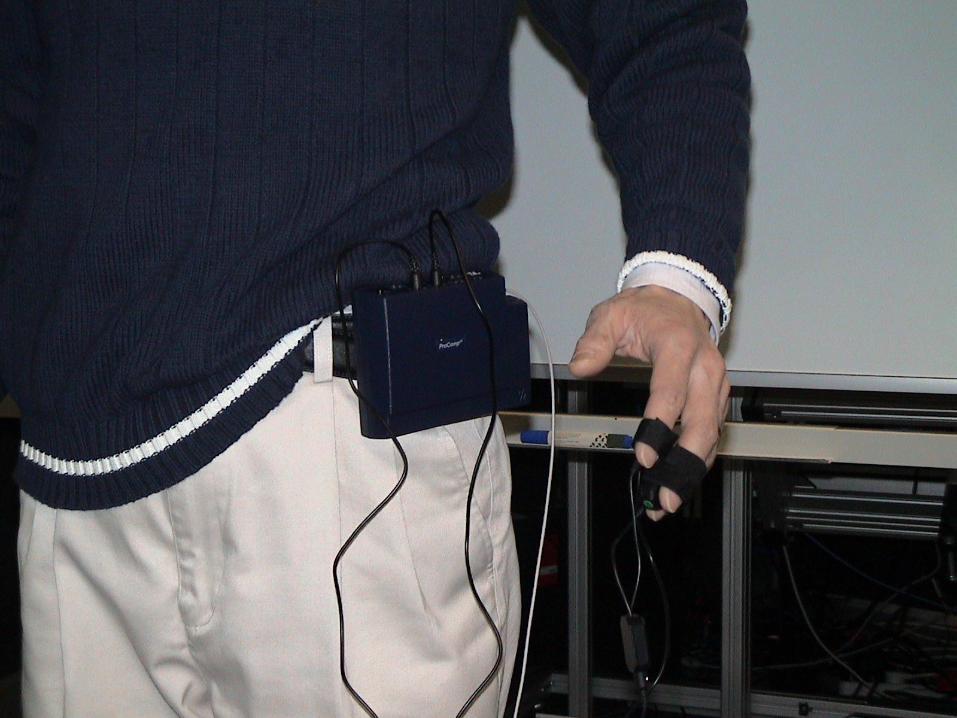
• Dependant Variables:
– Biosensor input: GSR and BVP
– Gesture: video footage
– Speech: transcribed manually
– Performance: latency, completion time & error-rates
– Multimodal productions: manual annotation

NICTA Copyright 2010 63
Experimental Setup
NICTA Copyright 2010 64
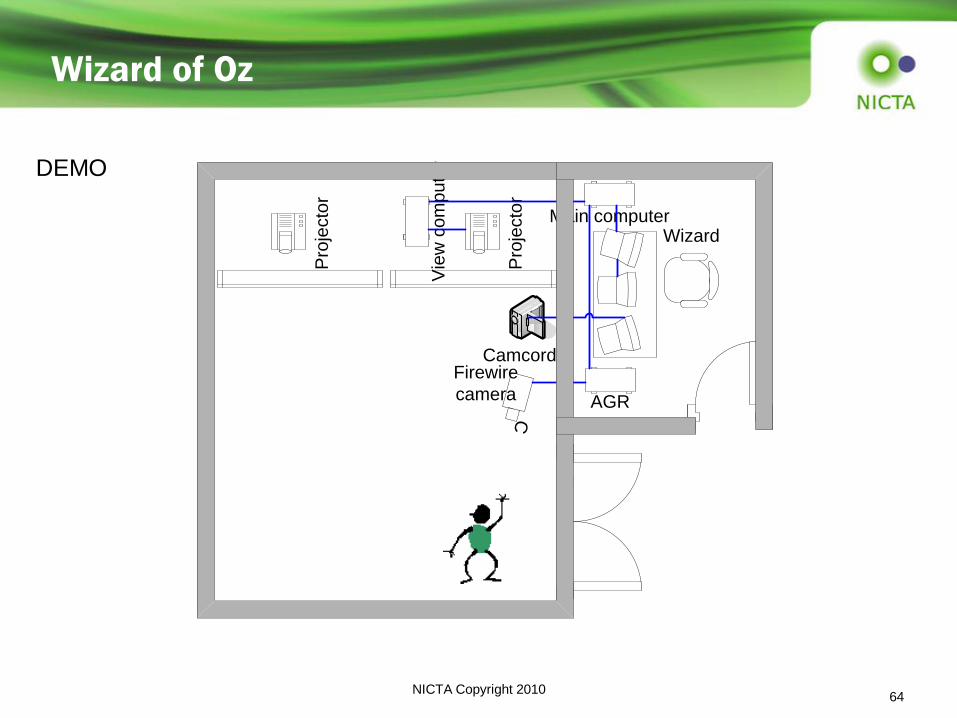
Wizard of Oz
Pro
jecto
r
Wizard
C
Firewire
camera
Camcorder
AGR
Vie
w c
om
pu
ter
Main computer
Pro
jecto
r
DEMO

NICTA Copyright 2010 65
Task Difficulty Level Design
• There were four levels of cognitive load, and three tasks were completed for each level.
• The same visual was used for each level to avoid differences in visual complexity.
• The tasks varied in load through:
– The number of distinct entities in the task description;
– The number of distractors (items not needed for the task);
– The minimum number of actions required for the task.
– Further load was achieved in Level 4 by introducing a time limit.
Level Entities Actions Distractors Time
1 6 3 2 ∞
2 10 8 2 ∞
3 12 13 4 ∞
4 12 13 4 90 sec.
NICTA Copyright 2010 66
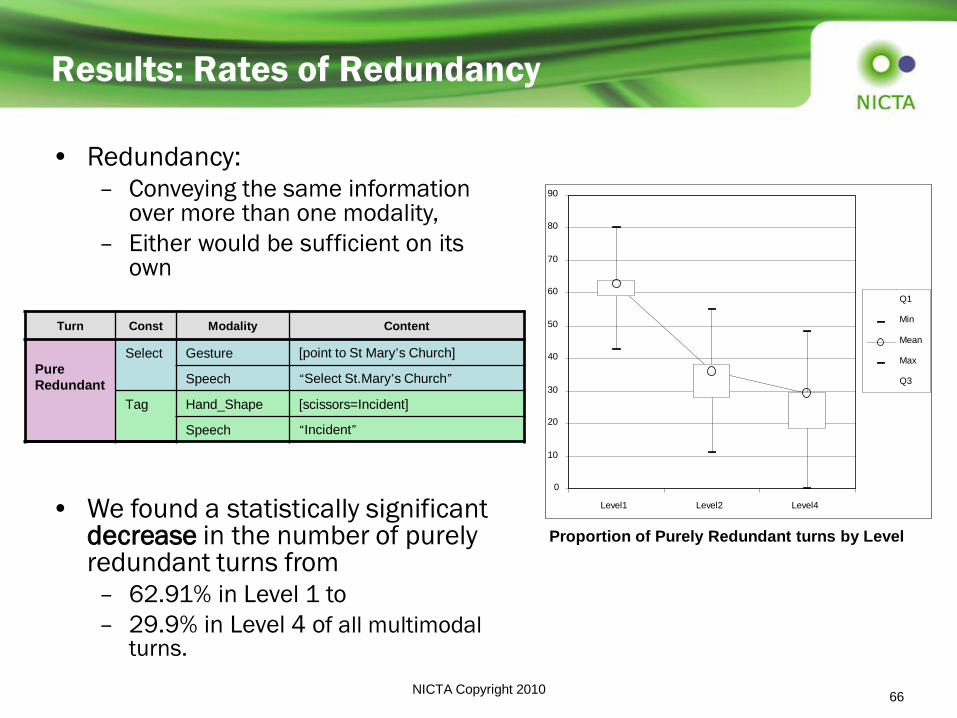
Results: Rates of Redundancy
0
10
20
30
40
50
60
70
80
90
Level1 Level2 Level4
Q1
Min
Mean
Max
Q3
Proportion of Purely Redundant turns by Level
• Redundancy: – Conveying the same information
over more than one modality,
– Either would be sufficient on its own
• We found a statistically significant decrease in the number of purely redundant turns from – 62.91% in Level 1 to
– 29.9% in Level 4 of all multimodal turns.
Turn Const Modality Content
Pure
Redundant
Select Gesture [point to St Mary‟s Church]
Speech “Select St.Mary‟s Church”
Tag Hand_Shape [scissors=Incident]
Speech “Incident”

NICTA Copyright 2010 67
Physiological Signals
CLM Research

NICTA Copyright 2010 68
NICTA Copyright 2010 69
NICTA Copyright 2010 70
NICTA Copyright 2010 71
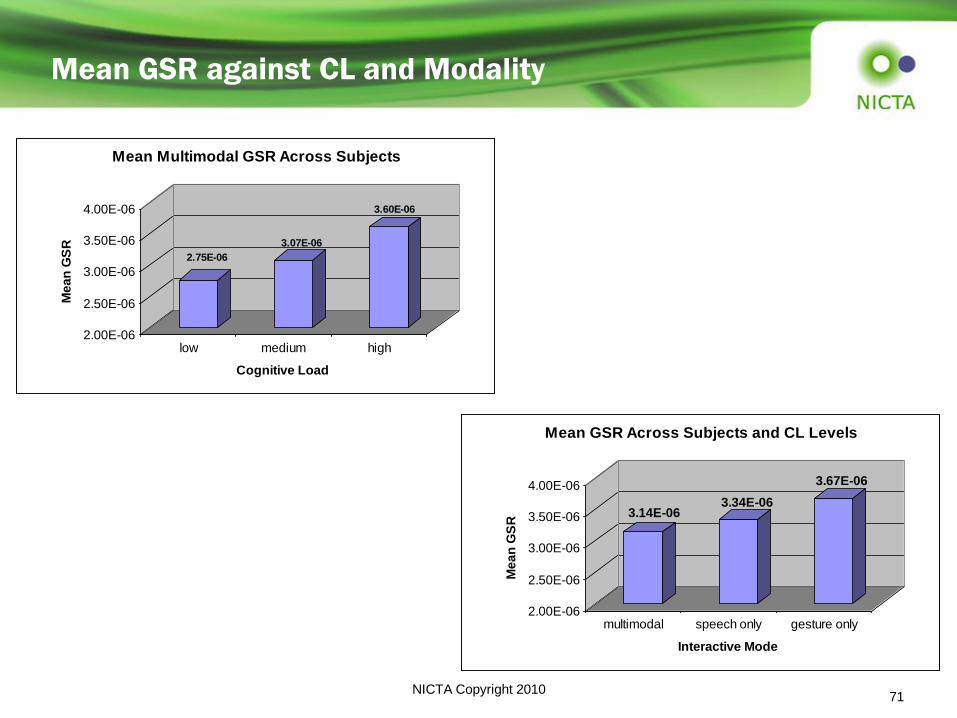
Mean GSR against CL and Modality
2.75E-06
3.07E-06
3.60E-06
2.00E-06
2.50E-06
3.00E-06
3.50E-06
4.00E-06
Me
an
GS
R
low medium high
Cognitive Load
Mean Multimodal GSR Across Subjects
3.14E-063.34E-06
3.67E-06
2.00E-06
2.50E-06
3.00E-06
3.50E-06
4.00E-06
Me
an
GS
R
multimodal speech only gesture only
Interactive Mode
Mean GSR Across Subjects and CL Levels

NICTA Copyright 2010 72
Correlation
• Correlation between GSR and “multimodal turns” within
each task.

NICTA Copyright 2010 73
Performance
Monitoring
Speech/Linguistics
What modality to
measure?
What mental state
to measure?
What can be done with
the measurement?
Pen Gesture
Eye Movement
GSR
EEG
Cognitive Load
Stress
Emotion
Arousal
……….
Performance
Prediction
Adaptive User
Interfaces
Task Complexity
Analysis
Usability
Evaluation
Cognitive
Analytics
….……
What entity to
measure?
Human
Task
System
Attention
Summary: Technology Focus
NICTA Copyright 2010 74
Summary
• Cognitive load can be determined through Multimodal
Behaviours
– Implicitly and unobtrusively
– Monitoring variations of specific multimodal features
– Assessing users‟ cognitive load through their multimodal
behaviours requires identifying a number of indices that reliably
reflect load fluctuations.
• The ability to implicitly measure the perceived level of
cognitive load means that:
– Applications could adapt the information output flow
– In a very user-centric way
– Thus achieving optimal information delivery and maintaining CL

NICTA Copyright 2010 75
Long Way to Go
• User-dependent measurement (relative to their baseline
behaviour)
• Significant semantic changes in multimodal constructions
• Correlation between physiological sensor data variation and
interactive behaviour
• Multimodal and multiple-type classifiers (fusion)
• Application independent measurement
• Real-time dynamic measurement
• …
Better Performance, Better Interface, Better Evaluation!

NICTA Copyright 2010 76
Call for Collaborations
• Accurate real-time cognitive load (mental load) measurement
• Adaptive Interfaces
• Research into “mental space” – All mental states exist in some kind of „mental state space‟
– Carefully designed experiments can theoretically isolate one mental state dimension or axis
• e.g. „cognitive load‟
• e.g. „affect‟ and „arousal‟
– Axes are interesting • e.g. is „cognitive load‟ correlated with „stress‟ ?
• Collaborative Interfaces – How team behaviours change under different levels of load
• …
Thank You


