CREW - FP7 - GA No. 258301 D4.2 1 Cognitive Radio Experimentation World Project Deliverable D4.2 Methodology for performance evaluation Contractual date of delivery: Actual date of delivery: Beneficiaries: Lead beneficiary: 31-09-12 31-09-12 IBBT, IMEC, TCD, TUB, TUD, TCS, EADS, JSI IBBT Authors: Stefan Bouckaert (IBBT), Michael Mehari (IBBT), Wei Liu (IBBT), Ingrid Moerman (IBBT), Peter Van Wesemael (IMEC), Danny Finn (TCD), Mikolaj Chwalisz (TUB), Jan Hauer, (TUB), Michael Doering (TUB), Nicola Michailow (TUD), David Depierre (TCS), Christoph Heller (EADS), Miha Smolnikar (JSI), Zoltan Padrah (JSI), Matevz Vucnik (JSI) Reviewers: Jan Hauer (TUB), Joao Paulo Cruz Lops Miranda (TCD) Workpackage: Estimated person months: Nature: Dissemination level: Version WP4 – Benchmarking the Federation 43.5 R PU 2.4 Abstract: This document describes the automated performance evaluation process and includes best practices for efficient, reliable and reproducible performance evaluation. Keywords: benchmarking, usage scenario, experimentation
Transcript
CREW - FP7 - GA No. 258301 D4.2
1
Cognitive Radio Experimentation World
Project Deliverable D4.2 Methodology for performance evaluation
Contractual date of delivery:
Actual date of delivery:
Beneficiaries:
Lead beneficiary:
31-09-12
31-09-12
IBBT, IMEC, TCD, TUB, TUD, TCS, EADS, JSI
IBBT
Authors: Stefan Bouckaert (IBBT), Michael Mehari (IBBT), Wei Liu (IBBT), Ingrid Moerman (IBBT), Peter Van Wesemael (IMEC), Danny Finn (TCD), Mikolaj Chwalisz (TUB), Jan Hauer, (TUB), Michael Doering (TUB), Nicola Michailow (TUD), David Depierre (TCS), Christoph Heller (EADS), Miha Smolnikar (JSI), Zoltan Padrah (JSI), Matevz Vucnik (JSI)
Reviewers: Jan Hauer (TUB), Joao Paulo Cruz Lops Miranda (TCD)
Workpackage:
Estimated person months:
Nature:
Dissemination level:
Version
WP4 – Benchmarking the Federation
43.5
R
PU
2.4
Abstract: This document describes the automated performance evaluation process and includes best practices for efficient, reliable and reproducible performance evaluation.
Executive Summary This deliverable describes the progress that was made on the work executed in the “benchmarking” workpackage (WP4) of the CREW project. Although the main focus of the benchmarking activities in the second year of the CREW project was on the automated performance evaluation process and best practices for efficient, reliable and reproducible performance evaluation, we also continued work and discussions on the generic benchmarking framework, which resulted in an update and upgrade of existing concepts, frameworks and tools.
During the second year of the CREW project there was a clear evolution of the benchmarking concepts introduced in the first year:
• On the conceptual level, benchmarking has been approached as a black box with an input side for defining the experiment (which includes the system under test and the wireless (background) environment), a control interface to the testbed and an output side for performance evaluation, responsible for collecting, processing and comparing results.
• At the implementation level, the developer’s representation of the benchmarking framework (as defined in year 1), is now complemented with a benchmarking flow from an experimenter’s point view. The main steps in the benchmarking flow are: (1) definition of experiment; (2) provisioning of testbed, scheduling and execution of experiments; (3) collection, processing and comparison of results; and (4) sharing of results/configurations/background environments/metrics. The experimenter’s point of view, although it has the same functional blocks as the developer’s representation, reflects much better the experimentation methodology.
Several extensions have been implemented to support the experimenters in setting up and executing benchmark experiments:
• CREW repository: this online repository has been established for sharing different types of data between experimenters, such as full experiment descriptions, traces (e.g. traffic, interference), wireless background environments, processing scripts for converting output to the CREW common data format, performance and benchmarking scores.
• Automated performance evaluation, which allows intelligent scheduling of multiple experiments and automated quality assessment. To this end a new interface has been designed, enabling seamless combination of experiment definition, configuration of parameters, provisioning of testbed, scheduling & execution of experiments, processing of results and quality check of the experiment (eliminating non-reliable experiments).
The intelligent scheduling of multiple experiments enables experimenters to execute an automatic parameter space optimization by selecting objective parameters (to be varied and optimized during the experiment) and performance parameters (to be measured during the experiment) through an intuitive web interface. The intelligent scheduling allows achieving a maximum number of results with a minimum number of experiments.
The automated quality assessment of an experiment is based on the joint evaluation of stability and validity. The stability assessment refers to repeatability and is evaluated through cross-correlation between repeated experiments. Validity assessment involves the filtering of unreliable experiments through interference monitoring (using distributed spectrum sensing) before, during and after an experiment. Thanks the automated quality assessment, the reliability of experiments can be much improved.
In line with the benchmarking flow (from an experimenter’s point of view) and based on the experimentation experiences gained in the CREW consortium, both general and testbed/cognitive component specific best practices (or experimentation methodologies) have been defined for experimental performance evaluation of cognitive radio and/or cognitive networking concepts. The general experimentation methodology is applicable to all CREW facilities, while the testbed/component specific best practices give additional guidelines for experimentation using an
2.2.1 Towards an experimenter oriented representation and methodology .......................................... 11 2.2.2 Supporting the experimenter through the CREW repository ....................................................... 13 2.2.3 Advances in the benchmarking implementation .......................................................................... 14
3 Automated performance evaluation ................................................................. 15 3.1 Functional blocks of the benchmarking implementation .................................................... 15
4 Best practices for experimental performance evaluation .............................. 29 4.1 General experimentation methodology ................................................................................. 29
4.1.1 To experiment or not? Determine the appropriate solution for performance evaluation. ........... 30 4.1.2 Design and specify the experiment .............................................................................................. 31 4.1.3 Running the experiment(s) ........................................................................................................... 33 4.1.4 Processing experimental results ................................................................................................... 33 4.1.5 Storing and publishing experimental results ................................................................................ 33
4.2 Testbed/cognitive component specific best practices ........................................................... 34 4.2.1 Experiments using IBBT w-iLab.t ............................................................................................... 34 4.2.2 Experiments using the IMEC sensing engine ............................................................................... 35 4.2.3 Experiments using IRIS and the CR testbed at TCD ................................................................... 35 4.2.4 Experiments using TWIST at TUB .............................................................................................. 36 4.2.5 Experiments using the LTE/LTE advanced testbed at TUD ........................................................ 37 4.2.6 Experiments using LOG-a-TEC testbed (JSI) .............................................................................. 37
CREW - FP7 - GA No. 258301 D4.2
7
4.2.7 Experiments using the TCS sensing platform .............................................................................. 38 4.2.8 Experiments using EADS Aircraft Cabin Mock-Up .................................................................... 39
1 Introduction This deliverable describes the progress that was made on the work executed in the “benchmarking” workpackage (WP4) of the CREW project. Among the realizations of WP4 in the first year of the CREW project were the definition of basic concepts of wireless and cognitive benchmarking, and the initial development of a generic benchmarking framework (which is the work that was done in Task 4.1 and Task 4.2). For more details on this initial work, the reader is referred to CREW deliverable D2.2, Section 3.5. For specific use cases and internal usage scenarios, D4.1 later provided a set of experimentation scenarios and metrics, which served as an illustration of how cognitive radio (CR) experiments can be accurately described, both in terms of the specific details of experimental set-ups (i.e. which nodes are involved in the experiments, what is the topology of the nodes, what technologies are involved in an experiment…) and in terms of how to measure the outcome of experiments (i.e. a (combination of) performance metrics).
The benchmarking work that was done in year 2 of CREW mainly focuses on Task 4.3, although also some further work was done in Task 4.2. The benchmarking activities during the second year can roughly be categorized in three classes. Firstly, the continued work and discussions resulted in an update and upgrade of existing concepts, frameworks and tools; secondly, from an implementation point of view, new more intuitive and more interoperable tools as well as extended functionality is offered, among other things by providing the experimenter the means for automated performance evaluation; thirdly, from a methodological point of view, a set of best practices was generated based on further experimentation experiences gathered in the CREW consortium.
This deliverable builds on concepts and definitions introduced in the relevant sections of CREW deliverable D2.2. However, this document is written in such way that it can serve as a standalone reference document for those experimenters interested in the concepts of benchmarking, in best practices for executing wireless networking experiments in general and CR /cognitive networking (CN) experiments in particular.
The remainder of this document is structured as follows: Section 2 discusses the current state of the benchmarking concepts, frameworks and tools. Next, Section 3 zooms in on the role and use of automated performance evaluation in benchmarking. Before concluding in Section 5, Section 4 presents best practices for experimental performance evaluation of CR/CN concepts.
CREW - FP7 - GA No. 258301 D4.2
9
2 Evolution of the CREW benchmarking concepts
2.1 Basic benchmarking concepts The basic concepts of benchmarking that are explained in this section provide a concise summary of those benchmarking concepts previously introduced in deliverable D2.2.
After internal CREW discussions and discussions with representatives from other FIRE projects in [1], we previously defined benchmarking as “The act of measuring and evaluating computational performance, networking protocols, devices and networks, under reference conditions, relative to a reference evaluation”. This definition remains still valid, and also the goal remains unchanged: the goal of benchmarking of wireless (cognitive) networks is to enable fair comparison between different solutions or between subsequent developments of a system under test (SUT).
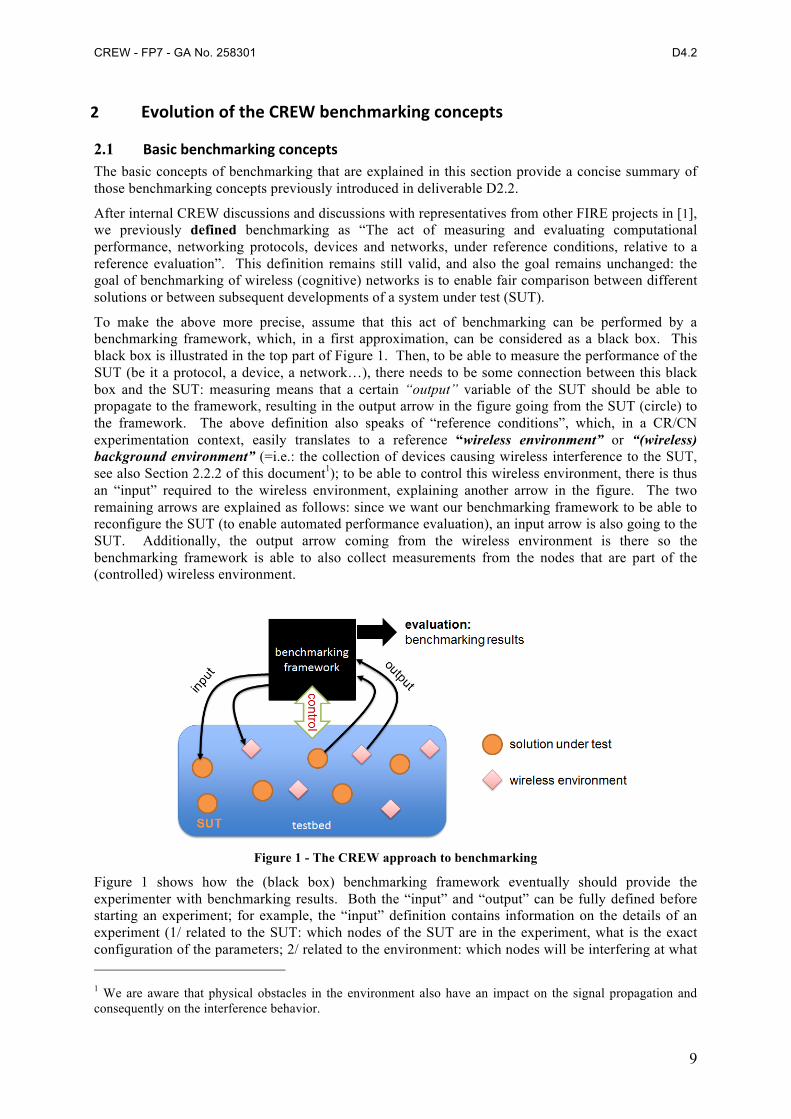
To make the above more precise, assume that this act of benchmarking can be performed by a benchmarking framework, which, in a first approximation, can be considered as a black box. This black box is illustrated in the top part of Figure 1. Then, to be able to measure the performance of the SUT (be it a protocol, a device, a network…), there needs to be some connection between this black box and the SUT: measuring means that a certain “output” variable of the SUT should be able to propagate to the framework, resulting in the output arrow in the figure going from the SUT (circle) to the framework. The above definition also speaks of “reference conditions”, which, in a CR/CN experimentation context, easily translates to a reference “wireless environment” or “(wireless) background environment” (=i.e.: the collection of devices causing wireless interference to the SUT, see also Section 2.2.2 of this document1); to be able to control this wireless environment, there is thus an “input” required to the wireless environment, explaining another arrow in the figure. The two remaining arrows are explained as follows: since we want our benchmarking framework to be able to reconfigure the SUT (to enable automated performance evaluation), an input arrow is also going to the SUT. Additionally, the output arrow coming from the wireless environment is there so the benchmarking framework is able to also collect measurements from the nodes that are part of the (controlled) wireless environment.
Figure 1 - The CREW approach to benchmarking
Figure 1 shows how the (black box) benchmarking framework eventually should provide the experimenter with benchmarking results. Both the “input” and “output” can be fully defined before starting an experiment; for example, the “input” definition contains information on the details of an experiment (1/ related to the SUT: which nodes of the SUT are in the experiment, what is the exact configuration of the parameters; 2/ related to the environment: which nodes will be interfering at what 1 We are aware that physical obstacles in the environment also have an impact on the signal propagation and consequently on the interference behavior.
CREW - FP7 - GA No. 258301 D4.2
10
time, what interference or traffic pattern will they transmit, etc.). The “output” definition can, for example, contain information on which characteristics of the SUT or the wireless nodes that are part of the environment are measured. Since the benchmarking framework should be able to set-up and control the defined experiments, there is also a double “control” arrow added to Figure 1, indicating the APIs needed to actually set up and control experiments in a given testbed.
To summarize the above, now from the perspective of the black box benchmarking framework, there are basically three very relevant parts to the benchmarking framework:
• An input side, defining in detail what a particular experiment (or set of experiments) should look like. This includes the definition of the SUT, the background environment and the characteristics to be monitored/measured. Note that the “input”, as described under this bullet, covers both the input and output arrow listed in Figure 1.
• A control part, through which the framework interfaces with a specific testbed. In case the benchmarking framework is used for automated performance evaluation, it is also the control part that is responsible for taking the right decisions.
• An evaluation part, where the collected results are processed and made available to the experimenter. The results can be either (a set of) performance metrics, or a combination of several metrics into a single value, called a score. Additionally, the evaluation part of the framework should take care of validation of the experiments and help the experimenter to filter out any results that are not valid (e.g. because of errors induced by the testbed, because of unwanted interferers, because the output from several identical experiments is significantly different.)
Benchmarking also means comparing solutions that may be designed by different organizations; fair performance comparison means that a third party has to be able to repeat experiments (in the same lab environment), or -to the extent possible when considering wireless networks- reproduce it (in a different experimentation environment). As such, all ingredients (input, evaluation) of a specific benchmarking experiment should be carefully logged and (in case of open research) shared with the research community. This immediately explains the use of a common data format for sharing the “benchmarking ingredients”: a structured way of logging/sharing the input settings and evaluation criteria of an experiment, simplifies the understanding and re-usability of experiments.
As a final introductory note: in the scope of CREW, the benchmarking efforts are targeted at determining the performance of CR and CN protocols and systems, using the CREW facilities. While CREW provides several federated components (see the work that is done as part of WP3), the individual CREW testbeds at the different partner’s sites are of heterogeneous nature in terms of control frameworks and in terms of wireless/cognitive technologies. From the benchmarking WP perspective, this heterogeneity brings a certain complexity when it comes to building a “generic framework”: on one hand, the CREW benchmarking techniques and frameworks should be sufficiently generic, as to guarantee compatibility with the different CREW testbeds and potentially also with non-CREW testbeds. On the other hand, when advanced interaction is required between a benchmarking framework and a specific testbed, the benchmarking solutions and frameworks should be detailed enough to be meaningful.
CREW - FP7 - GA No. 258301 D4.2
11
2.2 CREW benchmarking framework
2.2.1 Towards an experimenter oriented representation and methodology As a reminder, Figure 2 shows the original design of the benchmarking framework.
Common data format
Test case
Benchmarking framework
Scenarios
Capability control
Resource descriptors
Testbed
Resources
Functional description
Parametersand tracessubset
Benchmarkcontrol
Datastore
Common result format
Metrics
measure
execute
Control descriptors
Benchmarkscores
Result feedback
Criteria select
TESTBED
Resource manager
Resources Resources
Gen
eric
com
pone
nts
Ada
ptor
sTe
stbe
d sp
ecifi
c co
mpo
nent
s
Log translation
transfer
Figure 2 - Original CREW benchmarking framework [see D2.2]: a developer’s POV
Although this benchmarking framework introduced in D2.2 remains valid, from discussions in the second year of CREW –inside the consortium and at events- this specific representation was found to sometimes cause confusion when first introduced, because the level of detail in the different functional blocks. In fact, this original representation reflects a developer’s point of view, which is not (always) of primary interest to the users of the framework who are experimenters rather than developers. Since a benchmarking framework is not a goal but a means to support the experimenter in his/her goal of evaluating a solution, an important goal of the year 2 developments was to make the benchmarking concept -and especially its concrete relevance to CREW experimenters- more clear.
Therefore, in addition to the developer’s representation of the benchmarking framework in Figure 2, consider the representation in Figure 3. The latter figure shows an abstraction of the framework, now explained from an experimenter’s point of view. Following the benchmarking concepts means
CREW - FP7 - GA No. 258301 D4.2
12
taking these four steps: defining an experiment, executing the experiment(s), getting and processing results, and sharing the results with those parties interested (whether this is a scientific peer group in case of a scientific publication, or, for example, a decision maker in a company deciding on the next steps of a particular solution under development). These four steps are also at the core of the experimentation methodology that will be fully explained in Section 4.1.
Figure 3 - Benchmarking flow from an experimenter's point of view
It is possible to follow the flow (or high-level methodology) of Figure 3 “manually”, without the support of any testbed or testbed tools. Consider the different subtasks in the “experiment definition step”. From Section 2.1 it is clear that to enable repeatability an experimenter should carefully take note of the SUT configuration, the wireless environment, and the performance metrics that will be considered. Once the experiment is fully defined, it can be executed in a suitable CREW testbed island. Alternatively, the experiment can be run in a custom test set-up, although this is far less efficient, more error-prone and makes the experiment more difficult to repeat. It is possible to meticulously configure a test set-up or configure a testbed manually (step 2), get and process the results manually (step 3) and share them (step 4). The results of following this methodology manually may obviously be very valid and can also (manually or via a custom script) be converted in a common result format.
However, a far more convenient way of achieving the same or even a better quality of experiments yet in a lot less time and with less effort, is by making use of the CREW benchmarking framework implementation. Again from an experimenter’s point of view, Figure 4 shows the functional blocks of the benchmarking framework to the left of the benchmarking flow. Indeed, from an experimenter’s point of view, the benchmarking framework enforces an experimentation methodology that is simplified and supported through a set of experimentation tools (shown to the left). These tools help the experimenter to efficiently determine the performance of a certain SUT.
STEP 1. define experiment
SUT configuration (topology, nodes, applications)
select or define wireless
environment
select or define performance metric(s)
STEP 2. provision testbed, schedule and execute experiment(s)
STEP 3. get/process/compare results
STEP 4. share results and/or new configurations, background environments, metrics
CREW - FP7 - GA No. 258301 D4.2
13
The functional blocks shown under “CREW benchmarking tools” are the following:
• Easy experiment definition: tools are provided to allow experimenters to set up their experiments (both SUT configuration as well as the creation/adaption of wireless background environments). The tools also allow experimenters to save the description of their experiment in a common data format, thus simplifying repeatability and reproducibility.
• Configuration of parameters: in a lot of cases, experimental performance evaluation will require the experimenter to change parameters in between different runs of an experiment (e.g. change the “channel” setting of a device, configure the sensing time vs. transmission time of a device…). A part of the benchmarking toolset can take care of defining multiple experiments (with varying parameters) automatically. Varying input parameters for the experiment can be done based on the outcome of one or multiple experiments, e.g. with the aim to optimize a certain output variable.
• Provisioning, scheduling and executing experiments can also be automated. This is especially relevant when scheduling a large set of experiments, possibly with varying input parameters (see the above bullet).
• Processing results and verifying the quality: manually processing and verifying the validity of results may take a lot of time. The CREW benchmarking tools can be used to process results in an efficient way, and, more importantly, to verify the validity of results based on correlation of the results of several runs of an experiment, and on the information provided by dedicated spectrum sensing devices (see Section 3).
By using these benchmarking tools, the experimenter can decrease the time needed to experiment, while generating results of high quality.
2.2.2 Supporting the experimenter through the CREW repository On the right part of Figure 4, it can be seen that an additional resource was added to support experimenters in setting up and executing benchmark experiments: as also briefly mentioned CREW deliverable D3.2, but repeated here for clarity reasons, a CREW repository was added to the CREW portal. The repository contains a collection of data of different types, that are believed to be of use to experimenters while doing their experiments in the in the field of CR and CN. Several types of data are found in the CREW repository:
• full experiment descriptions: when reading reports containing experimental results, it is often difficult or impossible to verify the claims of the author or to use the experiment as a base for further research. Full experiment descriptions contain all information needed to run a particular experiment. By publishing full experiment descriptions, we aim for more
CREW repository @
CREW portal
select
CREW benchmarking tools / automation
easy experiment definition
configure parameters
provision, schedule, execute
process & check quality
format output data, show results
populate
STEP 1. define experiment
SUT configuration (topology, nodes, applications)
select or define wireless
environment
select or define performance metric(s)
STEP 2. provision testbed, schedule and execute experiment(s)
STEP 3. get/process/compare results
STEP 4. share results and/or new configurations, background environments, metrics
Figure 4 – Use for the CREW benchmarking framework from an experimenter's point of view
CREW - FP7 - GA No. 258301 D4.2
14
transparent and thus more valuable experimentation results. Furthermore, the possibility to re-use experiment descriptions enables fair comparison (benchmarking) of wireless solutions.
• traces: traces are files describing wireless traffic of heterogeneous technologies, either at packet level (e.g. a timed sequence of Bluetooth packets, a certain profile of Wi-Fi use, the activity of a primary LTE user), or data recorded at spectrum level (e.g. recorded spectrum use in a certain location over time, artificially created patterns containing reference interference on a particular frequency).
• wireless background environments: wireless background environments are configurations that can be used to create repeatable wireless environments and are tied to a particular testbed. The configuration files of these background environments link particular traces (see above) to particular nodes at particular times, inside a particular testbed.
• processing scripts: useful scripts (in multiple scripting languages, Matlab, java,...) that, for example, convert the output of a certain type of commercially available tool or CREW component to the CREW common data format.
• performance metrics and benchmarking scores: detailed descriptions of performance metrics and measurement methodologies. Benchmarking scores are abstractions derived by combining different performance metrics. These scores may be useful to when comparing a large set of solutions or for automated decision making during an automated benchmarking process.
The CREW repository is an important asset in supporting the experimenters in setting up their benchmarks for several reasons:
Firstly, during the set-up of benchmarking experiments, the experimenter can base himself on existing experiment descriptions that are found in the repository. If an experimenter has developed a protocol or algorithm that is very similar to a previously benchmarked protocol, of which the full experiment description is available on the repository, it will be meaningful to compare that solution with his own. Even when comparing the two solutions is not possible (e.g. because the focus of the solution to be analysed and the existing description is too different), the available examples will help the experimenter to better understand the possibilities; some parts of the description could still be reused.
Secondly, the same goes for wireless background environments: if a certain researcher publishes evaluation results and mentions against which CREW background environment(s) the evaluation was performed, (1) it is possible for peers to verify the claims of the researcher, and (2) peers may use the same background environments to test their own solutions. Using the same background environments is timesaving (because relevant background environments are available out of the box), and makes comparing existing and new performance results meaningful.
Thirdly, relevant traces for CR/CN experimentation can be used as building blocks for creating new background environments. Again, being able to reuse traces is time-saving (because the experimenter does not need to look for relevant traces himself) and increases the relevance of comparing different solutions.
The above argumentation can also be repeated to motivate sharing processing scripts and performance metrics.
2.2.3 Advances in the benchmarking implementation It was reported in Section 5.2 of CREW deliverable D1.1 that although the higher layers of the benchmarking framework are generic, the “deep integration” of concrete benchmarking tools in year 1 of CREW was mainly realized in the IBBT w-iLab.t testbed. As the implementations and discussions continued during year 2 it was found that the aforementioned balance between developing a “generic toolset” versus improving and extending the concrete benchmarking implementations was not a simple task. Initiated by discussions in the FIRE architecture board and talks on Future Internet conferences, other FIRE projects showed a rising interest in the benchmarking concept and tools. Obviously, sharing benchmarking tools requires an even cleaner interface towards the facility providers.
CREW - FP7 - GA No. 258301 D4.2
15
As a concrete results from discussions with other FIRE projects in early spring of 2012, an official collaboration on “measurements and benchmarking” with the FP7-OpenLab project [2] was started. From CREW perspective, this collaboration (and the associated manpower) was formalized in WP5 (demand driven extensions). The major CREW contribution lays in the overall benchmarking methodology and in providing the CREW spectrum sensing hardware and distributed spectrum sensing methodologies, which is one of the functionalities from the “process & check quality” functional block drawn in Figure 4. These spectral measurements are used for characterizing the wireless environment before, during and after wireless experiments in order to detect anomalies due to external influences (e.g. unwanted interference from other wireless devices or equipment not participating in the experiment). If the external influences are above a certain threshold, the experiments can be discarded during or after the experiment, and the experiment can be (automatically) repeated. In this way the significance and efficiency of wireless experiments can be improved substantially.
From OpenLab side, support is provided to make the CREW benchmarking tools more generic, i.e. more compatible with a broad range of wireless testbeds. An immediate consequence of the collaboration is that the benchmarking tools can now work together with the OMF framework [3]. Note that, like many other testbed deployments, the new IBBT w-iLab.t deployment in Zwijnaarde (see CREW D3.2) is also using OMF as the standard experimentation environment. As such, while the deployment of OMF in the w-iLab.t Zwijnaarde is not work that is carried out in the scope of CREW, the new generation of CREW benchmarking tools are deployed on top of OMF, thanks the strategic cooperation with OpenLab. Evidently, this makes the new generation of benchmarking tools more portable to other testbeds.
3 Automated performance evaluation
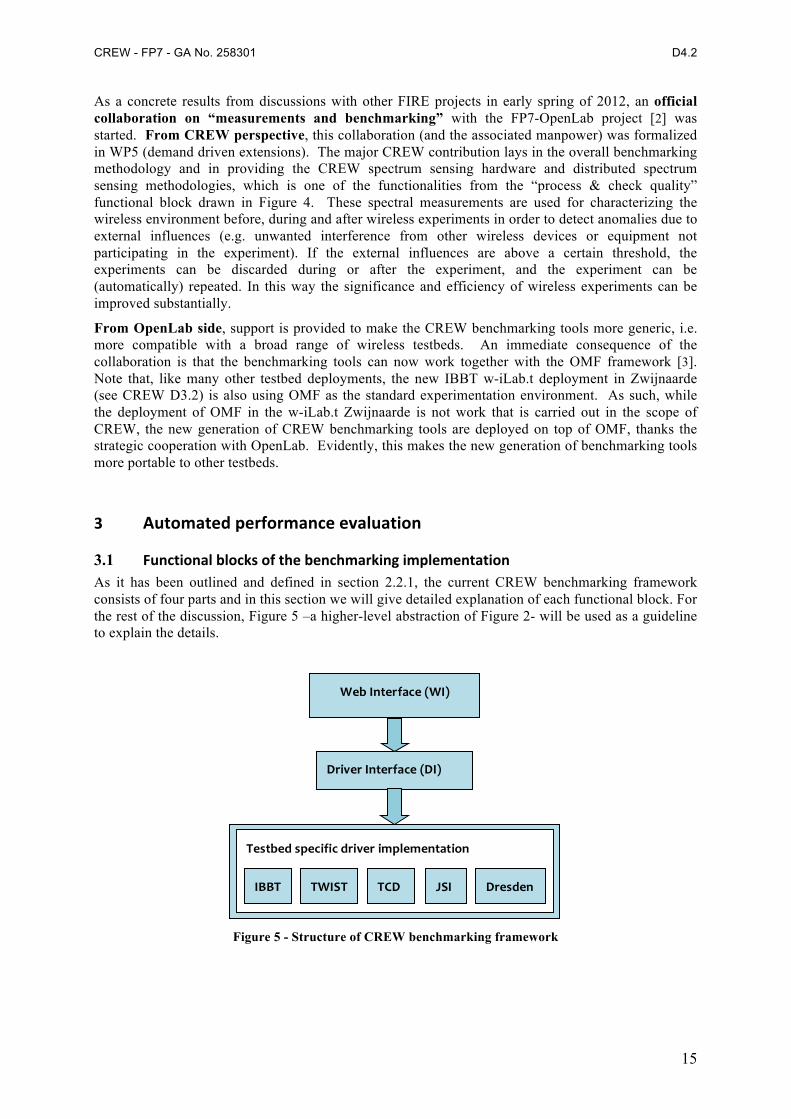
3.1 Functional blocks of the benchmarking implementation As it has been outlined and defined in section 2.2.1, the current CREW benchmarking framework consists of four parts and in this section we will give detailed explanation of each functional block. For the rest of the discussion, Figure 5 –a higher-level abstraction of Figure 2- will be used as a guideline to explain the details.
Figure 5 - Structure of CREW benchmarking framework
Web Interface (WI)
Driver Interface (DI)
Testbed specific driver implementation
IBBT TWIST TCD JSI Dresden
CREW - FP7 - GA No. 258301 D4.2
16
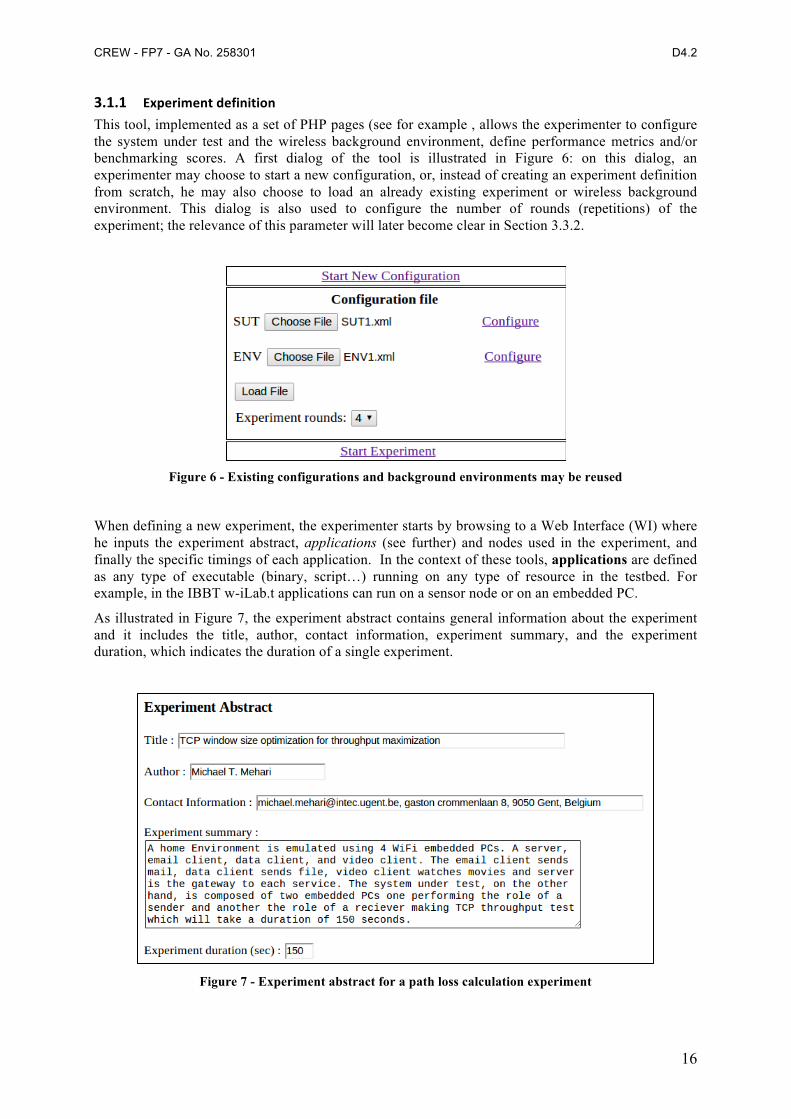
3.1.1 Experiment definition This tool, implemented as a set of PHP pages (see for example , allows the experimenter to configure the system under test and the wireless background environment, define performance metrics and/or benchmarking scores. A first dialog of the tool is illustrated in Figure 6: on this dialog, an experimenter may choose to start a new configuration, or, instead of creating an experiment definition from scratch, he may also choose to load an already existing experiment or wireless background environment. This dialog is also used to configure the number of rounds (repetitions) of the experiment; the relevance of this parameter will later become clear in Section 3.3.2.
Figure 6 - Existing configurations and background environments may be reused
When defining a new experiment, the experimenter starts by browsing to a Web Interface (WI) where he inputs the experiment abstract, applications (see further) and nodes used in the experiment, and finally the specific timings of each application. In the context of these tools, applications are defined as any type of executable (binary, script…) running on any type of resource in the testbed. For example, in the IBBT w-iLab.t applications can run on a sensor node or on an embedded PC.
As illustrated in Figure 7, the experiment abstract contains general information about the experiment and it includes the title, author, contact information, experiment summary, and the experiment duration, which indicates the duration of a single experiment.
Figure 7 - Experiment abstract for a path loss calculation experiment
CREW - FP7 - GA No. 258301 D4.2
17
Next, the experimenter defines all applications that are part of his experiment (see Figure 8). At the time of writing this deliverable, application support is available for two types of platforms namely the x86 Linux platform and tinyOS sensor network operating platform. Note that thanks to the support for x86 Linux platform, all devices that can be controlled from an x86 Linux compatible platform are already supported by default. This means, for example, that a USRP which is controlled by a Linux server with the Iris protocol stack, can be part of an experiment. In this context, “supported platform” refer to those that 1) can be selected from the GUI interface and 2) will result in a valid experiment definition in XML format (see Section 3.1.3). Extending the benchmarking tool to support new platforms requires limited effort at the side of the CREW benchmarking framework (a new platform needs to be added, and the XML scheme needs to be extended), but obviously, at the testbed side an effort will have to be made to interpret the XML scheme.
Regarding the choice for applications, the experimenter has the option to work with existing applications (binaries) developed by third parties, or with his own, custom-defined applications. Most of the time, custom applications will be used to configure in the system under test. One example of the reuse of an application is the reuse of Iperf [4], a tool used to set up TCP and UDP streams and measure network throughput. Inside the w-iLab.t testbed, the tool is used to generate background Wi-Fi traffic. Other popular third-party applications are available from the “default” application list in the benchmarking tool.
Figure 8 - Default and custom application definitions
After defining all applications that are involved in the experiment, wireless nodes from the testbed will be configured and associated with the applications previously defined. Configuration and association of nodes is platform dependent. As an example let us look at the x86 Linux platform. Looking into the interface configuration of x86 Linux platforms, it consists of the interface type, wireless mode, channel, Extended Service Set Identifier (ESSID), Internet Protocol (IP) address, TXpower, etc. On the other hand, association to pre-defined applications starts with application selection from previously defined list and gives a specific instance ID to the selected application. Optional arguments can also be passed to the specific application instance.
Unlike the x86 Linux platform, applications built for TinyOS come along with packed operating system and no need for interface configuration. On the other hand, TinyOS applications are bundled with a list of parameters and parameter values can be modified without the need to recompile the program (by changing the value assigned to symbols within the object code). A sensor application, for example, bundles a dummy channel selector parameter during compilation time. This dummy parameter can be changed to the actual value at a later time by using external tools such as set-tos-symbols. This way, experiment automation for sensor networks is simplified.
CREW - FP7 - GA No. 258301 D4.2
18
Figure 9 - Node configuration for different platforms
Finally the experimenter completes the experiment definition by setting the application timeline. The application timeline defines the specific timing an application inside a specific node starts and stops, and thus allows generating potentially complex experimentation scenarios.
3.1.2 Configuration of parameters The goal of parameter space optimization is to change a particular input parameter within a given range in order to optimize a certain output parameter. An easy to understand example could be modifying the TCP window size for a given TCP window size range, with the aim of maximizing the application throughput over a TCP link between two Wi-Fi nodes in the presence of interferers. Therefore, this section of the Web Interface illustrated in Figure 10 lets the experimenter configure the parameter to be optimized and the parameter range to be searched upon.
Figure 10 - TCP window size optimization of two Wi-Fi nodes using throughput as a performance
parameter.
3.1.3 Provision, Schedule, Execute Up until now the experimenter was on the Web Interface configuring the experiment definition and parameter optimization. These configurations will be stored in the common data format based on an XML format. This configuration is portable to a wide range of testbeds.
Next, the XML configuration file is read and the experiment is started. Depending on the parameter space configuration and testbed specific driver implementation, there will be a number of scheduled
CREW - FP7 - GA No. 258301 D4.2
19
experiments for execution. On the Web Interface, the experimenter sees the progress of the experiment such as debugging information, graphs of different measurements.
3.1.4 Processing results and quality check During experiment execution, we need to check every occurrence of system malfunction that will make the experiment go wrong. To name a few, controlled and uncontrolled interference (respectively, from testbed nodes, and from external nodes not participating in the experiment), and uncertainty due to unexpected node behaviour, are the main reasons that will hinder experiment repeatability and comparability.
With an “ideal” experiment (fully reproducible, repeatable and comparable) being the ultimate goal, we can reduce the effect of experiment unpredictability by eliminating those runs that deviate too much from other runs of the same experiment. To this end, the CREW benchmarking framework has defined two concepts: (1) experiment validation at network layer and (2) experiment validation at physical layer. Both are explained in Section 3.3.1.
3.2 Intelligent scheduling of multiple experiments
3.2.1 Goal Often, experimenters are interested to investigate the behaviour of certain parameters and the effects they will bring on the system performance. To illustrate this with an example CREW use case (see D2.1): in an ISM network, where different Wi-Fi networks coexist, the cumulative throughput is highly dependent on each node’s transmission power. Let us consider the transmission power at the Wi-Fi network A side only. If we increase the transmission power, we will see an increased throughput in network A but a decrease at the Wi-Fi network B side.
Next, let us decrease the transmission power of network A and the reverse will happen. This tells us that the cumulative maximum throughput is not located at the end points but somewhere in between. Therefore, one might be interested to investigate the optimal transmission power to get a maximum cumulative throughput value. This and other similar experiments often require the scheduling of multiple experiments and here in this section we will show an intelligent way of achieving this goal.
3.2.2 Design of Experiments: automated parameter optimization An intelligent experiment scheduler is a tool to execute a number of different experiments, while each time changing a certain input parameter within a certain predefined parameter range. The algorithm implemented is similar to the “incremental search” method that divides the optimize parameter width into fixed intervals and performs a unique experiment at each interval. For each experiment, measurement results are collected and metrics are computed. Next, depending on the optimization context, a local maximum or local minimum is selected from the observed metrics. After that, a second experimentation cycle starts this time with a smaller parameter range width and step size. The experimentation cycle continues until the parameter step width is below a certain value. Figure 11 shows the consecutive steps in an experiment using the intelligent experiment scheduler.
CREW - FP7 - GA No. 258301 D4.2
20
Figure 11 - Intelligent experiment scheduler steps over optimize parameter width A1 to A5
In the figure above, three cycles with five unique experiments per cycle are conducted. The scheduler started with parameter space A1 to A5 in the first cycle and located A4 as a local optimum value. The second and third cycle located B2 and C3 as local optimum values respectively. At the third experimentation cycle, the parameter step width has reached the threshold value and C3 is taken as the optimum value of the whole experiment.
Another way of explaining the experiment scheduler steps is by using a pseudo code algorithm. Figure 12 shows the pseudo code of the algorithm steps.
The pseudo code algorithm uses two level of cascaded while loops. The outer ‘while’ loop defines the number of experimentation cycles involved for the whole experimentation and the exit criteria is when the optimize parameter step size reaches a threshold value. As an example, if the parameter to be optimized is a TCP window size, and the threshold is fixed at a step width of 512 bytes, then the experiment continues until the TCP window size reaches 512 bytes. The inner ‘while’ loop defines how many unique experiments need to be conducted within one experimentation cycle. For a given parameter width, this loop divides the width in equal intervals and conducts unique experiments in each interval. Finally we conduct the experiment, collect data, calculate the performance parameters (these are the parameters that are measured during the experiment), and modify objective parameters (these are the parameters to be optimized) for a next round of experiments.
The approach used in this automation process assumes that the performance parameter(s) don’t show strong fluctuations over a given interval and are further quasi monotonically increasing/decreasing towards an optimum. In this case that there will be a clear global optimum and no local optima. On the other hand, if performance results show fluctuations within the search interval, the approach may lead to a wrong conclusion. This is illustrated with the help of Figure 13. For the first experimentation cycle, four different experiments at 40KB, 110KB, 185KB, and 250KB are conducted (shown on the
CREW - FP7 - GA No. 258301 D4.2
21
figure with bold stripped vertical lines). Local maximum of 17 Mbps throughput performance at 185KB is determined. We can see from the figure that the optimal TCP window size lies around 75KB, but due to rapid changes seen in the throughput performance, the tool ends up in wrong conclusion around 185KB.
Figure 13: Hypothetical throughput versus TCP window size performance result
In the CREW benchmarking framework, there are two implementations for intelligent schedulers. The first one implements multiple experiments from the bash interpreter shell, whereas the second one uses PHP server side scripting language. Both target the same goal but they have some differences in implementation. The bash interpreter approach is very easy to implement and can be easily used in many experimentation environments. Its only disadvantage is that it is not user-friendly especially to the experimenter who might barely know about bash programming. The PHP server side scripting is implemented for the CREW benchmarking framework and has a very intuitive user interface (see for example Figure 10). The experimenter interacts with the scheduler graphically, which is easy to grasp. Unlike the bash interpreter approach, this approach is not easy to implement and it takes quite some to time to build the scheduler.
An example of how the bash script implementation is used is found in Figure 14. This proof-of-concept demonstration targets TCP widow size optimization for throughput maximization. Figure 14 shows the main sections of the script.
CREW - FP7 - GA No. 258301 D4.2
22
Figure 14 - Bash interpreter language used to map intelligent experiment scheduler
3.2.3 Summary To summarize the automated performance evaluation approach, an experimenter starts with experiment configuration from the web interface. He/she configures the experiment rounds, experiment abstract, applications involved in the experiment, and wireless devices/nodes that will be involved in the experiment. Moreover, the experimenter has the option to execute an automatic parameter space optimization by selecting performance parameters (to be measured during the experiment) and objective parameters (to be varied and optimized during the experiment). All configurations entered by the experimenter in the web interface (WI) will be stored as an XML configuration file according to the common data format. This XML file can later be loaded to redo experiments or make minor changes on the configuration.
3.3 Automated quality assessment Within the CREW benchmarking framework, the quality of a particular experiment is evaluated based on its validity and stability.
An experiment is considered valid if no undesired interference is detected during the experiment. Hence the input for this stage comes from various interference detection modules, such as sensing engines and network sniffers. A validity check serves as the first step for the quality assessment. By filtering out unreliable experiments, the risk of drawing wrong conclusions is greatly reduced and further analysis becomes more efficient.
The stability of an experiment mainly refers to its repeatability. When an experiment is repeated with identical setups, the measured results of the performance metrics are expected to exhibit similar behaviour. Stability differs from validity in two aspects:
• Firstly, the validity check is intended to identify interference caused by non-SUT activity, therefore it mainly relies on information provided by sensing engines and sniffers that are not part of the SUT.
• On the other hand, the stability is derived from the performance metrics of the SUT itself; sensing engines and sniffers may fail to detect certain interference, but the impact of the interference can be observed in the final performance metrics. In this situation, by repeating
CREW - FP7 - GA No. 258301 D4.2
23
the experiment for multiple rounds (stability check), the majority of the experiment results are expected to be stable and hence experiment rounds producing outliers can be easily identified.
When stability and validity of experiments are guaranteed, automated assessment may also be used to search certain parameter sets to optimize the performance of the SUT. Therefore, rather than simple repetitions, a set of parameters is varied between different experiment rounds. In this case, the performance metric of the SUT is the most important quality indicator. Validity check can still provide valuable information, however, stability (repeatability) is no longer considered here. The detailed algorithm for optimization is further described with an example in section 3.3.1.
3.3.1 Validity Assessment
a. Interference detection As stated before, the validity of an experiment is based on the result of interference detection. In order to achieve reliable conclusions, the interference detection system is carried out in three phases as illustrated in Figure 15: before the experiment, during the experiment and also after the experiment.
• Monitoring before the experiment provides an overview of the channel conditions. If interference is detected, the system will postpone the experiment until the channel is clean, or consider switching to another channel. The purpose of this phase is to avoid invalid experiments. Since any signal present during this phase is interference, general energy detection is sufficient.
• The monitoring system required during the experiment should be able to distinguish unwanted interference from wireless traffic introduced by the ongoing experiment. In this case energy detection might be not enough. Therefore, both energy detection and feature detection are needed.
• Post-experiment monitoring is similar to pre-experiment monitoring, which requires only simple energy detection. The logic here is, if there is interference detected immediately after the experiment, then most likely the interference was also present during the experiment. The experimenter should be informed that the validity of this experiment needs to be double checked.
Figure 15: Pre, during and post-experiment monitoring
The interference detection tools employed in the benchmarking framework constitute a hybrid system, which requires both general energy detection and feature detection. In a first step, these tools are implemented in w-iLab.t testbed for proof of concept validation, while at a later stage this approach can be easily adopted in other testbed islands of the CREW federation.
b. Interference detection tool in w-‐iLab.t WIFI monitor
A typical node in the w-iLab.t Zwijnaarde testbed (pseudo-shieldeld environment) has two Wi-Fi interfaces. Since most experiments do not utilize the second Wi-Fi interface, it is possible to configure it into monitor mode on a selected channel. When configured into this mode, the interface is not associated with any access point (AP). It will capture packets in promiscuous mode. Received Wi-Fi packets may include a Radiotap header [5], which contains the received signal strength indication (RSSI) of the incoming packet. Therefore, the physical layer information can be extracted directly
CREW - FP7 - GA No. 258301 D4.2
24
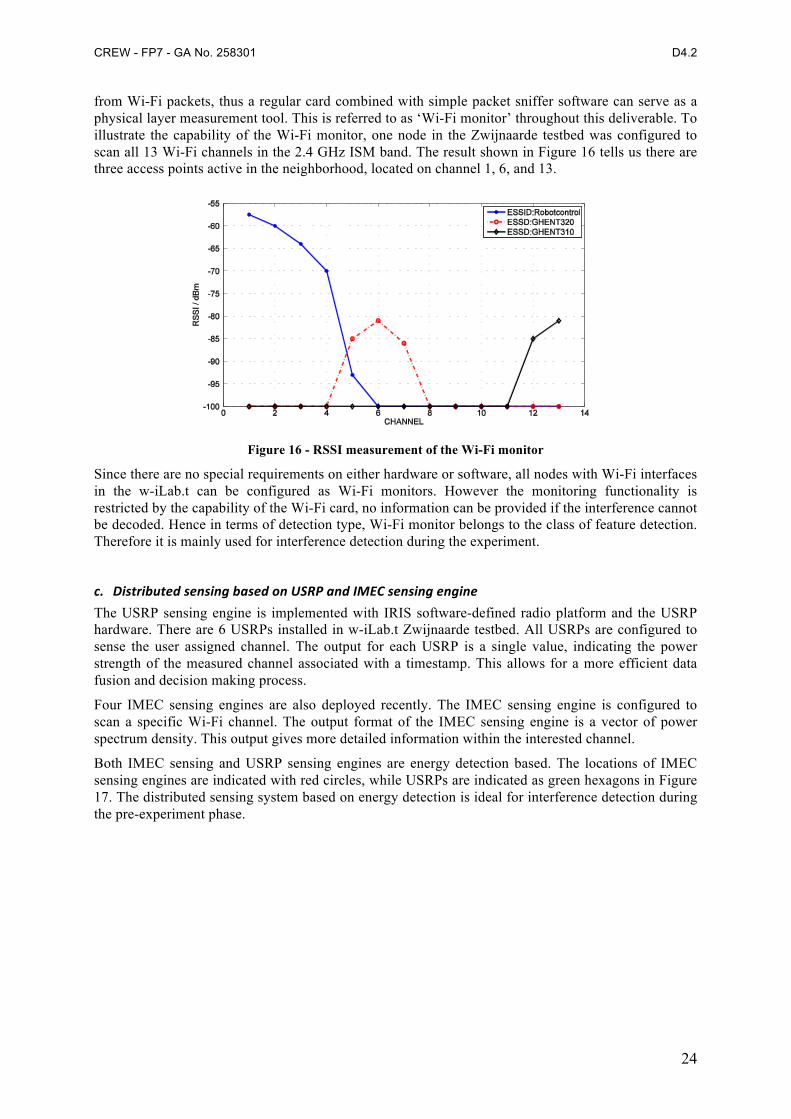
from Wi-Fi packets, thus a regular card combined with simple packet sniffer software can serve as a physical layer measurement tool. This is referred to as ‘Wi-Fi monitor’ throughout this deliverable. To illustrate the capability of the Wi-Fi monitor, one node in the Zwijnaarde testbed was configured to scan all 13 Wi-Fi channels in the 2.4 GHz ISM band. The result shown in Figure 16 tells us there are three access points active in the neighborhood, located on channel 1, 6, and 13.
Figure 16 - RSSI measurement of the Wi-Fi monitor
Since there are no special requirements on either hardware or software, all nodes with Wi-Fi interfaces in the w-iLab.t can be configured as Wi-Fi monitors. However the monitoring functionality is restricted by the capability of the Wi-Fi card, no information can be provided if the interference cannot be decoded. Hence in terms of detection type, Wi-Fi monitor belongs to the class of feature detection. Therefore it is mainly used for interference detection during the experiment.
c. Distributed sensing based on USRP and IMEC sensing engine The USRP sensing engine is implemented with IRIS software-defined radio platform and the USRP hardware. There are 6 USRPs installed in w-iLab.t Zwijnaarde testbed. All USRPs are configured to sense the user assigned channel. The output for each USRP is a single value, indicating the power strength of the measured channel associated with a timestamp. This allows for a more efficient data fusion and decision making process.
Four IMEC sensing engines are also deployed recently. The IMEC sensing engine is configured to scan a specific Wi-Fi channel. The output format of the IMEC sensing engine is a vector of power spectrum density. This output gives more detailed information within the interested channel.
Both IMEC sensing and USRP sensing engines are energy detection based. The locations of IMEC sensing engines are indicated with red circles, while USRPs are indicated as green hexagons in Figure 17. The distributed sensing system based on energy detection is ideal for interference detection during the pre-experiment phase.
CREW - FP7 - GA No. 258301 D4.2
25
Figure 17 - Locations of USRP and IMEC sensing engines at Zwijnaarde w.iLab.t testbed
d. Fusion rules for distributed sensing engine based interference detection Unlike the Wi-Fi monitor, which can be located at any node in wi-Lab.t testbed, the energy detection based sensing engines are only available at certain locations. Therefore, certain rules are needed to decide if the interference level is harmful for the experiment or not. We consider three types of decision fusion rules:
(i) “OR” combination
The most simple way to combine sensing results from different sensing engines are the “OR” combination rule. If among the obtained measurements, any result is above the assigned threshold, the interference is considered to be present.
(ii) Maximum Ratio Combination
The Maximum Ratio Combination (MRC) is a methodology used in MIMO system, where the signal is received by multiple antennas, and the receiver tries to combine the signal based on the signal to noise ratio (SNR) of each antenna.
To simplify the situation, we assume that at each sensing engine, the noise has the Gaussian distribution. If we denote !! as the noise at the !!! sensing engine
! !! = !!!!!!
! !(!!!!!)!
!!!! with !!=0, !!! =
!!!
!! is the magnitude of the noise. The noise on each sensing engine is independent from the noise at other sensing engines.
Theoretically, if the channel characteristic satisfies flat fading, the channel coefficient is one tap scalar, denoted as |ℎ! |. The SNR at the !!! receiver can be expressed as !! =
|!!|!!!!!
, where !! is the transmit power per bit.
!! is determined by both the transmit power at the transmitter and the modulation format. In case of an energy based sensing engine, no primary knowledge is provided, hence !! is not clear. On the other hand, the received power per channel is readily available. Hence instead of deriving the SNR theoretically, we used measured SNR, !! =
!"!!
, where !" is the received power of the selected channel
at the !!!sensing engine. When N sensing engines are present in the distributed sensing system, the combined interference level is expressed as ! = !" ∗ !"!
!!! , where !" = !!!!!!
!!! .
This combined interference level is compared against a predefined threshold T, the interference is considered present or harmful to the on-going experiment if Y>T.
CREW - FP7 - GA No. 258301 D4.2
26
(iii) Receiver location based combination
MRC is suitable for situations where receivers of the SUT are highly distributed. When the network devices of the SUT are more centralized, MRC is less optimal since it is better to simply rely on the sensing engine that is most close by to the SUT.
Therefore we also introduce the receiver location based combination. When the receiver location is known, the distance from the receiver to the !!! sensing engines is denoted as !!. Since the further the sensing engine is from the receiver, the lower added value it gives. So the most straightforward way to combine the sensing measurements is use ! = !" ∗ !"!
!!! , where !" = !/!!(!/!!)!
!!!.
Other alternatives are using more advanced algorithms to determine the weighting coefficient, or simply use a few specific sensing engines close to the SUT.
As for the MRC fusion rules, the combined interference level is compared against a predefined threshold T, the interference is considered present or harmful to the on-going experiment if Y>T.
3.3.2 Stability Assessment The stability assessment is based on the evaluation of the SUT performance between different experiment rounds. In order to provide the experimenter with a quantitative measure of correlation among the several runs, a tool is developed to calculate the correlation matrix, which indicates to which extent the measurements of two different rounds are similar. These calculations are executed through a python script.
Suppose the measurement of two experiment rounds are stored in vector X and Y respectively. the normalized correlation between vector X and Y is then defined as
! !,! =!(! − !!)!(! − !!)
!!!!
When this correlation is calculated for each experiment round, a correlation metric is obtained
The correlation is +1 in the case of a perfect positive (increasing) linear relationship (correlation), −1 in the case of a perfect decreasing (negative) linear relationship (anticorrelation) [6, 7] and some value between −1 and 1 in all other cases, indicating the degree of linear dependence between the variables. As variables, we consider the measurements collected over time during each run, so we calculate the correlation between each two vectors X, Y whose components are measurements in the Data Base (DB) obtained during the same time interval.
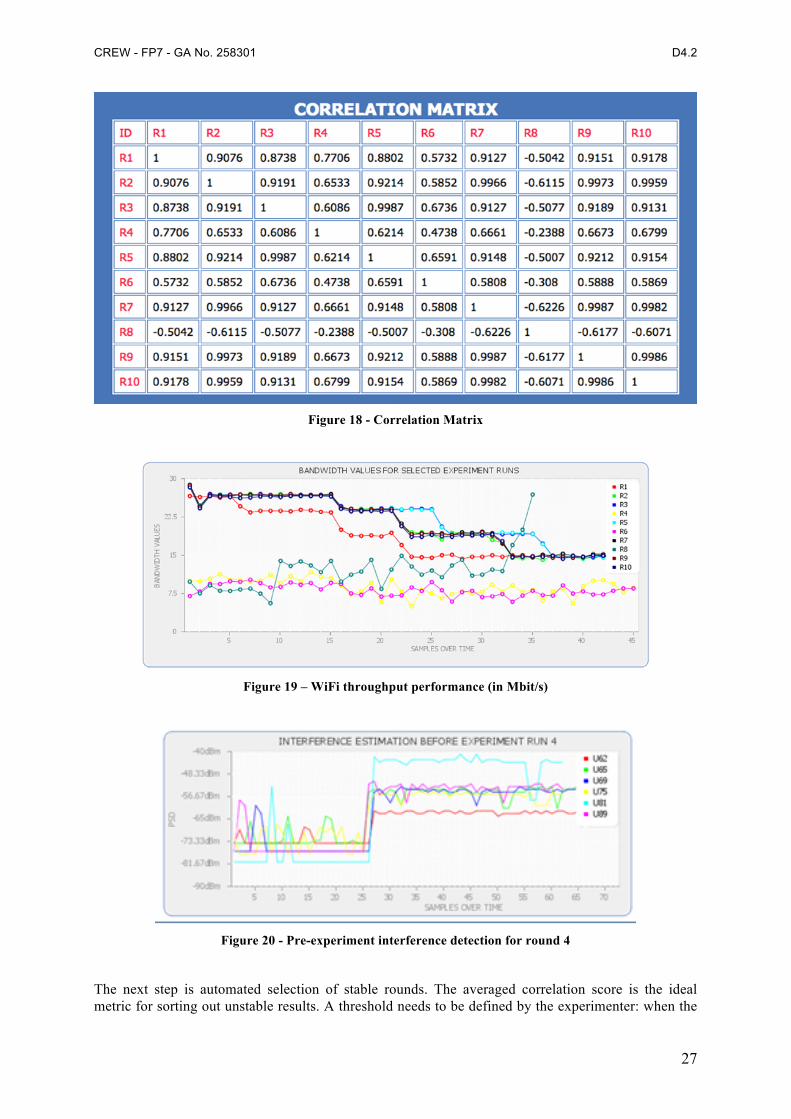
A Wi-Fi throughput experiment is executed for ten rounds, the calculated correlation matrix is shown in Figure 19. It is obvious that rounds 4, 6, 8 have relatively low correlation value and the rest of the rounds are characterized by fairly high correlation value. This is in line with the bandwidth performance shown in Figure 19. Based on the visualization of the various runs, we are able to detect that some experiments presented unstable performance, as compared to the rest, and thus should not be taken into account. In this example, we notice that during runs 4, 6 and 8 the evolution of the throughput performance is much different when compared to the other runs. This observation is also confirmed through the average and standard deviation plots. The reason that causes this weird performance is easily detected through the interference detection, as shown in Figure 20. We record high signal strength values through the USRP devices, which indicates the presence of external interference, directly related to the throughput degradation. As a result, these runs that present “weird” performance cannot be considered stable and thus should not be taken into consideration.
CREW - FP7 - GA No. 258301 D4.2
27
Figure 18 - Correlation Matrix
Figure 19 – WiFi throughput performance (in Mbit/s)
Figure 20 - Pre-experiment interference detection for round 4
The next step is automated selection of stable rounds. The averaged correlation score is the ideal metric for sorting out unstable results. A threshold needs to be defined by the experimenter: when the
CREW - FP7 - GA No. 258301 D4.2
28
averaged correlation score is lower than this threshold this round is considered unstable and will be dropped for the final result selection.
3.3.3 Summary To summarize, the quality assessment of an experiment can be based on the joint evaluation of both stability and validity. The validity is evaluated based on three phases, among which, the pre-experiment and post experiment phase utilize distributed sensing system, three decision fusion rules can be applied, while during the experiment phase the Wi-Fi monitor provides feature detection. Similar feature detection mechanisms can be established for Bluetooth and ZigBee experiments. We determine the stability of an experiment based on the correlation matrix between different experiment rounds. The overall structure of quality assessment adopted in CREW benchmarking framework is shown in Figure 21.
Figure 21: Quality Assessment Pyramid
Exp
Quality
Validity Stability
INT Detection Energy Feature
Correlation Matrix
CREW - FP7 - GA No. 258301 D4.2
29
4 Best practices for experimental performance evaluation Irrespective of a specific research field, any researcher or developer thinking of using experimental methods for designing and evaluating solutions is presented with a lot of questions related to the methodology. The first question one should ask themselves is a very fundamental one: is experimental validation/experimental design the optimal strategy to reach my goals?
Without denying the value of theoretical research or simulations, it is fair to say that experimentally-supported and experimentally-driven research has always been important in recent research history, across many research domains. The ultimate example of what experimental research can lead to in the field of ICT is probably the development of the Internet as we know it today. Even more recently, the FIRE (Future Internet Research and Experimentation [8]) initiative of the European Commission -where CREW is a part of- indicates the value of experimental research in today’s ICT research ecosystem.
Especially in wireless networks, experimentally-driven research is often indicated to be the ideal solution to overcome the limitations of network simulators [9,10], which struggle to accurately model the complex behaviour of the wireless environment. While it is true that the outcome of simulations can be (easily) misinterpreted, this does not mean that using experimental validation methods “by default” leads to results that can 100% be trusted: if an experimenter does not carefully plan or execute an experiment, wrong conclusions may easily be drawn from an experiment.
For wireless networks in general and cognitive networks in particular, the CREW project offers two important contributions that help to reduce the risk of drawing wrong conclusions from an experiment significantly:
• Tools and testbeds supporting the experimenter. Instead of having to set up an ad-hoc test environment for each CR/CN experiment by themselves, experimenters can make use of the CREW federation. As such, researchers now have access to a large diversity and quantity of devices and tools. Furthermore, as the federation is accessible to a wide public, relevant comparison (benchmarking) of CR/CN solutions becomes possible, thus increasing the value of the experimental results.
• An experimentation methodology and good practices for experimenting on top of the CREW federation. In and outside the scope of CREW, the members of the CREW consortium have used their testbeds and tools themselves for evaluating CR solutions and as such they want to share their experience with the research community.
The practical experiences that were gathered during this process were compiled into the following subsections. First, Section 4.1 presents the general experimentation methodology that was followed in the past to come to, among other things, the results that were previously published in D6.1. This methodology is designed in such way that it is relevant for all CREW testbeds, and –with minor changes- also for a wider range of experimentation facilities. However, to help the experimenters with executing experiments on top of the CREW facilities, Section 4.2 presents additional best practices for experimenters planning on using one or multiple of the CREW testbeds. By following the general methodology from Section 4.1 and by taking the practical and technical best practices from Section 4.2 into account, experimenters are able to define and run high-quality experiments.
4.1 General experimentation methodology In Section 2 of this document, Figure 3 introduced four important steps in the experimentation process: defining an experiment, executing an experiment, retrieving and processing results, and sharing the results. It was already stated there that this benchmarking flow can be followed manually, but can also be automated thanks to the support of testbed tools. The general experimentation methodology starts from these four steps, but puts them in a wider context by adding all additional steps that are important in the experimentation process.
CREW - FP7 - GA No. 258301 D4.2
30
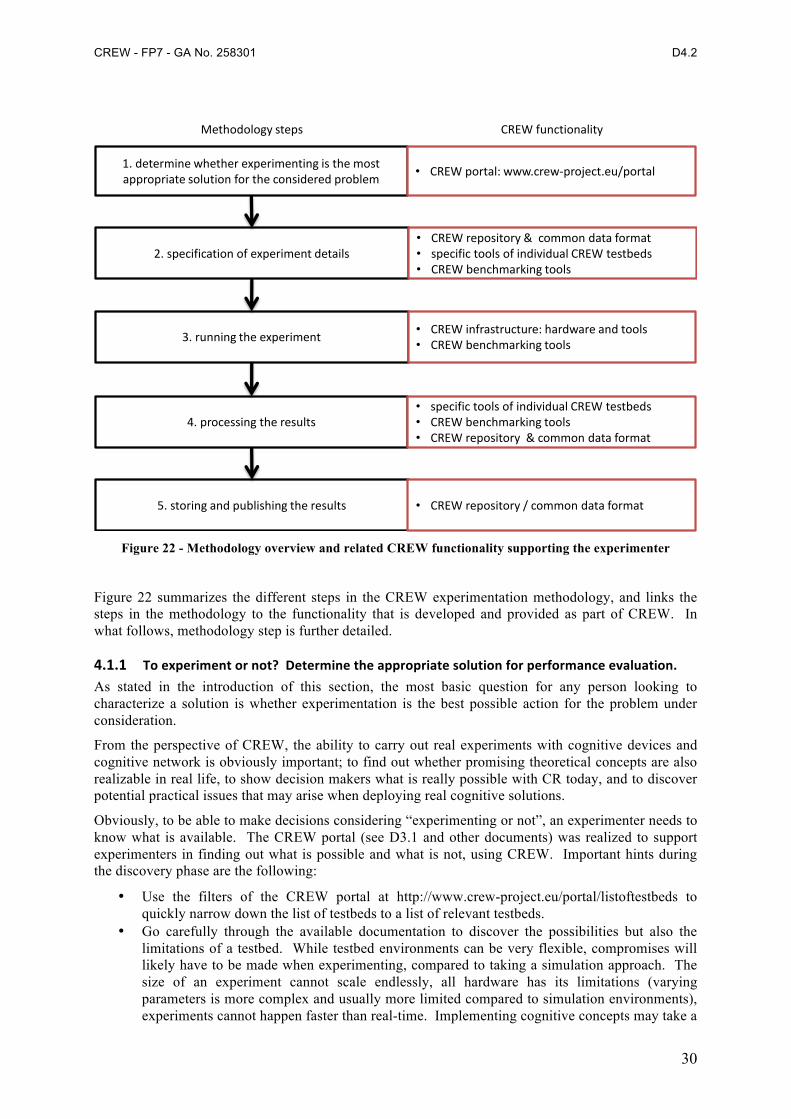
Figure 22 - Methodology overview and related CREW functionality supporting the experimenter
Figure 22 summarizes the different steps in the CREW experimentation methodology, and links the steps in the methodology to the functionality that is developed and provided as part of CREW. In what follows, methodology step is further detailed.
4.1.1 To experiment or not? Determine the appropriate solution for performance evaluation. As stated in the introduction of this section, the most basic question for any person looking to characterize a solution is whether experimentation is the best possible action for the problem under consideration.
From the perspective of CREW, the ability to carry out real experiments with cognitive devices and cognitive network is obviously important; to find out whether promising theoretical concepts are also realizable in real life, to show decision makers what is really possible with CR today, and to discover potential practical issues that may arise when deploying real cognitive solutions.
Obviously, to be able to make decisions considering “experimenting or not”, an experimenter needs to know what is available. The CREW portal (see D3.1 and other documents) was realized to support experimenters in finding out what is possible and what is not, using CREW. Important hints during the discovery phase are the following:
• Use the filters of the CREW portal at http://www.crew-project.eu/portal/listoftestbeds to quickly narrow down the list of testbeds to a list of relevant testbeds.
• Go carefully through the available documentation to discover the possibilities but also the limitations of a testbed. While testbed environments can be very flexible, compromises will likely have to be made when experimenting, compared to taking a simulation approach. The size of an experiment cannot scale endlessly, all hardware has its limitations (varying parameters is more complex and usually more limited compared to simulation environments), experiments cannot happen faster than real-time. Implementing cognitive concepts may take a
1. determine whether experimenting is the most appropriate solution for the considered problem
2. specification of experiment details
• CREW portal: www.crew-‐project.eu/portal
Methodology steps CREW functionality
• CREW repository & common data format• specific tools of individual CREW testbeds• CREW benchmarking tools
3. running the experiment • CREW infrastructure: hardware and tools• CREW benchmarking tools
4. processing the results• specific tools of individual CREW testbeds• CREW benchmarking tools• CREW repository & common data format
5. storing and publishing the results • CREW repository / common data format
CREW - FP7 - GA No. 258301 D4.2
31
lot of time, so knowing any possible limits of the experimentation environment in advance is important in order to make sure that the implementation efforts will also result in an experiment outcome that matches the expectations.
• Just as with any experimentation facility, the CREW federation is in constant evolution. Furthermore, the consortium is open to suggestions that can improve the experimentation experience. Check the available documentation regularly and contact the CREW partners in case of any questions or ideas.
After making a well-informed decision to start experimenting, the concrete experiment(s) can be designed and specified.
4.1.2 Design and specify the experiment Crucial in the design phase (and by extension throughout the entire experimentation process) is to be very precise in logging as much as possible information on the experiment: at any time during or after the experiment, it must be possible to go back to the exact configuration of the experiment.
In CREW D4.1, the experiments have been specified by describing information in two categories:
1. a configuration scenario containing the description of (1a) network conditions (technologies used in the experiment, topologies that are considered,…), (1b) applications (defined in the broad sense: any application at any OSI-stack layer that is part of the experiment, e.g. traffic generation, frequency optimisation, monitoring applications, etc.) together with the parameters that can be varied (and the specific values of these parameters that are considered), and (1c) interference sources (real or emulated primary user traffic, real or artificially generated interference);
2. a description of the performance metrics that will be recorded during the experiment.
Category (1) maps to the “input” arrow illustrated in Figure 1 of this document, while category (2) matches to the “output” arrow in the same figure. Ideally, this information is stored in the easy-to-understand and easy-to-share CREW common data format (see CREW deliverables 3.1 and 3.2).
As mentioned multiple times, logging of the above information can be done manually, but CREW also offers many tools to simplify and improve the way in which an experiment can be designed and stored:
• The CREW repository contains several types of information that are of use to experimenters designing experiments. First of all, to get an idea of how experiments can be described, full experiment descriptions can be found on the repository. Although these experiments may not be fully re-usable, some components of the experiments can be reused. More precisely, the wireless background environments that are used in some of the experiments can be downloaded as separate files, which can be used to (as a base to) generate controlled interference. Also traces (see Section 2.2.2) may be downloaded and reused for the configuration of the experiment, and the same goes for metrics. When new reusable experiments or experiment components are generated, they can in their turn be added to the repository, thus (i) increasing the amount of useful information available on the repository, and (ii) making the information publicly accessible, thus helping to improve the reproducibility and repeatability of experiments.
• The common data format and corresponding tool to generate experiment descriptions, available from the portal at http://www.crew-project.eu/portal/CDF allow experimenters to store their experiment configuration in the common data format, again improving repeatability and repeatability.
• Various tools specific to the individual CREW testbeds such as the tools used to operate the IBBT testbed, force the user to fully describe the experiments in a clear and unambiguous way. Examples of such descriptions can be found on the CREW repository (see bullet above).
• The CREW benchmarking tools (see e.g. Figure 8 - Default and custom application definitions) also can be used to enforce the full definition of an experiment and to produce a
CREW - FP7 - GA No. 258301 D4.2
32
description of the experiment in the common data format. Note that while the benchmarking tools are currently only operational in the IBBT testbed, these tools have clean APIs that make it possible to port them to other testbeds.
When performing CR/CN experiments, it is good practice to separate the description of the solution under test from the description of the wireless background traffic, as it creates a clear separation between the experiment itself and between the external influences interfering with the solution under test, which stimulates reuse of background interference and in its turn enables benchmarking of different solutions against similar background conditions.
It is not always possible to define all aspects of an experiment before actually conducting it. For example, in case an experiment is performed inside an open environment where external interference cannot be controlled, the background interference cannot always be adequately recorded; even if the interference can be recorded, it is not at all straightforward to simply replay this interference. In these cases, it may be interesting to consider following strategy that can be used to emulate realistic wireless background traffic in a repeatable way:
1. Make a recording of spectrum or packet-level information using spectrum analysers or packet recording tools at a certain location of interest.
2. Analyze the recording to derive the relevant statistical information which characterizes the recording (e.g. number of transmitters, frequencies, duty cycles, …).
3. Set up a new wireless background scenario in one of the CREW testbeds, which is modelled according to the information derived from (2). In contrast with the uncontrollable interference at the location of interest, this scenario can be repeated as many times as needed.
4. Use the scenario created under (3) as background scenario, and add the system under test to be considered.
Example implementation of a background scenario created according the above method can be found on the CREW repository. For example, the wilab-office-1 environment available on http://www.crew-project.eu/repository/background is based on a packet capture of the ISM Wi-Fi traffic as recorded at the IBBT office building in Ghent. The traffic was analyzed to extract those access points which caused most interference on the ISM band, and their corresponding Wi-Fi clients and their typical use of traffic. Next, this information was used to generate a background interference scenario using multiple wireless access points and clients that can be deployed in the w-iLab.t Zwijnaarde testbed environment. While the resulting background scenario is obviously not identical to the recorded source trace, the spectrum/packet characteristics are very similar, which results in far more realistic background scenarios than if they would have been generated “at random”.
A final set of generic hints during the experiment definition phase follows below:
• In testbed environments, the choice for using specific nodes can have a great impact on the outcome of the experiment. It is therefore advised to characterize a single solution in multiple topologies, using different nodes. The outcome of each of these different experiments should then be compared (see phase 4) and checked for consistency.
• Try to define the expected output (metrics) as soon as possible in the experimentation cycle, and think of how they will eventually be processed. There is nothing more frustrating than to realize another easy-to-record parameter should have been logged to generate a certain result or output graph. Therefore, if not enforced by the testbed, take note of all settings (including version settings of applications, operating systems…) and configure the experiment in such way that all potentially interesting parameters will be recorded, with a sufficient level of detail. From experience, it is better to record a couple of extra parameters that may initially look irrelevant, than miss a single parameter while processing the results.
• Once again, log as much information as possible: although some settings may seem very obvious at the time of the experiment, some weeks (or even years) later it may be less evident
CREW - FP7 - GA No. 258301 D4.2
33
–yet crucial- to remember these. Worst case, experiments will have to be repeated, which is only possible in case the experiment configuration contains all details.
4.1.3 Running the experiment(s) Once the experiment or experiments are defined, they can be executed inside the testbed under consideration. For specific hints related to the individual testbeds, the reader is referred to Section 4.2. General best practices are presented below:
• In addition to the variations that are needed during the experiment definition, a key factor to achieving reliable results while running the experiments is repeating the experiments multiple times. How many times an experiment should be run depends on the complexity and duration of the experiment, but especially on the variations that are recorded at the results side. While these variations can be monitored manually, the CREW benchmarking framework makes it possible to monitor the variations of the output variables automatically.
• The CREW benchmarking framework can also be used to automatically vary input parameters in between different experiments, thus again saving time for the experimenter.
• When running the initial experiments, it is good practice to move iteratively between phases 3 (running the experiment) and 4 (processing the results), in order to reduce the risk of running a large set of experiments which afterwards prove to be invalid (e.g. because of a bug in the solution under test). By using the CREW testbeds and tools in a proper way (as described on the CREW portal and in Section 4.2 below, errors during the experimentation phase will be significantly reduced. Furthermore, some of the CREW testbeds offer the possibility to get a real-time view on the status and results of the experiments; this is very useful to detect any possible errors in the earliest possible state.
• In some cases it might be useful to repeat experiments at different times of the day. As most testbeds are deployed in environments where people are working (thus passing by the set-ups and/or using the wireless spectrum), results might be affected by factors external to the experiment. Try to get and store a view on the relevant portion of the spectrum before, during and after an experiment (see also Error! Reference source not found.), as this might help to identify issues when processing the results. Where supported, such assessment of the spectrum can happen automatically by using the CREW benchmarking tools.
4.1.4 Processing experimental results 4.1.4 Processing experimental results • Although processing results can be done manually, CREW provides several tools to help the
experimenter with this. Several of the CREW testbeds provide support for real-time and post experiment processing of the results, as can be found on the CREW portal. Regardless of whether the results are processed manually or through tools or by using (an adaption of) one of the processing scripts that are found on the CREW repository, it is good practice not to remove any of the source data (i.e. raw metrics, spectrum info) even after it has been processed, as the source data might be required at a later time to calculate additional metrics or to discover the source of anomalies.
• At several occasions during internal CREW experiments, use of the CREW common data format has proved its use when processing data from a set of different cognitive devices. The scripts that are found on the CREW repository typically require data formatted in the common data format as input, which significantly simplifies the comparison of data at a later stage.
• If new scripts are generated to process results, it is good practice to store them again on the CREW repository, as this increases the transparency of the experimentation process and again leads to results that are more easily compared.
4.1.5 Storing and publishing experimental results • While not publicly accessible at the moment of writing (but accessible on-demand by people
using CREW), there is a CREW data server available where results (even large data sets) can be stored for a longer time. The public extension of this data server is found in the CREW
CREW - FP7 - GA No. 258301 D4.2
34
repository, where results can be made publicly available, preferably in the common data format. In a later phase, it will either be possible to directly contribute to the CREW repository, or, CREW may decide to merge its data with existing open repositories such as CRAWDAD [11].
• To make it possible for the target audience to understand the background of the experiments that led to the results, it is good practice to share as much data as possible with the target audience. As among other things in scientific papers, it is impossible to share all data in an “offline” way, the CREW repository and common data format can be used to make results available online. A link to the repository can then be added to the scientific (or other) publication. In the long run, this approach could lead to a valuable database of experiments and corresponding results.
• If the steps above were followed carefully, sharing the exact configuration and circumstances of the experiment should not be too complex, as all information is normally already available in a clear and understandable way.
Below, additional hints and best practices related to the different CREW components and testbeds are shared. These complement the methodology described above.
4.2 Testbed/cognitive component specific best practices
4.2.1 Experiments using IBBT w-‐iLab.t
a. General comments 1. Extensive documentation on the w-iLab.t testbed was added to the CREW portal. Prior to
executing any experiment on w-iLab.t, read the documentation on http://www.crew-project.eu/portal/wilabdoc carefully and go through the various tutorials that are listed. Please also read the FAQ section at http://www.crew-project.eu/content/faq.
2. As listed on the portal, there are two locations in the w-iLab.t testbed. Choosing the right location for your experiment is an important choice, as –at the moment of writing- the sensor side of the testbed is not yet 100% compatible, and the tools that are used to control the environments are not (yet) identical. As such, while far from impossible, porting experiments from one environment to another environment takes time.
b. Good practices for experiments involving USRP devices 1. The USRP is one of the important cognitive components in the w-iLab.t testbed. Each USRP has a
specific IP address. Unlike the standard configuration, the USRPs here are first attached to an high speed switch and then to interfaces of several quad-core servers. The alternation of this configuration should be avoided in any case, since it might influence the internal network address for other devices.
2. As the quad-core servers for controlling USRPs are shared by multiple users, it is a good practice to save the operating system’s image each time after the design and experiment, next time reload it again.
3. Timing is a crucial factor for cognitive experiments. OMF control and manage framework keeps very good log by default. The log file is located both on the central experiment controller and on the distributed nodes, which can provide precious information for debugging and improvement.
4. Repeating experiments with nodes at different locations of the testbed is also a good practice. Since not all nodes in w-iLab.t have line-of-sight connection, even the relative positioning of antennas on different nodes can some time affect the experiment result.
5. All the Wi-Fi interfaces in w-iLab.t Zwijnaarde have a 10 dB attenuator attached, which makes it easier to form multi-path scenario. Of course this fact should be kept in mind for experiments including power or pathloss measurement. Note that no attenuators are installed on the USRPs.
CREW - FP7 - GA No. 258301 D4.2
35
4.2.2 Experiments using the IMEC sensing engine There are 2 instances of the IMEC sensing engine (both are present in the IBBT testbed), the differentiator between the two instances is the radio board. A first version uses the Wireless Open-Access Research Platform (WARP) radio board [12] and the second version uses the IMEC SCALDIO IC. The main difference between the two instances is the RF range, the WARP radio board can only measure in the 2.4 and 5 GHz ISM, whereas the SCALDIO IC can measure signal between 0.1 and 6 GHz. Therefore it is mandatory that the experimenter selects the device that suits the experiment’s frequency requirements. Beware that in the IBBT testbed there are 10 IMEC sensing engines installed and only 2 SCALDIO sensing engines.
Before starting the actual experiment it is good practice to run a calibration/characterization phase if possible, this was also done in the experiment described in [13]. In most cases the ideal sequence for this would be to execute a measurement of known signal and the absence of the signal, e.g. executing a spectrum measurement with a known signal connected directly to the input and executing a spectrum measurement with a 50Ω terminator connected to the antenna input. These measurements can afterwards serve as a reference measurement and can provide e.g. the noise floor of the spectrum sensing operation. Unfortunately connecting a known signal is directly to the input is only possible when one has full physical access to the device, which is not always the case when accessing a testbed remotely. In this case we would recommend transmitting a continuous signal with only one source at a time and measure this signal with all sensing devices. Afterwards the user can repeat this with sources at several locations in the testbed to check if all sensing devices can pick up the signal.
4.2.3 Experiments using IRIS and the CR testbed at TCD 1. Everything in the testbed has an exact place
• Each USRP and node has been assigned a table and number. • Unused daughterboards will be placed in proper storage places.
2. Everything goes back to the exact place after any experiment that causes it to be moved.
3. Clonezilla is used on all nodes meaning that nodes will be reset to a specific version of IRIS on startup.
4. Bearing this in mind everyone should take care to store data in the data partition and not elsewhere on a node as it will be lost otherwise.
5. The firmware in the USRPs will be updated when a new release becomes stable. All hardware will be updated at once rather than a subsection of hardware.
6. If it is found that any piece of equipment gets broken, or if there is an issue with its functionality (e.g. only works for a certain bandwidth or really low powered) the IRIS testbed users mailing list [email protected] must be informed. This will be relayed this to the wider group and a note will be made of this on the appropriate wiki pages https://ntrg020.cs.tcd.ie/irisv2/wiki/TestbedInventory.
7. All experiments must be scheduled using the Google calendar <ctvr.testbed> specifying all of the following:
• Name of experimenter • Date and time of booking • Testbed node number(s) • Daughtboard(s) of use • Frequency range(s) of use
8. The testbed should not be used for simulations.
9. The testbed room should be kept secure.
10. Testbed users should sign up to the following mailing lists:
CREW - FP7 - GA No. 258301 D4.2
36
• IRIS support mailing list https://lists.scss.tcd.ie/mailman/listinfo/iris2 • IRIS testbed users mailing list https://lists.scss.tcd.ie/mailman/listinfo/iris-testbed-users for
enquiries regarding the Iris testbed. • IRIS commit mailing list https://lists.scss.tcd.ie/mailman/listinfo/iris2commit for commit
notifications. 11. Short descriptions of all experimental work using the testbed should be provided in the projects
section of the IRIS wiki https://ntrg020.cs.tcd.ie/irisv2/wiki/ActProjects.
4.2.4 Experiments using TWIST at TUB The 2.4GHz ISM band is usually very crowded. Although, we have managed to switch the university wireless access network (eduroam) to the 5GHz ISM band and focus the TWIST testbed activities on 2.4GHz band, being now reserved only for experiments, it is a good practice to monitor the frequency band of interest for unsuspected interferences. The university network was moved to 5GHz band only in the building with the testbed and it is still possible to catch transmissions coming from either other buildings nearby or outdoor mesh network. It is possible to use low cost spectrum analyzers, WiSpy’s, in the TWIST testbed to perform constant monitoring of the spectrum, while performing an experiment. This enables validation of an experiment, before, during and after an experiment as explained in 3.3.1.
Proper description of the experiment and publishing the raw data adds to the transparency of the results. It makes it easy to verify if the experiment performed correctly as well as gives the possibility to explore other aspects using the same set of data. The proper description of the experiment should enable the repetition of the same it later on, also by another experimenter.
There is a set of good practices for experiments involving TUB testbed hardware:
1. Extensive documentation on the TUB testbed can be found on the CREW portal. Prior to executing any experiment in the TUB testbed please read the documentation on http://www.crew-project.eu/portal/twistdoc carefully and go through the various tutorials that are listed. Please also read the FAQ section at http://www.crew-project.eu/content/faq.
2. There are dedicated mailing lists, which users can subscribe and ask questions concerning TWIST. The following mailing lists are available:
• <twist-users AT twist.tu-berlin.de> for discussions on TWIST setup and usage
• <twist-devel AT twist.tu-berlin.de> for discussions on TWIST software development (more information can be found online: http://www.twist.tu-berlin.de/wiki/TWIST/Support/MailingLists)
3. Before an experimenter is granted access to TWIST she/he must agree to the TWIST terms of usage, which includes
• the nature of the intended experiments (due to the privacy implications)
• commitment to a reciprocal access to eventual testbed resources; and
• agreement on proper acknowledgement of TWIST in the produced publications.
4. All experimenters must be registered via the TWIST web interface
5. When the experimenter uses TWIST she/he can reserve a time slot to have exclusive access to some hardware using a dedicated registration service (via the TWIST web interface)
6. The integration of WiSpy spectrum devices has only recently been finished, therefore spectrum sensing is in an alpha-stage. Experimenters may be asked to provide TUB with feedback after using WiSpy monitoring during an experiment. This allows TUB to improve the service.
CREW - FP7 - GA No. 258301 D4.2
37
7. During an experiment on TWIST experimenters can access data from their system under test in real-time over a separate channel; the connection is realized over SSH and the password will be provided on request.
8. Repeating experiments with nodes using different topologies is a good practice. Furthermore, since the TUB building is a public building that is usually closed after working hours (and on weekends) it is a good practice to compare experimental results for working vs. non-working hours. This allows investigating effects due to external (uncontrolled) RF interference but also to mobility of the environment (affecting multipath fading, etc.).
4.2.5 Experiments using the LTE/LTE advanced testbed at TUD
a. Before the experiment: • Contact the testbed staff, make sure the hardware is compatible (frequencies) and the testbed
supports all features necessary for the intended experiment
• Make sure there will be enough testbed hardware available (indoor/outdoor?)
• If reasonable, ask for reference signal files to check compatibility with external hardware
• Get familiar using the spectrum analyzer R&S FSQ
• Prepare UE/eNB configuration files or ask testbed staff to do it
b. During the experiment: • Carefully check the setup
• Use a terminator when there is no antenna/cable plugged
• Check if all cables are ok
• Make sure you are using the latest version of the config tool to configure the hardware
• Keep a record of the config files you use as you are changing parameters
• Check the signal on the spectrum analyzer, several things can be validated that way
• If in nothing else seems to work reboot and reconfigure the UE/eNB prototype hardware
• When in doubt, ask the testbed staff
c. After the experiment: • Put everything back where you took it from
4.2.6 Experiments using LOG-‐a-‐TEC testbed (JSI) 1. All experiments have to be scheduled and approved on LOG-a-TEC web portal: https://crn.log-a-
tec.eu/. If unavailable or unresponsive, please notify the testbed staff.
2. The communication between application and the testbed is based on a custom protocol, which is abstracted by a proxy server based on standard HTTP protocol.
3. Users have the opportunity to interact with the testbed in three different ways, depending on the difficulty of performed task:
• by using pre-prepared GET and POST requests (trivial),
CREW - FP7 - GA No. 258301 D4.2
38
• by using a web GUI to write GET and POST requests one by one or to put more in a text file and upload it to the server (medium),
• by using a programming language with a HTTP client to write custom code based on GET and POST requests to the sensor network e.g. Python or Java.
4. Several firmware options are preinstalled on VESNA platforms deployed in the LOG-a-TEC testbed and can selected for execution. If an experiment requires a new firmware, this should be prior to upload and execution in the LOG-a-TEC testbed at JSI testbed for proper functioning and compliancy with the hardware used. This testing is required to ensure that the reprogrammed devices are able to join the control network and accept commands from it.
5. In case any of the nodes is inaccessible, please notify operators of the testbed.
6. In LOG-a-TEC testbed there are 3 types of spectrum sensing modules installed, with only one available in the particular device. Make sure that the devices used are equipped with the modules required the experiment.
7. When in doubt or experiencing unexpected behavior, please notify and investigate with the testbed staff.
8. The radio environment on LOG-a-TEC testbed is not controlled, so unexpected interference can appear during experiments, especially in the crowded 2.4 GHz band. From the two clusters of the LOG-a-TEC testbed, one is located in the city center and the other in the industrial zone. Their interference profiles may be substantially different and can differ with respect to time of day (e.g. less Wi-Fi users in the night). In case of potential or experienced problems, please coordinate with the testbed staff.
9. When planning an experiment keep in mind that the control network in LOG-a-TEC testbed is based on a ZigBee network, which occupies only one channel in the 868 MHz frequency band and offers only a low transmission rate. On average 1 kB/s transmission rate can be achieved, and the latency of the network is a few hundred milliseconds. If the data cannot be collected in real-time, SD card storage available in every device should be used.
10. The storage on the SD card can hold traces up to 1 MB. This is enough for storing the results of at least 20 minutes of sniffing in the ISM bands, and 8 hours of sniffing in the UHF bands. During one experiment, more traces can be created, if necessary.
11. Time synchronization of the nodes in the network is not implemented explicitly, so be aware of the possible drift between the traces. For achieving better synchronization, one can start all of the sniffing nodes planned to be used in an experiment, and then transmit a short synchronization burst which to be recorded by all sniffing nodes. Then by using the synchronization burst, the collected traces can be aligned.
12. The GRASS-RaPlaT extension can be used either in experiment planning via simulations or cross validation of simulation and experiment results. Several dedicated processes are pre-prepared and available for the execution. Most common way of accessing the functionalities is through the LOG-a-TEC portal, which calls proper Linux processes and latter graphically visualizes the results. The GRASS-RaPlaT web interface can also be made accessible upon user request. In case experiencing problems, please contact testbed staff.
4.2.7 Experiments using the TCS sensing platform
a. Before going on the field • Make sure to have all the necessary cables in order to connect the four parts of the test bed
(Laptop, acquisition board, receiver, antennas)
• Make sure the hardware is compatible in frequencies with the LTE network to be sensed
CREW - FP7 - GA No. 258301 D4.2
39
b. Once on the field • Make sure all cables are plugged correctly
• Switch on the acquisition board before booting the laptop.
• Switch on the receiver before launching the SMARTAIR3G software.
c. Acquisition part • Run the setup test in order to verify that everything works correctly
• Set the acquisition parameters i.e.
• Acquisition length
• Number of antennas
• Path for file storage
• Generic file name
• Change the center frequency to the one to be analyzed
• Check on the time and spectral views that a signal is received
• Verify that the AGC works properly and that the signal is not saturating. If so, adjust the gain manually.
d. Analysis part • Set the analysis parameters i.e.
• Number of antennas
• Precision of the analysis (number of frames used)
• Path for report file storage
e. After the experiment • Switch of the laptop before unplugging any other equipment
4.2.8 Experiments using EADS Aircraft Cabin Mock-‐Up The EADS aircraft cabin mock-up is a realistic replica of an Airbus A340 cabin using original equipment for the cabin interiors, such as seats, overhead compartments and lining material. The outside structure of the mock-up consists of wood. To make it useable for realistic wireless experimentation, all structural components have been coated with metal foil. In the technically relevant frequency range, due to the skin effect, the metallic foil has the same properties than solid metal parts would have regarding reflection and dispersion of electromagnetic fields. The interior of the mock-up as well as parts of the metallic coating are shown in Figure 23.
Although the mock-up is not part of the CREW federated testbed and not openly accessible, experiments referring to the special environment of an aircraft cabin can be performed according to explicit prior agreement.
Any kind of equipment can temporarily be installed in the mock-up, as long as it does not require irreversible modifications, causes damage at structure or interior, or interferes with the normal usage of the mock-up for tests and demos by EADS. 230 V power sockets are available at multiple sockets in the floor of the cabin and can be used to power the installed equipment. To reduce the occupation
CREW - FP7 - GA No. 258301 D4.2
40
time of the mock-up, experimenters should have a precise concept for their planned tests and optimally should have performed a dry run before.
Figure 23 – EADS aircraft cabin mock-up
It is also possible to install components of the CREW federated testbed in the cabin mock-up for cognitive radio experimentation. This mobile testbed approach has been used for a series of internal experiments described in deliverable D6.2. Depending on the component selection, usage of all functionalities, such as the common data format or benchmarking is supported. Also a portal for remote access and remote experiment execution in principle can be set up (It is rather difficult to occupy the mock-up for longer time periods, so that in most cases a temporarily condensed experimentation campaign is preferred). It has been shown that installation of the mobile testbed can be done in a timescale of few hours to enable rapid experimentation in an aircraft cabin environment using the known CREW testbed components.
CREW - FP7 - GA No. 258301 D4.2
41
5 Conclusions This deliverable describes the progress that was made on the work executed in the “benchmarking” workpackage (WP4) of the CREW project. The main activities during the second year of the CREW project are: (1) continued work and discussions on the generic benchmarking framework; (2) automated performance evaluation process and; (3) best practices for efficient, reliable and reproducible performance evaluation.
The continued work and discussions on the generic benchmarking framework resulted in an update and upgrade of existing concepts, frameworks and tools. On the conceptual level, a black box presentation of the benchmarking framework was defined. At the implementation level, the developer’s representation of the benchmarking framework (as defined in year 1), has been complemented with a benchmarking flow from an experimenter’s point view. The main steps in this flow are: (1) definition of experiment; (2) provisioning of testbed, scheduling and execution of experiments; (3) collection, processing and comparison of results; and (4) sharing of results/configurations/background environments/metrics.
Several extensions have been implemented to support the experimenters in setting up and executing benchmark experiments. First, the CREW online repository has been established for sharing different types of data between experimenters, such as full experiment descriptions, traces (e.g. traffic, interference), wireless background environments, processing scripts for converting output to the CREW common data format, performance and benchmarking scores. Another extension that was developed is the automated performance evaluation, which allows intelligent scheduling of multiple experiments and automated quality assessment. To this end a new interface has been designed, enabling seamless combination of experiment definition, configuration of parameters, provisioning of testbed, scheduling & execution of experiments, processing of results and quality check of the experiment (eliminating non-reliable experiments).
The intelligent scheduling of multiple experiments enables experimenters to execute an automatic parameter space optimization by selecting objective parameters (to be varied and optimized during the experiment) and performance parameters (to be measured during the experiment) through an intuitive web interface. The intelligent scheduling allows achieving a maximum number of results with a minimum number of experiments.
The automated quality assessment of an experiment is based on the joint evaluation of stability and validity. The stability assessment refers to repeatability and is evaluated through cross-correlation between repeated experiments. Validity assessment involves the filtering of unreliable experiments through interference monitoring (using distributed spectrum sensing) before, during and after an experiment. Thanks the automated quality assessment, the reliability of experiments can be much improved.
In line with the benchmarking flow (from an experimenter’s point of view) and based on the experimentation experiences gained in the CREW consortium, both general and testbed/cognitive component specific best practices (or experimentation methodologies) have been defined for experimental performance evaluation of cognitive radio and/or cognitive networking concepts. The general experimentation methodology is applicable to all CREW facilities, while the testbed/component specific best practices give additional guidelines for experimentation using an individual CREW testbed (IBBT, TCD, TUB, TCD, JSI), experimentation environment (EADS) or advanced cognitive component (IMEC, TCS).
In summary, many new concepts for benchmarking have been introduced and basic implementations thereof have been successfully demonstrated (see also D6.2). However, there is still room for further improvement, such as optimizing the algorithm for exploring parameter spaces when intelligently scheduling multiple experiments, extending the one dimensional parameter space to a multi-dimensional parameters space, and improving the statistical methods applied for the definition of outliers during stability assessment.
CREW - FP7 - GA No. 258301 D4.2
42
6 References [1] Stefan Bouckaert, Jono Vanhie-Van Gerwen, Ingrid Moerman, Stephen C Phillips, Jerker Wilander, Shafqat Ur Rehman, Walid Dabbous, Thierry Turletti, “Benchmarking computers and computer networks”, White Paper [online: http://www.crew-project.eu/documents], 2011
[3] Thierry Rakotoarivelo, Maximilian Ott, Guillaume Jourjon, and Ivan Seskar. Omf: a control and management framework for networking testbeds. SIGOPS Oper. Syst. Rev., 43:54-59, January 2010
[6] J. L. Rodgers and W. A. Nicewander, "Thirteen ways to look at the correlation coefficient.", The American Statistician, 42(1):59–66, February 1988
[7] Nikolić D, Muresan RC, Feng W, Singer W, "Scaled correlation analysis: a better way to compute a cross-correlogram". European Journal of Neuroscience, 2012, pp. 1–21, doi:10.1111/j.1460-9568.2011.07987
[8] European Comission, Future Internet Research and Experimentation initative. Homepage: cordis.europa.eu/fp7/ict/fire/
[9] David Cavin, Yoav Sasson, and Andre Schiper. “On the accuracy of MANET simulators”, POMC '02: Proceedings of the second ACM international workshop on Principles of mobile computing, pages 38--43, New York, NY, USA, 2002. ACM Press.
[10] Todd R. Andel and Alec Yasinsac. On the credibility of manet simulations. Computer, 39(7):48--54, 2006.
[11] CRAWDAD Community Resource for Archiving Wireless Data At Dartmouth. Homepage. http://crawdad.cs.dartmouth.edu/
[12] Rice University. Wireless Open-Access Research Platform. Homepage. http://warp.rice.edu/trac/wiki/FPGA%20Board
[13] Van Wesemael, P., W. Liu, M. Chwalisz, J. Tallon, D. Finn, Z. Padrah, S. Pollin, S. Bouckaert, I. Moerman, and D. Willkomm, "Robust distributed sensing with heterogeneous devices", Future Network & Mobile Summit, 07/2012