Cognitive Engineering Laboratory Cognitive Work Analysis of the City of Toronto Municipal Winter Maintenance Program Laura Thompson, Antony Hilliard, and Cam Ngo CEL 08-01 Cognitive Engineering Laboratory, Department of Mechanical & Industrial Engineering, University of Toronto 5 King's College Road, Toronto, Ontario, Canada M5S 3G8 URL: www.mie.utoronto.ca/labs/cel/
Transcript
Cognitive Engineering Laboratory
Cognitive Work Analysis of the City of Toronto
Municipal Winter Maintenance Program
Laura Thompson, Antony Hilliard, and Cam Ngo
CEL 08-01
Cognitive Engineering Laboratory, Department of Mechanical & Industrial Engineering, University of Toronto
Directors: Kim J. Vicente, Ph.D., P. Eng. Greg A. Jamieson, Ph D., P. Eng.
The Cognitive Engineering Laboratory (CEL) at the University of Toronto (U of T) is located in the Department of Mechanical & Industrial Engineering, and is one of three laboratories that comprise the Human Factors Research Group. CEL was founded in 1992 and is primarily concerned with conducting basic and applied research on how to introduce information technology into complex work environments. Current CEL Research Topics CEL has been funded by Atomic Energy Control Board of Canada, AECL Research, Alias|Wavefront, Asea Brown Boveri Corporate Research - Heidelberg, Canadian Foundation for Innovation, Defence Research & Development Canada (formerly Defense and Civil Institute for Environmental Medicine), Honeywell Technology Center, IBM, Japan Atomic Energy Research Institute, Microsoft Corporation, Natural Sciences and Engineering Research Council of Canada, Nortel Networks, Nova Chemicals, Westinghouse Science & Technology Center, and Wright-Patterson Air Force Base. CEL also has collaborations and close contacts with the Mitsubishi Heavy Industries and Toshiba Nuclear Energy Laboratory. Recent CEL projects include:
• Developing advanced human-computer interfaces for the petrochemical and nuclear industries to enhance plant safety and productivity.
• Understanding control strategy differences between people of various levels of expertise within the context
of process control systems. • Developing safer and more efficient interfaces for computer-based medical devices. • Creating novel measures of human performance and adaptation that can be used in experimentation with
interactive, real-time, dynamic systems. • Investigating human-machine system coordination from a dynamical systems perspective.
CEL Technical Reports
For more information about CEL, CEL technical reports, or graduate school at the University of Toronto, please contact Dr. Kim J. Vicente or Dr. Greg A. Jamieson at the address printed on the front of this technical report.
1.1 Municipal Winter Maintenance Program.................................................................5
1.2 Intentional versus Causal Systems ...........................................................................7 1.3 Overview of the Phases of Analysis ........................................................................7
2. WORK DOMAIN ANALYSIS .............................................................................10
2.1 Defining the Work Domain Boundary ...................................................................10
2.2 Abstraction Hierarchy ............................................................................................11 2.2.1 Abstraction Hierarchy Labels ..........................................................................11 2.2.2 Abstraction Hierarchy ......................................................................................12 2.2.3 Functional Purpose...........................................................................................13 2.2.4 Abstract Function .............................................................................................14 2.2.5 Generalized Function .......................................................................................15 2.2.6 Physical Function: ............................................................................................15 2.2.7 Physical Form ..................................................................................................16 2.3 Part-Whole Decomposition ....................................................................................16 2.4 Causal links for the work domain ..........................................................................17 2.5 Work Domain Model Weaknesses .........................................................................18
2.6 State Variables .......................................................................................................18
3. ACTIVITY ANALYSIS IN WORK DOMAIN TERMS ......................................20
3.1 Prototypical Work Functions .................................................................................20 3.2 Prototypical Work Situations .................................................................................21
4. CONTROL TASK ANALYSIS ............................................................................23
4.1 Modeling Commentary ..........................................................................................23 4.1.1 Shunts / Leaps ..................................................................................................23 4.1.2 Grain of Analysis .............................................................................................23 4.1.3 Multiple Loops vs. Multiple Ladders...............................................................23
10. APPENDIX A – WORK DOMAIN ANALYSIS FIGURES ................................51
11. APPENDIX B – CONTROL TASK ANALYSIS FIGURES ...............................56
12. APPENDIX C – STRATEGIES ANALYSIS TABLES .......................................60
13. APPENDIX D – SOCIO-ORGANIZATIONAL ANALYSIS FIGURES ............66
CEL 08-01 Thompson, Hilliard, and Ngo
Page iii
TABLE OF CONTENTS
SECTION PAGE
Page iii
Glossary
Terms Definition Anti-icing Anti-icing is a snow and ice control strategy used to prevent
bond formation between ice and the pavement surface by spreading a chemical liquid (i.e. brine) before a storm begins.1
Beat Pre-planned routes for equipment Brine A mix of salt and water. De-icers (also known as salters)
De-icers are vehicles that the capability to spread rock salt (using salt spreaders).2
De-icing De-icing is a strategy geared towards applying salt after snow actually sticks to the pavement in order to prevent the ice bond to the road surface.3
Graders A grader is a vehicle with a large blade used to move snow on a road.
highway includes a common and public highway, street, avenue, parkway, driveway, square, place, bridge, viaduct or trestle, any part of which is intended for or used by the general public for the passage of vehicles and includes the area between the lateral property lines thereof
Inspector Field personnel responsible for monitoring the roadway, traffic, weather, and equipment conditions.
Pre-wetting Wetting the salt before direction application onto the roads to allow the salt to adhere to the surface better and subsequently work faster to prevent ice-pavement bond.4
Ready / Readying Ready or Readying in this context refers to equipment and personnel preparation prior to a winter maintenance activity
roadway means the part of the highway that is improved, designed or ordinarily used for vehicular traffic, but does not include the shoulder, and, where a highway includes two or more separate roadways, the term “roadway” refers to any one roadway separately and not to all of the roadways collectively5
Roadway Roadway Snow Melting Process A form of snow removal that involves transporting the snow
to snow melting equipment. Spot operations Performing winter maintenance activities on specific areas
1 2 Salt Management Plan – Appendix H, De-icing programme, page D-7 3 Salt Management Plan – Appendix H, Ordering De-icer Applications, page 6 4 Salt Management Plan – Appendix H, Ordering De-icer Applications, page 7 5 Municipal Highway Traffic Act – Subsection 1, Interpretation
CEL 08-01 Thompson, Hilliard, and Ngo
Page iv
TABLE OF CONTENTS
SECTION PAGE
Page iv
(these activities may be custom routes or pre-planned). Supervisors Supervisors ensure that the winter maintenance plans are
followed by organizing staff and equipment to meet winter conditions.6
Windrows A windrow is a row of snow accumulated after ploughing
6 Salt Management Plan – D-9 (paraphrased)
Introduction Thompson, Hilliard, and Ngo
Page 5
1. INTRODUCTION
1.1 Municipal Winter Maintenance Program
Toronto has about 5100 kilometers of roads which provide for the safe, efficient, and affordable means of surface transportation for all road users (Salt management plan summary2004). Torontonians rely on this roadway network throughout the year for transport to the workplace, to recreation and leisure facilities, for goods and services, and for emergency and security services. Snow and ice conditions on the road system have a dramatic impact on public safety, roadway capacity, travel time and economic costs. Transport Canada estimates that over 12,000 Canadians are killed or seriously injured in traffic accidents due to snow, sleet, or hail each year (Transport Canada, 2001). Toronto spends $62.4 million annually on the city’s Municipal Winter Maintenance Program (MWMP)7 (City of Toronto, 2005) to maintain the safety and usability of these roadways. The Toronto MWMP encompasses multiple subsystems that together, operate to maintain adequate roadway conditions during the winter season. The MIE 1406 Cognitive Work Analysis (CWA) case study entailed applying the five phases of CWA to a complex sociotechnical system. Is Toronto’s Municipal Winter Maintenance Program a suitable candidate for CWA? In order to answer this question, we identified the factors that contribute to the complexity of a system (Vicente, 1999)as they apply to the MWMP. Large Problem Spaces – The MWMP is composed of many different elements and forces including the variables that are external to the system such as those affecting weather, traffic, road conditions and variables that are internal to the system such as balancing, preparing, and operating equipment and human resources. Social – The MWMP is composed of many people who must work together to make the overall system function properly. The MWMP employs 1068 city staff and 536 contract staff (City of Toronto, 2005). The lines of authority that govern the MWMP also extend to various members of municipal government that are not directly involved with the day-to-day operations of the program but must be informed at elevated levels of storm severity. In addition, the MWMP must also coordinate with other districts and municipalities outside of the physical boundaries of the program. Heterogeneous Perspective – The MWMP consists of staff from different backgrounds and disciplines from analysts (e.g. equipment engineers, policy makers, meteorologists, superintendents) to front line workers (e.g. labourers, operators, and inspectors) many of which may be contract staff or in-house staff. The diversity may bring a wealth of experience but may also encourage conflicting values. The difficulty in the social negotiation process is amplified by the presence of various unions and organizational bodies representing various groups of workers.
7 Please note that the acronym MWMP was generated as a convenient way to describe the “system”, which is the subject of this report. The use of this acronym is limited to this report and may therefore not appear in City of Toronto documentation.
Introduction Thompson, Hilliard, and Ngo
Page 6
Hazard – The MWMP has two major hazards to consider. Firstly, winter storms cause hazardous driving conditions for both citizens and MWMP vehicle operators. Proper clearing of the roads manages this hazard. Secondly, the MWMP activities involving salt usage may pose an environmental hazard and thus salt management must be practiced in conjunction with the “Code of Practice for Environmental Management of Road Salts” developed by Environment Canada. The main objective of the Code of Practice is to ensure environmental protection while maintaining roadway safety (Salt management plan summary2004). Uncertainty – Although the advent of technology has made weather monitoring relatively accurate, there is still a level of uncertainty associated with the weather. Predictions are not 100 percent reliable and reliability diminishes over time. Workers must estimate the level of resources needed to accommodate varying weather conditions and prepare equipment and staff ahead of time. In addition, the size of the system relative to the availability of sensor data also induces uncertainty. A few measurements of weather, traffic flow and roadway conditions must frequently be extrapolated to the state of the overall system. Disturbances – Workers carrying out the objectives of the MWMP are also responsible for dealing with unanticipated events associated with weather, traffic, and roadway conditions, as well as equipment failures, and resourcing issues. Although the level of improvisation and adaptation to contingencies varies from the top of the socio-organization down to the equipment operators and patrollers, the system as a whole must react quickly to maintain safe and passable roads for the city. The 1999 storm that overwhelmed the city is a prime example of how city authorities had to adapt to an unanticipated event. More than five million people were affected by the storm (Canadian Broadcasting Corporation, 1999). Thousands of travellers spent one of the busiest travel days of the year stranded at Toronto's Pearson International Airport. Overall, the cost of storm to the city is estimated at $70 million (Canadian Broadcasting Corporation, 1999). Vicente described closed systems as being completely isolated from their environment and as a result, the behaviour of the system can be well understood by examining the influences that are internal to the system itself. Conversely, open systems are subject to influences (i.e. unpredictable disturbances) that are external to the system (Vicente, 1999). With open systems it is not be possible to accurately pre-identify the different flow sequences or timelines that lead to the satisfaction of the goal. Vicente was careful to note that sociotechnical systems usually lie on a continuum between open and closed systems (Vicente, 1999). The municipal winter maintenance program is both an open and closed system. The initiation of winter maintenance activities are driven by disturbances in the weather, traffic flow, changes in municipal bi-laws, and political and social pressures. Workers must adapt online in real time to disturbances that cannot possibly be foreseen by designers and analysts (Vicente, 1999)
We conclude that the Municipal Winter Maintenance Program is a complex sociotechnical system that is suitable for CWA.
Introduction Thompson, Hilliard, and Ngo
Page 7
1.2 Intentional versus Causal Systems
Independent of the complexity of a work system, distinctions can be made between causal and intentional systems. Causal systems are physical systems where the outcomes are tightly constrained by the laws of nature, for example chemical processing plants and electricity generation systems. Intentional systems are human-activity based systems where the outcomes cannot be predicted by the laws of nature but are instead driven by individual motivations and societal constraints (Rasmussen, 1986).
One measure of these properties of a work system is ‘regularity’, introduced by Rasmussen. An illustration of this concept is provided below (Rasmussen, Pejtersen, & Goodstein, 1994).
Figure 1 “Regularity” of Work Domains (Rasmussen et al., 1994)
The MWMP is constrained by many physical processes, including the natural laws with respect to salt-water mixtures, the creation of entropy (e.g. precipitation, air flow, etc…), and the conservation of momentum (i.e. traffic flow). These elements are all causal system properties. However the MWMP is also influenced by legal and societal constraints that define its purpose and measures of its success.
We can conclude is the MWMP is a mixed causal-intentional system. Comparing the relative importance of each category of constraints, the MWMP could be described by elements in the center-right of Rasmussen’s continuum of intentional and causal systems.
1.3 Overview of the Phases of Analysis
CWA is divided into five phases of analysis (Vicente, 1999), which start from an ecological perspective and progress towards a cognitive perspective. Each phase identifies a new layer of constraints. The precursor, Cognitive Systems Analysis (CSA), also follows this progression, but the analysis is divided into seven phases (Rasmussen et al., 1994). The corresponding phases are compared in Table 1. The main difference lies in
Introduction Thompson, Hilliard, and Ngo
Page 8
the Activity Analysis, which consists of three phases or “stages of decomposition and shift of conceptual knowledge” (Rasmussen et al., 1994) Firstly, the activity analysis in work domain terms identifies prototypical work situations and work functions. These constrain the relevant parts of the work domain and identify the active objectives and the required resources. This CSA phase does not correspond to a CWA phase, but is rather simplified into the notion of operating modes during the CWA Control Task Analysis. Secondly, the activity analysis in decision making terms examines the decision functions during these prototypical work situations and functions. This analysis corresponds to the CWA Control Task Analysis, where the decision ladder is used as a modeling tool to map the “states of knowledge” and “data-processing activities” during decision tasks. Finally, the activity analysis in cognitive terms determines the (information processing) strategies that actors can use to accomplish these tasks. This CSA phase corresponds to the CWA Strategies Analysis.
Since the Winter Maintenance domain is a mixed intentional-causal domain, the Activity Analysis in Work Domain Terms is a critical phase in identifying work constraints and linking control tasks to the work domain. This additional phase was proven beneficial in the design of military teams (Naikar, Pearce, Drumm, & Sanderson, 2003). Typically the identified “prototypical work functions” constrain relevant parts of the work domain for known, recurring classes of situations. The “prototypical work situations” determine temporal work constraints (e.g. function A should/must be completed before function B) and are analogous to the notion of operating modes. This phase continues to narrow degrees of freedom available for action, especially in terms of intentional constraints. Therefore this phase was included in the current study and leads directly into the subsequent Control Task Analysis (CTA) since the prototypical work functions become the control tasks. Except where noted in the following sections, the other five phases in this study correspond to the five phases in CWA.
Introduction Thompson, Hilliard, and Ngo
Page 9
Table 1: Comparison of the phases of Cognitive Systems Analysis, Cognitive Work Analysis and the current study
Cognitive Systems Analysis Cognitive Work Analysis
Phases in this Study
1. Work Domain Analysis (Means-ends structure of a system)
1. Work Domain Analysis
Section 2: Work Domain Analysis
2. Activity Analysis in Work Domain Terms (Task Situations)
Not Applicable Section 3: Activity Analysis in Work Domain Terms
3. Activity Analysis in Decision Making Terms (Cognitive task)
2. Control Task Analysis
Section 4: Control Task Analysis
4. Activity Analysis in Cognitive Terms (Mental strategies which can be used)
3. Strategies Analysis
Section 5: Strategies Analysis
5. Division and coordination of work (Role allocation in work domain and in cognitive task)
6. Social Organization (Management style & culture)
4. Social Organization and Cooperation Analysis
Section 6: Social Organization and Cooperation Analysis
7. Cognitive resources and subjective preferences
5. Worker Competences Analysis
Section 7: Worker Competences Analysis
The following sections describe the procedure and results of the CWA, as described above. Conclusions and ‘Lessons Learned’ are discussed in the final section of the document.
Work Domain Analysis Thompson, Hilliard, and Ngo
Page 10
2. WORK DOMAIN ANALYSIS
2.1 Defining the Work Domain Boundary
Before beginning the first phase of CWA, a System and Work Domain boundary must be defined. A generally accepted definition of the Work Domain is being “the System independent of any Worker, Event, Task, Goal, or Interface” (Vicente, 1999). Additionally, it is generally accepted not to include sensors as part of the Work Domain. The work domain, system boundary and elements outside of the system boundary are illustrated in Figure 2.
The work domain and system boundaries have been defined in non-traditional ways for the following items:
Inspectors and Call Centre Employees as Sensors - Inspectors and employees of the MWMP “Call Center” have been modeled as ‘sensors’ that can be used to gather observations of the state of the work domain through their activities. They
Work Domain Analysis Thompson, Hilliard, and Ngo
Page 11
are not modeled in the Work Domain, but can be considered as part of the System. Equipment Operators enabling functions – Equipment operators have been considered as elements of the Work Domain since they enable the functionality of other Work Domain elements such as trucks and equipment. Simultaneously, they are also considered as Workers in the system, who must generate context-conditioned variability to adapt to work effectively and respond to disturbances. City Residents as traffic - City residents have been modeled as vehicle and pedestrian ‘traffic’, since it seems reasonable that interactions between residents and the snow-covered city only occur when they are traveling on the roads or sidewalks. Conversely, parked cars have been modeled as a property of roads. All vehicles have been included in the Work Domain.
2.2 Abstraction Hierarchy
2.2.1 Abstraction Hierarchy Labels
In order to develop the Abstraction Hierarchy, the levels of abstraction appropriate for the system had to be determined. The five levels of abstraction originally proposed by Rasmussen were developed for process control and manufacturing systems. These five levels may or may not be applicable to our particular system and as Vicente pointed out, although the five levels of abstraction have been useful for a variety of applications, there is no reason to believe that the same five levels of abstraction will be relevant to all work systems (Naikar, Hopcraft, & Moylan, 2005). We considered three options during the course of our work:
1) Use the traditional set of labels used for process control and causal systems (Vicente, 1999): functional purpose, abstract function, generalized function, physical function, physical form.
2) Use the set of labels suggested by Rasmussen for intentional systems: functional purposes, values and priority measures, purpose-related functions, object-related processes, and physical objects. (Naikar et al., 2005)
3) Use domain specific labels for the levels of abstraction that reflect the terminology of the work domain when presenting the Abstraction Decomposition Space (ADS) to domain experts. This approach has been successfully used in medical domains (Hajdukiewicz, Doyle, Milgram, Vicente, & Burns, 1998).
We chose not to invent new terminology to describe the levels of abstraction for the MWMP as we felt the benefits of consistency with established literature outweighed the benefits of domain specificity.8
8 Should such an opportunity arise, consideration will be made to improving the language within the WDA to better suit the domain experts.
Work Domain Analysis Thompson, Hilliard, and Ngo
Page 12
Since the MWMP system is a mixed causal-intentional system (as discussed in Section 1.2), we had to determine which of the first two labeling conventions allowed for the most consistent and psychologically relevant representation of the system. We began by using the causal set of labels as they were more familiar to the analysts. These labels allowed the modeling of the physical processes of the system to proceed smoothly. As we investigated more of the intentional aspects of the system, we attempted to convert our AH to the intentional set of labels to benefit from the analysis suggestions in (Naikar et al., 2005). This yielded some difficulties. Firstly, the elements of the values and priorities level introduced an additional layer of intentional activity in the form of variable constraints (e.g. “Minimize salt application”, “Expenditures less than budget”). This conflicted with the language and representation used to describe the physical laws. Secondly, we found the practice of associating the name of a system object with the label for the lower-most level of the AH to present a challenge in maintaining a consistent language for the second layer, the Object-related Processes (formerly Physical Function). “Functional Capabilities and limitations relating to” verbal nouns were unwieldy to manipulate in the AH format. Lastly, when we attempted to integrate the means-ends of physical mass balances and values and priority measures into a six-tiered AH, the generation of means-ends relations between levels left ‘gaps’ where purely natural processes had no values associated with them and hindered the representation of causal links within levels. We therefore concluded that reverting back to the traditional set of labels produced the most useful representation of the work domain.
2.2.2 Abstraction Hierarchy
The Abstraction Hierarchy representation for the MWMP is attached in Appendix A-1. Figure 3 identifies the coverage of the Abstraction-Decomposition Space (ADS).
CitySub-System
Compo-nents
Sub-Cpts.
PFm
PFn
GF
AF
FP
Figure 3: Abstraction Decomposition Space represented in the Abstraction Hierarchy
We discuss each entry in the first two levels of the Abstraction Hierarchy in detail below. A more general description of the more familiar Generalized Function, Physical Function, and Physical form levels is also discussed.
Work Domain Analysis Thompson, Hilliard, and Ngo
Page 13
2.2.3 Functional Purpose
The Functional Purpose representation of the system describes the reasons for which the system exists (Vicente, 1999). Five elements were modeled, representing both causal and intentional aspects of the system. They are presented in a rough order of priority. Maintain Safe and Passable Roads The primary stated purpose of the MWMP is to prevent dangerous driving conditions from occurring due to snow or ice accumulation on the roadway. Collisions, injuries, or deaths attributable to poorly maintained roads have severe consequences for the municipal government. The definition of "Safe and Passable" depends on the average speed and quantity of vehicles traveling on a particular roadway. For example, a laneway accommodating a few cars at slow speeds can safely contain more snow deposits than an expressway with heavy traffic traveling at high speeds. Minimize Impact of Weather on City Economic Activity A secondary purpose of the MWMP is to minimize the effect of weather disturbances on the transportation activity occurring in the city. When road and pedestrian transport is slowed or prevented by snow and ice accumulation, personal, business, and municipal financial impacts can be severe. A trivial but illustrative example from the severe storms of 1999 is the $2 million in parking ticket revenues lost by the municipal government due to the economic shutdown of the city (Canadian Broadcasting Corporation, 1999). Adhere to Municipal and Provincial Laws and Agreements To ensure acceptable performance in the first two functional purposes across the City of Toronto and the Province of Ontario, laws have been enacted defining minimum legally acceptable levels of service (Government of Ontario, 2001). There are potentially severe consequences for failing to meet these standards, but unlike other functional purposes there are no benefits to exceeding them. While by definition this functional purpose has some overlap with others, the intentional nature of this constraint, its importance to managers and planners' decision making, and its discrete properties distinguish it from others in the Work Domain. Remain Within a Justifiable Budget Every municipal program must consider budgetary limitations in planning its activities. As the MWMP is open to variations in external disturbances, its budget can be expected to vary with severity of weather conditions throughout the year. Consideration of levels of service offered to components of the system that do not have major safety or economic impact such as driveway opening or suburban sidewalk ploughing are made with explicit consideration of cost (Guthrie, ). From interviews with a Management level SME, P. Noehammer (personal communication, February 21, 2006), we determined that a significant portion of managerial work was devoted to writing reports to justify system expenditures.
Work Domain Analysis Thompson, Hilliard, and Ngo
Page 14
Minimize Environmental Impact More recently, consideration has been given to the effect of run-off from salt and other de-icing chemicals on the natural environment. Salt that escapes from the road surface leaches into roadside soil, affecting biological activity, and can contaminate groundwater if present in sufficient quantities (Environment Canada, 2004). Legislation has been enacted requiring each municipality in Ontario to implement a Salt Management Plan to encourage improvements in efficiency of salt application and new technologies such as anti-icing and pre-wetting of salt have been implemented to increase accuracy and effectiveness of salt application (Salt management plan summary2004).
2.2.4 Abstract Function
Elements at the Abstract Function (AF) level describe the system in terms of constraints and relationships provided by causal physical laws or intentional balances and values. Abstract Functions are means to support Functional Purposes. We identified eight subsystem elements at the AF level for the MWMP, representing a mix of causal and intentional aspects. They are discussed below in the order in which they are represented on the Abstraction Hierarchy plot in Appendix A. Conservation, balance and flow of salt: For the purposes of this analysis, salt is neither created nor destroyed. This element represents the balance between salt applied to the road network by MWMP vehicles and salt removed by dissolving in water and draining. Creation of entropy: This element describes the natural processes of increasing entropy, in particular with respect to weather phenomena. Conservation of energy and laws governing salt-water mixtures: Mixtures of salt and water melt and freeze at different temperatures from pure water. These phase change processes involve flow of heat energy to and from snow, air and roadway. This element represents the physical processes governing rates of phase changes in snow/salt mixtures and their relation to ambient temperatures. Conservation, balance and flow of water forms: Similar to the balance and flow of salt, the balance and flow of water element represents the accumulation of water forms on the roadway and road shoulder in terms of sources (precipitation and salt brine), transports (wind, snowploughing) and sinks (melting, draining and snow removal procedures). F=ma and conservation of momentum as applied to traffic:
Work Domain Analysis Thompson, Hilliard, and Ngo
Page 15
Safety and rate of traffic flow is strongly affected by traction of vehicle tires on the road surface. Snow and ice accumulation reduce this traction and can result in hazardous situations where vehicles cannot be safely navigated. This element represents the relationships between vehicle speeds and maneuvering capability, and the relationships between steepness of road slope and traction required. Economic balance of city: The municipal road network affords transportation of goods and delivery of services across every aspect of city processes. The economic relationships represented by this element support decision-making regarding costs and benefits of the MWMP. Balance of resource needs and capabilities: This element represents conservation of equipment capabilities and the matching of capabilities to demand. With limited equipment and personnel resources, and variable traffic and road conditions, this balance must be considered when making decisions concerning equipment dispatch and scheduling. Balance of budget and authority: To function within the organizational structure of the municipality, expenditures must be accounted for by managers and City Councillors. As a result, any MWMP must allow for a relation between budgetary decisions and authority figures.
2.2.5 Generalized Function
The Generalized Function (GF) level represents how elements at the Abstract Function level are achieved. This section was modeled at a sub-system level. Elements of water and salt balances are described by Melting, Freezing, Salt application, and Draining, amongst others. Elements at this level represent processes that support or are constrained by balances described at the Abstract Function level.
2.2.6 Physical Function:
Elements at the Physical Function (PFn) level include capabilities of physical elements in the System Boundary and are represented at a component level. Included are capabilities of common classes of MWMP equipment such as anti-icing trucks, snowploughs, and Snow Melting equipment. Sun, wind, snow, and other weather phenomena are described in physical capability terms. Some indication of alternative means-ends is represented, such as the Generalized Function of “Draining” being achievable either through the Physical Function of Municipal or Environmental drainage systems. This represents conditions where if municipal drainage systems fail in some way, for example a drain grate in the roadway becoming blocked with ice and snow accumulation, the roadway will overflow and drain salt and water into the natural environment.
Work Domain Analysis Thompson, Hilliard, and Ngo
Page 16
2.2.7 Physical Form
The Physical Form level was not modeled extensively, as it is very dependant on the details of a specific System being modeled. We believe it is most useful to consider this level of abstraction at a sub-component level. At this level the form, location and appearance of each Physical Function element would be represented. Employees would be identified by their names and appearance, vehicles would be identified by their registration numbers, model types, and roadway identified by its name and lane width.
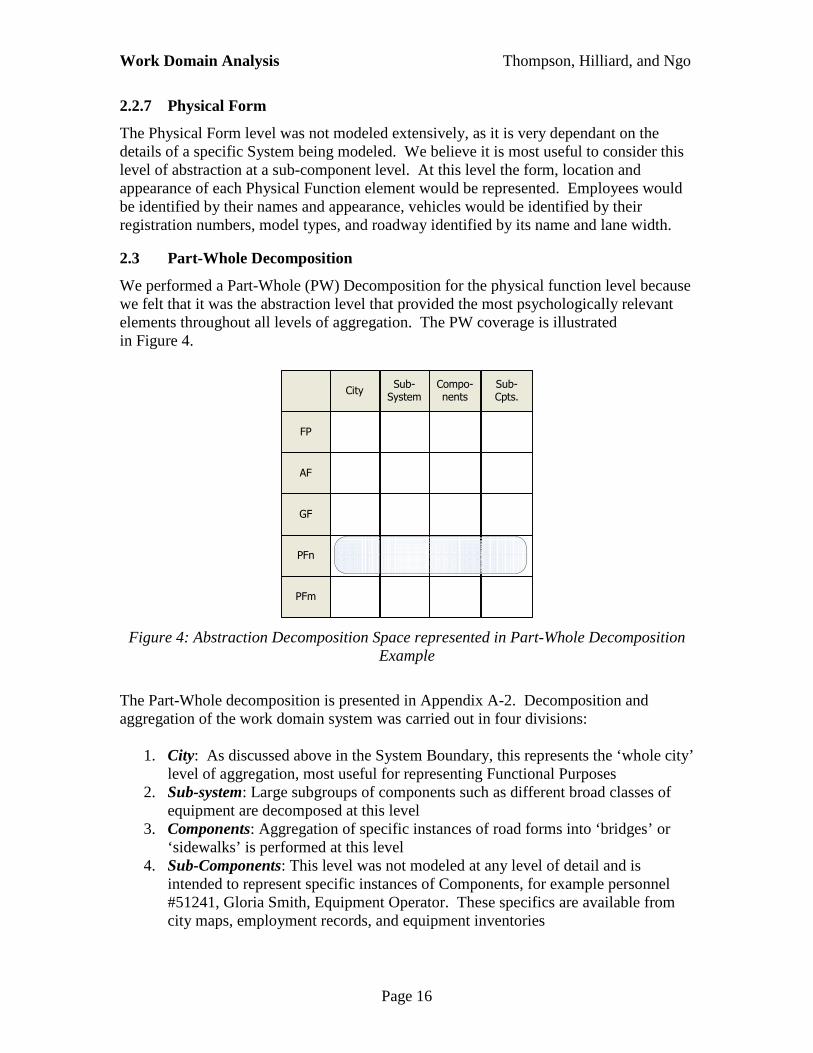
2.3 Part-Whole Decomposition
We performed a Part-Whole (PW) Decomposition for the physical function level because we felt that it was the abstraction level that provided the most psychologically relevant elements throughout all levels of aggregation. The PW coverage is illustrated in Figure 4.
CitySub-System
Compo-nents
Sub-Cpts.
PFm
PFn
GF
AF
FP
Figure 4: Abstraction Decomposition Space represented in Part-Whole Decomposition Example
The Part-Whole decomposition is presented in Appendix A-2. Decomposition and aggregation of the work domain system was carried out in four divisions:
1. City: As discussed above in the System Boundary, this represents the ‘whole city’ level of aggregation, most useful for representing Functional Purposes
2. Sub-system: Large subgroups of components such as different broad classes of equipment are decomposed at this level
3. Components: Aggregation of specific instances of road forms into ‘bridges’ or ‘sidewalks’ is performed at this level
4. Sub-Components: This level was not modeled at any level of detail and is intended to represent specific instances of Components, for example personnel #51241, Gloria Smith, Equipment Operator. These specifics are available from city maps, employment records, and equipment inventories
Work Domain Analysis Thompson, Hilliard, and Ngo
Page 17
We also introduce in the in Appendix A-2 figure a convenient partitioning of the work domain into “object worlds” in the Part-Whole Decomposition example (Rasmussen et al., 1994). They are areas of the work domain that certain classes of actors typically reason within. We discuss these in more detail in the Socio-Organizational Analysis, Section 6.1.
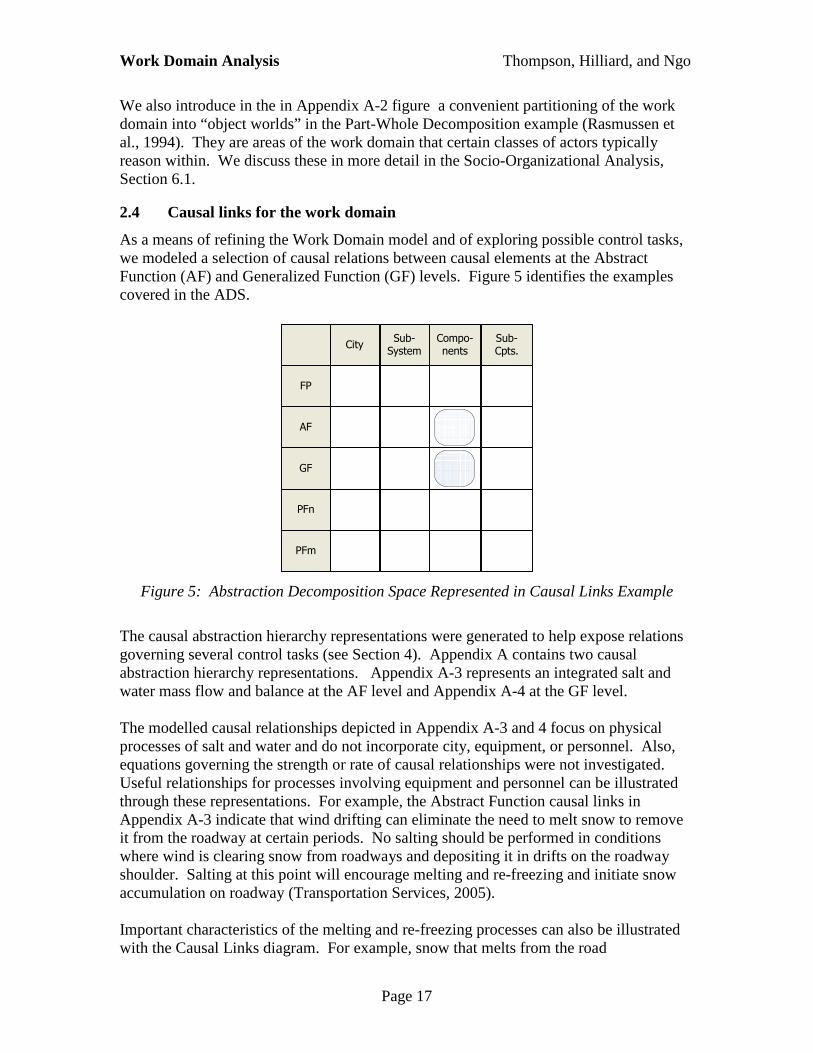
2.4 Causal links for the work domain
As a means of refining the Work Domain model and of exploring possible control tasks, we modeled a selection of causal relations between causal elements at the Abstract Function (AF) and Generalized Function (GF) levels. Figure 5 identifies the examples covered in the ADS.
CitySub-System
Compo-nents
Sub-Cpts.
PFm
PFn
GF
AF
FP
Figure 5: Abstraction Decomposition Space Represented in Causal Links Example
The causal abstraction hierarchy representations were generated to help expose relations governing several control tasks (see Section 4). Appendix A contains two causal abstraction hierarchy representations. Appendix A-3 represents an integrated salt and water mass flow and balance at the AF level and Appendix A-4 at the GF level. The modelled causal relationships depicted in Appendix A-3 and 4 focus on physical processes of salt and water and do not incorporate city, equipment, or personnel. Also, equations governing the strength or rate of causal relationships were not investigated. Useful relationships for processes involving equipment and personnel can be illustrated through these representations. For example, the Abstract Function causal links in Appendix A-3 indicate that wind drifting can eliminate the need to melt snow to remove it from the roadway at certain periods. No salting should be performed in conditions where wind is clearing snow from roadways and depositing it in drifts on the roadway shoulder. Salting at this point will encourage melting and re-freezing and initiate snow accumulation on roadway (Transportation Services, 2005). Important characteristics of the melting and re-freezing processes can also be illustrated with the Causal Links diagram. For example, snow that melts from the road
Work Domain Analysis Thompson, Hilliard, and Ngo
Page 18
accumulation and flows into regions of cooler road temperatures can re-freeze before draining, which will present an severe hazard through drastically reducing grip on the road.
2.5 Work Domain Model Weaknesses
The Work Domain Model as developed is not exhaustive and contains several identified weaknesses:
• Accuracy of salt application - This model does not account for how much salt dispersed from trucks stays on the traveled portion of the roads where it is useful. It has been recognized that different application choices have different effects: pre-wetting causes salt to 'bounce' less on bare roads, for example.
• Multiple locations of melting/freezing - The freeze/thaw cycle is most worth
modeling for snow on the roadway where ice can present a hazard to traffic flow. Melting and re-freezing has not been explicitly modeled for roadside snow.
• Stratification of snow on roads - A fine-grained level of detail is required to
show the benefits of Anti-Icing technology. A thin layer of salt applied to the roadway before snowfall has more useful effect than the same quantity of salt strewn on top of the snow, due to the disruption of the ice-road bond.
• Homogeneity of snow on roads - The laws of salt-water mixture melting and
freezing apply on a scale much finer than modeled in this analysis. Salt application and dissolving are not entirely sufficient to model these processes. Great care is taken in the existing system to ensure that salt spreaders are working properly and that mixing of salt and snow by traffic.
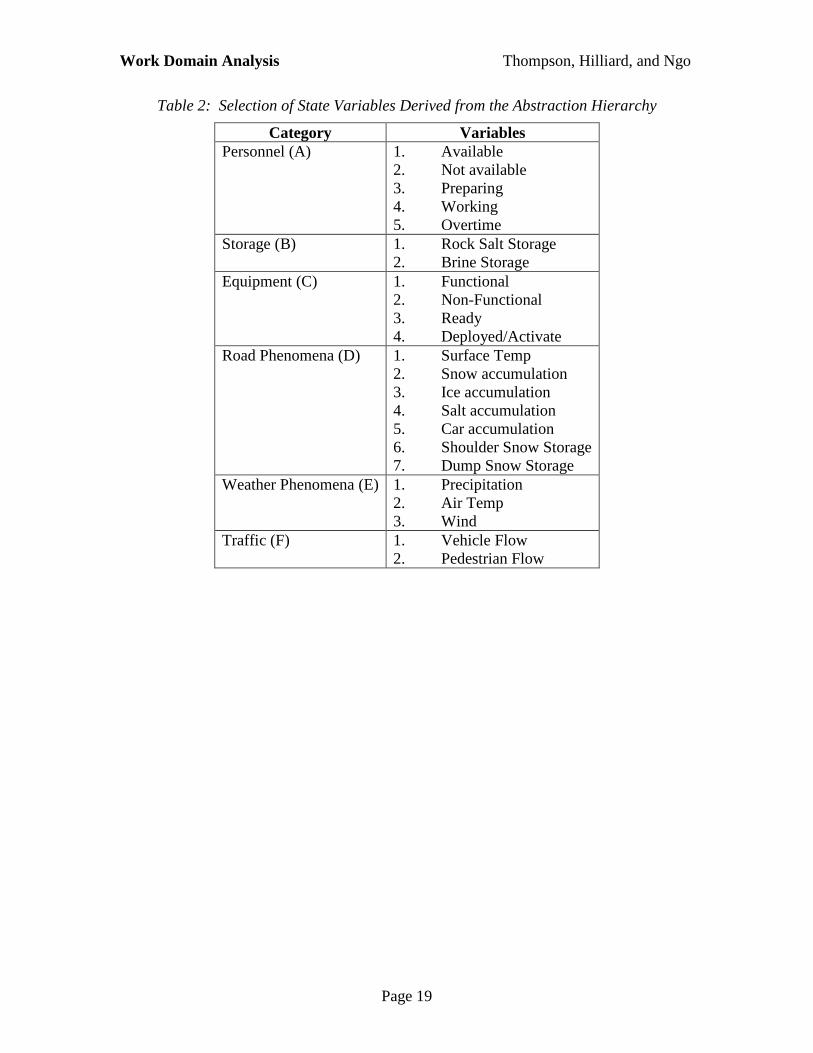
2.6 State Variables
An Information Availability Analysis was performed to begin to determine state variables for use in Activity Analysis and the Control Task Analysis. It is included in Appendix A-5 We subsequently aggregated the list to a subset of State Variables that we found useful to describe the state of winter maintenance operations. These were divided into categories suitable for conducting Control Task Analyses, organized along the lines of the “Object Worlds” discussed in the Socio-Organizational analysis.
Work Domain Analysis Thompson, Hilliard, and Ngo
Page 19
Table 2: Selection of State Variables Derived from the Abstraction Hierarchy
Category Variables Personnel (A) 1. Available
2. Not available 3. Preparing 4. Working 5. Overtime
Activity Analysis in Work Domain Terms Thompson, Hilliard, and Ngo
Page 20
3. ACTIVITY ANALYSIS IN WORK DOMAIN TERMS
The goal of this phase of the analysis is to identify what activities need to be done in the work domain. These activities are classified into known, recurring classes of situations and are “analysed in terms of a set of problems to solve or a set of task situations to cope with” (Rasmussen et al., 1994). This phase identifies the part of the work domain that is relevant for each class of activities and identifies constraints on what needs to be done (“prototypical work functions”) and when it needs to be done (“prototypical work situations”). Initially the difference between prototypical work functions and situations was that the latter are “well defined in time” but the former are not “clearly delimited in time” (Rasmussen et al., 1994). The analyst was to choose which representation was more appropriate based on the work domain, for example, work situations occur in hospitals (examination, hospitalization, operation, post-operative check, etc.) and work functions occur in manufacturing (subassembly, painting, assembly, packing, etc.). Recently these concepts were used orthogonally during a CWA for military teams (Naikar et al., 2003). In this case, the actors participate in a set of work situations where they are required to solve a set of work problems (i.e. work functions) to fulfill the work domain constraints. The work situations were represented by the different phases of a military mission and the work problems represented what needed to be done, such as “develop SA” or “manage crew”. The work problems were mapped onto work situations. This adaptation was used for the current study.
3.1 Prototypical Work Functions
Prototypical work functions include the Generalised Function processes along with supporting administrative and planning activities. Therefore the names tend to reflect the processes they represent or the language used by workers. The prototypical work functions for winter maintenance are shown in Figure 6. The single line circles represent temporally-dependent activities (Rasmussen termed these “transactional” activities) whereas the double line circles represent general, continuous activities (“resource planning”). The arrows between single line circles are similar to causal links in the abstraction hierarchy representation; they represent the sequence in which work functions must (or should) be completed. The arrows from double line circles indicate the temporal activities that these continuous activities support. The activities in the box are those that determine the current state of operation of the entire winter maintenance program. These are activated in response to storm activity.
Activity Analysis in Work Domain Terms Thompson, Hilliard, and Ngo
Page 21
Figure 6: Prototypical Work Functions
3.2 Prototypical Work Situations
Prototypical work situations are similar to the notion of operating modes (Vicente, 1999). For winter maintenance, prototypical work situations include the preparation period leading up to a storm, the escalation of storm types during a storm, and the clean-up period following the storm. These are based on regulatory constraints (Government of Ontario, 2001)and the logical sequence of activities. Storm types were determined based on these Municipal Code stipulations of the snow accumulation level when resources are to be deployed. The post-storm situations are based on the stipulations in the code of the time periods to complete clearing of snow accumulation. Table 3 places the prototypical work functions in the context of work situations. Dark grey represents the combinations that should occur, light grey represents the combinations that could occur (i.e. this solution may involve a trade-off of functional purposes) and white represents combinations that should not occur. These are cases where a constraint is violated or a functional purpose is violated. Examples of constraints affecting tasks include:
� No effective ploughing can be performed when there is less than 2cm of snow on the roadway surface.
� Anti-Icing is not possible once snow starts sticking to the roadway. � The effectiveness of De-Icing with rock salt degrades with increasing snow
accumulation and decreasing temperatures. � Sidewalk operations are only initiated after 8 cm of snow accumulation in order to
meet budgetary requirements.
Act
ivity
Ana
lysi
s in
Wor
k D
omai
n T
erm
s T
hom
pson
, Hill
iard
, and
Ngo
Pag
e 22
Table
3: P
roto
typic
al W
ork
funct
ions
vs.
Work
situ
atio
ns
Pre
-sto
rm
Sto
rm 3
Sto
rm 4
16 H
r20
Hr
24 H
r
Wor
k F
unct
ion
Tot
al s
now
ac
cum
ulat
ion
0-2.
5 cm
2.5-
5 cm
5-8
cm8-
15 c
m15
-25
cm>
25 c
m
Pre
par
ing
Eq
uip
men
tLo
ad s
alt &
brin
e in
to tr
ucks
, cal
ibra
te tr
ucks
, etc
.
Dep
loyi
ng
Per
son
nel
Act
ivat
e op
erat
ors
and
asso
ciat
e th
em w
ith e
quip
men
t
An
ti-I
cin
gB
reak
/pre
vent
ice-
road
bon
d by
spr
eadi
ng b
rine
De-
Icin
g
Red
uce
accu
mul
atio
n by
sal
t spr
eadi
ng
Plo
ug
hin
gR
educ
e ac
cum
ulat
ion
by p
loug
hing
to w
indr
ows
Win
gin
g b
ack
Incr
ease
sno
w s
tora
ge c
apac
ity b
y sh
iftin
g w
indr
ows
Sn
ow
rem
ova
lIn
crea
se s
now
sto
rage
cap
acity
by
mel
ting
or tr
ansp
ortin
g
Sid
ewal
k sa
ltin
gR
educ
e si
dew
alk
accu
mul
atio
n by
sal
ting
Sid
ewal
k p
lou
gh
ing
Red
uce
side
wal
k ac
cum
ulat
ion
by p
loug
hing
Dri
vew
ay W
ind
row
sA
llow
traf
fic fl
ow b
y sh
iftin
g dr
ivew
ay w
indr
ows
Fri
end
ly T
ow
ing
Red
uce
vehi
cle
accu
mul
atio
n by
"F
riend
ly T
owin
g"
Sto
rm 2
Sto
rm 1
Pos
t-st
orm
Sto
rm
Wor
k S
ituat
ion
Control Task Analysis Thompson, Hilliard, and Ngo
Page 23
4. CONTROL TASK ANALYSIS
The goal of the Control Task Analysis is “to identify the requirements associated with known classes of events” (Vicente, 1999). We chose a subset of the prototypical work functions in the Activity Analysis for Control Task Analysis. The tasks were selected to demonstrate the temporal constraints and cascading of prototypical work situations illustrated above and to provide a variety of presumed shunts and leaps in the mapping onto the Decision Ladder.
4.1 Modeling Commentary
4.1.1 Shunts / Leaps
As discussed elsewhere in this document, we did not have the opportunity to observe workers in their work environments and so were limited in data to back up our judgement of when shunts and leaps could be performed. We inferred from SME interviews that operations involving more cost always required more interpretation and evaluation of performance criteria (P. Noehammer, personal communication, February 21, 2006) Execution of anti-icing and the first few rounds of de-icing salt are currently performed without much consideration of functional purposes or ambiguity and were presumed to use many leaps and shunts. Some consideration is currently given to the need or appropriate time to stop de-icing operations and begin snowploughing, since any salt distributed on the roadway will be ploughed to the shoulder with consequent need for more salt and for environmental impact. Operations such as snow removal involve an order of magnitude higher cost than snowploughing, and therefore involve significantly more ambiguity and conflict between functional purposes. Current practices require consultation and escalation of authority in decision-making when initiating such costly procedures, reflected in this analysis by a reduction in shunts and leaps (Transportation Services, 2005).
4.1.2 Grain of Analysis
The prototypical work functions are modeled at a relatively coarse-grain level of analysis. For example, the ‘Execute’ step in the Decision ladder can represent a decision maker coordinating actions of other workers or could in itself be modelled as a decision ladder for another worker.
4.1.3 Multiple Loops vs. Multiple Ladders
Readying consists of the prototypical work functions “deploying personnel” and “preparing equipment” (Figure 6). The other temporally dependent activities (identified in the ‘state of operations’ box found in Figure 6) will each require elements of readying. For our modeling purposes, we considered two possible representations: The first representation uses several Decision Ladders, at a minimum one for the core elements of each ‘state of operation’ work function, and one for readying procedures common to several of the other work functions (Rasmussen et al., 1994). This has the advantage of re-use of modeling diagrams, but does not allow any idiosyncrasies in the readying
Control Task Analysis Thompson, Hilliard, and Ngo
Page 24
procedure to be tailored for different ‘state of operation’ work functions without diagrams becoming too complex. The second representation involves multiple ‘loops’ through the Decision Ladder, in which each information processing activity can involve different aspects of the work domain (Vicente, 1999). For example, when looping multiple times around the ladder, the “execute” box will represent first readying and next deploying. Likewise, the “knowledge of observations” circle will represent different observations needed for different loops around the decision ladder. The second ‘multiple-loop’ representation was chosen as it can more consistently represent the cycles of control tasks observed in the MWMP. Loops are represented by the use of different line types for the arrows, and transitions between ‘loops’ are marked.
4.2 Decision Ladders
The following four prototypical work functions were analyzed in this section as control tasks:
Decision Ladder representations for all control tasks are included below and attached in Appendix B.
4.2.1 Anti-Icing
Anti-icing is, when possible, the first control task performed in anticipation of a weather event. An activation signal of some kind alerts the operator to the probability of a snow or freezing rain event. If this activation is received with enough advance warning, anti-icing can be performed. The Decision Ladder for Anti-Icing is illustrated in Figure 7 below.
Control Task Analysis Thompson, Hilliard, and Ngo
Page 25
Figure 7: Decision Ladder for Anti-Icing control task
Control Task Analysis Thompson, Hilliard, and Ngo
Page 26
Observation of the current and future weather conditions to identify the air and pavement temperatures will indicate if an accumulation of snow or ice will occur. Pavement temperature is the most important variable, as snow falling in +1C air temperature on a -1C road will freeze and create unsafe driving conditions. If there is already a layer of salt on the road from a previous application, anti-icing may not need to be performed. Availability of personnel and equipment must also be observed to determine what time delays will be associated with their readying. Time of day and current traffic conditions must also be observed, as they are associated with delays in deployment. All are typically observed without extensive consideration of ‘what lies behind’, since the recurring class of anti-icing activities starts with bare roadways, a system state of reduced uncertainty that is more easily associated with observations. Depending on if the System conditions are appropriate for anti-icing and equipment is available, the Goal State of the system can be determined and a task formulated. This change in system condition may not be for a layer of anti-icer to be applied. If snow will be falling too soon, or conditions are too cold, or pavement is not bare, then salting or plowing may be the appropriate task. Task knowledge is often linked directly with knowledge of the procedure to accomplish it. As discussed below, pre-planned equipment routes are available for every section of the city, including complete main road coverage or ‘trouble spot’ coverage of hills and bridges depending on the anticipated weather. Once a procedure has been determined, the appropriate equipment and personnel must be readied for action. This involves a certain delay depending on the state of the personnel and equipment and the state of the traffic flow and car accumulation in the system. Once equipment and crews are on ‘stand-by’ near their assigned roadways, deploying must be delayed until an observation is made that the weather incident is approximately 1 hour away. This is due to physical constraints regarding anti-icer draining and dissolving rates. Once the anti-icers are deployed, a more in-depth evaluation of the system is performed in response to feedback from equipment operators and continued monitoring of the weather conditions. If the weather precipitation continues or temperatures drop, salting or ploughing is the next step. If the weather system is delayed but still likely to occur, the anti-icers may be redeployed. Rarely are ambiguities and interpretations about anti-icing considered at the highest levels of the Decision Ladder. The cost of the operation is not great, and weather events recur frequently enough that the decision making process is routine. Table 4 lists the state variables associated with the data processing and decision making processes for the Anti-Icing control task.
Control Task Analysis Thompson, Hilliard, and Ngo
Page 27
Table 4: Summary of State Variables for the Anti-Icing Decision Ladder
Loop From ���� To State Variables Readying Activation �Alert E-1 Precipitation
Observe �System State A-1 Available Personnel B-2 Brine Storage C-1 Functional Equipment D-1 Road Surface Temperature D-2 Snow Accumulation D-3 Ice Accumulation D-4 Salt Accumulation E Weather Phenomena F-1 Vehicle Flow
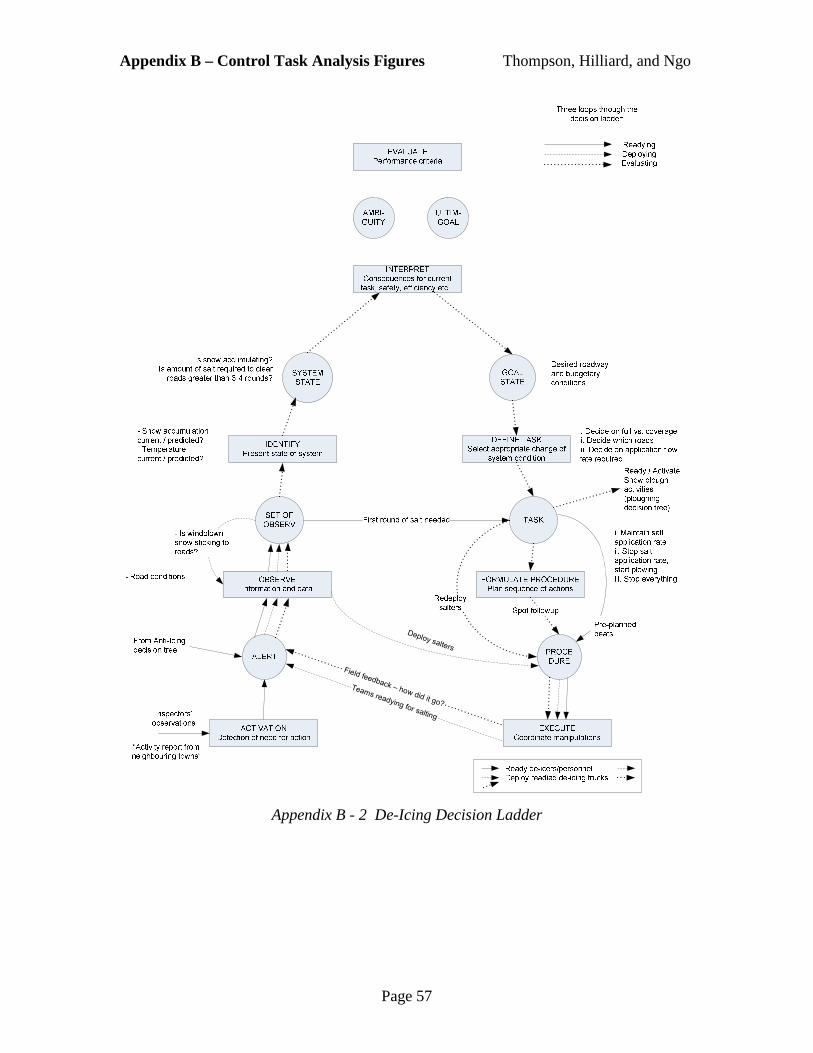
De-Icing has a similar structure to the Anti-Icing decision ladder, with some modifications. The De-Icing work function can be initiated either by weather reports and inspectors’ observations or by a determination of a new task during anti-icing actitivies. The De-Icing decision ladder is shown in Figure 8 below. A decision to begin a first round of salt is made without extensive consideration as shown by the leap between observations and task knowledge. An actual or forecasted snow accumulation on the roadway and a temperature of below 0C and above -20C are the primary roadway and weather indications that salting will be required. Equipment and personnel must also be available. As with Anti-icing, pre-planned procedures are extensively used, especially for the first round of salt coverage. Delaying dispatch of the first round of salt can have negative consequences, as the physical processes of salt-snow mixtures result in reduced melting ability when salt is applied on top of snow accumulation rather than underneath. After salting personnel are readying with their equipment, a timing decision must be made by the operator. As shown in the causal Work Domain links in Section 2.4, snow can be removed from roads by drifting due to wind action as long as there is no salt on the roads to begin melting and cause snow to accumulate. Readied crews can thus be delayed until roadway snow accumulation actually begins, resulting in a savings in salt requirements. Once snow accumulation begins, trucks and drivers are deployed. Field feedback on changing road conditions is relayed by drivers, and a more thorough examination of the work domain is performed to determine the extent of salting that is required. Tasks that can be considered are:
� To continue to apply salt throughout the city. This would be an appropriate decision if the predicted snow accumulation is small ( <5cm ) and will cease shortly.
� To de-mobilize most salting crews and send a reduced number of personnel and trucks to perform ‘spot-salting’ of problem areas. This would be an appropriate decision if the snow accumulation has stopped and if melting is proceeding in most locations.
� To ready snowplowing personnel and equipment. This would be an appropriate decision if the snow accumulation is predicted to continue and be large enough to reduce the economy and efficacy of salt.
� To de-mobilize all personnel and equipment. The subject matter expert has indicated that up to two re-deployments of pre-planned routes is often considered as the economic and environmental balance point between salt application and ploughing (P. Noehammer, personal communication, February 21, 2006). Decision-making regarding when to switch tasks is one of the core components of this control task.
Control Task Analysis Thompson, Hilliard, and Ngo
Page 29
Figure 8: Decision Ladder for De-Icing control task
Control Task Analysis Thompson, Hilliard, and Ngo
Page 30
4.2.3 Snowploughing
Snowploughing work functions are similar in procedure to de-icing, but without many of the weather and salt-water mixture work domain constraints. Ploughing has no dependency on road or air temperature and does not consume salt. Because of this, ploughs can be deployed under any weather circumstances without concern for freezing of salt-water mixtures. They can also be deployed without consideration of the functional purpose of minimizing environmental impact. Ploughs can also be deployed without requirements for periodic re-loading of rock salt or brine, although they are still constrained by the employees’ salary and shift work limitations. System state variables that are of interest to decision makers in a snowploughing situation are the level of snow accumulation on the roadway and the level of storage on the roadway shoulder. Ploughs have a capability limitation in that they can only reduce the level of snow accumulation on roadways to 2cm due to the requirement to raise plough blades on ‘shoes’ in the rough roads of urban environments. This means that there is always residual snow left on the roadways. If weather conditions do not facilitate melting, then de-icing must follow the last deployment of ploughs. Conversely, if snow accumulation exceeds the the ploughs’ capabilities to push snow onto the road shoulders, then specially equipped ‘winging back’ ploughs must be deployed to shift snow windrows further away from curbside. If snow accumulation is predicted to exceed the road capability to store snow, then Snow Removal operations must be considered. These operations are extremely expensive (P. Noehammer, personal communication, February 21, 2006) and will be expected to involve significant iteration between ambiguity and ultimate goals.
Control Task Analysis Thompson, Hilliard, and Ngo
Page 31
Readying for ploughing
ALERT
OBSERVEInformation and data
SET OF OBSERV
IDENTIFYPresent state of system
PROCEDURE
SYSTEM STATE
ULTIM-GOAL
GOAL STATE
TASK
AMBI-GUITY
INTERPRETConsequences for current
task, safety, efficiency etc...
DEFINE TASKSelect appropriate change of
system condition
FORMULATE PROCEDUREPlan sequence of actions
EXECUTECoordinate manipulations
ACTIVATIONDetection of need for action
EVALUATEPerformance criteria
Redeployploughs
Inspectors’ observations
- Inspectors observe the state of roads- Drivers report on effectiveness of plowing
Desired roadway conditions
Go to “De-Icing”, “Winging back” OR “Snow” removal if required
- Is snow still accumulating (Ploughing needed)?
- How much snow is on the shoulder (storage capacity)?
Figure 9: Decision Ladder for Snowploughing control task
Control Task Analysis Thompson, Hilliard, and Ngo
Page 32
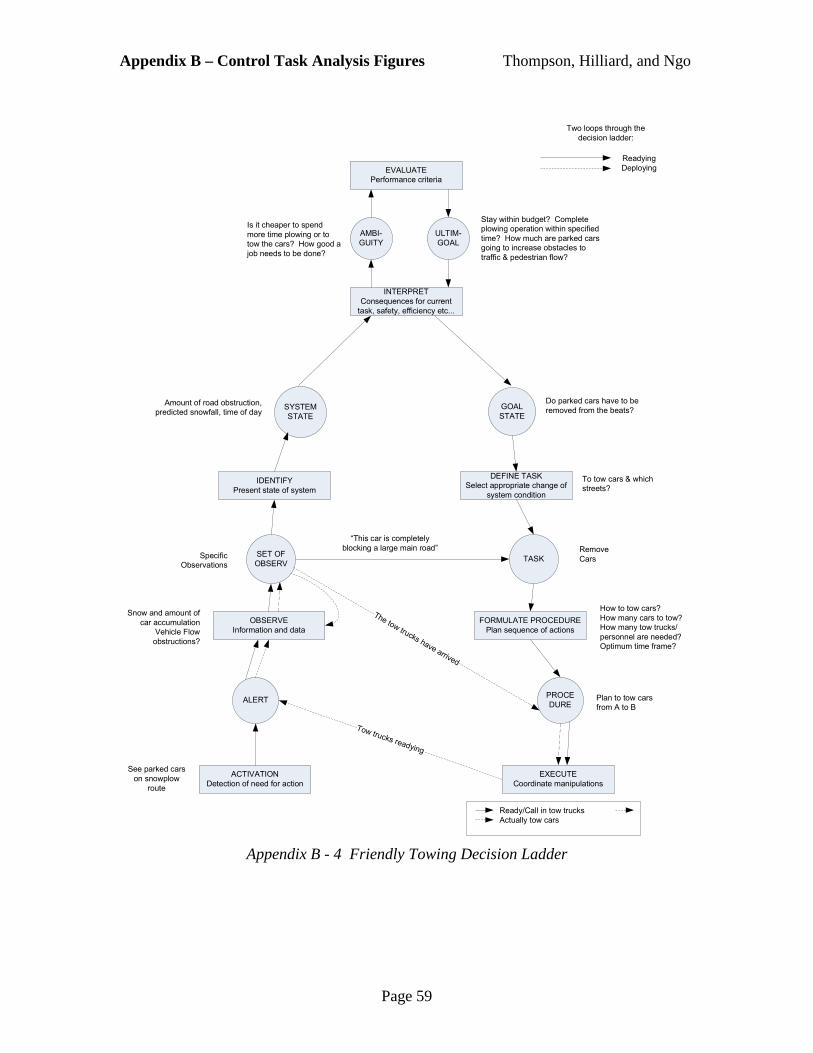
4.2.4 Friendly Towing
During snowploughing operations, parked car accumulation at the roadside can negatively affect the outcome of work due to the snowploughs’ limited capability to manoeuvre and their limitations of continuous ploughing of snow. Large snow windrows impede traffic flow and remain even after the car owner removes their vehicle. Therefore it is sometimes economical to employ towing equipment to relocate parked cars so that ploughing processes can move snow accumulation to the roadside. This decision tree shows a requirement for interpretation and evaluation on the first loop through the decision ladder due to the large cost in personnel time to execute this operation. An anticipated exception is if a car is completely preventing a snowplough from clearing a main road of large economic value to the city transportation and with a large potential for safety concerns. Due to its high cost, Friendly Towing is often not employed on a city-wide basis, so pre-planned procedures are not used.
Control Task Analysis Thompson, Hilliard, and Ngo
Page 33
ULTIM-
GOAL
AMBI-
GUITY
INTERPRET
Consequences for current
task, safety, efficiency etc...
EVALUATE
Performance criteria
“This car is completely
blocking a large main road”
See parked cars
on snowplow
route
Snow and amount of
car accumulation
Vehicle Flow
obstructions?
Specific
Observations
Do parked cars have to be
removed from the beats?
To tow cars & which
streets?
Remove
Cars
How to tow cars?
How many cars to tow?
How many tow trucks/
personnel are needed?
Optimum time frame?
Plan to tow cars
from A to B
Amount of road obstruction,
predicted snowfall, time of day
Is it cheaper to spend
more time plowing or to
tow the cars? How good a
job needs to be done?
Stay within budget? Complete
plowing operation within specified
time? How much are parked cars
going to increase obstacles to
traffic & pedestrian flow?
Tow trucks readying
ALERT
OBSERVE
Information and data
SET OF
OBSERV
IDENTIFY
Present state of system
PROCE
DURE
SYSTEM
STATE
GOAL
STATE
TASK
DEFINE TASK
Select appropriate change of
system condition
EXECUTE
Coordinate manipulations
ACTIVATION
Detection of need for action
The tow trucks have arrived
FORMULATE PROCEDURE
Plan sequence of actions
Ready/Call in tow trucks
Actually tow cars
Readying
Deploying
Two loops through the
decision ladder:
Figure 10: Decision Ladder for “Friendly Towing” control task
Strategies Analysis Thompson, Hilliard, and Ngo
Page 34
5. STRATEGIES ANALYSIS
The purpose of the strategies analysis phase of CWA is to describe the process of how prototypical work functions can be accomplished (Rasmussen et al., 1994). Two different approaches for strategies analysis were investigated and applied to two different prototypical work functions.
5.1 Comparing strategies based on work domain criteria
The first approach presented in Appendix D-1 involved looking at strategies as a means of combining and transitioning between control tasks or different ways of using state variables within a control task. This method included examining the advantages and disadvantages of the strategy with respect to the functional purposes identified in the Abstraction Hierarchy (see Section 2.2) and with respect to a set of performance criteria we developed. We chose to investigate salt dissolving (analogous to brine production), which is a physical process that actors reason about when performing the De-icing control task. This particular control task was chosen because the task involved balancing natural physical laws, considering legal constraints, and equipment variability. The strategies identified for dissolving salt in the context of the MWMP are:
• Spread rock salt directly on road • Spread rock salt pre-wetted with water • Spread rock salt pre-wetted with brine • Apply brine directly on road
These strategies were compared against each functional purpose tradeoff and performance factor. We generalized that the different strategies may vary in workload (planner and equipment operator) and in the time to perform the control task (in-house9 time and field time10). A rating scale using the symbols +, -, and = was used as a means of comparing the strategies across each dimension. The ‘+’ meant that the strategy was positive with respect to dimension, ‘-‘ meant that the strategy was negative, and ‘=’ meant that the strategy was neither positive nor negative on a dimension. In addition to these symbols, where necessary, the cells were annotated with the rationale as to why a particular rating was assigned. The results of the analysis show that the strategy of ‘Spreading rock directly on road’ generates the most positive ratings in terms of the performance factors but conversely generates the most negative ratings with respect to the functional purpose tradeoffs. The strategy of ‘Spreading rock salt pre-wetted with water’ had very little impact on performance factors and relatively no impact on the functional purpose tradeoffs. Spreading rock salt pre-wetted with brine was rated negatively because of the additional activities associated with brine production and yet had very little impact on the functional
9 In this context, ‘in-house’ refers to activities performed by employees of the MWMP, including transportation. 10 Field time encompasses the time from which the salt or brine is deposited on the roadway to the time where natural processes of dissolving and melting have resulted in the desired system state change.
Strategies Analysis Thompson, Hilliard, and Ngo
Page 35
purpose tradeoffs. Finally, the strategy of ‘Spreading brine directly on road’ generated a positive rating with respect to field time and overall positive ratings for the functional purpose tradeoffs because of the minimized amount of salt usage. These strategies offer more support for decision-makers than a normative strategy formulation (Vicente, 1999) in that they do not specify a sequence of operations, but instead indicate options for which means to accomplish a change in system state can be employed. They capture work domain constraints and provide support for choice of decision-making based on the functional purpose requirements of the system at any point in time.
5.2 Comparing strategies based on decision-making criteria
In our second analysis we compared the definition of a strategy as a “category of cognitive task procedures that transforms an initial state of knowledge into a final state of knowledge” (Vicente, 1999). We used this definition to better incorporate “mental” strategies associated with the information processing steps of a control task. As documented in Appendix C-2, we looked at the various mental strategies that may be used to complete selected data processing activities of a decision ladder tree for De-icing. These mental strategies are summarized below.
Table 5: Strategies Identified for Reviewed Data Processing Activities for the De-icing Task
Data Processing Activity Strategy Activation Self-activated
Observe Info / Data Observe all state information (exhaustive)
Observe the information as it comes in and assume the rest (serial and self-terminating search)
Observe with past experience or protocol and sample selected info and assume the rest (structured search)
Identify System State Generalize from limited observations using stored mental model (use of heuristics)
Use related observations to deduce unknown system state variable (e.g. snowfall rate and pavement temperature = guesstimate of snow accumulation)
Formulate Procedure Select a pre-planned set of beats
Select custom subset of pre-planned beats
Generate beats with pre-planned procedure templates
Generate freeform custom routes
Strategies Analysis Thompson, Hilliard, and Ngo
Page 36
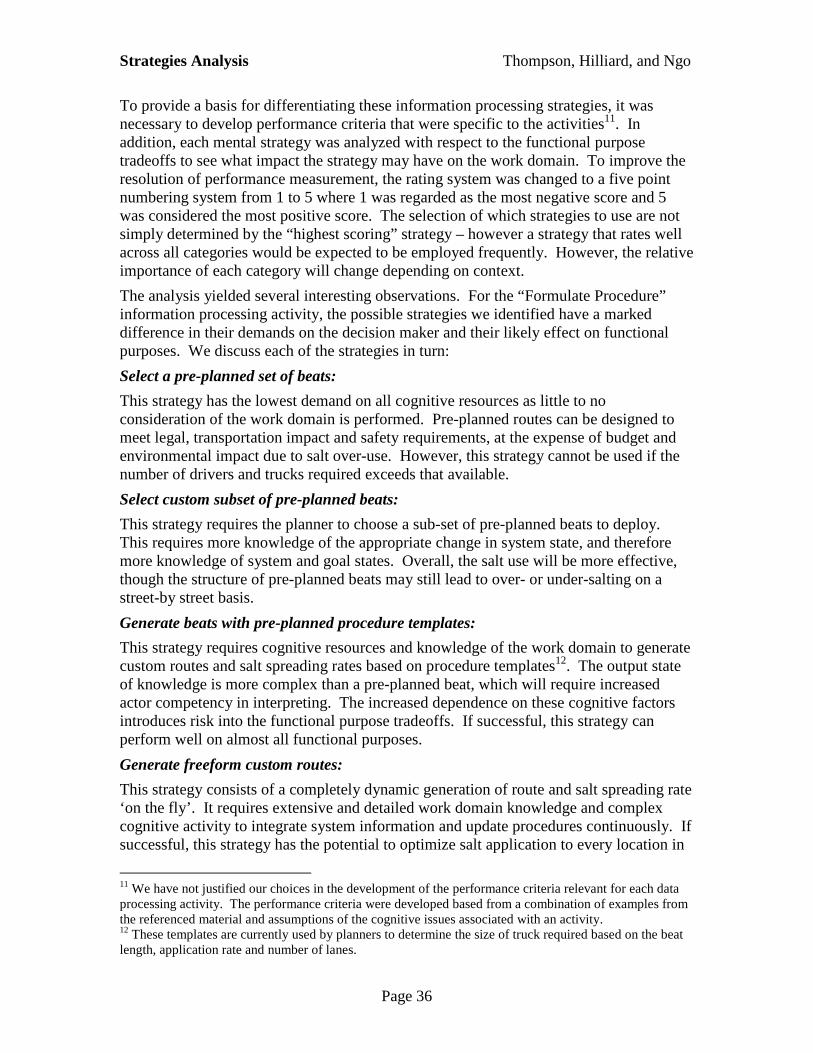
To provide a basis for differentiating these information processing strategies, it was necessary to develop performance criteria that were specific to the activities11. In addition, each mental strategy was analyzed with respect to the functional purpose tradeoffs to see what impact the strategy may have on the work domain. To improve the resolution of performance measurement, the rating system was changed to a five point numbering system from 1 to 5 where 1 was regarded as the most negative score and 5 was considered the most positive score. The selection of which strategies to use are not simply determined by the “highest scoring” strategy – however a strategy that rates well across all categories would be expected to be employed frequently. However, the relative importance of each category will change depending on context.
The analysis yielded several interesting observations. For the “Formulate Procedure” information processing activity, the possible strategies we identified have a marked difference in their demands on the decision maker and their likely effect on functional purposes. We discuss each of the strategies in turn:
Select a pre-planned set of beats:
This strategy has the lowest demand on all cognitive resources as little to no consideration of the work domain is performed. Pre-planned routes can be designed to meet legal, transportation impact and safety requirements, at the expense of budget and environmental impact due to salt over-use. However, this strategy cannot be used if the number of drivers and trucks required exceeds that available.
Select custom subset of pre-planned beats:
This strategy requires the planner to choose a sub-set of pre-planned beats to deploy. This requires more knowledge of the appropriate change in system state, and therefore more knowledge of system and goal states. Overall, the salt use will be more effective, though the structure of pre-planned beats may still lead to over- or under-salting on a street-by street basis.
Generate beats with pre-planned procedure templates:
This strategy requires cognitive resources and knowledge of the work domain to generate custom routes and salt spreading rates based on procedure templates12. The output state of knowledge is more complex than a pre-planned beat, which will require increased actor competency in interpreting. The increased dependence on these cognitive factors introduces risk into the functional purpose tradeoffs. If successful, this strategy can perform well on almost all functional purposes.
Generate freeform custom routes:
This strategy consists of a completely dynamic generation of route and salt spreading rate ‘on the fly’. It requires extensive and detailed work domain knowledge and complex cognitive activity to integrate system information and update procedures continuously. If successful, this strategy has the potential to optimize salt application to every location in
11 We have not justified our choices in the development of the performance criteria relevant for each data processing activity. The performance criteria were developed based from a combination of examples from the referenced material and assumptions of the cognitive issues associated with an activity. 12 These templates are currently used by planners to determine the size of truck required based on the beat length, application rate and number of lanes.
Strategies Analysis Thompson, Hilliard, and Ngo
Page 37
the city. If done poorly, confusion and disorganization could result in catastrophically poorer performance.
It should be noted that these strategies are not exclusive and that actors can select between these strategies dynamically in response to system conditions. For example, an actor could select a subset of pre-planned beats to deploy. In the process of selecting pre-planned beats, knowledge of a constraint in the work domain, for example a blocked route due to road construction, could result in a need to switch to generating a custom beat for a vehicle. Another actor executing the pre-planned beat could switch to a custom freeform strategy in response to another disturbance, for example navigating around a vehicle collision, and resume the pre-planned beat afterwards.
Social Organization and Cooperation Analysis Thompson, Hilliard, and Ngo
Page 38
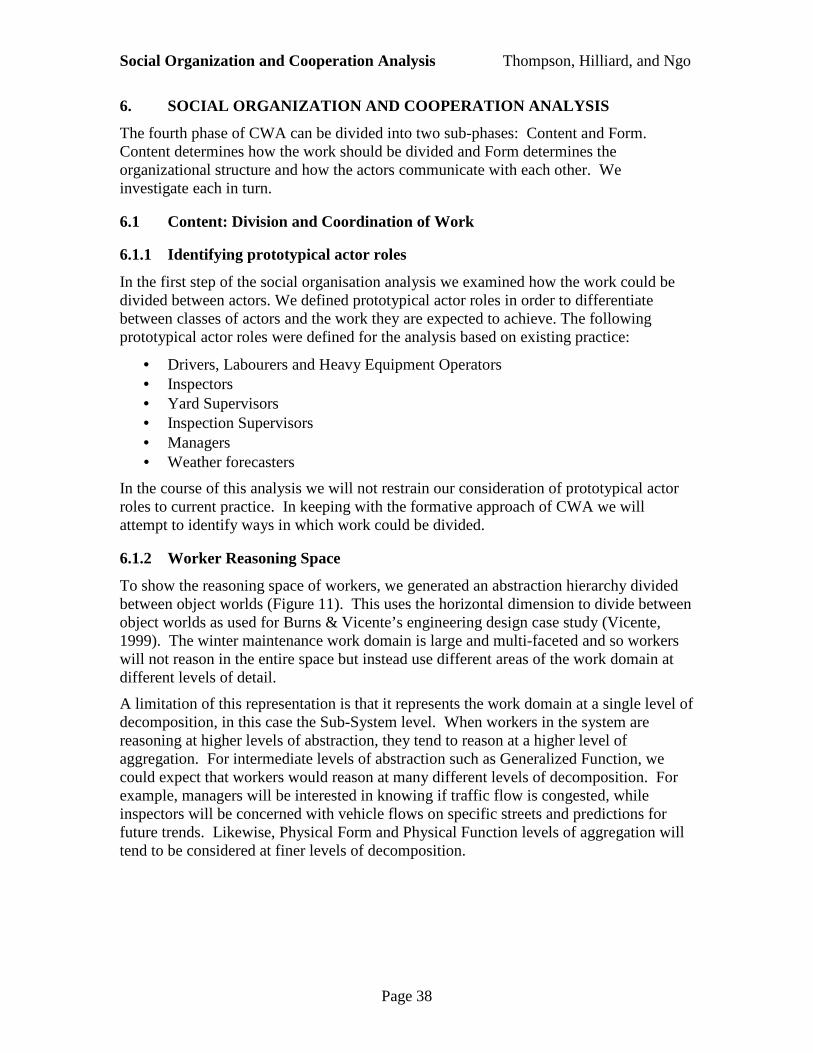
6. SOCIAL ORGANIZATION AND COOPERATION ANALYSIS
The fourth phase of CWA can be divided into two sub-phases: Content and Form. Content determines how the work should be divided and Form determines the organizational structure and how the actors communicate with each other. We investigate each in turn.
6.1 Content: Division and Coordination of Work
6.1.1 Identifying prototypical actor roles
In the first step of the social organisation analysis we examined how the work could be divided between actors. We defined prototypical actor roles in order to differentiate between classes of actors and the work they are expected to achieve. The following prototypical actor roles were defined for the analysis based on existing practice:
• Drivers, Labourers and Heavy Equipment Operators • Inspectors • Yard Supervisors • Inspection Supervisors • Managers • Weather forecasters
In the course of this analysis we will not restrain our consideration of prototypical actor roles to current practice. In keeping with the formative approach of CWA we will attempt to identify ways in which work could be divided.
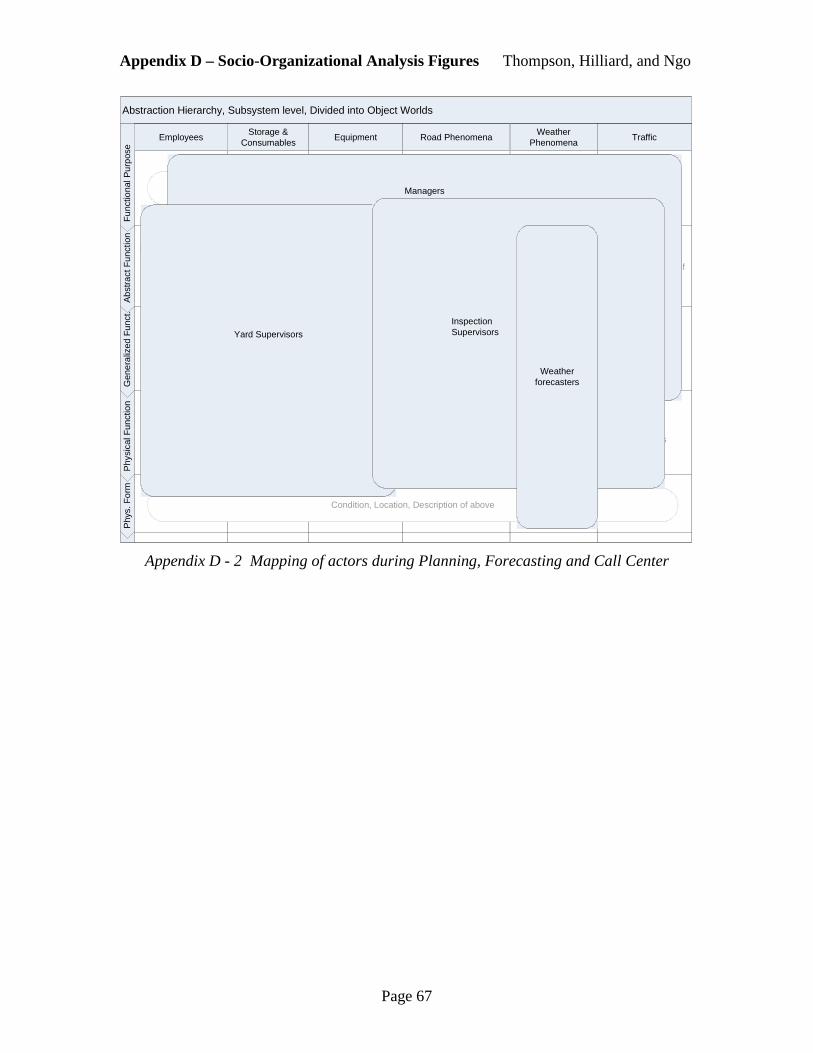
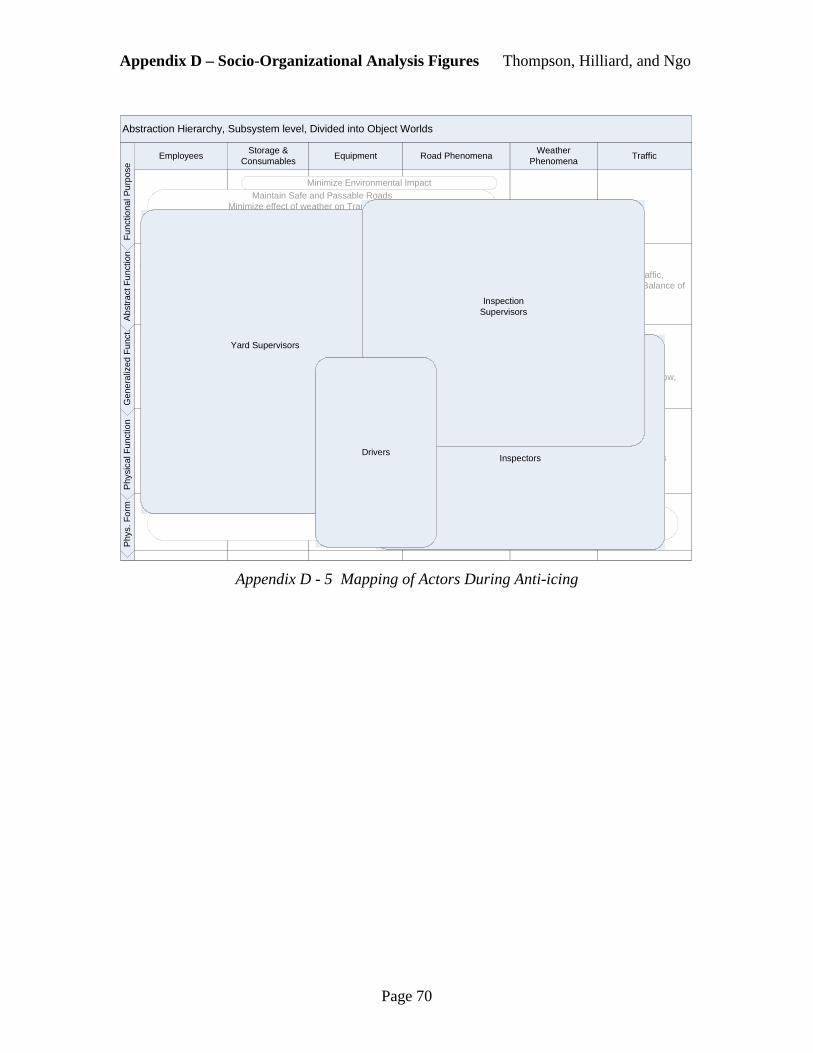
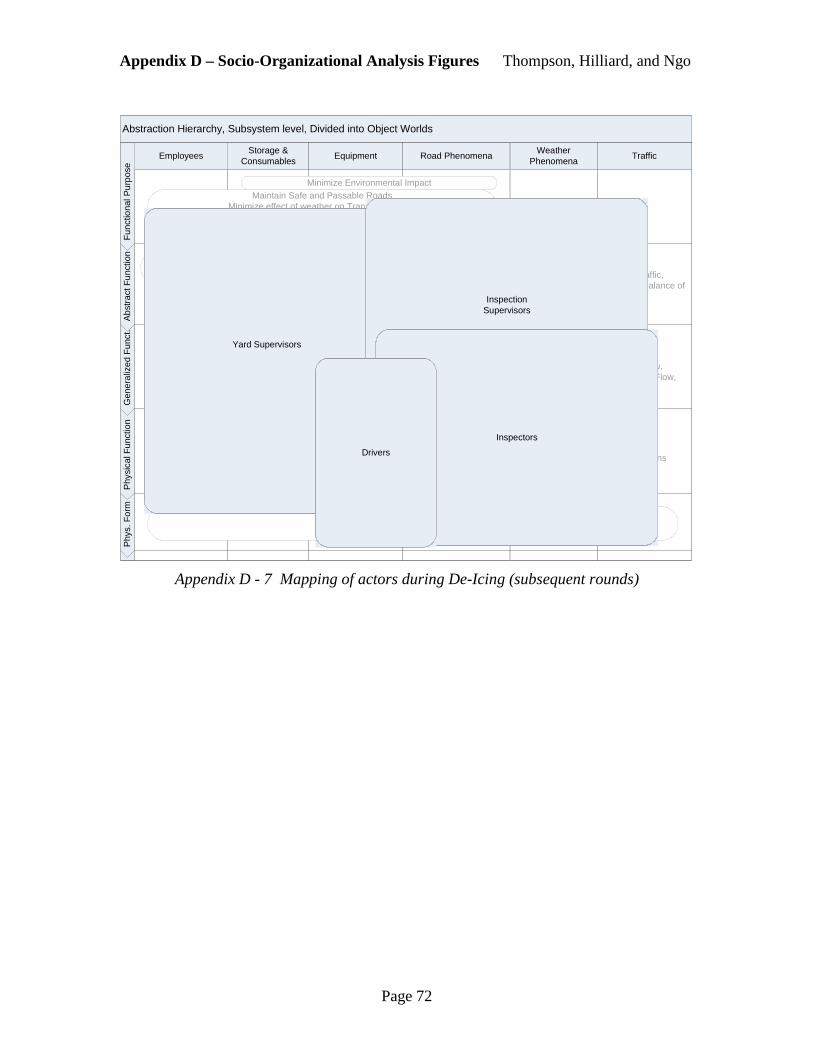
6.1.2 Worker Reasoning Space
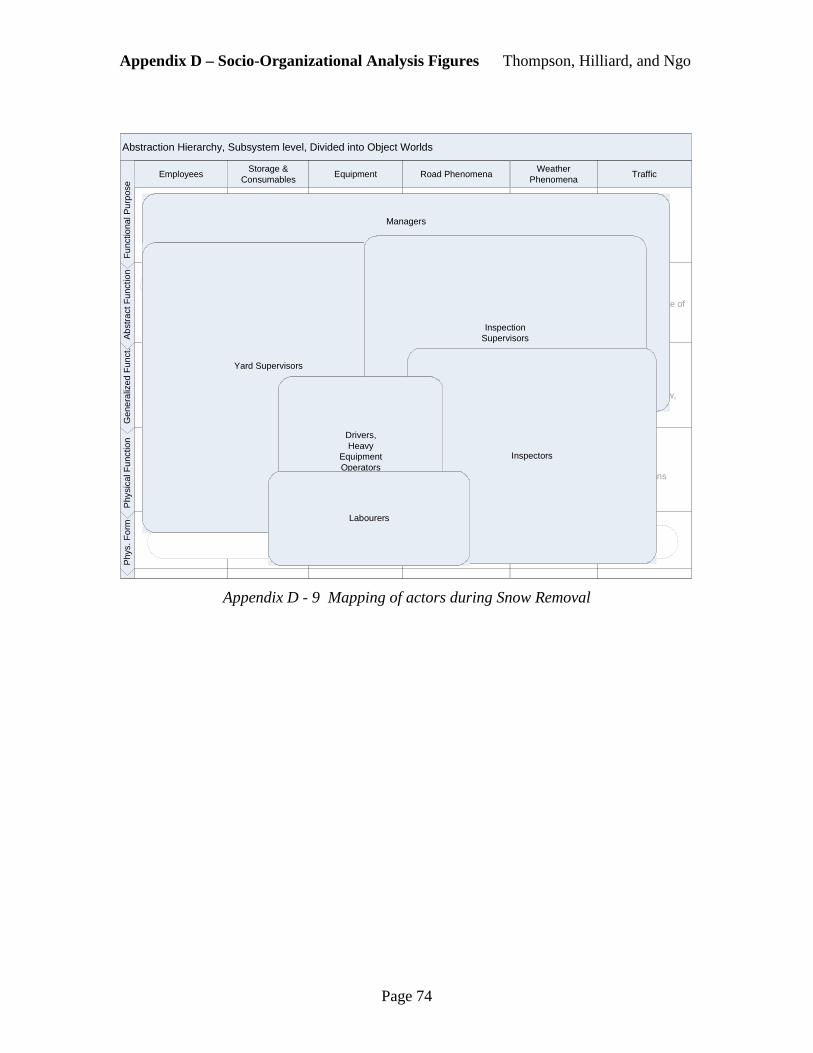
To show the reasoning space of workers, we generated an abstraction hierarchy divided between object worlds (Figure 11). This uses the horizontal dimension to divide between object worlds as used for Burns & Vicente’s engineering design case study (Vicente, 1999). The winter maintenance work domain is large and multi-faceted and so workers will not reason in the entire space but instead use different areas of the work domain at different levels of detail.
A limitation of this representation is that it represents the work domain at a single level of decomposition, in this case the Sub-System level. When workers in the system are reasoning at higher levels of abstraction, they tend to reason at a higher level of aggregation. For intermediate levels of abstraction such as Generalized Function, we could expect that workers would reason at many different levels of decomposition. For example, managers will be interested in knowing if traffic flow is congested, while inspectors will be concerned with vehicle flows on specific streets and predictions for future trends. Likewise, Physical Form and Physical Function levels of aggregation will tend to be considered at finer levels of decomposition.
Social Organization and Cooperation Analysis Thompson, Hilliard, and Ngo
Page 39
Figure 11: The abstraction hierarchy divided between object worlds
With the workers reasoning space defined, we can describe the prototypical worker roles in more detail. We used the criteria identified for dividing worker roles (Vicente 1999, Rasmussen 1994) and have highlighted their appearance in the following description.
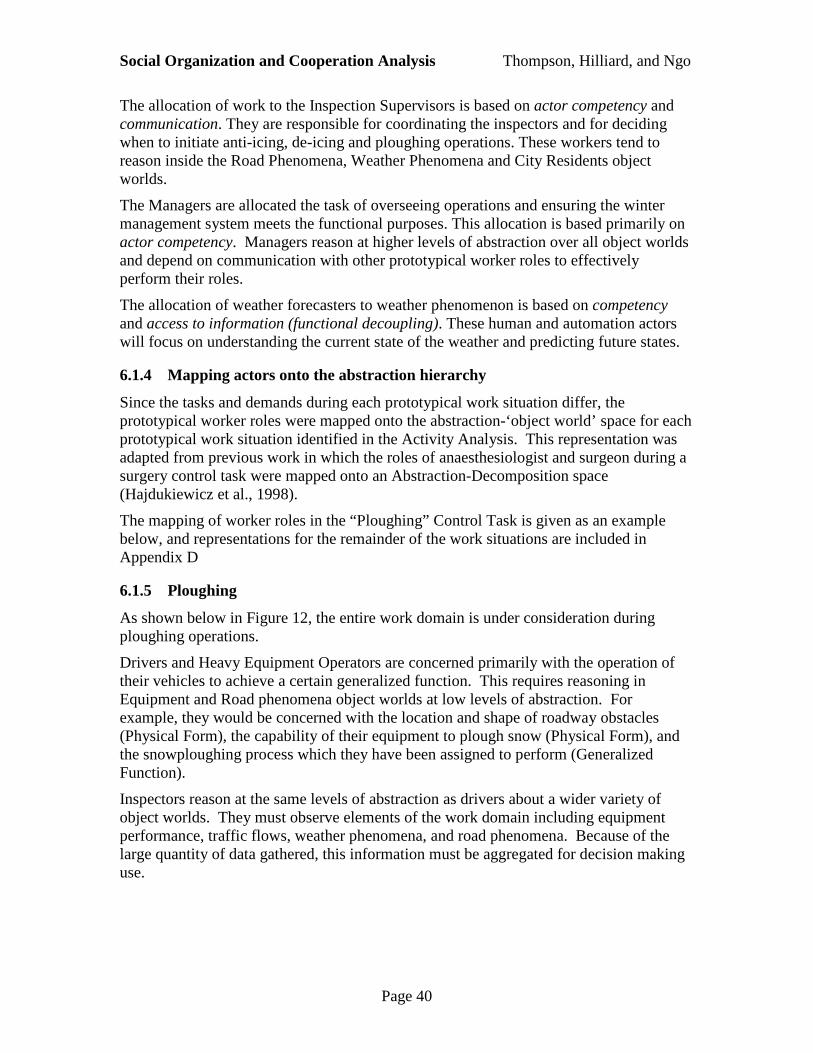
6.1.3 Defining prototypical Worker Roles
For the drivers, labourers and heavy equipment operators, the division of work is based on union regulations and actor competency. These are human workers that are trained in the skills required for use of particular equipment (e.g. plough) and the rules to achieve a generalized function (e.g. snow ploughing). These actors primarily reason within the lower levels of the Equipment object world. They communicate with each other and to their Yard Supervisor.
The division of work demands to Inspectors depends primarily on access to information. These actor(s) are responsible for monitoring the road & traffic conditions and deciding when to initiate de-icing activity since they have the most immediate access to these conditions. This role could be either allocated to human workers or an automated sensor network, for example.
The allocation of work to the Yard Supervisors is based on actor competency and communication. They are responsible for the coordination and deployment of workers at their yard/camp. These workers tend to reason inside the Employees, Storage & Consumables and Equipment object worlds.
Social Organization and Cooperation Analysis Thompson, Hilliard, and Ngo
Page 40
The allocation of work to the Inspection Supervisors is based on actor competency and communication. They are responsible for coordinating the inspectors and for deciding when to initiate anti-icing, de-icing and ploughing operations. These workers tend to reason inside the Road Phenomena, Weather Phenomena and City Residents object worlds.
The Managers are allocated the task of overseeing operations and ensuring the winter management system meets the functional purposes. This allocation is based primarily on actor competency. Managers reason at higher levels of abstraction over all object worlds and depend on communication with other prototypical worker roles to effectively perform their roles.
The allocation of weather forecasters to weather phenomenon is based on competency and access to information (functional decoupling). These human and automation actors will focus on understanding the current state of the weather and predicting future states.
6.1.4 Mapping actors onto the abstraction hierarchy
Since the tasks and demands during each prototypical work situation differ, the prototypical worker roles were mapped onto the abstraction-‘object world’ space for each prototypical work situation identified in the Activity Analysis. This representation was adapted from previous work in which the roles of anaesthesiologist and surgeon during a surgery control task were mapped onto an Abstraction-Decomposition space (Hajdukiewicz et al., 1998).
The mapping of worker roles in the “Ploughing” Control Task is given as an example below, and representations for the remainder of the work situations are included in Appendix D
6.1.5 Ploughing
As shown below in Figure 12, the entire work domain is under consideration during ploughing operations.
Drivers and Heavy Equipment Operators are concerned primarily with the operation of their vehicles to achieve a certain generalized function. This requires reasoning in Equipment and Road phenomena object worlds at low levels of abstraction. For example, they would be concerned with the location and shape of roadway obstacles (Physical Form), the capability of their equipment to plough snow (Physical Form), and the snowploughing process which they have been assigned to perform (Generalized Function).
Inspectors reason at the same levels of abstraction as drivers about a wider variety of object worlds. They must observe elements of the work domain including equipment performance, traffic flows, weather phenomena, and road phenomena. Because of the large quantity of data gathered, this information must be aggregated for decision making use.
Social Organization and Cooperation Analysis Thompson, Hilliard, and Ngo
Page 41
Fu
nc
tio
na
l P
urp
os
eA
bs
tra
ct
Fu
nc
tio
nG
en
era
lize
d F
un
ct.
Ph
ys
ica
l F
un
cti
on
Ph
ys
. F
orm
Figure 12: Mapping of actors on the AH during Ploughing
Inspection Supervisors use this aggregated data to reason at higher levels of abstraction to identify the state of the road network and weather phenomena. They advise and discuss with Managers aspects of functional purpose decision making.
Yard Supervisors are responsible for reasoning about the system state of the employee, storage, and equipment object worlds, primarily in MWMP Camps and Equipment Yards. The physical size of this portion of the work domain is smaller, and allows for one worker to more directly observe and interpret the state of the system. They provide a link between managers and individual Drivers by communicating procedures and relaying observations. They interpret these observations and perform advising and discussing with Managers.
Managers are responsible for ensuring functional purpose goals are being achieved, since the ploughing prototypical work function has an associated increased potential impact on city economic activity and on budgetary expenditures. They would typically reason between the Generalized Function and Functional Purpose levels of abstraction and would consider the entire work domain at an aggregated level of detail as discussed above.
Social Organization and Cooperation Analysis Thompson, Hilliard, and Ngo
Page 42
6.2 Form: Social Organisation
6.2.1 Identifying Communication Requirements
The prototypical worker roles introduced above were adapted from the current organisational structure of the MWMP, which contains many more roles than those actually modeled. The current work organisation and communication network was analyzed by means of a communication matrix (Rasmussen et al., 1994) included in Appendix D-1. Entries in the matrix link an information source to an information receiver. Rather than simply identifying a connection, this representation was adapted to include the means of communication (e.g. direct conversation, cell phone, two-way radio, paper form, website, etc) as indicated in the “Communications Guidelines for Storm Response” (Transportation Services, 2005).
One observation that has implications for systems design is that the existing communication system transmits information via many different sources to actors in the system. The current two-way radio communication used by drivers and inspectors facilitates transfer of knowledge of observations between actors. The vocal/aural mode is appropriate as it should interfere less with the visual/motor activity of operating heavy equipment. Another means of communication used between low-level workers and their supervisors are an assortment of daily paper logs and forms, which serve a documentation purpose but are burdensome and potentially a source of data conversion inaccuracy and inaccessible information. The design evaluation of an appropriate social communication system could be considered for future research.
6.2.2 Mapping actors on to a social organisation
Since the MWMP covers such a large, diverse geographic area, it has been divided into four districts (north, south, east and west). This could potentially be an area where CWA could be used to redefine the boundaries and/or number of districts. Districts have similar, but also distinct capabilities and constraints. For example, the downtown core (currently South District) has many narrow, one-way streets and very little snow storage. On the other hand, it has higher average temperatures and receives less snow than the suburb areas north of highway 401 (currently North District) and so most storms can be treated with de-icing operations as opposed to ploughing operations.
CWA could suggest that the district organizational boundaries be drawn to contain more homogenized constraints relating to weather phenomena, environmental impact and road networks, as well as social constraints (e.g. communication). This could facilitate decision-making by simplifying the operation of interpreting observations into knowledge of system states. District sizes could be constrained by limitations to acceptable mobilization delays and effective operational range of vehicles.
A proposed social organisation is shown in Figure 13. Each district has yards to store equipment and camps to store equipment and personnel. These are distributed geographically so as to minimise travel time on the road network. An authority related hierarchy (adaptive model) is mirrored across each district and communication between districts starts at the Supervisor level.
Social Organization and Cooperation Analysis Thompson, Hilliard, and Ngo
Page 43
During routine operations between storms, most of the communication is between low-level actors and their supervisors. Yard workers are involved in maintenance activities and managers are involving in planning activities. Inspectors are a source to trigger winter maintenance activities and are given the authority to call a first round of de-icing.
During storms with more significant ploughing activities (such as a Type 2 storm described in Figure 6), a coordination centre is established and consists of supervisors, managers and weather forecasters. The aim is to aid decision making (knowledge-based behaviour) and to “facilitate the communication needed for coordination” (Vicente, 1999) During storm response, the authority hierarchy remains but moves towards a military type model where specific goals are communicated down to lower levels instead of overall objectives. The costs and risks are high and so the budgetary, safety and environmental responsibilities are assigned up the chain of command. Decisions for winter maintenance activities do not need to be made in very short time periods and so this hierarchy can support this type of decision making.
Winter Maintenance
District B Manager
District C Manager
District A Manager
District N Manager
Yard n Supervisors
Camp nSupervisors
InspectionSupervisors
Drivers
Inspectors
Heavy Equipment Operators
Labourers
Drivers
Heavy Equipment Operators
Labourers
Weatherforecasters
Figure 13: Formative structure of a possible social organization
Worker competencies analysis Thompson, Hilliard, and Ngo
Page 44
7. WORKER COMPETENCIES ANALYSIS
The final stage of CWA is intended to specify what cognitive abilities that actors must possess to successfully perform their assigned work functions in the System. The results of previous phases of analysis provide a foundation in which the required worker competencies of a set of actors under consideration can be evaluated. We employ the Skills, Rules, Knowledge (SRK) taxonomy as developed by Rasmussen (Rasmussen, 1983) to classify and provide a framework for this analysis of performance.
7.1 Signals, signs and symbols in the MWMP
The "Friendly Towing" Control Task can be used to illustrate examples of how observations of elements of the work domain can be interpreted as signals, signs or symbols and support skill-, rule-, or knowledge-based behavior for a variety of actors. A parked car on a busy snow-filled road could be interpreted as a signal by a snowplow driver, prompting her to maneuver the snowplow around the vehicle using subconsciously-coordinated sensorimotor movements. An Inspection Supervisor, on being notified by an Inspector or Driver of the parked car now being surrounded by snow from the snowploughing activity, could interpret the parked car as a symbol implying that cleanup ploughing operations or friendly towing activities might be required to maintain functional purpose goals of minimizing impact on city economic activity and safe and passable roads. The Tow Truck Driver assigned with the task of clearing parked cars from a specified area of the road network would interpret the parked car as a sign that he would recognize as a cue for the task of towing the car.
7.2 SRK-based behaviour for alternative strategies
In Section 5.2, we discussed potential strategies that could be used for the “Formulate Procedure” information processing activity in the De-Icing control task. The different options for matching resources to demand had different demands on actor cognitive abilities and had different potentials for satisfying functional purposes. The greatest potential for performance was also associated with the highest demands on decision-making abilities. Using a fixed distribution of responsibilities between actors, we can model the required worker competencies for three prototypical worker classes: Planners, Yard Supervisors, and Drivers. The results are presented in Table 6 for the “Select Custom subset of pre-planned beats” strategy and Table 7 for the “Generate Custom Freeform Routes” strategies identified in Section 5.2.
Worker competencies analysis Thompson, Hilliard, and Ngo
Page 45
Table 6: De-Icing with the strategy “select custom subset of pre-planned beats”
Planner Yard Supervisor Driver
Skill-based behaviour
(signals)
None None Info from the driving scene is interpreted as signals for sensori-motor control of the vehicle
Rule-based behaviour
(signs)
Use of previous experience and problem-solving to generate rule-based procedures
Knowledge of a set of observations or of the system state (snow accumulating) cues an associated task (De-Icing) and associated activity timing and routes
Search for cues in the environment to follow prescribed route. Road signs, communication codes.
Knowledge-based behaviour
(symbols)
Examine hypothetical system states and interpret consequences for possible goal states (reason analytically)
Knowledge of a set of observations informs heuristic thought experiments concerning decisions (redeploy salters?)
Table 7: De-Icing with the strategy “Generate freeform custom routes”
Planner Yard Supervisor Driver
SBB (signals) None None As above
Rule-based behaviour
(signs)
None Knowledge of a set of observations or of the system state (snow accumulating) cues an associated task, with no pre-defined timing or routes
Search for cues in environment to dynamically generate route. Match salt application rate to snow accumulation on roadway, etc.
Knowledge-based behaviour
(symbols)
Examine hypothetical worst-case of system states and check that ends can be satisfied by available means
Determine required change in system conditions (Task), based on desired goal state
As above, plus maintain dynamic mental model of road network conditions & history. Coordinate future actions with other actors.
Worker competencies analysis Thompson, Hilliard, and Ngo
Page 46
The custom freeform routes strategy requires many knowledge and rule-based competencies from Drivers. They must not only skillfully operate their vehicles to avoid obstacles, but also engage in an additional problem-solving activities to determine where to drive and how much salt to apply. It is clear why this strategy is not currently employed by the MWMP since most plough drivers are contractors who cannot be expected to reason analytically about snow-salt mixtures and system functional purposes. If this strategy is to succeed, the driver will require some form of support in rule and knowledge based behavior. A navigation aid in the form of a co-driver or computer-based system could reduce workload at both levels. Training could help in associating states with tasks and providing heuristics for knowledge-based reasoning.
Conclusion Thompson, Hilliard, and Ngo
Page 47
8. CONCLUSION
The preceding six sections have outlined our approach to a CWA of the MWMP. We conclude this document with a discussion of difficulties encountered and possible applications.
8.1 Challenges to Incorporating the Formative Approach
CWA is classified as a formative approach to work analysis, as compared to normative or descriptive methods (Vicente, 1999). We met with varying levels of difficulty in maintaining the principles of formative approaches during this analysis, which we will describe in further detail here. The research team's access to workers in the domain was extremely limited. Interviews with Peter Noehammer, P.Eng, provided some SME insight into the managerial perspective on the work system. However the expertise of yard supervisors, patrollers, and equipment operators was not solicited and no validation of the work domain analysis was performed to ensure that it accurately and completely reflected the reasoning space of workers in the system. Likewise no direct observation of workers’ control tasks was undertaken. Typically, observations of workarounds and of decision shunts and leaps by experts help expose the structure of control tasks. Data sources and controls that workers employ to interact with the work domain were also not observed. The largest source of information used in the generation of this analysis is the written documentation furnished by the MWMP administration. This documentation is generally written from a normative point of view, with instructions concerning physical work domain constraints, such as the optimal 23% concentration to achieve the lowest salt brine mix freezing point, and prescriptive procedures for workers to follow, such as pre-planned driving routes. This documentation prescribed criteria for selecting strategies for some activities, such as formulating procedures for accomplishing salting or ploughing tasks. Other activities such as observation of system variables were also heavily prescribed through the requirements for various forms to be filled out by system actors. Activities relating to high-level decision making tasks were more vaguely encouraged through rule based statements such as ‘if a storm is incoming, perform x, y, or z’ The documentation also contained detailed specifications of organizational structures and communication protocols, which we assumed reflected current practice. For the purposes of analysis, some of the detail of this descriptive information was aggregated in the process of adapting it to a formative representation. It has been suggested that the availability of information from managers and designers in the form of interviews and documentation is the most important type of information for the first and second phases of CWA, which is where the scope of this report is widest
Conclusion Thompson, Hilliard, and Ngo
Page 48
(Vicente, 1999). Lack of knowledge elicitation has most definitely decreased the scope of detail possible for later stages of the analysis.
8.2 Future Directions
Several possible applications of this CWA have been discussed throughout this analysis. Possible contributions to improving the functioning of the MWMP include:
1. Informing planning and decision-making activities through recognizing work domain constraints and analysis of tradeoffs between choices of means-ends as discussed in Section 5.1
2. Designing new communication networks and mediums as discussed in Section 6.2.1
3. Redrawing organizational boundaries and defining new organizational structures in accordance with work domain and task constraints as discussed in Section 6.2.2
4. Enabling alternate strategies of operation through improved worker training or design of decision support tools as discussed in Section 7.2.
We found the modeling experience very educational. To our knowledge, a Cognitive Work Analysis of such a large, distributed system with a combination of naturally occurring phenomena, unplanned intentional and physical constraints, and engineered system components has not been previously performed. There are many areas of this analysis that could be expanded in more detail and revised for a more rigorous, consistent discussion. A further investigation with one of the identified improvements in mind may lead to a more focused results-based analysis.
References Thompson, Hilliard, and Ngo
Page 49
9. REFERENCES
Salt management plan summary(2004). City of Toronto Works and Emergency Services:
Transportation Services Division.
Canadian Broadcasting Corporation. (1999). Toronto calls in troops to fight massive
Capabilities of individual vehicles and pedestrians
Pedestrians
Weather
Workers
Windrow Plough (driveway opener)
Ploughing Trucks
Equipment
Ploughing Equipment Capabilities of
individual trucks and machinery
Anti-Icing Equipment
Snow Melting Machinery
Snow Transport Trucks
Heavy Equipment
Snow Loading Machinery (Blowers)
Tow Trucks
Sidewalk Ploughing Machinery
De-Icers/Pre-wetting Trucks
Anti-Icing TrucksDe-Icers/Pre-
wetting Equipment
Towing Equipment
Appendix A - 2 Part-Whole Decomposition (Physical Function Level)
App
endi
x A
– W
ork
Dom
ain
Ana
lysi
s F
igur
es
Tho
mps
on, H
illia
rd, a
nd N
go
Pag
e 53
Mas
s st
orag
e(r
ock
salt)
Mas
s tr
ansp
ort
(roc
k sa
lt)
Mas
s tr
ansp
ort
(brin
e)M
ass
stor
age
(brin
e)
Mas
s tr
ansf
orm
atio
n (d
isso
lvin
g)
Mas
s tr
ansp
ort
(de-
icin
g)
Mas
s tr
ansp
ort
(ant
i-ici
ng)
Mas
s so
urce
(sol
id w
ater
)M
ass
tran
spor
t(w
ind)
Mas
s tr
ansf
orm
atio
n (f
reez
ing)
Mas
s so
urce
(li
quid
wat
er)
Mas
s st
orag
e (r
oadw
ay w
ater
&
sal
t)
Mas
s tr
ansp
ort
(plo
win
g)
Mas
s tr
ansf
orm
atio
n (m
eltin
g)
Mas
s st
orag
e (r
oads
ide)
Mas
s tr
ansp
ort
(rem
oval
)
Mas
s si
nk
(sno
w d
ump
grou
ndw
ater
)
Mas
s so
urce
(r
ock
salt)
Mas
s so
urce
(li
quid
wat
er)
(pre
-wet
ting)
Mas
s tr
ansp
ort
(flo
win
g)M
ass
sink
(ci
ty
sew
er)
Mas
s si
nk
(roa
dsid
e gr
ound
wat
er)
Mas
s tr
ansf
orm
atio
n (d
isso
lvin
g)
Mas
s st
orag
e (s
now
dum
p)
Appendix
A -
3 In
tegra
ted S
alt
and W
ate
r C
ausa
l Ab
stra
ctio
n H
iera
rchy
Repre
senta
tion (
Abst
ract
Funct
ion L
eve
l)
App
endi
x A
– W
ork
Dom
ain
Ana
lysi
s F
igur
es
Tho
mps
on, H
illia
rd, a
nd N
go
Pag
e 54
Roc
k S
alt
Inve
ntor
y
Sal
t T
rans
port
atio
n (r
ock
salt)
Sal
t Tra
nspo
rtB
rine
Inve
ntor
y
Dis
solv
ing
De-
icin
g
Ant
i-Ici
ng
Pre
cipi
tatio
n(s
olid
)D
riftin
g
Fre
ezin
g
Pre
cipi
tatio
n (li
quid
)S
alt a
nd S
now
A
ccum
ulat
ion
Plo
win
g
Mel
ting
Sno
w S
tora
geS
now
Rem
oval
Dra
inin
g (s
now
dum
p gr
ound
wat
er)
Roc
k S
alt
Del
iver
y
Mun
icip
al
Wat
er S
ourc
e D
eliv
ery
(pre
-wet
ting)
Dra
inin
g (r
oadw
ay)
Dra
inin
g (c
ity s
ewer
)
Dra
inin
g (r
oads
ide
grou
ndw
ater
)
Dis
solv
ing
Sno
w S
tora
ge
Appendix
A -
4 In
tegra
ted S
alt
and W
ate
r C
ausa
l Ab
stra
ctio
n H
iera
rchy
Repre
senta
tion (
Gen
era
lized F
un
ctio
n L
eve
l)
Appendix A – Work Domain Analysis Figures Thompson, Hilliard, and Ngo
Page 55
Abstraction Hierarchy Item Variable Have it?
Can Get It?
Calculate It?
Maintain Safe and Passable RoadsMinimize Environmental ImpactRemain within a justifiable budgetAdhere to laws and agreementsMinimize impact of weather on transportConservation, balance and flow of saltBrine Production Current rate of brine production at facilities and on road xSalt Transportation Current rate of salt being transported from A to B XSalt Inventory Amount of Salt in Domes at Camps / Yards XSalt Sink Current rate of salt flowing in brine into ground / drainsSalt application Current rate of salt being appliedRock Salt Location of all forms of salt in the city (parts of other objects) xSalt Silo Capacity of salt storage XRoadway Surface temp., snow accumulation, ice acc. Salt acc., Car acc. x
Anti-icer TrucksNonfunctional/functional/ready/activated/deployedAmt. Of Salt On Board / Rate of salt dispersal X
De-icer Trucks " (trucks) XPloughing Trucks " (trucks) XWindrow Plough (Driveway Opener) " (trucks) and ? XSidewalk Ploughing Equipment " (trucks), Rate of sidewalk ploughing XSnow Loading Equipment (snowblower) " (trucks), Rate of snow loading XSnow Melting Equipment " (trucks), Rate of snow melting XSnow Transport Equipment " (trucks), Rate of snow transporting XBrine Production Facility In use / not in use / functional / nonfunctional XBrine Inventory of Brine @ Locations XBalance and flow of water forms -F = ma as applied to traffic Relative risk of skidding and collisionsCreation of Entropy -Physical laws governing salt-water mixtures -Draining Rate of water flow @ LocationsSnow Ploughing (shifting on roads) Rate of snow ploughing being performed XSnow Removal (transport from roads) Rate of snow removal being performed XSnow Accumulation Amount of snow accumulated @ Locations XDrainage System Current state of blockage of drains XEnvironmental Reservoirs Current salt concentration in water in resevoirs XSnow Dumps Functional/Non-functional, Percentage full XSnow Accumulation (reflected in other functions), rate of precipitation, temperature… xPedestrian Flow Number of pedestrians, rate of pedestrian movement @ Locations XVehicle Flow Number of vehicled, rate of vehicle flow @ Locations XPedestrians -Vehicles -Sidewalks Snow accumulation on sidewalks, XBus Stops Snow accumulation on Bus Stops XPXO Snow accumulation on PXO XBridges " (roadway) XHills " (roadway) XShoulders and Medians Snow / Salt accumulation xAir Flow Air movement @ Locations, associated wind chill XWind Wind velocity @ Locations XPrecipitation Rate and type and duration of precipitation @ Locations XDrifting Rate of snow redistribution, accumulation/removal @ LocationsTemperature Temperature of air / ground @ Locations XSnow/Ice Melting Rate of melting @ Locations xWater Freezing Rate of freezing @ Locations xWater Phase / Form and accumulation and flow @ Locations XIce " (Water) XBalance resource needs and capabilities (reflected in other functions)Deployment of Personnel Current state of employees on work XUnion, city-employed workers Capabilities of workers, cost XContract workers " (Workers) XBalance of risk and authority Level of escalation of decision making power, rate of expenditure XEconomic Balance of City Civilian business employee attendance, money flow around city X
Appendix A - 5 Information Availability Analysis
Appendix B – Control Task Analysis Figures Thompson, Hilliard, and Ngo
Page 56
11. APPENDIX B – CONTROL TASK ANALYSIS FIGURES
ALERT
OBSERVE
Information and data
SET OF
OBSERV
IDENTIFY
Present state of system
PROCE
DURE
SYSTEM
STATE
ULTIM-
GOAL
GOAL
STATE
TASK
AMBI-
GUITY
INTERPRET
Consequences for current
task, safety, efficiency etc...
DEFINE TASK
Select appropriate change of
system condition
FORMULATE PROCEDURE
Plan sequence of actions
EXECUTE
Coordinate manipulationsACTIVATION
EVALUATE
Performance criteria
Redeploy anti-icers
and personnel
Weather
Report
Desired roadway
conditions
Invoke
preplanned
procedures to
ready the anti-
icers and
personnel
Knowledge of
which beats to
call in
Ready anti-icers/personnel
Deploy readied anti-icing trucks
Activity report from
neighbouring towns
- Pavement
temperature > -9C?
RWIS data
- Weather forecast
& timing
- etc.
Time to
Deploy (1 hr.
until snow)
“is it time yet”
If too much snow
accumulated or poor
conditions, go to
Salting or Ploughing.
If no snow, go to de-
readying
Signal – Ready to anti-ice
Field feedback
- Roadway and shoulder
conditions
- Weather conditions
- Personnel and
equipment capabilities
- Traffic flow &
congestion?
Select equipment and
personnel as means to
satisfy goal state
Readying
Deploying
Evaluating
Three loops through the
decision ladder:
Appendix B - 1 Anti-Icing Decision Ladder
Appendix B – Control Task Analysis Figures Thompson, Hilliard, and Ngo
Page 57
Teams readying for salting
Field feedback – how did it go?
Deploy salters
Appendix B - 2 De-Icing Decision Ladder
Appendix B – Control Task Analysis Figures Thompson, Hilliard, and Ngo
Page 58
Readying for ploughing
ALERT
OBSERVE
Information and data
SET OF
OBSERV
IDENTIFY
Present state of system
PROCE
DURE
SYSTEM
STATE
ULTIM-
GOAL
GOAL
STATE
TASK
AMBI-
GUITY
INTERPRET
Consequences for current
task, safety, efficiency etc...
DEFINE TASK
Select appropriate change of
system condition
FORMULATE PROCEDURE
Plan sequence of actions
EXECUTE
Coordinate manipulations
ACTIVATION
Detection of need for action
EVALUATE
Performance criteria
Redeploy
ploughs
Inspectors’
observations
- Inspectors observe
the state of roads
- Drivers report on
effectiveness of
plowing
Desired roadway
conditions
Go to “De-
Icing”, “Winging
back” OR
“Snow” removal
if required
- Is snow still
accumulating
(Ploughing needed)?
- How much snow is
on the shoulder
(storage capacity)?
Summarize the work
domain for this situation
Field feedback – how did it go?
Deploy ploughsFrom de-icing/
salting decision
tree
“Activity report from
neighbouring towns”
Readying
Deploying
Evaluating
Three loops through the
decision ladder:
Invoke
snowplough
readying
procedure
Ready ploughs/personnel
Deploy readied ploughing trucks
Custom
Route
Appendix B - 3 Snowploughing Decision Ladder
Appendix B – Control Task Analysis Figures Thompson, Hilliard, and Ngo
Page 59
ULTIM-
GOAL
AMBI-
GUITY
INTERPRET
Consequences for current
task, safety, efficiency etc...
EVALUATE
Performance criteria
“This car is completely
blocking a large main road”
See parked cars
on snowplow
route
Snow and amount of
car accumulation
Vehicle Flow
obstructions?
Specific
Observations
Do parked cars have to be
removed from the beats?
To tow cars & which
streets?
Remove
Cars
How to tow cars?
How many cars to tow?
How many tow trucks/
personnel are needed?
Optimum time frame?
Plan to tow cars
from A to B
Amount of road obstruction,
predicted snowfall, time of day
Is it cheaper to spend
more time plowing or to
tow the cars? How good a
job needs to be done?
Stay within budget? Complete
plowing operation within specified
time? How much are parked cars
going to increase obstacles to
traffic & pedestrian flow?
Tow trucks readying
ALERT
OBSERVE
Information and data
SET OF
OBSERV
IDENTIFY
Present state of system
PROCE
DURE
SYSTEM
STATE
GOAL
STATE
TASK
DEFINE TASK
Select appropriate change of
system condition
EXECUTE
Coordinate manipulations
ACTIVATION
Detection of need for action
The tow trucks have arrived
FORMULATE PROCEDURE
Plan sequence of actions
Ready/Call in tow trucks
Actually tow cars
Readying
Deploying
Two loops through the
decision ladder:
Appendix B - 4 Friendly Towing Decision Ladder
App
endi
x C
– S
trat
egie
s A
naly
sis
Tab
les
Tho
mps
on, H
illia
rd, a
nd N
go
Pag
e 60
12.
AP
PE
ND
IX C
– S
TR
AT
EG
IES
AN
ALY
SIS
TA
BLE
S
Str
ateg
y P
erfo
rman
ce F
acto
rs
Fun
ctio
nal P
urpo
se T
rade
offs
Pla
nner
W
orkl
oad
Ope
rato
r W
orkl
oad
In-h
ouse
tim
e F
ield
tim
e E
nviro
nmen
t S
afet
y B
udge
t C
ity
Tra
nspo
rt
Lega
l
Sp
rea
d r
ock
sa
lt d
ire
ctly
on
roa
d +
S
imp
le,
we
ll e
sta
blis
hed
lo
ad
ing
+
Sim
ple
e
qui
pm
ent
to
op
era
te
+
Onl
y o
ne e
asi
ly
sto
red
che
mic
al
to lo
ad
- N
atu
ral
dis
solv
ing
rate
is
slo
w,
hea
t, m
ois
ture
, ve
hicl
e
flow
re
qui
red
- S
alt
bo
unce
s o
nto
sh
ou
lde
r
- R
ock
sa
lt ta
kes
time
to w
ork
, ra
w
rock
sa
lt p
reve
nts
tra
ctio
n
+
Sa
lt is
che
ap
, e
qui
pm
ent
is
sim
ple
to
op
era
te/m
ain
tain
-
- E
nvir
on
me
nt
da
ma
ge
Sp
rea
d p
re-w
ette
d r
ock
sa
lt w
ith w
ate
r +
N
ot s
o d
iffe
rent
fr
om
sa
lt a
pp
lica
tion
=
Ad
diti
ona
l e
qui
pm
ent
to
op
era
te
- T
wo
se
pa
rate
m
ate
ria
ls to
loa
d
=
Acc
ele
rate
s na
tura
l d
isso
lvin
g ra
te
=
Gre
atly
re
duc
ed
sa
lt b
oun
cin
g
=
Sa
lt ca
n b
e
dis
trib
ute
d
qui
ckly
, a
ctiv
ate
s
=
Re
qui
res
som
e
ad
diti
ona
l e
qui
pm
ent
, d
istr
ibut
es
salt
qui
ckly
=
Less
tim
e
req
uire
d
=
Sp
rea
d p
re-w
ette
d r
ock
sa
lt w
ith b
rine
-
Ne
ed
to p
lan
ava
ilab
ility
of
bri
ne a
s w
ell
as
salt
- E
ven
mo
re
eq
uip
me
nt
req
uire
d to
o
pe
rate
- T
wo
se
pa
rate
m
ate
ria
ls to
loa
d
/ pre
pa
re
+
So
me
pre
-d
isso
lvin
g a
lre
ad
y a
chie
ved
=
=
- R
eq
uire
s b
rine
ge
nera
tion
faci
litie
s
=
=
App
endi
x C
– S
trat
egie
s A
naly
sis
Tab
les
Tho
mps
on, H
illia
rd, a
nd N
go
Pag
e 61
Str
ateg
y P
erfo
rman
ce F
acto
rs
Fun
ctio
nal P
urpo
se T
rade
offs
Pla
nner
W
orkl
oad
Ope
rato
r W
orkl
oad
In-h
ouse
tim
e F
ield
tim
e E
nviro
nmen
t S
afet
y B
udge
t C
ity
Tra
nspo
rt
Lega
l
Ap
ply
bri
ne d
ire
ctly
on
roa
d -
Bri
ne p
rod
uctio
n fa
cilit
ies
to b
e
ma
nage
d,
timin
g a
nd te
mp
era
ture
co
nstr
ain
ts
=
=
One
ma
teri
al t
o
loa
d +
pre
pa
re
- C
an
be
ap
plie
d
be
fore
sno
wfa
ll,
inst
ant
act
iva
tion
+
Lim
ited
to n
o s
alt
esc
ap
e fr
om
p
ave
me
nt,
less
sa
lt u
sed
+
Ap
plie
d b
efo
re
sno
w,
pre
ven
ts
ice
-ro
ad
bo
nd
=
Ca
n re
duc
e
plo
win
g e
xpe
nse
s b
y b
rea
kin
g ic
e-
roa
d b
ond
, e
xtra
b
rine
ge
nera
tion
cost
s, le
ss s
alt
use
d
+
Do
es
not
hind
er
grip
o
n b
are
ro
ad
s,
wo
rks
with
out
tr
affi
c m
ixin
g
+
Low
e
nvir
on
me
nta
l im
pa
ct,
aid
s p
low
ing
rate
Appendix
C -
1 S
alt
Dis
solv
ing S
trate
gy
Analy
sis
usi
ng t
he F
irst
Appro
ach
App
endi
x C
– S
trat
egie
s A
naly
sis
Tab
les
Tho
mps
on, H
illia
rd, a
nd N
go
Pag
e 62
Str
ateg
y C
anno
t Be
Use
d If…
P
erfo
rman
ce F
acto
rs
Fun
ctio
nal P
urpo
se T
rade
offs
Tim
e S
pent
C
ompl
exity
O
f Cog
nitiv
e P
roce
sses
Dep
ende
ncy
On
Kno
wle
dge
Of
Wor
k D
omai
n
Like
lihoo
d O
f In
trod
ucin
g E
rror
s
Num
ber
Of
Act
ivat
ion
Sou
rces
Env
ironm
ent
Saf
ety
Bud
get
City
T
rans
port
Lega
l
Se
lf-a
ctiv
ate
d
…a
cto
r is
d
istr
act
ed
4
N
/A
4
4
2
N/A
N
/A
4
4
N/A
Ext
ern
al a
ctiv
atio
n (f
ield
se
nso
r -
i.e.p
atr
olle
r)
...e
xte
rna
l a
ctiv
atio
n so
urce
is
no
t ava
ilab
le
2
N/A
3
3
3
N
/A
N/A
1
1
N
/A
Ext
ern
al a
ctiv
atio
n (f
ield
se
nso
r -
i.e.c
all
cent
re)
...e
xte
rna
l a
ctiv
atio
n so
urce
is
no
t ava
ilab
le
3
N/A
2
1
4
N
/A
N/A
3
3
N
/A
Appendix
C -
2 S
trate
gy
Analy
sis
usi
ng t
he S
eco
nd
Appro
ach
for
‘Act
ivatio
n’ A
ctiv
ity in
De-I
cing T
ask
App
endi
x C
– S
trat
egie
s A
naly
sis
Tab
les
Tho
mps
on, H
illia
rd, a
nd N
go
Pag
e 63
Str
ateg
y C
anno
t Be
Use
d If…
P
erfo
rman
ce F
acto
rs
Fun
ctio
nal P
urpo
se T
rade
offs
Tim
e S
pent
C
ompl
exity
O
f C
ogni
tive
Pro
cess
es C
ompl
exity
Of
Out
put S
tate
Of
Kno
wle
dge
Like
lihoo
d O
f In
trod
ucin
g E
rror
s
Num
ber
Of
Obs
erva
tions
E
nviro
nmen
t S
afet
y B
udge
t C
ity
Tra
nspo
rtLe
gal
Ob
serv
e a
ll st
ate
in
form
atio
n (e
xha
ustiv
e)
…no
t all
info
rma
tion
is
ava
ilab
le
1
4
1
5
1
N/A
N
/A
1
N/A
4
Ob
serv
e th
e
info
rma
tion
as
it co
me
s in
and
a
ssu
me
the
re
st
(se
ria
l and
se
lf-te
rmin
atin
g se
arc
h)
N/A
3
3
3
2
3
N
/A
N/A
3
N
/A
3
Ob
serv
e w
ith p
ast
e
xpe
rie
nce
or
pro
toco
l, sa
mp
le
sele
cte
d in
fo a
nd
ass
um
e t
he r
est
(s
truc
ture
d s
ea
rch)
…no
pa
st
exp
eri
enc
e o
r p
roto
col i
s a
vaila
ble
.
4
2
3
3
4
N/A
N
/A
4
N/A
1
Appendix
C -
3 S
trate
gy
Analy
sis
usi
ng t
he S
eco
nd
Appro
ach
for
‘Obse
rve
’ Act
ivity
in D
e-I
cing T
ask
App
endi
x C
– S
trat
egie
s A
naly
sis
Tab
les
Tho
mps
on, H
illia
rd, a
nd N
go
Pag
e 64
Str
ateg
y C
anno
t be
used
if…
P
erfo
rman
ce F
acto
rs
Fun
ctio
nal P
urpo
se T
rade
offs
Tim
e S
pent
S
hort
-T
erm
M
emor
y Lo
ad
Dep
ende
ncy
On
Kno
wle
dge
Of
Rel
atio
nshi
ps
Bet
wee
n V
aria
bles
Com
plex
ity O
f O
utpu
t Sta
te O
f K
now
ledg
e
Long
-Ter
m
Mem
ory
Load
Like
lihoo
d O
f In
trod
ucin
g E
rror
s
Env
ironm
ent
Saf
ety
Bud
get
City
T
rans
port
Le
gal
Ge
nera
lize
fro
m
limite
d o
bse
rva
tions
us
ing
sto
red
me
nta
l m
od
el (
use
of
heur
istic
s)
N/A
3
3
4
4
3
2
N
/A
N/A
3
3
1
Use
re
late
d
ob
serv
atio
ns to
d
ed
uce
un
kno
wn
sy
ste
m s
tate
va
ria
ble
(e
.g.
sno
wfa
ll ra
te
and
pa
vem
ent
te
mp
era
ture
=
est
ima
te o
f sno
w
acc
um
ula
tion)
…re
late
d
ob
serv
atio
ns a
re
not a
vaila
ble
.
1
2
2
2
1
4
N/A
N
/A
1
1
4
Appendix
C -
4 S
trate
gy
Analy
sis
usi
ng t
he S
eco
nd
Appro
ach
for
‘Identif
y S
yste
m S
tate
’ Act
ivity
in D
e-I
cing T
ask
App
endi
x C
– S
trat
egie
s A
naly
sis
Tab
les
Tho
mps
on, H
illia
rd, a
nd N
go
Pag
e 65
Str
ateg
y C
anno
t Be
Use
d If…
P
erfo
rman
ce F
acto
rs
Fun
ctio
nal P
urpo
se T
rade
offs
T
ime
Spe
nt
Com
plex
ity
Of C
ogni
tive
Pro
cess
es
Dep
ende
ncy
On
Kno
wle
dge
Of
Req
uire
d T
ask
Com
plex
ity
Of O
utpu
t S
tate
Of
Kno
wle
dge
Env
ironm
ent
Saf
ety
Bud
get
City
T
rans
port
Le
gal
Se
lect
a p
re-
pla
nne
d s
et o
f b
ea
ts
...th
e n
um
be
r o
f b
ea
ts to
pe
rfo
rm is
gr
ea
ter
tha
n th
e
num
be
r o
f re
ad
ied
e
qui
pm
ent
and
p
ers
onn
el
5
5
5
5
1
4
3
4
4
Se
lect
cu
sto
m
sub
set o
f pre
-p
lann
ed
be
ats
…th
e b
ea
t is
not
po
ssib
le d
ue to
w
ork
do
ma
in
cha
nge
s (r
oa
d
cons
truc
tion)
4
4
3
5
2
4
4
4 to
5
4 to
5
Ge
nera
te b
ea
ts
with
pre
-pla
nne
d
pro
ced
ure
te
mp
late
s
…p
re-p
lan
ned
p
roce
dur
e
tem
pla
tes
are
no
t a
vaila
ble
2
2
2
4
3
4 to
5
3 to
5
3 to
5
3 to
5
Ge
nera
te fre
efo
rm
cust
om
ro
ute
s N
/A
1
1
1
1 to
3
2 to
5
1 to
5
1 to
5
1 to
5
1 to
5
Appendix
C -
5 S
trate
gy
Analy
sis
usi
ng t
he S
eco
nd
Appro
ach
for
Form
ula
te P
roce
dure
Act
ivity
in D
e-I
cing T
ask
App
endi
x D
– S
ocio
-Org
aniz
atio
nal A
naly
sis
Fig
ures
T
hom
pson
, Hill
iard
, and
Ngo
Pag
e 66
13.
AP
PE
ND
IX D
– S
OC
IO-O
RG
AN
IZA
TIO
NA
L A
NA
LYS
IS F
IGU
RE
S
Operators, drivers, labourers
Winter contract inspectors
Maintenance inspectors
TMC dispatch
Supervisors (roads & sidewalks)
Supervisors(contract inspection)
Supervisors(communication)
District Co-ordination Centre staff
Superintendents (Roads & Sidewalks)
Superintendents (Technical Operations)
District Managers
Road Operations Manager
District Director
General Manager
Central Co-ordination Centre staff
Director Transport Services
Weather provider
Meteorologist
Call center (416-388-SNOW)
External actors (councillors, TTC,
WES, Access Toronto, etc.)
Ope
rato
rs, d
river
s,
labo
urer
sra
dio,
(d
irect
)ra
dio
radi
ora
dio
radi
o,
dire
ct?
Win
ter
cont
ract
in
spec
tors
radi
o,
cellu
lar
radi
o,
tele
phon
epa
per
form
, di
rect
?M
aint
enan
ce in
spec
tors
radi
opa
per
form
, di
rect
?T
MC
dis
patc
hra
dio
radi
ora
dio
radi
o?ra
dio?
radi
o?
Sup
ervi
sors
(r
oads
& s
idew
alks
)di
rect
?,
radi
o?ce
llula
r,
pape
r fo
rmce
llula
rce
llula
rdi
rect
?,
emai
l?te
leph
one
Sup
ervi
sors
(con
trac
t ins
pect
ion)
dire
ct?,
ra
dio?
dire
ct?,
ra
dio?
cellu
lar
cellu
lar
cellu
lar
dire
ct?,
em
ail?
tele
phon
e
Sup
ervi
sors
(com
mun
icat
ion)
ce
llula
r,
snow
ad
viso
ry
cellu
lar,
sn
ow
advi
sory
cellu
lar,
sn
ow
advi
sory
dire
ct, s
now
ad
viso
rysn
ow
advi
sory
dire
ct?,
em
ail?
, sno
w
advi
sory
snow
ad
viso
rysn
ow
advi
sory
snow
ad
viso
rysn
ow
advi
sory
snow
ad
viso
rysn
ow
advi
sory
tele
phon
ete
leph
one?
snow
ad
viso
ry,
tele
phon
e
Dis
tric
t Co-
ordi
natio
n C
entr
e st
aff
dire
ctdi
rect
, pho
ne
to o
ther
di
stric
ts?
emai
lem
ail
emai
lte
leph
one
emai
l
Sup
erin
tend
ents
(R
oads
& S
idew
alks
)di
rect
?,
emai
l?co
nfer
ence
ca
ll, c
ellu
lar,
B
lack
berr
y
conf
eren
ce
call,
cel
lula
r,
Bla
ckbe
rry
conf
eren
ce
call,
cel
lula
r,
Bla
ckbe
rry
tele
phon
e
Sup
erin
tend
ents
(T
echn
ical
Ope
ratio
ns)
dire
ct?,
em
ail?
dire
ct?,
em
ail?
conf
eren
ce
call,
cel
lula
r,
Bla
ckbe
rry
conf
eren
ce
call,
cel
lula
r,
Bla
ckbe
rry
conf
eren
ce
call,
cel
lula
r,
Bla
ckbe
rry
tele
phon
ete
leph
one?
Dis
tric
t Man
ager
sco
nfer
ence
ca
ll, c
ellu
lar,
B
lack
berr
y
conf
eren
ce
call,
cel
lula
r,
Bla
ckbe
rry
conf
eren
ce
call,
cel
lula
r,
Bla
ckbe
rry
conf
eren
ce
call
tele
phon
e
Roa
d O
pera
tions
M
anag
erte
leph
one
Dis
tric
t Dire
ctor
tele
phon
e?,
emai
l?te
leph
one
Gen
eral
Man
ager
tele
phon
e
Cen
tral
Co-
ordi
natio
n C
entr
e st
aff
tele
phon
e
Dire
ctor
Tra
nspo
rt
Ser
vice
sW
eath
er p
rovi
der
prin
tout
emai
l, w
ebsi
teem
ail,
web
site
emai
l, w
ebsi
teem
ail,
web
site
Met
eoro
logi
st
Cal
l cen
ter
(416
-388
-SN
OW
)E
xter
nal a
ctor
s (c
ounc
illor
s, T
TC
, WE
S,
Acc
ess
Tor
onto
, etc
.)
tele
phon
e
INFORMATION SOURCE
INF
OM
RA
TIO
N R
EC
EIV
ER
Appendix
D -
1
MW
MP
Com
munic
atio
n M
atr
ix
Appendix D – Socio-Organizational Analysis Figures Thompson, Hilliard, and Ngo
Page 67
Abstraction Hierarchy, Subsystem level, Divided into Object Worlds
Fun
ctio
nal P
urpo
seA
bstr
act F
unct
ion
Gen
eral
ized
Fun
ct.
Phy
sica
l Fun
ctio
nP
hys.
For
mStorage &
ConsumablesRoad Phenomena
Weather Phenomena
Employees Equipment Traffic
Airborne Natural Environment
Highway, Pedestrian right-of-way, Drainage System, Aqueous Deposits on Highway