Thermal endoscopic systems not only could provideuseful information concerning abnormalities inspaces within the body, but also could have other ap-
plications, such as in emergency rescue situations. Inthis paper, we examine the possibility of developingendoscopic systems to capture thermal images usinghollow waveguide fiber bundles adjusted to the8–10 μm spectral range and investigate the applic-ability of such systems. Recent advances in infraredlight detectors, the development of new materials forIR fibers, and improvements in the IR electronic
endoscopic system should lead to the development ofendoscopic systems for thermal images with the re-quired temperature resolution in the near future.
Coherent fiber optic arrays composed of oxide glassfibers have been fabricated for many years, usingmandrel wrapping and leached bundle technologies[1]. These coherent fiber bundles have been used totransmit high-resolution images for a variety of ap-plications, including endoscopic medical imaging oftissue and industrial borescopes for remote inspec-tion systems. There has, however, been very littlework done to extend the wavelength range of fiberimage bundles to wavelengths greater than 2 μm.This is due, in part, to the lack of IR transmittingfibers with optical and mechanical properties analo-gous to the oxide glass fibers currently employed inthe visible fiber bundles [2]. Nevertheless, coherentfiber bundles for the IR range could have significantthermal imaging applications, especially for temper-atures in which human body radiation is mostintense. To date, most IR fiber arrays have been fab-ricated from chalcogenide glass fibers. Nishii et al.[3,4] and Hilton [5] have made coherent IR fiber bun-dles consisting of several thousand As2S3 fibers.These chalcogenide glass fibers are transmissivefrom about 2 to 5 μm. For efficient IR imaging withclinical value, we would like to have fibers that trans-mit up to at least 14 μm because the thermal energyof tissue near room temperature is at a maximumnear 10 μm. Therefore, the use of IR fibers with abroader IR wavelength range means more signaland greater temperature differentiation within theimage. Additionally, the As2S3 fibers are quite fragileand easily damaged during use. Finally, the chalco-genide glass fibers used in the bundles containabsorption bands due to impurities that limit theIR transmission. More recently, Katzir et al. [6–8] ex-truded polycrystalline silver halide fibers into coher-ent bundles. Their silver halide bundles, however,are of poor optical quality, as they are made by anextrusion process that tends to deform the soft halidefibers and distort the resultant image [9].
We report the use of hollow glass waveguide(HGW) technology that we have used successfullyto make single HGWs [10] with Ag/AgI thin film coat-ings to form coherent bundles for IR imaging [11].This HGW technology is well-established for thesingle hollow waveguides. In fact, the Ag/AgI HGWtechnology has been used for fabricating commer-cially available waveguides for sensing and powerdelivery applications. It is this simple and straight-forward methodology that is used for coating the hol-low collimated hole structure. The hollow oxide glassbundles that we use in this research are more robust,as they are made from the same glass customarilyused to make the solid-core oxide glass fiber bundles.Another advantage of fabricating an image bundleusing hollow-core waveguide bundles compared tosolid-core fibers is that we may employ the same fi-ber bundling techniques used tomake oxide glass im-age guides. These techniques, which involve either
mandrel wrapping or leach bundles/fiber redrawing,are very well-established. In addition, we do not needto coat the tubing prior to forming the bundle, and inthis way, we ensure that the coatings are not da-maged during any type of bundling process. Instead,once the bundle has been fabricated, we coat all tubessimultaneously with metal and dielectric coatings.The hollow oxide glass structure that we use is sim-ple in design, low in cost, and quite rugged.
2. Fabrication of Rigid, Coherent HGW IR Bundles
A. Fabrication Process
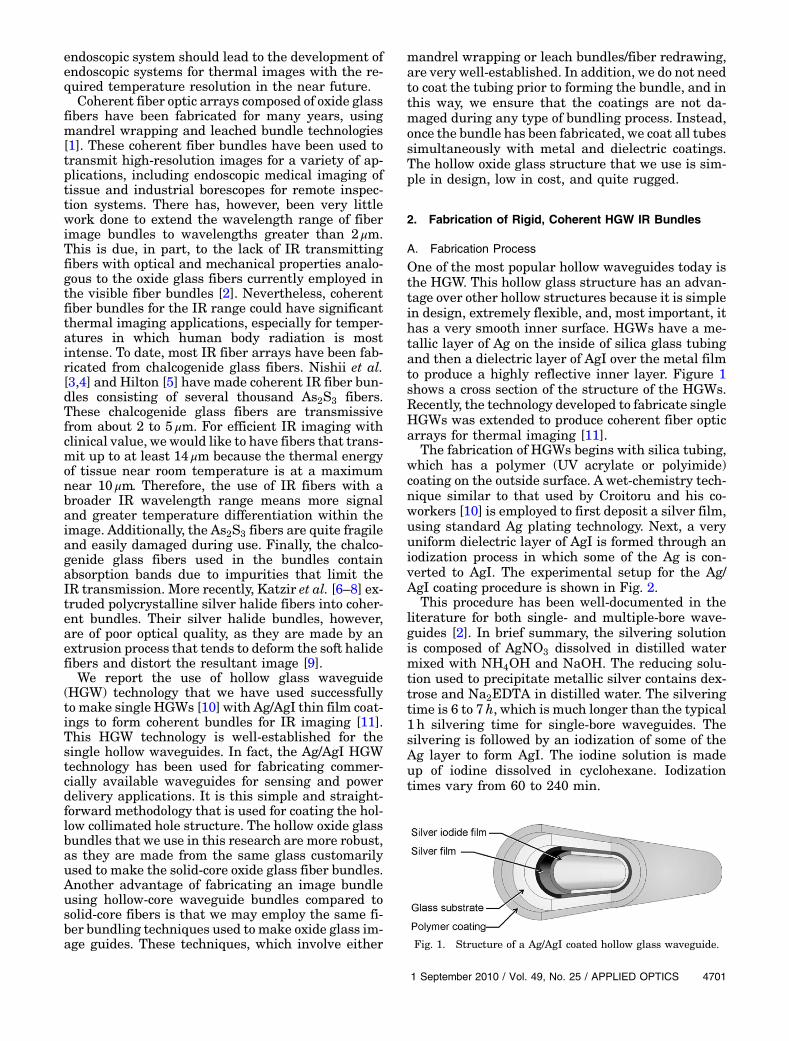
One of the most popular hollow waveguides today isthe HGW. This hollow glass structure has an advan-tage over other hollow structures because it is simplein design, extremely flexible, and, most important, ithas a very smooth inner surface. HGWs have a me-tallic layer of Ag on the inside of silica glass tubingand then a dielectric layer of AgI over the metal filmto produce a highly reflective inner layer. Figure 1shows a cross section of the structure of the HGWs.Recently, the technology developed to fabricate singleHGWs was extended to produce coherent fiber opticarrays for thermal imaging [11].
The fabrication of HGWs begins with silica tubing,which has a polymer (UV acrylate or polyimide)coating on the outside surface. A wet-chemistry tech-nique similar to that used by Croitoru and his co-workers [10] is employed to first deposit a silver film,using standard Ag plating technology. Next, a veryuniform dielectric layer of AgI is formed through aniodization process in which some of the Ag is con-verted to AgI. The experimental setup for the Ag/AgI coating procedure is shown in Fig. 2.
This procedure has been well-documented in theliterature for both single- and multiple-bore wave-guides [2]. In brief summary, the silvering solutionis composed of AgNO3 dissolved in distilled watermixed with NH4OH and NaOH. The reducing solu-tion used to precipitate metallic silver contains dex-trose and Na2EDTA in distilled water. The silveringtime is 6 to 7h, which is much longer than the typical1 h silvering time for single-bore waveguides. Thesilvering is followed by an iodization of some of theAg layer to form AgI. The iodine solution is madeup of iodine dissolved in cyclohexane. Iodizationtimes vary from 60 to 240 min.
Fig. 1. Structure of a Ag/AgI coated hollow glass waveguide.
The coherent bundles were fabricated by CollimatedHoles from soda-lime/lead glass capillaries. We havecoated bundles with 50, 75, and 100 μm bore sizesand lengths up to 30 cm. The structure of the bundleis shown in Fig. 3 along with a photomicrograph of afew of the coated tubes. The 50, 75, and 100 μm bore-collimated hole bundles have outer diameters of 3, 3,and 4mm and are composed of 900, 675, and 675capillary tubes, respectively. The active area of thebundles varies from 42% for the 75 and 100 μm boreHGWs and 35% for the 50 μm bore guides.
C. Spectral Response of the HWG Coherent Bundles
The spectra for an 8 cm long, 100 μm bore collimatedbundle is shown in Fig. 4 for AgI coating times at in-tervals of 60, 120, 180, and 240 min. The attenuationpeaks in the spectra result from interference effectsdue to the thin AgI films. The longer the iodizationcoating time, the thicker the AgI layer and thefurther the shift of attenuation peaks to longerwavelengths. From Fig. 4, we see that the first ab-
sorption peak shifts from about 2.5 to 5 μm. Fromthe data in Fig. 4, it is possible to extract informationon the kinetics of AgI film deposition, which is usefulin tailoring the optical response of the guides. For theoptimal guide, the Ag layer is about 1 μm and the AgIthickness is about 0:8 μm.
In Fig. 5, we plot the position of the first absorptionpeak shown in Fig. 4 with respect to the iodizationtime. The data in Fig. 5 show that the AgI film thick-ness increases linearly with increasing iodizationtime.
3. Optical Properties of the Coherent HGW IR Bundles
We carried out a series of measurements in order tocharacterize the optical properties of the fiber bun-dles. These included the attenuation, resolution,and temperature response. We also developed theo-retical models and simulation tools that calculate thelight propagation through the HGW bundles and canbe used to calculate the optical properties of the fiberbundles.
Fig. 2. (Color online) Wet-chemistry method for the deposition of Ag (left) and AgI (right) thin films inside silica tubing.
Fig. 3. (Color online) Cross section of coherent bundle showing hexagonal shape of drawn tubing (left) and microphotograph of onecapillary with Ag/AgI coating (right).
One important parameter of the fiber bundle is itstotal attenuation per unit length. The attenuationper unit length of the bundles was measured fortwo sets of fiber bundles; the first set (D) was opti-mized for transmitting IR radiation at 4 μm (as seenin Fig. 4), and the second (U) was optimized for the8–10 μm wavelength range. All the measured fiberbundles had a 100 μm core diameter, the same num-ber of waveguides (675), and the same fill factor
(42%). We calculated the attenuation per unit lengthusing the following equation:
A ¼ −10 ·logðPout=PinÞ
L½dB=m�; ð1Þ
where Pin and Pout are the average irradiance levelsat the input and the output facets of the bundle,respectively, and L is the bundle length. To mea-sure the ratio Pout=Pin, we used a CO2 (Sharplan,
Fig. 4. (Color online) Spectra of progressively coated 100 μm bore waveguides as measured by Fourier transform infrared. From top tobottom, the waveguides are 60, 120, 180, and 240 × min at the right side of the graph.
Fig. 5. (Color online) Correlation of position of first absorption peak with iodization time.
Yokneam, Israel) laser source configured to emit0:5 × W of laser output power. The laser beam wasfocused using a ZnSe IR lens (f ¼ 5 cm) onto the bun-dle’s face. The input power was reduced to0:42 × Wdue to the focusing lens attenuation, and, after tak-ing the fill factor into consideration, the actual inputpower to the bundle was 0:18 × W. The spot size cov-ered most of the bundle proximal surface. Table 1shows the experimental results for each measured fi-ber bundle. The average attenuation per unit lengthwas 2:35dB=cm for the first set of fiber bundles, and0:48dB=cm for the second set of fiber bundles.
These results clearly show the improvement in thefabrication process and the ability to adjust the di-electric layer thickness to the required wavelength.Matsuura et al. [12] showed that the loss for the best250 μmsingle-boreHGWat10:6 μmisabout2:0dB=m.Decreasing the bore size by a factor of 2.5 to 100 μmwould lead to an increase in the attenuation by 2.5[4] toavalueofabout32dB=mor0:32dB=cm.This the-oretical value validates our experimental result of0:48dB=cm and gives us confidence in the fabricationprocess.
B. Resolution—Theoretical Background
The resolution is normally stated as the number oflines per millimeter that can be transmitted througha bundle. The mathematical tool used for definingthe resolution is the modulation transfer function(MTF). We would like to be able to theoretically es-timate the MTFof our fiber bundles. One approach iscalculating the MTF by first obtaining the system’sresponse to an impulse, called impulse response orpoint spread function (PSF). The bundle’s MTF isthe absolute value of the optical transfer function(OTF), which is the Fourier transform of the PSF[13]. Croitoru et al. developed a comprehensive the-oretical model to describe mid-IR radiation propaga-tion through an optical cylindrical hollow waveguide[10]. Based on that model, we developed a computersimulation that can calculate the propagation of alight beam through a single hollow waveguide. In or-der to evaluate the bundle PSF, we assumed a pointlight source located at one end of the bundle. For eachwaveguide in the bundle cross section, the entranceangle and energy of light were calculated (describedin the next paragraph), and a simulation was done toobtain the energy of light at the distal end of eachwaveguide.
Given a single point source, which is located at adistanceX from the fiber bundle on the bundle center
axis, rays of light emitted from the point source willenter each fiber in the bundle, but each waveguidewill receive the light at different entrance anglesand energy levels. A waveguide located close to thecenter will receive higher energies of light with avery small divergence angle, while waveguides lo-cated far from the center will receive lower energiesof light at a larger angle (as can be seen in Fig. 6).These two factors will cause the energy distributionat the distal end of the bundle to decrease as we gofarther away from the bundle axis.
As we know, the angle at which light enters the fi-ber strongly influences the attenuation of the propa-gating light due to the dependency between theentrance angle and the number of times the light col-lides and is reflected from the fiber surface. We caneasily calculate the minimal and maximal angles(βmin and βmax in Fig. 6), but, if the distance of thepoint source X is considerably larger then the radiusof a single waveguide in the bundle, then a reason-able approximation would be to assume that allthe light entering the waveguide is at a single angleβavg, which is the entrance angle in the center of thewaveguide. The energy distribution at the distal endof the fiber bundle will also be influenced by theamount of light energy entering each waveguide(Pin). As all the waveguides are of the same radius,the difference in Pin between one waveguide to the
Table 1. Experimental Results of the Attenuation of Radiation through the Fiber Bundles Measured Using CO2
Fig. 6. (Color online) Light emitted from the source point willtravel a different distance and enter each fiber in the bundle atdifferent entrance angles.
next will be determined only by the distance from thelight source. If the source is radiating isotropically,the equation for the intensity as a function of radiusis given by
jIj ¼ P
4πr2 ; ð2Þ
where P is the net power radiated, I is the intensityat the surface of the sphere, and r is the radius of thesphere. Thus, if we denote the energy of light enter-ing the center fiber (closest to the light source) Pin,the intensity at any other waveguide along the crosssection would be
Pini ¼
�Xri
�2· Pin; ð3Þ
where X is the distance of the bundle from the lightsource, and ri is the distance of the ith waveguidefrom the light source. The simulation was onedimensional, done for one cross section of the fiberbundle, assuming that it is polar symmetrical forany cross section. The left graph in Fig. 7 shows thesimulated fiber bundle PSF for a 100 μm core and8 cm length fiber bundle. The point light source dis-tance from the bundle surface was 1mm. The OTFwas obtained by Fourier transforming the PSF, andthe bundle MTF is the absolute value of the OTF. Theright graph of Fig. 7 below shows the calculated fiberbundle MTF, and as the resolution is determined bythe width at half-maximum [14], the calculated reso-lution is 1.9 lines/mm.
C. Resolution—Experimental Results
The MTF is formally defined as the magnitude of theOTF, where the OTF is the response of an imagingsystem to a spatial pattern whose intensity varies si-nusoidally at some spatial frequency. The MTF is ameasure of the 2D spatial frequency response of thesystem (two orthogonal axes: horizontal and verti-
cal). Because our bundles are symmetric, 1D modu-lation is usually sufficient to characterize the bundleresolution. Because sinusoidal spatial patternsare generally difficult to generate in the infraredrange, we used the knife-edge method as describedby Tzannes and Mooney [15].
A sharp knife edge is illuminated with an IR laserbeam, and its image is formed on the distal end of thebundle. The image is transmitted to the proximal endof the bundle and recorded using a thermal imagingcamera (Thermovision A40; FLIR Systems, Boston,Massachusetts) operating in the 7.5–13 μm spectralrange, with a 2:5 cm focal length magnifying lensbetween the bundle and the camera. A gray-level lineprofile is digitally sampled perpendicular to theknife-edge direction, and the result is the edgespread function (ESF). Figure 8 shows the ESF ofthe fiber bundle as measured using the knife-edgetechnique.
The next step is to obtain the line spread function(LSF) by differentiating the ESF. To avoid numerical
differentiation, the ESF is approximated by a polyno-mial function [14] andanalytically differentiatedwithrespect to the scan direction to yield theLSF.Next, wecompute the Fourier transform of the sampled LSF.The discrete Fourier transform (DFT) is a 1D profilethat is done in the direction perpendicular to the ori-ginal knife edge. The result is the MTF, and the reso-lution of the bundle was determined by the width athalf-maximum. In our bundles, the resolution wasfound to be 2.2 lines/mm for a 100 μm core diameterbundle and 8 cm length, as can be seen in Fig. 9. Theseresolutions are adequate for transmitting good-quality thermal images.
Figure 10 below shows the calculated fiber bundleMTF (smooth line), as was calculated in the previoussection, and the measured MTF using the knife-edgetechnique. The calculated resolution is 1.9 lines/mm,and the measured resolution is 2.2 lines/mm. As canbe seen, the calculated resolution and the measuredone are quite similar.
1. Thermal Response—Experimental Results
Measuring the thermal response of the fiber bundlerequired a temperature-controlled target, which canbe tuned very accurately to any temperature at therange of at least 200 °C. The target we chose was a0:5mm thick lead rod connected to a current source.We applied different current levels through the leadrod and observed it with the thermal camera to ob-tain the exact relation between the electrical currentrunning through the lead rod and its temperature.The lead rod showed a linear and stable relationshipbetween current and temperature, giving us a conve-nient temperature-controlled target. We placed thetemperature-controlled target in front of the distalend of the fiber bundle while focusing the thermalcamera on the proximal end. We then changed thetarget temperature gradually and measured thetemperature obtained by the camera. The experi-mental setup illustrated in Fig. 12 shows the tem-perature of the target versus the temperature seenby the thermal camera at the proximal end of the fi-ber bundle. The results show that a notable changein the output temperature starts around 60 °C, andfrom that point onward, the average ratio betweentemperature changes in the target and the tempera-ture changes in the camera are ∼20 (for every 20 °Cchange in the target temperature, the camera tem-perature will change by 1 °C).
The experimental setup for measuring the mini-mum resolvable temperature difference (MRTD)with the bar target method is shown in Fig. 13.We used a bar target that is composed of a few blacklines of emissivity ε ≈ 1, which were painted on a me-tal plate (of low emissivity ε ≈ 0:02). The width w ofeach line was equal to the separation, u, between the
Fig. 9. (Color online) MTF of the 100 μm core fiber bundle.
Fig. 10. (Color online) Calculated (smooth) versus actual (jagged)MTF for 100 μm core fiber bundle.
Fig. 11. Experimental setup for the thermal response of the fiberbundle.
Fig. 12. (Color online) Temperature sensitivity of the fiberbundle. The target temperature (blue–left y axis) versus thetemperature via the fiber bundle (red–right y axis).
lines. We used w ¼ u with a value of 0:4mm. Theimaging resolution is the camera’s spatial resolution,which is 1:3mrad. The camera thermal sensitivityis 0:08 °C.
As the bar targetwasuniformlywarmed, the appar-ent temperature of the bars is related to their emissiv-ity value (ability to emit energy by radiation) anddoesnot reflect the true target temperature (which wasprobably quite similar). In this experiment, the tem-perature values we report are the apparent tempera-tures (as seen by the thermal camera) and not theactual target temperature.
The bar target was slowly warmed until it was ob-servable via the fiber bundle. At that point, we mea-sured the temperature of the hot (metal) lines to be55:5 °C, and the temperature of the cold (black) lineswas 42:3 °C. This measurement yields an MRTDvalue of 13:2 °C. The response of our system to abar target object is shown in Fig. 14. The right-handside of Fig. 14 shows the bar target as seen directlyby the thermal camera; the left-hand side of Fig. 14shows the image transmitted through the HGWbundle.
4. Thermal Imaging of a Coherent HGW Bundle
A. Experimental Setup
A small-bore rigid coherent bundle with a capillarybore size of 100 μm and 900 holes was used to imageahot target. TheHGWusedwasoptimized to yield thebest transmissionat an8–10 μmwavelength range, asdescribed in Subsection 3.A All the images were ob-tained using a thermal imaging camera (Thermovi-sion A40; FLIR Systems, Boston, Massachusetts)operating in the 7.5–13 μm spectral range, with a2:5 cm focal length magnifying lens between the
bundle and the camera. There were no optics betweenthe object and the bundle; the target objects were sim-ply placed very close to the bundle (1–2mm). The set-up is shown in Fig. 15. Figure 16 shows the imagetransmitted by the bundle. The hot tungsten wire im-aged had an outer diameter of 0:2mm, and the leadrod was 0:5mm in diameter. The temperature ofthe wire was about 230 °C. The temperature scalein the figure corresponds to the camera’s reading afterthe attenuation caused by the optical coupling.
B. Thermal Imaging—Results
The experimental setup in Fig. 15 was used tocapture different images of various warm objects.Figure 16 shows examples of thermal images trans-mitted by the fiber bundle. The image object con-sisted of a tungsten wire and a lead rod that wereheated by an electric current.
C. Simulation of a Thermal Image Transfer through aFiber Bundle
In order to obtain the optical effect of a fiber bundleon a 2D image, we treated each pixel in the sourceimage as a single point light source. In the sameway as discussed in Subsection 3.B, a computer simu-lation calculated the propagation of a light beamthrough a single hollow waveguide. For each pixelin the source image and for each waveguide in thebundle, the entrance angle and energy were calcu-lated as shown in Fig. 17. The X=Y plane is aligned
Fig. 13. Experimental setup to measure the MRTD using the bartarget method.
Fig. 14. (Color online) Right: bar target as seen directly bythe thermal camera. Left: image transmitted through the HGWbundle.
Fig. 15. Experimental arrangement for IR imaging of a hot wirethrough the 900 hole, 100 μmboreHGWbundle. The tungstenwirewas electrically heated and placed 1mm in front of the bundle’s leftend. The image emitted from the bundle’s right end was magnifiedby a 2:5 cm IR lens and the IR camera’s close-up lens and recordedby the camera.
Fig. 16. (Color online) Thermal image of a tungsten wire and alead rod heated by an electric current. The image was transmittedby a HGW fiber bundle (left) 0:5mm lead rod at 190 °C (right) hotwire at 230 °C.
with the fiber bundle end facing the target image. Gi-ven that a point light source is located at ½x1; y1; z1�above the proximal end of the fiber bundle (point 1in Fig. 17) and a certain waveguide in the fiber bun-dle located at fx2; y2; 0g (point 2 in Fig. 17), it is sim-ple to calculate the traveling distance and theentrance angle to the waveguide. Calculating the dis-tance will give us the relative energy entering thewaveguide (as explained in Subsection_3.B) and to-gether with the entrance angle, we can obtain theoutput energy of each waveguide in the fiber bundledue to that single light source. Assuming L ≫ r (L isthe distance between the light source and r is thesingle waveguide diameter), we assumed that allthe energy entering the waveguide enters at thesame angle.
The distance on the X=Y plane between the lightsource and a waveguide in the bundle is denoted by Pand is obtained by
P ¼ffiffiffiffiffiffiffiffiffiffiffiffiffiffiffiffiffiffiffiffiffiffiffiffiffiffiffiffiffiffiffiffiffiffiffiffiffiffiffiffiffiffiffiffiffiffiffiffiffijX1 − X2j2 þ jY1 − Y2j2
q: ð4Þ
The entrance angle is then given by
α ¼ tan−1
�PZ1
�: ð5Þ
The distance from the light source to the singlewaveguide (L) is given by
L ¼ffiffiffiffiffiffiffiffiffiffiffiffiffiffiffiffiffiZ21 þ P2
q: ð6Þ
A simulation was done in order to obtain the outputenergy of each waveguide due to a single source. Thesame was done for all the pixels in the source image.The total energy at the distal end of a single wave-guide in the bundle is the sum of the energy contri-butions of each pixel in the source image.
If we attempted to run this simulation for everypixel in the source image and for every wave-guide in the bundle, we would have to run an innu-merable amount of simulations, which would take anunreasonable amount of time. Instead, we ran onlyseveral simulations for different entrance angles, ob-tained a normalized graph of the output energy as afunction of the angle, and fitted a curve to theseresults. The fitted curve was then used to obtainthe attenuation factor of the waveguide, and the en-trance energy was multiplied with the attenuationfactor to give the energy of light at the distal endof the fiber (Pout).
An example of the results of a 2D simulation isshown in Fig. 18 together with the actual imagetransferred through the fiber bundle (for reference).
In order to estimate the bundle transmission, wesummed the energy at the distal end of the bundleand divided it by the total energy at the proximalend of the bundle. Because the output image genera-tion involves summarizing the contribution of eachpixel on each waveguide in the bundle, we actuallyapplied the input image 900 times (for every wave-guide in the bundle, which consists of 900 wave-guides). In order to normalize the output energy,we divided it by 900 multiplied by the input energy:
Transmission
¼ sum of output pixelsno of bundle waveguides × sum of input pixels
¼ 0:059: ð7Þ
This transmission value is lower than the transmis-sion value we got in the laboratory measurementsusing the same fiber bundle parameters. This mightbe, in part, due to the fact that in the transmissionmeasurements, we used the CO2 laser and measuredthe transmission at 10:6 μm only. The emitted laserlight is a monochromatic, spatially coherent, narrowlow-divergence beam and is transmitted in parallelto the fiber axis, while the imaging simulation takesinto account the random and diverse nature electro-magnetic waves traveling within the hollow wave-guide. Nevertheless, the transmission value we gotis of the same order of magnitude as the experimen-tal result.
5. Conclusions
HGW thermal imaging bundles have been shown tobe successful at transmitting infrared radiation from
Fig. 17. (Color online) Calculation of the entrance angle and lightenergy for one waveguide located at point 2 in the fiber bundlefrom a single light source located at point 1.
Fig. 18. (Color online) 2D simulation of the transferred image ofthe 0:5mm lead rod through the HGW fiber bundle (left) versusthe actual 0:5mm lead rod image (right).
a given source and are potentially very useful for en-doscopic thermal imaging. The experimental resultsare encouraging and show an improvement in theresolution and thermal response of the HGW fiberbundles. Current downsides are the low special reso-lution, due to the larger capillary bore size, and thehigh loss, owing to the small bore size of thecapillaries making up the bundle. This leads to thehigh temperature of the source at which transmit-tance is acceptable.
Additional decrease of the bundles’ attenuation isrequired in order to be able to use this technology formedical applications. Because the losses vary as1=a3, where a is the bore radius, in the future, it willbe necessary to employ multilayer dielectric coatingsinstead of a single dielectric film. We expect that itwill be necessary to move to newer metal sulfide di-electric coatings rather than the AgI coating, as themetal sulfide thin film materials enable the fabrica-tion of multilayer dielectric coating [16]. Multilayerdielectric coated hollow waveguides can have muchlower loss than single layer coated guides, and thiswill become very important as the bore size of thetubing in the bundle becomes smaller. By using astack of alternating high and low refractive index di-electric layers, it is theoretically possible to greatlyreduce the loss of these HGWs. In addition, it willbe necessary to fabricate bundles with even smallerbore sizes for better spatial resolution.
Using larger core diameters, HWG can be an im-mediate solution for some applications. A larger corediameter yields a much better thermal response atthe expense of poorer special resolution, which canbe acceptable in some applications. In addition,future coherent image bundles need to be flexible,just as they are for visible fiber bundles. This will al-low access to remote parts of the body. We intend tomake flexible bundles first by the ribbon technique,in which ribbons of small-bore tubing are formed,and these ribbons are stacked to make a coherent ar-ray. Those bundles have many clinical applications,as we develop and see. They can be used to measuretemperature increase in tumor treatment, in tissueablation, and in tumor or other lesion temperatures,as well as in photothermal applications [17].
We would like to have the ability to measure arange of temperatures, between room temperatureand body regular temperature (36–37 °C) up to abla-tion at 100 °C. It will be good to have about 0:1 °C intemperature resolution. It will be good to have bun-dles with an outer diameter of about 1mm. The flex-ibility will be helpful to have it inserted in the
working channels of endoscopes, so a 5 to 10 cm bend-ing diameter may be sufficient.
The authors thank the U.S.–Israel BinationalFoundation for their support of this research throughgrant 2007382.
References1. J. Hecht, Understanding Fiber Optics (Prentice-Hall,
2002).2. J. Harrington, Infrared Fiber Optics and Their Applications
(SPIE Press, 2004).3. J. Nishii, S. Morimoto, I. Inagawa, R. Iizuka, T. Yamashita,
and T. Yamagishi, “Recent advances and trends in chalcogen-ide glass fiber technology: a review,” J. Non-Cryst. Solids 140,199–208 (1992).
4. J. Nishii, T. Yamashita, T. Yamagishi, C. Tanaka, and H. Sone,“Coherent infrared fiber image bundle,” Appl. Phys. Lett. 59,2639–2641 (1991).
5. A. R. Hilton, Sr., “Infrared imaging bundles with good imageresolution,” Proc. SPIE 4253, 28–36 (2001).
6. E. Rave and A. Katzir, “Ordered bundles of infrared transmit-ting silver halide fibers: attenuation, resolution and cross talkin long and flexible bundles,” Opt. Eng. 41, 1467–1468(2002).
7. E. Rave, L. Nagli, and A. Katzir, “Ordered bundles of infra-red-transmitting AgClBr fibers: optical characterizationof individual fibers,” Opt. Lett. 25, 1237–1239 (2000).
8. E. Rave, D. Shemesh, and A. Katzir, “Thermal imagingthrough ordered bundles of infrared-transmitting silver-halide fibers,” Appl. Phys. Lett. 76, 1795–1797 (2000).
9. I. Gannot, “Thermal imaging bundle—A potential tool to en-hance minimally invasive medical procedures,” IEEE CircuitsDevices 21, 28–33 (2005).
10. N. Croitoru, J. Dror, and I. Gannot, “Characterization ofhollow fibers for the transmission of infrared radiation,” Appl.Opt. 29, 1805–1809 (1990).
11. V. Gopal, J. A. Harrington, A. Goren, and I. Gannot, “Coherenthollow-core waveguide bundles for infrared imaging,” Opt.Eng. 43, 1195–1199 (2004).
12. Y. Matsuura, T. Abel, and J. A. Harrington, “Optical propertiesof small-bore hollow glass waveguides,” Appl. Opt. 34 , 6842–6847 (1995).
13. B. Jähne, Digital Image Processing, 6th ed. (Springer, 2005).14. H. Wong, “Effect of knife-edge skew on modulation transfer
function measurement of charge-coupled device imagersemploying a scanning knife edge,” Opt. Eng. 30, 1394–1398(1991).
15. A. P. Tzannes and J. M. Mooney, “Measurement of the modu-lation transfer function of infrared cameras,” Opt. Eng. 34,1808–1817 (1995).
16. V. Gopal and J. A. Harrington, “Deposition and characteriza-tion of metal sulfide dielectric coatings for hollow glasswaveguides,” Opt. Express 11, 3182–3187 (2003).
17. Y. Milstein, M. Tepper, M. Ben David, J. A. Harrington, and I.Gannot, “Photothermal bundle measurement of phantomsand blood as a proof of concept for oxygenation saturationmeasurement,” J. Biophoton. 3(10) (2010).