Page 1
Proceedings of the 5th International Conference on Integrity-Reliability-Failure, Porto/Portugal 24-28 July 2016
Editors J.F. Silva Gomes and S.A. Meguid
Publ. INEGI/FEUP (2016)
-801-
PAPER REF: 6267
COHESIVE ZONE MODELLING OF ADHESIVE IN BUTT
JOINT SPECIMEN
Jarno Jokinen(*), Mikko Kanerva
Department of Mechanical Engineering, Aalto University, Finland (*)
Email: [email protected]
ABSTRACT
Adhesively bonded joints are mainly designed to transfer loads in shear. The out-of-plane
forces, or peel forces, can anyhow have a significant influence on joint loading. A type of
specimen for experimental testing of adhesive performance in out-of-plane loading is the butt
joint specimen. In this work, we performed finite element analyses for the butt joint specimen.
First, mesh sensitivity effects on stress analysis results were studied. Second, the effects of
several geometric and analysis features on the simulated specimen behaviour were analysed.
The focus of the work was in failure behaviour when cohesive elements are utilized. The
results of our study make clear the importance of an intact glue-line, the effect of glue-line
thickness variation, and also establish an idea of a new butt joint specimen design.
Keywords: Cohesive elements, adhesive, butt joint, test design.
INTRODUCTION
Adhesively bonded joints have been utilized widely in different kind of structural
applications. Adhesively bonded joints are mainly designed to transfer loading in shear.
However, out-of-plane forces – namely peel forces, cannot be totally avoided. For example,
the peel stresses emerge in typical shear dominated specimens, such as the single lap joint
where peel stress effects on crack onset can be high.
A specimen type utilized in peel strength studies is the so-called butt joint specimen. In the
butt joint specimen, the adhesive is applied between two cylindrical adherents. Upon testing,
the bonded specimen is loaded using tensile loading. The stress state in the adhesive is three-
dimensional. In the current literature, this three-dimensional stress state has been studied
using different finite element procedures [Adams&Wake]. Firstly, the edge stresses differ
from the ones found at the central part of the specimen (inside adhesive layer). Secondly,
these free edge stresses are typically dependent on the element mesh created for the finite
element model.
For practical purposes, a stress analysis is able to remark critical spots from where the damage
is the most probable to onset. However, further analysing of the damage onset and
propagation requires fracture mechanics methods. In general, adhesively bonded joints have
been studied using cohesive elements. The elements are typically attached to the adhesive-
adherend interface. The damage analysis is based on a traction-separation law (see e.g.
[Turon]). The applied traction-separation law has a significant effect on the damage behaviour
of the adhesive bond line [Volokh].
Page 2
Symposium_5: Advanced Discretization Techniques in Structural Mechanics
-802-
In this work, our target is two-fold: Firstly, we perform sensitivity analyses of our numerical
butt joint specimen model. Secondly, we study manufacturing defect and geometry effects on
specimen behaviour.
In sensitivity analyses we studied how the finite element mesh fineness, position of the failure
surface and the applied cohesive zone model affect analysis results. The response was
interpreted using out-of-plane stresses and force-displacement curves of the specimen. Based
on these sensitivity analyses, an applied model was defined for manufacturing defect and
geometry effect analyses.
In manufacturing defect and geometric variation analysis, different scenarios of debond and
geometric anomalies existing in the specimen were studied. This provides useful information
for manufacturing and testing of butt join specimens. Comparisons were carried out based on
force-displacement-curves. In addition, damage onset patterns in the cohesive element plane
were studied to find out whether the damage propagates gradually or occurs suddenly
through-out the cross-section. Based on analyses, a new geometry for the specimen was
innovated. The innovation was to use a partly hollow specimen to achieve crack propagation
instead of extensive sudden damage.
MATERIALS AND METHODS
Materials
The adherends of the butt joint specimen were modelled as aluminium. Young’s modulus of
aluminium was 70 GPa and Poisson’s ratio 0.33 in our analyses. Material properties of the
adhesive were approximated to resemble the epoxy film adhesive Cytec FM-300-2K. Young’s
modulus of adhesive was 2.45 GPa and Poisson’s ratio 0.38. The applied properties of the
adhesive failure are collected into Table 1.
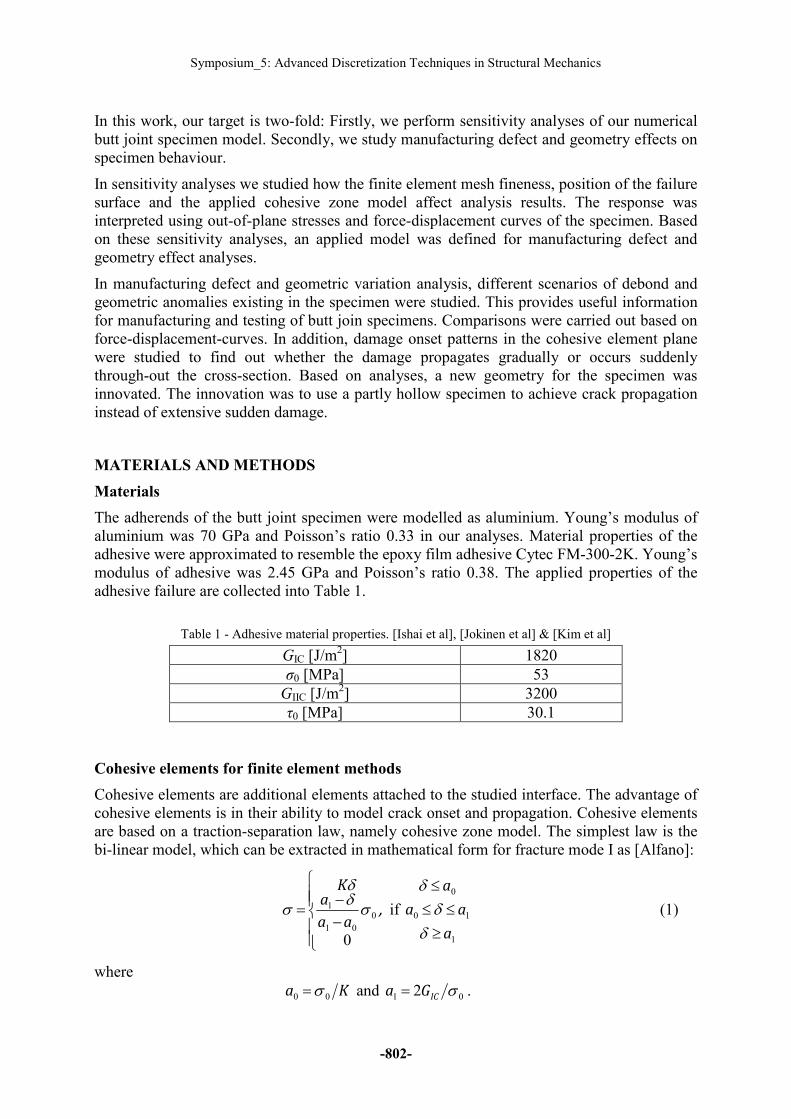
Table 1 - Adhesive material properties. [Ishai et al], [Jokinen et al] & [Kim et al]
GIC [J/m2] 1820
σ0 [MPa] 53
GIIC [J/m2] 3200
τ0 [MPa] 30.1
Cohesive elements for finite element methods
Cohesive elements are additional elements attached to the studied interface. The advantage of
cohesive elements is in their ability to model crack onset and propagation. Cohesive elements
are based on a traction-separation law, namely cohesive zone model. The simplest law is the
bi-linear model, which can be extracted in mathematical form for fracture mode I as [Alfano]:
,
−
−=
0
0
01
1 σδδ
σaa
aK
if
1
10
0
a
aa
a
≥
≤≤
≤
δ
δ
δ
(1)
where
Ka 00 σ= and 01 2 σICGa = .
Page 3
Proceedings of the 5th International Conference on Integrity-Reliability-Failure
-803-
The bi-linear traction-separation law includes three parameters for defining the law. The
fracture toughness GIC is given in the form of energy release rate, typically measured
experimentally using double cantilever beam specimen [ISO25217]. In a graphical
interpretation (Fig. 1), GIC is the area under the traction-separation curve. The cohesive
stiffness K defines the traction-separation law before damage initiation. Several methods for
estimating stiffness have been developed, such as [Turon] and [Zou et al.]. We utilized a
value of K=1015 N/m
3 in this study. Third parameter in the model is cohesive strength σ0 for
defining damage initiation. The initiation is defined using a stress or strain criterion (in
Abaqus). Cohesive strength is mainly considered as a numerical parameter fitted based on
experimental results. Numerical fitting causes some issues, e.g. that the achieved strength is
mesh-dependent. We utilized a linear stress criterion using strength values based on current
literature. Linear stress criterion is simplified to a form:
00ττσσ +=f (2)
where σ0 and τ0 are cohesive strengths for mode I and II fracture.
Fig. 1 - Bi-linear traction-separation law for cohesive elements.
Finite element (FE) model
The butt joint finite element analyses were performed using Abaqus, version 6.14. Analysis
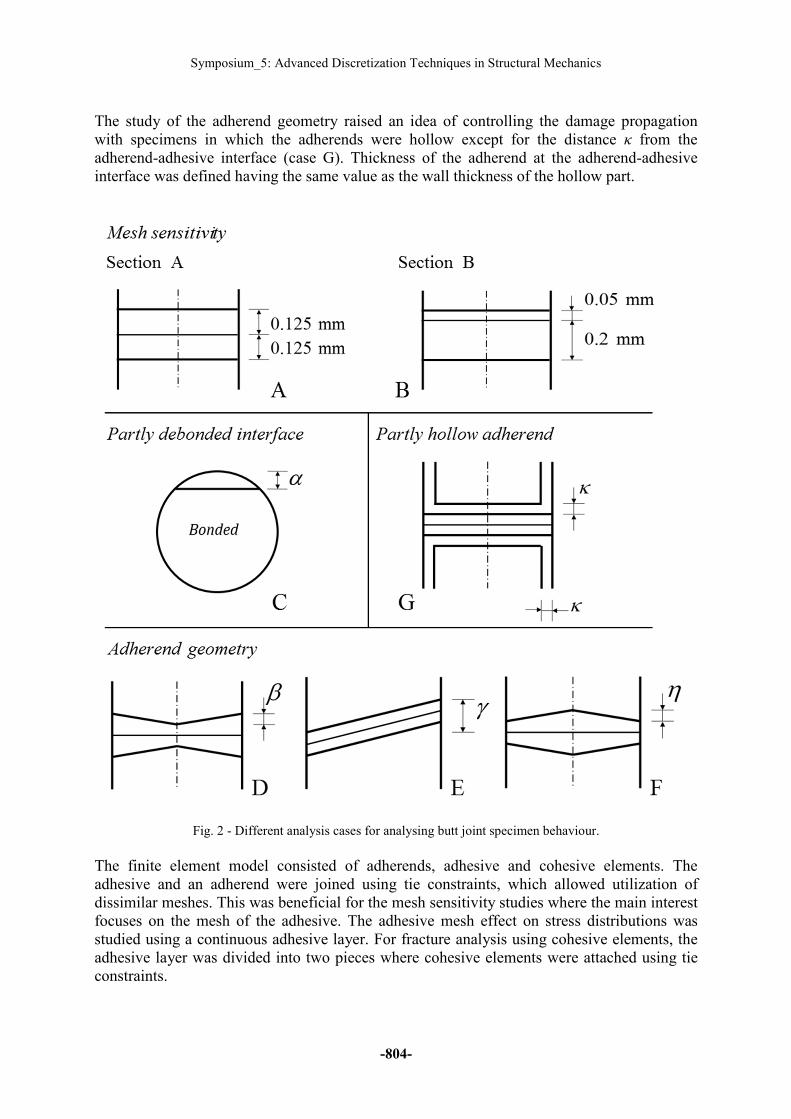
cases are shown in Fig. 2. The work was initiated by studying the mesh sensitivity for
adhesive failure at one of two sections, A and B. The sensitivity was analysed in terms of out-
of-plane stress and force-displacement curves when using cohesive elements at either of the
sections. The choice of appropriate mesh for further analyses was based on these analyses.
The effect of a specific traction-separation law on the force-displacement -curve was studied
for the section A.
For simulating a manufacturing defect, a partly debonded specimen (case C) was analysed.
The debond tip was defined as straight. The debond extent was defined by the maximum
distance between the tip and free surface (α). A real defect might not just occur during
bonding but already during manufacturing of the adherends. Therefore, in cases D, E & F, the
adherend interface (against adhesive) was not normal to the longitudinal free surfaces of the
specimen. Both symmetric and asymmetric anomalies were studied. The defect size was
exaggerated (β, γ & η) for clarifying the effect in results. The results were studied in terms of
force-displacement –curves and the damage distribution over the cohesive elements plane.
Damage distribution was of especial interest for the cases with abnormal adherend
geometries.
Page 4
Symposium_5: Advanced Discretization Techniques in Structural Mechanics
-804-
The study of the adherend geometry raised an idea of controlling the damage propagation
with specimens in which the adherends were hollow except for the distance κ from the
adherend-adhesive interface (case G). Thickness of the adherend at the adherend-adhesive
interface was defined having the same value as the wall thickness of the hollow part.
Fig. 2 - Different analysis cases for analysing butt joint specimen behaviour.
The finite element model consisted of adherends, adhesive and cohesive elements. The
adhesive and an adherend were joined using tie constraints, which allowed utilization of
dissimilar meshes. This was beneficial for the mesh sensitivity studies where the main interest
focuses on the mesh of the adhesive. The adhesive mesh effect on stress distributions was
studied using a continuous adhesive layer. For fracture analysis using cohesive elements, the
adhesive layer was divided into two pieces where cohesive elements were attached using tie
constraints.
Page 5
Proceedings of the 5th International Conference on Integrity-Reliability-Failure
-805-
The adherend length was 45 mm and adhesive thickness 0.25 mm in the reference analysis.
The specimen had a circular cross-section with a diameter of 15 mm. In an experimental
specimen, the adherends would attach to the test machine via loading pins through the
adherends. We did not model the holes for the pins. Instead, a partition was defined at the
centre line of the hole in both adherends (Fig. 3). Boundary conditions were attached along
lines representing the pin-adherend contact line in reality, which were perpendicular directed
in each adherend allowing rotation over the axis of the line. In the lower adherend pin-contact
line all displacements were restricted. The loading (displacement) was provided for the
specimen at the upper adherend pin-contact line. For this line, a vertical enforced
displacement was attached while other displacements were restricted. The enforced
displacement was 0.075 mm in stress analyses. In fracture analyses, the enforced
displacement value was modified to be adequate for achieving failure in the cohesive
elements. The enforced displacement was performed using two analysis steps because load
increase incrementation was modified between the steps in the fracture analyses. This
modification allowed smaller incrementation when fracture occurs while the initial part was
calculated using larger increments.
The applied FE model (its half) is shown in Fig. 3. In the model, the adherends were meshed
using continuum elements C3D8R. Typical element dimension in the adherends was 0.5 mm.
The total number of elements in the adherends was 155,520. In the mesh effect studies, the
element dimensions in cohesive elements and adhesive mesh were changed per analysis case.
Typically, the element dimension was kept the same in the adhesive and cohesive elements.
The element dimension range was from 0.05 mm to 0.2 mm. The adhesive was modelled
using elements C3D8R and C3D8, from which the former is a reduced integrated element and
the latter is a fully integrated element. The number of elements in the adhesive was from
17,936 to 849,600.
Fig. 3 - Finite element model half and three different mesh fineness levels of the adhesive
shown on the right.
Page 6
Symposium_5: Advanced Discretization Techniques in Structural Mechanics
-806-
RESULTS
Mesh effects on stress analysis
Finite element mesh effects on stress distribution were studied in two sections of the adhesive,
A and B (Fig. 2). The section A is located in the middle of the adhesive. The section B is
located at 0.05 mm distance from the (upper) adhesive-adherend interface. Mesh effects on
peel stress distributions at the sections A and B are illustrated in Figs. 4 and 5, respectively.
Figs. 4 and 5 show that the mesh mainly affected the stresses close to the free edge (r = 7.5
mm) of the adhesive. The stress level was rather constant and mesh effect was low closer to
the centre of the cross-section. The utilization of a fine mesh provided lower stress values
compared to a coarse mesh at the free edge. The fully integrated C3D8 elements provided
higher stress values than comparable meshes with the reduced integrated element C3D8R.
The comparison of results for sections A and B shows that the free edge stresses are lower for
the section B than for the section A. The values at the centre were comparable in both
sections.
Fig. 4 - Mesh effects on stress distribution at the section A.
Fig. 5 - Mesh effects on stress distribution at the section B.
Mesh effects on cohesive zone modelling
The mesh sensitivity results using cohesive elements for the sections A and B are shown in
Figs. 6 and 7, respectively. The results were obtained using cohesive elements with the bi-
linear traction-separation law. The force-displacement-curves provided by the models were
Page 7
Proceedings of the 5th International Conference on Integrity-Reliability-Failure
-807-
relatively similar. The force increases linearly until the maximum force is reached and
decreases suddenly after the maximum, critical force. This states that damage is unstable after
reaching a sufficient load state.
However, some essential differences existed. For two coarsely meshed (C3D8R 0.2 mm &
0.125 mm) reduced integrated models, the force did not drop to zero, which remarks that a
connection is still existing at the section (in this case section A). The finest mesh models with
reduced integrated elements had severe convergence challenges and the analysis was not fully
run to end for the sections A and B. The analysis of the two finest models using reduced
integrated elements were aborted. The convergence difficulties became worse when using
reduced integrated elements and when studying the section B. These analyses were also
aborted after some hundreds of increments. The convergence could be achieved by further
modifying incrementation and other numerical parameters.
The magnification of the curves remarks interesting differences. The reduced integrated
elements utilize a smaller increment at the failure, which results to smoother curves at the
turning point. The only exception is C3D8R with 0.125 mm element dimension for the section
A, for which incrementation decreased during the descent path. Based on the analyses, the
main difference between the element meshes is the analysis convergence and (time)
efficiency. Consequently, C3D8 element using 0.125 mm typical dimension was chosen for
further analyses.
Fig. 6 - Mesh effects on cohesive element analysis force-displacement curves at the section A.
Fig. 7 - Mesh effects on cohesive element analysis force-displacement curves at the section B.
Page 8
Symposium_5: Advanced Discretization Techniques in Structural Mechanics
-808-
Cohesive zone model effects
The cohesive zone model is the key element in cohesive element analyses. We performed
analyses using two different cohesive zone models, a bi-linear and trapezoidal (definitions in
Fig. 8). The trapezoidal law involves a cohesive strength plateau over a larger distance and the
degradation occurs over a smaller distance of separation compared to the case with the bi-
linear law. The results of the cohesive zone model comparison are shown in Fig. 9. The force-
displacement curve with the trapezoidal law resulted in a force plateau, resembling more
ductile behaviour. The trapezoidal law was defined using a discretized, table format in
Abaqus. The discretization was found overly coarse, which was seen evident based on the
oscillation of the force-displacement curve.
Fig. 8 - Traction-separation curves for applied cohesive zone models.
Fig. 9 - Cohesive zone model effects on the force-displacement curve at the section A.
Page 9
Proceedings of the 5th International Conference on Integrity-Reliability-Failure
-809-
Partly debonded adhesive section
For the case C (Fig. 2), a partly debonded specimen was analysed and the results are shown in
Fig. 10. Load response is seen to be nonlinear, especially for the two specimens with large
initial debonds. The behaviour of the models with small initial debonds is interesting. The
force-displacement curves indicate a linear response before failure initiation that is presented
by a clear force drop. However, in contrast to all previous simulations, the force drop does not
result in total failure of the cohesive elements. The behaviour is supported by the cohesive
element damage, which is wide at that point of the curve but not throughout the cross-section.
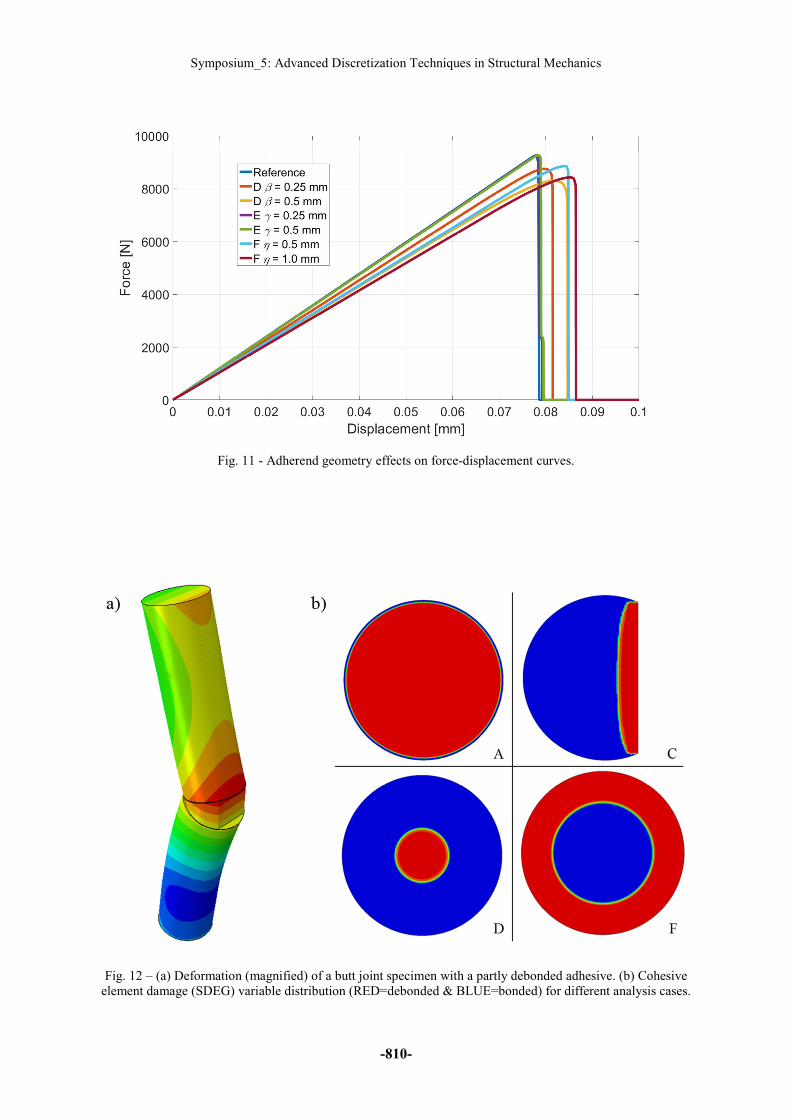
The unsymmetric debond results in rotation of the adherends around the boundary condition
axis as shown in Fig. 12a.
Fig. 10 - Debond effects on force-displacement curves.
Adherend geometric variation effects
The results of the analyses with changes in the adherend geometry (cases D, E & F in Fig. 2)
are shown in Fig. 11. The curves do not present major differences between the different
simulation cases. The models D and F have a lower stiffness (linear region) when compared
to the reference model and model D. These models have also larger (in displacement)
nonlinear part than the reference model. Likewise, the failure for these models is delayed and
the maximum force is decreased approximately 10 %. While the force-displacement curves do
not remark significant differences, the crack onset and propagation are different for the
different simulation cases. Damages in the cases D and F are illustrated in Fig. 12. The image
of the cohesive element damage characterizes the damage form in the failure plane of the
adhesive. The change of the adherend geometry shifts the damage initiation to the centre part
for the case D and to the outer (free-edge) region for the case F. This is a significant
difference when compared to the reference model A, where damage occurs merely at once
and throughout the cross-section. The different damage propagation occurring for the cases D
and F can be seen in Fig. 11 as a larger nonlinear part of the force-displacement curves.
Page 10
Symposium_5: Advanced Discretization Techniques in Structural Mechanics
-810-
Fig. 11 - Adherend geometry effects on force-displacement curves.
Fig. 12 – (a) Deformation (magnified) of a butt joint specimen with a partly debonded adhesive. (b) Cohesive
element damage (SDEG) variable distribution (RED=debonded & BLUE=bonded) for different analysis cases.
Page 11
Proceedings of the 5th International Conference on Integrity-Reliability-Failure
-811-
Partly hollow specimen design
A partly hollow specimen was innovated based on the simulation analysis for the case F (see
Fig. 11). The response of the new specimen design in the form of a force-displacement curve
can be seen in Fig. 14. Firstly, the utilization of cylindrical (hollow) adherends decreases the
stiffness of the specimen. The decrease in the wall thickness extends the nonlinear part of the
curve. A comparison of case F and G force-displacement curves indicates a larger
nonlinearity, or damage propagation potential, for the case G – the hollow specimen.
Fig. 13 - Force-displacement curves for partly hollow specimens.
DISCUSSION
A variety of butt joint analyses was performed. The stress analysis of a traditional butt joint
specimen remarked that out-of-plane stress values remain at a relatively constant level along
the centre part of the adhesive cross-section independent of the mesh. Out-of-plane stress has
lower values at the free edges than at the centre part of the specimen and the decrease is
clearly mesh and element dependent. For the centre part, the mesh effect on the out-of-plane
stress was minor.
Another mesh sensitivity study was performed for a model with cohesive elements. The study
showed that better results and convergence can be achieved using fully integrated elements in
the adhesive layer. For the reduced integrated analysis, convergence problems were typical
and failure was not always achieved. The element dimension effect on force-displacement
response of the specimen was relatively low.
Page 12
Symposium_5: Advanced Discretization Techniques in Structural Mechanics
-812-
In the current literature, traction-separation law effects on finite element analyses have been
discussed. In this study, we compared two different laws, a bi-linear and a trapezoidal model.
The traction-separation law affected the force-displacement response of the butt joint. The
shape of the law is shown in the response as a change in simulated ductility. The applied
trapezoidal law was modelled in a table (discretized) form, which results in oscillation and
tendency to incrementation leading to an increase in the CPU time.
Several manufacturing scenarios related to bonding and geometry of the specimen were
analysed via the finite element model. The effect of an unsymmetric partial debond at the
adhesive cross-section is seen clearly in the force-displacement response. The debond results
in bending and nonlinear response of the specimen. An interesting feature of the specimen
failure was a combination of a sudden force drop (partial failure) and a wide, smooth
nonlinear part.
The adherend geometric effects on the force-displacement response did not provide as
significant change as the partly debonded specimen did. The force-displacement curves with
adherend geometry modifications were comparable to the reference specimen’s curve. The
main change with a geometric modification of the adhesive-adherent interface was found in
the damage pattern. The change in the adhesive thickness as a function of radius guides the
damage. Using different geometries of the adherend/adhesive interface, the crack onset was
shifted between the centre and free edges.
Utilization of a partly hollow specimen design enabled to control the damage onset to the
areas under the cylindrical walls, or edges. In the force-displacement curve, a decreased
stiffness was evident. As an important outcome, the decrease in the wall thickness increased
the nonlinearity of the load response. Typically, the nonlinearity in the force-displacement
response can be interpreted as crack propagation instead of sudden and uncontrolled failure of
the adhesive, yet being length scale and time dependent in definition [Kanerva et al].
CONCLUSIONS
In this study, we performed stress and failure analyses for butt joint specimens. The finite
element mesh was found to affect the stress values close to free edges of the adhesive glue-
line. In the centre part of the specimen, the mesh effect on the out-of-plane stress component
was relatively small. The section of stress analysis, or failure plane, did not remark any clear
effect on the stress distribution prior to failure. The mesh had an effect on the cohesive
element analysis of the adhesive failure. The main difference was seen when using coarse
reduced integrated elements, where element distortion caused problems in running an efficient
analysis. Convergence was also seen to be dependent on the applied mesh.
Another target of the work was to study manufacturing anomalies and defects suspected for
the butt joint specimen. Based on our analysis, a partial debond has a significant effect on the
force-displacement response. A debond can provide a totally nonlinear response, where force
drop halts prior to the formation of a fully debonded cross-section. This was designated as a
damage propagation behaviour influenced by the specimen rotation and bending. Already
small debonds were observable in the force-displacement response. The adherend-adhesive
interface geometry had a minor effect on the response compared to a debond. The main
change caused by a change in the adherend-adhesive interface geometry is the shifting of the
Page 13
Proceedings of the 5th International Conference on Integrity-Reliability-Failure
-813-
damage onset location. Based on the analyses, the damage onsets at a location where a low
adhesive thickness exists. The analysis of a specimen design with partly hollow adherends
indicated nonlinear response, i.e. damage propagation, which was controlled to evolve from
the edge and towards the centre.
ACKNOWLEDGMENTS
Authors want to acknowledge Finnish Defence Force Logistics Command for their support.
CSC – IT Center for Science Ltd. is acknowledged for the computational resources.
REFERENCES
[1]-R. D. Adams and W. C. Wake, Structural Adhesive Joints in Engineering.: Elsevier
Applied Science Publishers, 1984
[2]-ISO 25217, Adhesives - Determination of the mode 1 adhesive fracture energy of
structural adhesive joints using double cantilever beam and tapered double cantilever beam
specimens, International standard, 2009
[3]-G. Alfano, On the influence of the shape of the interface law on the application of
cohesive-zone models, Composites Science and technology, 66 (2006), 723-730
[4]-O. Ishai, H. Rosenthal, N. Sela, E. Drukker, Effect of selective adhesive interleaving on
interlaminar fracture toughness of graphite/epoxy composite laminates, Composites 19
(1988), 49-54.
[5]-J. Jokinen, M. Wallin, O. Saarela, Applicability of VCCT in mode I loading of yielding
adhesively bonded joints – a case study, International Journal of Adhesion and Adhesive 62
(2015), 85-91
[6]-M. Kanerva, E. Sarlin and O. Saarela, Variation in mode II dominated interface fracture of
stainless steel-epoxy bonds. Part 1: Mechanical testing, Engineering Fracture Mechanics, 99
(2013), 147-158
Page 14
Symposium_5: Advanced Discretization Techniques in Structural Mechanics
-814-
[7]-M. K. Kim, D. J. Elder, C. H. Wang, S. Feih, Interaction of laminate damage and adhesive
disbanding in composite scarf joints subjected to combined in-plane loading and impact,
Composite structures 94 (2012), 945-953
[8]-A. Turon, Simulation of delamination in composites under quasi-static and fatigue loading
using cohesive zone models, PhD thesis, Universitat de Girona, 2006
[9]-K. Y. Volokh, Comparison between cohesive zone models, Communication in numerical
methods in engineering, 20 (2004), 845-856
[10]-Z. Zou, S. R. Reid, S. Li, P. D. Soden, Modelling interlaminar and intralaminar damage
in filament-wound pipes under quasi-static indentation, Journal of composite materials 36
(2002), 477-499.