Page 1
ANALYSIS ON THE INEFFECTIVENESS OF THE LAKE BERRYESSA MUSSEL
PLAN AND THREAT OF INFESTATION OF ZEBRA AND QUAGGA MUSSELS
A Senior Thesis
Presented to the Faculty of
California State University, Sacramento
In Partial Fulfillment
Of the Requirements for the Degree
Bachelor of Science, Environmental Studies
Presented By:
Sabrina C. Colias
Fall 2013
Page 2
TABLE OF CONTENTS
PREFACE AND ACKNOWLEDGMENTS
CHAPTER 1 BACKGROUND ....................................................................... 3
CHAPTER 2 100TH MERIDIAN IMITATIVE AND THE BAY AREA ZEBRA AND QUAGGA
MUSSEL CONSORTIUM PREVENTION PLAN ................................... 8
CHAPTER 3 SAN JUSTO RESERVOIR ........................................................... 11
CHAPTER 4 HYPOTHESIS AN DATA TO BE ANALYZED .................................... 14
CHAPTER 5 DATA ANALYSIS .................................................................... 17
CHAPTER 6 INTERPRETATION AND SIGNIFICANCE .......................................... 19
CHAPTER 7 CONCLUSIONS ...................................................................... 20
CHAPTER 8 IMPLICATIONS ...................................................................... 21
APPENDIX A FIGURES
1.1 Zebra and Quagga Mussel Characteristics .......................................... 27 1.2 Zebra and Quagga Mussel Current Infestations ............................. 28
1.3 Zebra Mussel Attached to Crayfish ........................................... 29 1.4 Quagga Mussel Fouling Pipes ................................................. 29 1.5 MacIssac Schematic of Impacts of Dreissena Polymorpha ................. 30 2.1 100th Meridian Initiative ....................................................... 31 APPENDIX B TABLES AND GRAPHS
1.1 Zebra and Quagga Mussel Ideal Parameters ............................................. 32 5.1 Data Analysis from Traffic Counter............................................................. 33
5.2 Total Boat Launches Between Four Launch Sites ................................. 34 5.3 Average Daily Launches at Capell Cove .............................................. 35 5.4 Average Daily Launches at Markley Cove ........................................... 36 5.5 Average Daily Launches at Steel Park ................................................ 37 5.6 Average Daily Launches at Pleasure Cove ........................................... 38 5.7 Average Weekend Launches per Hour at Capell Cove ........................... 39 5.8 Amount of Boats Not Inspected Average ........................................... 40 5.9 Amount of High Risk Boats Average .................................................. 41
APPENDIX C ORIGINAL DOCUMENTS AND MAP
Page 3
Lake Berryessa Mussel Plan Analysis 1
ABSTRACT
The effectiveness of the Lake Berryessa Mussel Plan Hypothesis predicts the majority of boats
launching at Capell Cove Launch site are not being inspected and a percentage of those boats
pose high risk, potentially carrying the invasive mollusk species of zebra (Dreissena polymorpha)
or quagga mussels (Dreissena rostriformis). This hypothesis is based mainly on first hand
observation as a boat inspector and annual traffic counter data courtesy of The Bureau of
Reclamation. In order to estimate the amount of traffic launching per day, the traffic counter
needed to be calibrated against original data collected Friday through Sunday, Memorial Day
through Labor Day courtesy of The Solano County Water Agency. The amount of traffic
launching un-inspected was estimated by eliminating the numbers documented from the traffic
counter numbers. This was then broken up by month in order to estimate the seasonal trends.
This analysis will provide valuable information regarding the risk of infestation imposed on Lake
Berryessa.
Page 4
Lake Berryessa Mussel Plan Analysis 2
PREFACE
The work presented in this paper was conducted with various data provided by the Bureau of Reclamation and the Solano County Water Agency. This analysis was approved by both agencies and the California State University of Sacramento to whom it is presented to. Chapter two and three contain information provided by the San Benito Water District and Department of Water Resources from published and unpublished documents. I am a Level One Certified Watercraft Inspector and Certified Dockwalker. I collected data at the site of analysis under the Solano Resource Conservation District with an additional co-worker in 2012. The data provided collected on site was provided by a team of six employees at the Solano County Water Agency performing the same data collection in 2013, and I was also occasionally on site collecting data. Due to my work experience and certifications, I observed a lack of full time staffing at the site and developed the concept that the risk involved of potential infestation needed to be analyzed. I performed all of the data analysis presented in this paper with the assistance of supervisory staff at Solano County Water Agency, and developed my conclusions based on the data’s outcome and my own personal experience.
ACKNOWLEDGMENTS
Foremost, I would like to express my gratitude towards my professor and advisor, Dudley Burton, Ph.D., for the tireless support of my research and progress. His guidance and persistence has made this all possible. The Environmental Department is full of influential and helpful mentors that have led to my success in this department. In addition, I would like to thank my co-worker, Alisa Kim, for collecting data and inspecting boats with me even in the most grueling of heat waves. I would also like to thank all the staff at Solano County Water Agency including the summer interns of 2013; Kayla Henry, Marissa Hartley, Johnny Chang, Louis Anthony Perez, and Jessica Mendoza. Additionally from the Agency, a special thanks to Alex Rabidoux, PE, for guiding me through my data analysis and always being willing to help when needed, and thank you to Ken W. Davis for his intuitive insight and strong support. Finally, I would like to thank my family and friends for their constant support and belief in my success.
Page 5
Lake Berryessa Mussel Plan Analysis 3
CHAPTER I: BACKGROUND
Two invasive species have spread across North America in less than a decade. They are known
as the zebra (Dreissena polymorpha) and the quagga mussel (Dreissena rostriformis). Eurasian
mussel is a term used to describe zebra mussels (Dreissena polymorpha), quagga mussels
(Dreissena rostriformis bugensis), and golden mussels (Limnoperna fortunei), however it will be
used to describe only zebra and quagga mussels as a group in this report. Their names are
derived from their physical characteristics of the stripes on their shells as seen in Figure 1.1 in
Appendix A (Davis 2012). These two species are of the Mollusca Phylum (WoRMS 2013). They
are freshwater mussels known as filter feeders originating from southern Russia, in the Balkans,
and Poland (National Atlas). These organisms are filter-feeding, meaning they remove small
particles from freshwater, and according to the Western Regional Panel, alters nutrient flows
and providing a sink for environmental contaminants (Mangin 2001). Adult zebra mussels grow
up to approximately two inches in length and have the capability to filter up to one gallon per
day, per mussel (Mangin 2001). With this filtration feeding process, some particles are
consumed as food, and then deposited on freshwater floors as feces, whereas non-food
particles are combined with mucus and other matter and deposited onto benthic floors as
pseudo feces (Mills 1995). The zebra mussels usually mature for reproduction within a year,
and an individual female mussel can produce up to one million eggs per season (Mangin 2001).
These fertilized eggs are initially free swimming larvae known as veligers, but quickly mature
developing a hard shell and attaching to a hard surface with their byssal threads (Claudi &
Mackie 2010).
Although the zebra mussel and the quagga mussel are two distinct species, they share many
similar biological characteristics, and pose many of the same threats to fresh water systems.
Both species have the capability to adapt to a similar range of fresh water aquatic systems. The
zebra mussel can successfully infest waters with a range of fifteen to thirty milligrams of
Calcium per liter, whereas the quagga mussel can adapt to waters containing twelve to thirty
milligrams of water per liter (Claudi & Mackie, 2010). The Eurasian mussels have also been
found to successfully adapt to somewhat brackish water, ranging their adaptability of pH levels
from 7.4 to 9.0 (Claudi & Mackie 2010). However both the quagga mussel and the zebra mussel
are only capable of succeeding in waters with seven to eight milligrams of oxygen per liter
(Davis 2012). The zebra mussel (Dreissena polymorpha) has shown to succeed in temperatures
ranging from ten to twenty degrees Celsius, however temperatures above sixteen degrees
Celsius is fatal to the quagga mussel (Dreissena bugensis) (Davis 2012). Both species are also
successful in freshwaters with a conductivity range of sixty to one hundred and ten
microsiemens per centimeter (Claudi & Mackie 2010). The Eurasian mussels require many of
the same environmental conditions. The zebra mussel (Dreissena polymorpha) has been found
to reside in depths from water surfaces down to fifty meters, whereas the quagga mussel
(Dreissena bugensis) has been found to successfully populate in depths more than twice that
Page 6
Lake Berryessa Mussel Plan Analysis 4
depth from surface waters to one hundred and thirty meters (Mills 1995). The success of the
species is dependent on multiple of the environmental factors existing as described. Not only
do both species succeed in a wide range of environmental conditions, they have the capability
to survive outside of water for seven to ten days depending on temperatures (Mangin 2001).
This is thought to be one of the largest factors responsible for the spreading of this invasive
species across the United States.
Given the ability of the Eurasian mussels, they have quickly succeeded across the United States
as an invasive species in our fresh water rivers, lakes, reservoirs, and various creeks. Of the two
species, zebra mussels were the first detected in the United States in 1988 in Lake St. Claire of
the Great Lakes (Mangin 2001). However their population may have started as early as 1986,
going unnoticed (Mills 1995). In less than three years, their population had spread to the
remaining Great Lakes as a thriving species (Mangin 2001).
There is no proven cause of the introduction of the species to the U.S, but it is strongly
speculated that they were unknowingly transported in the ballast of large freight ships or other
international vessels (Mills 1995). The quagga mussel (Dreissena bugensis) was not discovered
until 1991 in the Erie Canal, and found to be cohabiting with the already established zebra
mussel (Dreissena polymorpha) (Mills 1995). Different sources indicate whether the species
were introduced together, or if D. bugensis went unnoticed due to their ability to survive in
deeper waters. Due to their biological characteristics as free swimming larvae and attaching to
hard surfaces as adults, they spread into the Hudson and Mississippi River by 1994 (Mills 1995).
By 2008, they spread across the Western States into various systems in almost every state
(USGS 2013). Their current distribution or live sightings and establishments as of 2012 can be
seen on the map and list of known water systems in Figure 1.2 in Appendix A (USGS 2013).
Since the introduction of Eurasian mussels into the North American water ways, they have been
shown responsible for many significant abiotic and biotic impacts on the different biological
structures (MacIsaac 1996). It is broadly known that the introduction of nonnative species to
any biological system can cause initial or cumulative impacts or alterations on the native
diversity, nutrient cycling, biological functions, energy flow, or chemical composition of the
environment. A study was performed in 1996 by Hugh J. MacIsaac for the Department of
Biological Sciences and Great Lakes Institute for Environmental Research showing the abiotic
and biotic impacts of zebra mussels (Dreissena polymorpha). The analysis show the introduction
and establishment of zebra mussels do have positive and negative effects on the environment
of the Great Lakes. Of the findings, the most pressing of abiotic impacts is the bio fouling on
natural and permanent marine structures as seen in Figure 1.3 and 1.4 in Appendix A (MacIsaac
1996). This includes docks, pilings, buoys, bridges, and water delivery infrastructure. Municipal
and hydroelectric plants are highly vulnerable if water is drawn from a contaminated source
due to veligers being drawn into the systems (MacIsaac 1996). Their establishment may also be
greatly supported and assisted by the intake of raw water which provides a constant
Page 7
Lake Berryessa Mussel Plan Analysis 5
replenishment of sources, blocking of access to predators, and removal of pseudofeces
(MacIsaac 1996).
In addition, the materials used for the infrastructure do have an effect on the magnitude of
establishment, for example: stainless steel, copper, concrete, or galvanized iron. The majority
of the materials listed have been seen to support D. polymorpha establishment (Dillon 2000).
Another abiotic effect is the enhancement of water clarity due to their filter feeding process
(MacIsaac 1996). Although enhanced water clarity may sound like a positive impact, zebra
mussel population biomasses grow at a faster rate than that of zooplankton, and consume a
broader range of particles than zooplankton (MacIsaac 1996). Zebra mussels have been
observed to consume suspended particles ranging from .7 micrometers to 750 micrometers,
and most zooplankton consume particles ranging from 15 to 40 micrometers (Sprung & Rose).
With such a broad palp for consuming suspended particles, the zebra mussels consume and
expel pseudofeces, which may develop as a cumulative negative impact on nutrient cycles
(MacIsaac 1996). Not to mention, is has been found that zebra mussels are correlated with
approximately 90% reductions in microzooplankton and algal biomass, but have only increased
water clarity by about 7%, most likely due to their deposits of feces and pseudofeces (MacIsaac
1996). Phytoplankton biomass is also negatively affected by the presence of zebra mussels.
Studies show phytoplankton biomasses diminish due to individuals being enveloped in
negatively buoyant psedufecal pellets by the mussels (MacIsaac 1996).
These effects are also projected onto a macro scale within the biological community.
Outcompeting of zooplankton may reduce the availability of food for fry of various fish species
(MacIsaac 1996). The increased water clarity and light transmittance may also promote a
change in hydrophytic species diversity (MacIsaac 1996). Certain fish species, some of which are
in Lake Berryessa, are known to exploit the presence of mussels, including sunfish (Lepomis
micropophus), and carp (Cyprinus carpio). With biomagnification, the effects have also been
seen in higher trophic levels, including those of waterfowl (Bruner et al 1994). Several studies
show that given the mussels ability to filter feed many different suspended particles in
combination with the consumption of the mollusk by waterfowl, they serve as a transfer of
contaminants (MacIsaac 1996). The process of consuming contaminants through the
consumption of mussels is correlated to reproductive problems ranging from smaller eggs to
higher embryo mortality rates, and higher rates of nest abandonment (MacIssac 1996).
Waterfowl that consume contaminated mussels have higher concentrations of pesticides and
polychlorinated biphenyl compounds (MacIsaac). The positive and negative effects can be seen
in MacIsaac’s diagram on aquatic systems in Figure 1.5 in Appendix A.
Not only do Eurasian mussels have an effect on aquatic structures but they do pose negative
economic impacts. Since the rapid spread of Eurasian mussel across North America, economic
estimates of impacts were upwards of nearly a billion dollars per year ( Connelly & O’ Neill
Page 8
Lake Berryessa Mussel Plan Analysis 6
2007). A study was performed in 2007 by Connelly and O’Neill on the economic impacts of
zebra mussels on water treatment plants and electrical power facilities; however the estimates
do not include the impacts of cost of recreational boating and fishing. Of the water treatment
facilities surveyed, an average of $30,000 per year is spent on prevention efforts or eradication
efforts towards the mussels (Connelly & O’Neill 2007). Compared to earlier estimates from
1994, the cost had decreased by roughly $14,000 annually. This could be due in part to
development of methods and control procedures that were implicated through trial and error
(Connelly & O’Neill 2007). Through this study, the analysis of expenditures shows the majority
of annual costs were directed towards prevention methods. However, recreational boating,
fishing, local businesses, and environmental impacts were not considered in this evaluation.
This is strictly the cost of maintenance for the water service facilities and the prevention
methods associated directly towards zebra mussels. Given the other factors, the majority of
expenditures may be different for Lake Berryessa.
Lake Berryessa is not a naturally created lake, it was created as a reservoir after the completion
of the Monticello Dam in 1957 (USBR 2011). Originally the valley floor was inhabited by the
Miwok and Patwin tribes; it was then conquered by European settlers and soon thereafter
established as the town of Monticello in Napa County (USBR 2011). Putah Creek was also
dammed in order to flood the valley floor between the Napa hills and the Monticello Dam
(USBR 2013). Lake Berryessa was then flooded, creating a reservoir with a maximum storage
capacity of 1.6 million acre feet of water (USBR 2013). Specifically located at coordinates
38.593880,-122.226952, this is the largest lake in Napa County (USBR 2013). The reservoir
currently serves over 500,000 Solano County residents their drinking and agricultural water
(Solano RCD). The lake also serves hydroelectricity to those of the Northern Bay area near San
Francisco (Davis 2012). The lake also supports wildlife habitat to those native to oak woodland,
chaparral, grassland, and riverine woodland regions (USBR 2013). The reservoir also supports
much aquatic life including species of Brown trout (Salmo trutta), Carp (Cyprinus carpio),
Channel catfish (Ictalurus punctatus), Chinook salmon (Oncorhynchus tshawytscha),
Largemouth bass (Micropterus salmoides), Rainbow trout (Oncorhynchus mykiss), Smallmouth
bass (Micropterus dolomieu), and Spotted bass (Micropterus punctulatus) (USBR 2013).
According to Davis, his data collection and analysis show that Lake Berryessa is biologically
suitable for the establishment of Eurasian mussels. Lake Berryessa on average has Calcium
levels higher than 20 milligrams per liter, with an average pH of 8 to 8.5 (Davis 2012). Since Lake
Berryessa has many deep points, as much as 84 feet, with its large storage capacity, the
temperatures range from 4 degrees Celsius up to 25 degrees Celsius near the shorelines. The
oxygen levels and conductivity also show to be suitable habitat for the two species as seen in
Table 1.1 in Appendix B.
Given that the Eurasian mussels are extremely invasive and are spreading rapidly, the
vulnerability of Lake Berryessa is in question. The biological characteristics of Lake Berryessa
Page 9
Lake Berryessa Mussel Plan Analysis 7
hold it suitable to host either of the two species (Davis 2012). The efforts of various
governmental agencies to prevent this spread will be analyzed before looking at the
management and monitoring methods of Lake Berryessa and neighboring California waters for
effectiveness in preventing such contamination.
Page 10
Lake Berryessa Mussel Plan Analysis 8
CHAPTER II: 100TH MERIDIAN INITIATIVE AND
THE BAY AREA ZEBRA AND QUAGGA MUSSEL
CONSORTIUM PREVENTION PLAN
Since the first discovery of Eurasian mussels in the Great Lakes, a Nonindigenous Aquatic
Nuisance Prevention and Control Act was installed in 1990. In 1996, that act was amended in an
effort to come up with prevention methods to halt the westward spread of the zebra mussels.
It was not until 2001 that a large scale prevention method had been drafted in result of this
amendment. The 100th Meridian Initiative, known as the first strategic approach to prevent the
westward spread of both species of mussels across the 100th Meridian line that basically divides
the U.S mainland in half (Mangin 2001) (Figure 2.1, Appendix A). This initiative included other
aquatic species as well and was meant to assist all water body management agencies and
departments in implementing a stop to the spread. The document was prepared by Susan
Mangin, U.S Fish and Wildlife, and The Division of Fish and Wildlife Management Assistance
under an elected panel of tribal, federal, state, local, private, and commercial representatives.
Within the 100th Meridian Initiative, goals and estimated costs were established. The goals
included public outreach and education on the damages caused by the aquatic invasive,
monitoring methods for early detection, and to initiate a voluntary boat inspection and to
perform voluntary boater surveys. According to the document, “Recreationalists using infested
waters east of the 100th meridian and those trailering boats or personal watercraft from the
east to areas west of the 100th meridian will be targeted”. However, the efforts would not be
put towards boaters in the west that might already be in undetected infested waters. The
Initiative produced a lot of signage along major highways and at different water bodies east of
and at the 100th Meridian line. The highways implemented with the warning signs include US2,
I-94, US12, I-90, I-80, I-70, US54, I-40, I-20, and I-10. Interstate 80 connects to Highway 505 and
113, of which both lead to Lake Berryessa. Radio messages and other means of public outreach
were also to be implemented. Just as Lake Berryessa operates today, trained personnel will be
used to perform the voluntary inspections. The 100th Meridian Initiative acknowledges zebra
mussels may have already been introduced west of their goal point. Therefore it calls for early
detection protocols to be established and determined by those of current management of that
particular water body, and the 100th Meridian will make a list of who is implementing what. The
Initiative also calls for Federal and State agencies to determine which water bodies are at high,
low and medium risk. The evaluation will base its findings off of chemical and physical
characteristics along with recreational use patterns (Mangin 2001). Those that are of high risk
will be monitored frequently by various tests for the presence or absence of zebra mussels.
Rapid response plans of action and teams will be developed by cooperating government
Page 11
Lake Berryessa Mussel Plan Analysis 9
agencies if contamination occurs. The Initiative also suggests the rapid response team should
meet annually to discuss their prevention and monitoring methods for revision and as needed
improvement.
The 100th Meridian Initiative was a great start towards stopping the spread of the aquatic
invasives. However, the efforts are only focused on zebra mussels not zebra and quagga
mussels. Both species have similar characteristics for adaptability to waters in the west. As
presented in earlier text, the quagga mussel is present in waters east of the 100th Meridian and
can exist in the same waters as zebra mussels and will eventually out-compete the zebra
mussel. The advocation for stopping the spread of zebra mussels, which do not adapt to a wider
range of environmental factors such as pH and Calcium levels as quagga mussels, leaves some
bodies of water at higher risk for contamination because they are considered a lower risk due
to the parameters of one species as opposed to consideration for both.
Since the 100th Meridian Initiative, contamination of both species has made their way into
California waterways. The closest known contamination to Lake Berryessa is San Justo
Reservoir. The 100th Meridian Initiative has proven itself ineffective and more stringent
measures were required for California. Since 2009, over 15 waterways in California used for
recreation have been shut down or reduced to restricted access due to infestation or extreme
high risk of contamination of zebra or quagga mussels (Klett 2012). Currently the Bay Area
Consortium Zebra and Quagga Mussel Coordinated Prevention Plan is being developed and
partially implemented (Klett 2012). The Coordinated Prevention Plan set in place a flow chart of
vulnerability assessment to determine which water bodies are at low, medium, and high risk.
Members of the program must abide by the same monitoring and prevention methods
established by the Consortium. The management methods are similar to that of the 100th
Meridian Initiative but spell out specific guidelines. Each member agency will apply the same
standards and consistency in their vessel inspection process to ensure boats from other
agencies within the Consortium do not pose a risk of unknown contamination to others. The
protocol states all boaters go through physical inspections at every access point and the
documented inspections are shared amongst the consortium on a live time database. The
following procedures must also be performed:
The boat is to be determined where it is registered by vessel “CF” identification number, and
the owner of the boat must be present. If the boat is registered out of state, or south of the
Tehachapi Mountains, where infestations exist, the boat will immediately fail the inspection
process and may not launch. If not, the recent locations of launch for that watercraft must be
determined. The same locations of out of state or south of the Tehachapi will fail the
inspection. Confirmation of previous quarantine must be determined and boat must be
inspected to have been properly cleaned, drained, and dried or released from quarantine from
the Department of Fish and Wildlife. Educational material must be provided to boater and
Page 12
Lake Berryessa Mussel Plan Analysis 10
boater must be informed on the dangers of zebra mussels. Finally, the boat must be visually
and manually inspected looking at the deck, hull, bilge, bait wells, motor, trailer, equipment,
water toys, and rear of towing vehicle. All boater information is to be entered into the live
database, including the outcome of each inspection. Watercrafts that are exiting the water
body are to be offered a band and the benefits of banding are to be explained to the boater. As
stated in by the Consortium, “Only consortium members with full physical inspection programs
may place a band on a boat. Members of the consortium will recognize an intact band from
other Consortium members. A vessel entering a vessel inspection station with an intact band
will not need to submit to a full inspection. Instead the inspector shall inspect the band, insure
that it is intact, un-tampered, and is a valid band from a member of the Consortium. If a band is
lost or broken during transport, the vessel is subject to inspection and any applicable inspection
fee. If there are obvious signs that the band has been subject to tampering, the vessel owner /
operator will be given 30-day quarantine, a notice on how to properly clean and dry the boat,
and the information will be entered into the live time database” (Klett 2012). The band more
specifically attaches the boat to the trailer and needs to be removed in order for the boat to
launch again. If the boat launches in other waters that are of high risk, do not have an
inspection program, or even infested it is a simple and effective way for inspectors to
determine if that watercraft needs a full detailed inspection.
There have been no known additional contaminations of water bodies since the contamination
of San Justo Reservoir. The Coordinated Prevention Plan is proving itself to be much more
effective than the 100th Meridian Initiative, for those that are members. The program is
organized, and tightly knit which leaves little room for unknown factors. The demand for a
streamlined protocol ensures the quality of the inspections and assurance of no contamination
from all other bodies of water. However, other reservoirs still remain at risks that are not a part
of the consortium or do not practice similar methods of prevention, one of which is Lake
Berryessa.
Page 13
Lake Berryessa Mussel Plan Analysis 11
CHAPTER III: SAN JUSTO RESERVOIR CASE STUDY
The Eurasian mussels have swept across the United States in only ten years. They have
transferred from water body to water body by hitchhiking onto different vessels, and in some
cases aquatic industrial equipment. The mussels are currently in California waters, but not all.
The closest known contamination is San Justo reservoir. An interview of the Deputy District
Engineer from San Benito County Water District, Mr. Dale Rosskamp, PE, was interviewed
regarding the contamination and subsequent challenges they face today.
According to Mr. Rosskamp, the economic impacts of the infestation of zebra mussels
(Dreissena polymorpha) are difficult to evaluate and quantify. Impacts that have not been
considered in previous studies are the indirect impacts on local businesses within the area. This
includes private marina’s that no longer accept boat launches, and for San Benito County
specifically, the bait shops and marina stores within the local towns.
San Justo Reservoir is located in San Benito County and fed by the San Luis Reservoir, which
also serves Santa Clara County. Similar to Lake Berryessa, San Justo Reservoir is managed by the
USBR, but the water is controlled by the San Benito Water District. The reservoir is smaller than
Lake Berryessa holding only 10,308 acre-feet at full capacity, with a circumference of about
21,500 feet. It only serves agricultural water, and was at one time open to the public for
recreational use including boating, fishing, and picnics. The reservoir was contaminated with
zebra mussels and the invasives were not discovered until 2008 (Rosskamp 2013). Due to the
Calcium and pH levels, San Justo Reservoir was susceptible for invasion from either species.
Although the 100th Meridian Initiative was developed, no prevention methods were being
practiced at the reservoir previous to the time of discovery. Now that the issue is increasingly
presenting itself, a team of responsible agencies are in charge of tackling this rapidly growing
devastation. The responsible agencies include the Bureau of Reclamation, San Benito County
Water District, Santa Clara Valley Water District, the California Department of Boating and
Waterways, and California State Parks (Rosskamp 2013).
The reservoir had also not been previously analyzed for level of risk of contamination
(Rosskamp 2013). Currently, the reservoir is contaminated from the water’s surface of the
shoreline down to thirty feet deep. Traditional methods have been implemented since
contamination including dredging, and regular maintenance is practiced to scrape the shores of
the zebra mussel shells. Rosskamp claims the current situation does not pose a threat to the
water conveyance infrastructure of the reservoir due to their hasty response and the
cooperation and assistance of other agencies. However, the Hollister Conduit and Distribution
System are already infested. In response to the infestation, the San Benito Water District,
Page 14
Lake Berryessa Mussel Plan Analysis 12
federal, state, and local government agencies have been developing response plans against the
zebra mussels.
San Benito County Water District and other concerned local agencies are currently practicing
eradication efforts which include chemical treatments that are commonly used back east where
the mussels have resided for a longer period of time. In an effort to prevent further
contamination into other vital water conveyance systems, San Benito County Water District has
developed an alternative and innovative method.
This method consists of frequently and rapidly changing the water levels by emptying and filling
the reservoir to dry out what they call “the bath tub ring”. Since the reservoir is only
contaminated in the first thirty foot depths, they drain the reservoir to expose the zebra
mussels for a period of time to try and kill them, if not at least slow their reproduction rate
considering their resilience, and repeat the method constantly. Rosskamp noted this method
has only reduced their reproductive density, so far. Another decontamination test was
performed using San Justo raw water. This water contained various sizes of the mussels,
including veligers. They were put into different tanks with different pH and Calcium levels. In all
treatments, the adults remained firmly clumped and had to be separated for counting
(Rosskamp 2013).
Rosskamp believes it is not the motorized boaters that are the issue of the rapid spread of
contamination. He stated it is the canoes and kayaks that “are the biggest problem, because
people with motorized boats tend to clean and dry their boats after being in the water,
whereas kayaks and canoes do not. They launch, pick up, and go”. He had also mentioned
another problem is older fishing boats that are worn and uncared for. Two factors of older
boats put them at higher risk for carrying the unwanted hitchhikers than other watercrafts, one
is their surface is usually pitted with a worn clear coat and sometimes surface rust making it
easier for smaller Eurasian mussels to attach to. The second, according to Rosskamp, is that the
boaters tend to not care for their boats and do not drain and dry them, leaving the watercrafts
to potentially hold contaminated water consisting of the Eurasian mussels.
Contrary to what Rosskamp had stated about kayaks and canoes, the USBR and San Benito
Water District believe the contamination was due to a USBR project known as the San Felipe
Project. This is a part of the state water project which is also known as the Central Valley
Project. This water system carries Northern California waters down through a series of different
networks pipelines and canals to Southern California (Rosskamp 2013). Rosskamp claims the
mussels were introduced by equipment owned by the Bureau for construction of the project.
Regardless of the source of contamination, it happened even with great concern and an
attempt with the 100th Meridian Initiative.
Page 15
Lake Berryessa Mussel Plan Analysis 13
San Justo Reservoir is only three hours south from Lake Berryessa. The lack of priority and
reality of risk of contamination led to the closure of a reservoir that was once open for
recreation. Now the reservoir is closed to the public, local businesses are suffering with the lack
of visitors, and the Water District and Bureau are spending more than ever on testing and
maintenance of different eradication efforts.
Page 16
Lake Berryessa Mussel Plan Analysis 14
CHAPTER IV: HYPOTHESIS AND DATA TO BE
ANALYZED
The Lake Berryessa Mussel Plan incorporates a mixture of monthly plankton tows and
processing of the plankton samples for detection of the Eurasian mussels, and monthly
examination of deployed artificial substrates to look for mussel attachments (Davis 2012). The
monthly examination of deployed artificial substrates also includes visual examination of
different structures in Lake Berryessa and the infrastructure surrounding it including canals and
buoys (Davis 2012). The plan also includes on-site education and boat inspections performed by
interns of the Solano County Water Agency, and rangers of the Bureau of Reclamation (Davis
2012). All of the individuals performing the on-site education are trained as certified
Dockwalkers through the Department of Boating and Waterways and Level I Watercraft
Inspectors through the Bureau of Reclamation (Davis 2013). The trained individuals educate
boaters entering Capell Cove Memorial Day Weekend though Labor Day weekend, Fridays
through Sundays about the dangers of the invasive species, where they are located, and how
they can be accidentally transported. A quick inspection is also performed on each boat using a
self-reporting form for the boaters, and a visual walk around. If a high risk boat is encountered,
an order of protocol is followed by contacting a specific chain of command consisting of local
agency authorities. Signage is posted through the Program focusing on education of the
Eurasian mussels at various locations throughout Lake Berryessa. Through the Program, off-site
education is also implemented with help of the Lake Berryessa Watershed Partnership (Davis
2012).
Within this process, the day to day operation of Capell Cove consist of the gates opening early
in the morning before the sun rises for boaters, and unmonitored or inspected boats entering
the waters from Monday to Thursday, only relying on the single sign that is posted at the launch
ramp . A drop box has been installed with the self-reporting inspection form for boaters to fill
out and place on their dash before proceeding to launch at the unattended ramp, however this
is not very effective. The boaters do not always fill out the forms. During the summer months
from approximately May to September, Friday through Sunday, a trained ranger is on site
around 7:00 am to educate boaters and visually inspect the boat along with filing out the self-
reporting survey for the boater to determine their risk of transporting the Eurasian mussels
(Appendix C). A team of two trained interns will then take over the shift and perform the same
duties as the ranger from approximately 9:00 am to 5:00 pm. In addition to the same duties as
the ranger; they will keep track of the type of traffic entering Capell Cove, including returning
visitors and type of boats on an hourly basis. One intern will also perform an optional
questionnaire with the boaters to further educate them on Lake Berryessa, current boating
laws, and water quality issues. However, during the time that trained personnel is not on site,
Page 17
Lake Berryessa Mussel Plan Analysis 15
the only monitoring that is being performed is done so by a traffic counter that records the
number of axles entering Capell Cove.
The Bureau of Reclamation monitors this traffic counter. This traffic counter records the
number of axles that cross over the counter and continuously counts until it is either reset
manually or from the battery dying. Approximately each week, a USBR ranger will record the
traffic counter. According to USBR the numbers are unreliable and not always recorded after
exactly 7 days. The daily maintenance traffic, sheriff patrol traffic, and watercraft inspection
personnel traffic on the weekend is not factored into the recordings, but is a part of it. The
traffic counter is recorded continuously throughout the year ranging from 4 days to 21 days
between each reading.
The hypothesis to be tested is as follows: The current Lake Berryessa Mussel Plan as regards to
on-site education and boat inspections at Lake Berryessa is ineffective. Therefore, Lake
Berryessa is at risk and will eventually become contaminated with zebra and or quagga mussels.
The null-hypothesis is as follows: The current Lake Berryessa Mussel Plan as regards to on-site
education and boat inspections at Lake Berryessa is effective. Therefore, Lake Berryessa is at no
risk and will not become contaminated with zebra and or quagga mussels, so long as the plan
remains at current status.
The criterion for rejecting the null hypothesis is if the number of boats un-inspected is greater
than 50% of the total number of boats entering Lake Berryessa through Capell Cove in a year. In
addition, there must be evidence that high risk boats of potential contamination are entering
Lake Berryessa’s waters.
The data to be analyzed will look at the traffic counter data that counts axles provided by the
Bureau of Reclamation, and the data collected on site from the Solano County Water Agency
interns from the summer of 2013. In order to compare and analyze the data, the traffic counter
must be calibrated for the range of error. The data to be analyzed will determine the amount of
traffic that is not inspected through Capell Cove launch ramp with the self-reporting form, and
projecting the amount of high risk potentially contaminated boats going un-inspected based on
the amount of potentially contaminated boats intercepted by the Solano County Water Agency
interns. This will be done by the calibration of the traffic counter though on site recordings of
entering traffic and the traffic counter reading after each vehicle crosses the traffic counter.
The number of axles per actual vehicle and vehicle towing a boat can then be closely estimated
through this method of calibration. The amount of employee traffic including patrol,
maintenance, and employee rounds will also be subtracted from the readings. The data
collected from the Solano County Water Agency interns will then be subtracted from that
calculation which they collected Fridays through Sundays. This will then unveil the estimated
amount of un-inspected boat launches Mondays through Thursdays and be presented in a bar
Page 18
Lake Berryessa Mussel Plan Analysis 16
graph to compare daily weekday boat launches to daily weekend boat launches at Capell Cove
between May and September. The amount of annual uninspected boat launches at Capell Cove
will be projected based on the remaining traffic counter data available. Then, the number of
high risk potentially contaminated boats during that uninspected time will be calculated with a
simple ratio and projection. The data will be compared to launch patterns at other launch sites
at Lake Berryessa including Markley Cove, Steel Canyon Park, and Pleasure Cove. The Solano
County Water Agency interns also recorded the amount of hourly traffic at Capell Cove which
will be analyzed through a bar graph as well.
Page 19
Lake Berryessa Mussel Plan Analysis 17
CHAPTER V: DATA ANALYSIS
On November 2, 2013, the traffic counter was read before any boat had arrived at
approximately 4:15 am. The traffic counter reading was recorded after every vehicle would
cross the traffic counter for approximately 6 hours until traffic slowed down and it was
determined the data recorded was sufficient for calibration.
With the single vehicular traffic ratio compared to the boater traffic, an estimated ratio of 7% of
the traffic is visiting vehicles without trailers. The amount of axles crossing the traffic counter
was also calibrated against the data collected over the summer weekends (Friday-Sunday) by
interns and an estimate of 2.23 axle counts occur for every single boat towed by a vehicle, and
1.0 axle count for every single vehicle without a trailer. This estimate includes boats of single
axle and double axle trailers. The amount of USBR workers, maintenance, and law enforcement
patrol was estimated at 6 entrances per day during the off season (January 1- April 29). The
amount of USBR workers, maintenance, and law enforcement patrol was estimated at 10
entrances per day during the high season (April 30- September 2). The remaining dates are
considered off season, but the data is only available from February to April for Capell Cove
during 2012. With the factors established in order to estimate weekday boat launches, the
calibrated axle count data was converted to units of boats and vehicles, which was then
analyzed with the data collected by interns during the summer weekends (Friday-Sunday). As
seen in Table 5.1, Appendix B, the traffic counter data was collected at an array of different
times spanning from 4 days to 21 days year to date. The number of boats documented on the
weekends is assumed at collection of 85% of boats launching during the weekends, meaning
each day’s worth of boats documented was multiplied by 1.176. This assumption is based off of
experience and the fact that the gates are open before and after interns and rangers are on site
to inspect boats and collect data. Once the traffic counter numbers had been converted to
number of boats with the 2.23 calibration, the numbers of boats documented on the weekends
during the summer were subtracted. This leaves the total number of boats launching during the
weekdays for the summer. The number of boats launching during the weekdays was then
divided by the number of weekdays the traffic counter collected data, giving the number of
boats launching per weekday during each time frame the traffic counter data was collected.
Some numbers were not accurate due to the battery dying on the traffic counter, or other
unknown errors. To normalize the data, each month’s daily weekday and weekend traffic
numbers were averaged in order to see the trends. Data was also collected by the Bureau of
Reclamation for four other launch sites including Markley Cove, Pleasure Cove, and Steel
Canyon Park. The data is recorded by the concessionaires at those launch sites and for each site
the month’s daily weekday and weekend boat launches was also averaged for comparison. The
total boat launches for each of the four sites was also broken up into percentages per site.
Page 20
Lake Berryessa Mussel Plan Analysis 18
As seen in Graph 5.2, Appendix B, Capell Cove makes up 35.14% of the total launches amongst
the four sites.
Looking at Capell Cove’s average daily traffic, the lowest number of weekday launches is seen in
February and May with approximately 4 launches per day. The highest number of weekday
launches is in July with an average of 34. The lowest number of weekend launches is seen in
May with an average of 73 launches per day. As stated previously, data is not available in
January, September, October, November, and December. The highest number of average
weekend launches at Capell Cove is in June with 90 launches per day. This graph can be seen in
Graph 5.3, Appendix B. The averages for weekday and weekend daily launches for Markley
Cove shows to be higher than those of Capell Cove which can also be seen in Graph 5.4,
Appendix B. Steel Canyon Park shows lower numbers than that of Capell Cove (Graph 5.5,
Appendix B), and Pleasure Cove with the least amount of boat launches out of the four launch
sites (Graph 5.6, Appendix B).
The average weekend boat launches per hour was also calculated using data collected from
interns in 2012 and 2013. The available data was collected from 7:00 am until 6:00 pm. As seen
in Graph 5.7, Appendix B, the peak of the day is between 10:00 am and 11:00 am with an
average of 17 boats launching in that one hour. After 11:00, the number of boats launching
decreases by 1.3985 boats per hour.
Finally, given the total number of boats launching at Capell Cove with the methods as stated
above, the proportion of inspected boats (each boat documented by interns is inspected)
versus non-inspected boats was calculated. The pie chart shows 35% of boats throughout the
year are inspected and 65% of boats are launching with no inspection (Graph 5.8, Appendix B).
Of those boats inspected during the summer weekends, the original inspection forms show 7
out of 3357 boats were potentially contaminated (Table 5.9 Appendix B). That .21% of
potentially contaminated boats projected on the amount of boats that are not inspected shows
13 out of 6352 boats could potentially be contaminated with zebra and or quagga mussels. The
estimated 13 boats are launching without inspection.
Based on the experience from USBR rangers, the traffic counter placed at Capell Cove does
contain some errors, and the amount of employee traffic is an average based on their normal
activity. Changes in that assumption have occurred over 2013 given a unique situation or
emergency that requires a higher amount of employee, patrol, and or maintenance traffic.
Some errors were seen in the documentation by interns compared to their original inspection
forms they filled out. However, not all original inspection forms were available so the entries
into their data form were used instead of the original documents in these calculations for
consistency.
Page 21
Lake Berryessa Mussel Plan Analysis 19
CHAPTER VI: INTERPRETATION AND
SIGNIFICANCE OF DATA
The data calculated for the boat launches at Capell Cove shows more than 50% of the boats
launching in the year are not being inspected, or even informed on the dangers of zebra and
quagga mussel infestations. Calculations showing 65% of boats are not being inspected meets
one of two criterions to reject the null hypothesis. Of those boats launching un-inspected and
un-informed, 13 of those boats are launching as high risk and potentially contaminated. This
calculation meets the second of criterion to reject the null hypothesis. Although only .21% of
the total boats launching at Capell Cove are at high risk, it only takes one exposure for either
species to establish. The summer of 2013 was the first year certified inspectors were stationed
at Capell Cove past 12:00 pm. The interns from the summer of 2012 were scheduled until 6:00
pm on a handful of days in order to see what the launching traffic is like. The data collected by
the Solano County Water Agency interns clearly shows boats have been launching Friday
through Sunday, before and after rangers and interns are scheduled to inspect boats. Capell
Cove is also the only free launch site at Lake Berryessa. The fact of not having to pay a launch
fee might entice new boaters or boaters who have never been to Lake Berryessa to launch
there (un-inspected). Looking at the boat launching trends at the other three launch sites, it can
be assumed there are boats launching where monthly data was not available for Capell Cove.
Given the assumption only 85% of boats were being inspected and informed on the weekends,
the amount of high risk and potentially contaminated boats going un-inspected could be higher.
Also, looking at the data for Steel Canyon Park, 2013 was a unique year for them due to being
closed from January to May. Under normal conditions, their portion of total boaters will
increase in 2014, and the percentage of Capell Cove, Markley Cove, and Pleasure Cove will
decrease.
Although 64.85% of the boats recorded in this study are launching through manned
concessionaires, their inspection process is no more than what is performed at Capell Cove on
the summer weekends. All launch sites use the same self-reporting form and signage provided
by the Bureau of Reclamation and Solano County Water Agency. However, Markley Cove does
not use the forms properly; they cut off the educational portion of the self-reporting forms only
leaving the bottom for a signature stating the visitor’s boat is not infested.
Based on the biological characteristics of Lake Berryessa as described previously, Lake Berryessa
is very suitable for zebra or quagga mussels to establish and infest. Accepting the hypothesis:
The current Lake Berryessa Mussel Plan as regards on-site education and boat inspections at
Lake Berryessa is ineffective. Therefore, Lake Berryessa is at risk and will eventually become
contaminated with zebra and or quagga mussels.
Page 22
Lake Berryessa Mussel Plan Analysis 20
CHAPTER VII: CONCLUSIONS
All criterion have been met, therefore the null hypothesis is rejected. The hypothesis is
accepted as follows: The current Lake Berryessa Mussel Plan as regards Lake Berryessa is
ineffective. Therefore, Lake Berryessa is at risk and will eventually become contaminated with
zebra (Dreissena polymorpha) and or quagga (Dreissena bugensis) mussels. Based on the data,
not all of the traffic at Capell Cove is inspected. It is only documented by a traffic counter at the
entrance to the launch site. About 65% of the boats launching at Capell Cove are doing so un-
inspected, and 13 of those boats are launching at high risk and potentially contaminated
(Appendix C). Over half is a significant number to be un-inspected. An infested boat can arrive
at any time, a likely possibility based on this past summer’s inspections. If a contaminated boat
launches at Capell Cove, the mussels will establish and infest the aquatic system. Based on the
biological characteristics of Lake Berryessa as stated in the Background, the lake is suitable
habitat for both species to thrive. Given the fact that one mussel can produce up to one million
eggs in a year, contamination at one launch site poses a threat to the entire lake. The likelihood
of contamination of either of the two species is realistic given they have spread across the
United States in approximately 10 years. The cause of the spread is due to recreational boaters
going from one lake to another and the species ability to attach to hard surfaces and survive
out of water for over a week, or floating veligers in the bilge compartment of boats which hold
water. Infested lakes are near Lake Berryessa including waters in Southern California and
Arizona. Some of those lakes do not require decontamination of boats after exiting. It has also
been noted by an anonymous boater at Lake Berryessa that state border patrol did not inspect
his boat for invasive species or standing water. This makes the transfer of the invasives possible
and plausible. Given all of the stated factors into consideration, the null hypothesis is rejected,
and the hypothesis is accepted.
The exposure of Lake Berryessa to Eurasian mussels could happen tomorrow, in the next year,
or a couple of years. However, there is a 65% chance when a potentially contaminated boat
does arrive that there will not be any staff on site to inspect that boat or to educate that boater
on the dangers of the zebra and quagga mussels.
Page 23
Lake Berryessa Mussel Plan Analysis 21
CHAPTER VIII: IMPLICATIONS
Since San Justo is the closest contaminated reservoir to Lake Berryessa and the biology of the
two reservoirs is similar, this contamination should serve as a warning indicator that Lake
Berryessa is at the same risk as San Justo was. The traffic analysis of how many boats are
launching, how many are not inspected, and how many are at high risk and potentially
contaminated should also serve as a strong indicator that more stringent measures need to be
implemented.
The original inspection forms filled out by 2013 interns indicates the training needs to be
stronger. The high risk boats in the original inspection forms were not inspected by the interns
and were not marked as needing a full inspection. Therefore there are no records of following
the appropriate protocol for that encounter. The previous launching locations, registration
number, or place of residence should all serve as indicators for a needed full inspection if the
content permits. For example, three of the watercrafts were registered in Arizona. This is a
known area of contaminated reservoirs and lakes that do not provide a decontamination
station after recreational use. Two of those Arizona registered watercrafts were jet skis and
launching together. Two of the other watercrafts that should have been subject to a full
inspection were from Southern California residencies near waters that are known to be
contaminated with zebra mussels. Another inspection that was also not subject to a full
inspection was a boat without the state of registration documented that last launched in Lake
Havasu. This lake is known to be open for recreation and infested with zebra mussels. Although
all rangers with the Bureau of Reclamation and interns with Solano County Water Agency go
through certification to become Level 1 Certified Watercraft Inspectors, not one boat has been
documented to be submitted to a full inspection in the summer of 2013. The boater simply
passed through the normal inspection process of visual checks and the self-reporting form. The
boaters were asked where they last launched, where they live, and their registration (CF
number) is documented. The training calls for inspectors to notice signs of high risk boats and
then proceed with a full inspection of looking in live wells and bilge compartments for standing
water, or rough surfaces on the boat and trailer. Water samples should be obtained along with
personal identification information of the boat owner, and authorities notified. The training
period needs to be extended and the importance of not spreading invasive species needs to be
stressed further to those who will be inspecting the boats on a regular basis.
A training manual was created in 2013 for the upcoming interns, although it could use revisions,
the protocol for boat inspections are available in that document. Those who will be performing
the regular inspections should be required to go through their training manual and be tested on
key concepts and steps regarding zebra and quagga mussel facts and high risk signs. Interns
from the summer of 2013 are still currently with Solano County Water Agency, and they are the
Page 24
Lake Berryessa Mussel Plan Analysis 22
most experienced in performing the job and should play a key role in the training and guidance
of new interns throughout the upcoming summer. However, the data clearly shows having
diligent inspectors perform their duties on the summer weekends is not enough. With 65% of
the boats not being documented or inspected, a great threat of infestation is posed on Lake
Berryessa. The estimated cost provided by Solano County Water Agency for 5.5 interns is about
$47,520.00, each at $16.00 per hour and working 30 hours per week on Friday, Saturday, and
Sunday. They will work 40 hours per week during summer holidays. If a team of two interns
were to be implemented at Capell Cove inspecting boats Monday through Thursdays at the
same rate, but 8 hours a day, the additional costs would only be $19,584.00. This
implementation would reduce the amount of boats launching un-inspected from 65% to 43%,
assuming the inspections are performed from Memorial Day weekend through Labor Day
weekend.
An interview with Ken Davis on this topic is as stated: “I think attitude is paramount on the part
of all participants in the program: the Bureau, the inspectors, the sheriffs, etc. We need better
training on the USBR forms to make them more track-able, some oversight (with interns) at the
lake on a regular basis, continuing education such as a Facebook Group, and required
recertification every two years for interns and concessionaires. In other words, more interns
are not going to help if their attitudes are negative or wanting.” This brings the idea to light that
the program is not exactly defined regarding mussel inspections. The interns began as water
quality education interns, and the mussel inspections have surfaced slowly as a priority of their
duties. It simply has not been defined as an urgent priority of their tasks. Specialty management
for boat inspections should be implemented in the Lake Berryessa Mussel Plan in addition to
the specialty management of the water quality education that is already present. This is a light
suggestion that may help streamline and really define the objectives of having interns out at
Lake Berryessa working with the public as a whole.
Due to the availability of data from the traffic counter, the amount of boats that could be
inspected during the weekends of the remaining months cannot be estimated. The estimated
additional cost to implement inspections by a team of two interns on Saturdays and Sundays in
the remaining months is $8,704.00. During the summer months, when interns and rangers are
inspecting boats 7 days a week, an idea from the Bay Area Zebra and Quagga Mussel
Consortium Prevention Plan should be considered. The operations of the plan include tagging
boats as they exit their reservoirs and lakes. The unique tags attach the boat to the trailer, and
must be cut in order to re-launch. With this, it is easy to tell if a returning visitor has launched
their boat in unknown waters or if the boater last launched in Lake Berryessa. For Solano
County Water Agency, the tags can most likely be large zip ties with a unique sticker to secure
around the zip tie for identification. The tags can either be handed to visitors before they
launch in good faith or after they exit the waters with the incentive of not being subject to the
full inspection upon their return. The materials will not be a substantial cost. Such an
Page 25
Lake Berryessa Mussel Plan Analysis 23
implementation would be a great step in the right direction towards reducing the risk of
infestation.
Due to the lack of data and what has been estimated; a further traffic study at Capell Cove
should also be performed. In order to do this a more reliable traffic counter should be installed
in order to see daily traffic counts. With those resources, the percent of boats going un-
inspected can be more precisely calculated. Regarding the other launch sites, it would be
appropriate for the concessionaires to perform similar inspections of each watercraft, currently
inspections are not provided and they rely on signage to prevent contaminated boats from
launching. Summer of 2013 was the first year Solano County Water Agency interns were
stationed at the other launch sites for inspections Fridays through Sundays. However, each site
should inspect their boats during the week when the interns are not present. Each watercraft
already checks in and pays a launch fee; therefore using the tagging system would not be too
disruptive to the flow of traffic and business. The Solano County Water Agency should provide
the materials for this tagging system to the concessionaires. Employees of the other launch
sites should also become Level 1 Certified Watercraft Inspectors as well. Putah Creek Park, a
launch site not analyzed in this study is the only concessionaires with certified employees (Davis
2013). If a tagging system is not used, the signs of a high risk boat will be presented to them as
they pay to launch and turn in their self-reporting form. This idea can be easily implemented by
Markley Cove if they did not tamper with the self-reporting forms. Steel Canyon Park and
Pleasure Cove can regulate boats launching in the same operation and educate boaters with
their certifications in the process. In order to see which launch sites are accurately the most
vulnerable (highest traffic), Steel Canyon Park should be required to report daily launches
opposed to monthly totals.
If all the launch sites were certified to inspect their boats and did so diligently, it would be
useful to have a live reporting data form that is viewed and shared by all the launch sites. Much
like what the Consortium operates; a live data sheet with all documented launching boats or
denied boats will prevent the risk of a boater being denied to launch at one site and going on to
the next. Although this would be a great solution, cell phone and data usage is not available in
some locations around the lake. Radios would also be an effective form of communication
between all launches sites and a great alternative. A Facebook page for boat inspectors is in the
works and very useful for communication for many resorts (Davis 2013).
Finally, if all the suggested protocols were set forth, it is likely boats will be deemed infested
and advised not to launch in Lake Berryessa. Due to the unique position of Lake Berryessa and
its history, the efforts put forth in prevention do not grant interns the jurisdiction to legally
deny boats from entering Lake Berryessa. This is a highly sensitive issue between many of the
stakeholders, and not for the breadth of this report. Regardless, if those performing the
inspections had legal assistance on site or jurisdiction to do so, it would only enhance the
Page 26
Lake Berryessa Mussel Plan Analysis 24
effectiveness of the efforts. Currently very high advisory can only be performed, and
jurisdictional personnel notified.
On another note, if a decontamination station were installed at Capell Cove boaters could
pressure wash their boat with high heat in order to eliminate any hitchhiking invasives and
might be less discouraged for attempting to launch again after the boat has been properly dried
out. Not only would a decontamination station be useful for on-site emergencies, it will resolve
the issue of a denied boat potentially launching in a nearby lake or reservoir.
There are many possibilities for decreasing the risk of contamination; it is only a matter of
initiative, cooperation, and costs. The suggestions provided are with a modest budget in
consideration. The data analyzed in this study presents itself as a serious indicator for a
devastating threat to Lake Berryessa. The time is now to initiate new protocols in order to
decrease the risk of zebra or quagga mussel infestation. The repercussions are very costly and
devastating to the biology, local businesses, annual boaters, and the people who depend on it
as a source of drinking water.
Page 27
Lake Berryessa Mussel Plan Analysis 25
REFERENCES
Bruner, K. A., S. W. Fisher, and P. F. Landrum. 1994. The role of the zebra mussel in
contaminant cycling: II. Zebra mussel contaminant accumulation from algae and suspended
particles, and transfer to the benthic invertebrate, Gammarus fasciatus. J. Great Lakes Res.
20:735-750.
Butler, M. K. 2013. Keep Berryessa Clean (pamphlet). Resource Conservation Agency. Solano
Resource Conservation District. Dixon, California, USA.
Claudi, R, G. Mackie. 1994. Practical manual for zebra mussel monitoring and control. CRC
Press, Boca Raton, Florida, USA.
Connelly, N. A., C. O’Neill, B. Knuth, T. Brown. 2007. Economic Impacts of Zebra Mussels on
Drinking Water Treatment and Electric Power Generation Facilities. Environ Manage. 40: 105-
112.
Davis, K. W. Early Detection & Education Plan for Eurasian Mussels (Solano Project).2012.
Solano County Water Agency. Vacaville, California, USA.
Davis, K. W. Personal Interview with Ken W. Davis, Aquatic Biologist/ Wildlife Photojournalist.
(Creekman.com). Creekman, Sacramento, California, USA. 12-10-13. 1:45 pm.
Dillon, R. T. 2000. The Ecology of Freshwater Molluscs. Cambridge University Press, New
York, New York, USA.
Klett, K. Santa Clara County Parks and Recreation Department. 2012. Bay Area Consortium
Zebra and Quagga Mussel Coordinated Prevention Plan. Los Gatos, California, USA.
MacIsaac, H. J. 1996. Potential Abiotic and Biotic Impacts of Zebra Mussels on the Inland
Waters of North America. Amer Zool, 36:287-299.
Mangin, S. The 100th Meridian Initiative: A Strategic Approach to Prevent the Westward Spread
of Zebra Mussels and Other Aquatic Nuisance Species. 2001. U.S Department of the Interior,
U.S Fish and Wildlife. Washington, DC, USA.
Mills, E. L., G. Rosenberg, A. Spidle, M. Ludyanskiy, Y. Pligin, B. May. 1995. A Review of the
Biology and Ecology of the Quagga Mussel (Dreissena bugensis), a Second Species of
Freshwater Dreissenid Introduced to North America. Amer Zool, 36: 271-286.
Rosskamp, D. F. 2013. Phone Interview with Dale. F. Rosskamp, Deputy District Engineer (20
Minutes). San Benito County Water District, Hollister, California, USA. 10-25-13. 3:03 pm.
Sprung, M., U. Rose. 1988. Influence of food size and food quantity on the feeding of the mussel
Dreissena polymorpha. Oecologia 77: 526-532.
Page 28
Lake Berryessa Mussel Plan Analysis 26
The National Atlas of the United States of America. Zebra Mussels. 2009. Nationalatlas.gov.
U.S Department of the Interior. Bureau of Reclamation. 2013. About Lake Berryessa. Central
California Area Office, Lake Berryessa, Napa, USA.
U.S Department of the Interior. Bureau of Reclamation. 2011. Early History of Lake Berryessa.
Central California Area Office, Lake Berryessa, Napa, USA.
WoRMS. Mollusca. 2013 Accessed through: World Register of Marine Species at
http://www.marinespecies.org.
Figure 1.1 Provided By: Herbert et al. 1989, Marsden et al. 1995
Figure 1.2 Provided By: U.S Geological Survey, Nonindigenous Aquatic Species Database
Figure 1.3 Provided By: J. Thompson, F. Parchaso, A. Alpine, J. Cloern, B. Cole, O. Mace, J.
Edmunds, J. Baylosis, S. Luoma, F. Nichols of U.S Geological Survey.
Figure 1.4 Provided By: Peptide Technologies, Inc.
Figure 1.5 Provided By: MacIsaac, H. J. 1996. Potential Abiotic and Biotic Impacts of Zebra
Mussels on the Inland Waters of North America. Amer Zool, 36:287-299.
Figure 2.1 Provided By: Mangin, S. The 100th Meridian Initiative: A Strategic Approach to
Prevent the Westward Spread of Zebra Mussels and Other Aquatic Nuisance Species. 2001. U.S
Department of the Interior, U.S Fish and Wildlife. Washington, DC, USA.
Page 29
APPENDIX A
FIGURES
Page 30
Lake Berryessa Mussel Plan Analysis 27
FIGURE 1.1 ZEBRA AND QUAGGA MUSSEL CHARACTERISTICS
Page 31
Lake Berryessa Mussel Plan Analysis 28
FIGURE 1.2 ZEBRA AND QUAGGA MUSSEL CURRENT INFESTATIONS
Page 32
Lake Berryessa Mussel Plan Analysis 29
FIGURE 1.3 ZEBRA MUSSEL ATTACHED TO CRAYFISH
FIGURE 1.4 QUAGGA MUSSEL FOULING PIPES
Page 33
Lake Berryessa Mussel Plan Analysis 30
FIGURE 1.5 MACISAAC SCHEMATIC OF IMPACTS OF DREISSENA POLYMORPHA
Page 34
Lake Berryessa Mussel Plan Analysis 31
FIGURE 2.1 100TH MERIDIAN INITIATIVE
Page 35
APPENDIX B
TABLES AND GRAPHS
Page 36
Lake Berryessa Mussel Plan Analysis 32
TABLE 1.1 ZEBRA AND QUAGGA MUSSEL IDEAL PARAMETERS
Page 37
Lake Berryessa Mussel Plan Analysis 33
TABLE 5.1 DATA ANALYSIS FROM TRAFFIC COUNTER
Date from Date to:
2/5/2013 2/11/2013
2/12/2013 2/18/2013
2/19/2013 2/25/2013
2/26/2013 3/4/2013
3/5/2013 3/11/2013
3/12/2013 3/18/2013
3/19/2013 3/25/2013
3/26/2013 4/1/2013
4/2/2013 4/10/2013
4/11/2013 4/14/2013
4/15/2013 4/21/2013
4/22/2013 4/28/2013
4/29/2013 5/5/2013
5/6/2013 5/27/2013
5/28/2013 6/3/2013
6/4/2013 6/16/2013
6/17/2013 6/23/2013
6/24/2013 6/30/2013
7/1/2013 7/4/2013
7/5/2013 7/8/2013
7/9/2013 7/14/2013
7/15/2013 7/28/2013
7/29/2013 8/4/2013
8/5/2013 8/11/2013
8/12/2013 8/18/2013
8/19/2013 8/29/2013
8/30/2013 9/2/2013
Page 38
Lake Berryessa Mussel Plan Analysis 34
GRAPH 5.2 TOTAL BOAT LAUNCHES BETWEEN FOUR LAUNCH SITES
Page 39
Lake Berryessa Mussel Plan Analysis 35
GRAPH 5.3 AVERAGE DAILY LAUNCHES AT CAPELL COVE
Page 40
Lake Berryessa Mussel Plan Analysis 36
GRAPH 5.4 AVERAGE DAILY LAUNCHES AT MARKLEY COVE
Page 41
Lake Berryessa Mussel Plan Analysis 37
GRAPH 5.5 AVERAGE DAILY LAUNCHES AT STEEL CANYON PARK
Page 42
Lake Berryessa Mussel Plan Analysis 38
GRAPH 5.6 AVERAGE DAILY LAUNCHES AT PLEASURE COVE
Page 43
Lake Berryessa Mussel Plan Analysis 39
GRAPH 5.7 AVERAGE WEEKEND LAUNCHES PER HOUR AT CAPELL COVE
Page 44
Lake Berryessa Mussel Plan Analysis 40
GRAPH 5.8 AMOUNT OF BOATS NOT INSPECTED
Page 45
Lake Berryessa Mussel Plan Analysis 41
TABLE 5.9 AMOUNT OF HIGH RISK BOATS
Clean Boats Inspected Potentially Contaminated Boats Not Inspected
3357 7
% Potentially Contaminated= 0.21%
Total Potentially Contaminated Clean Boats in 2012 Potentially Contaminated Boats in 2012
6352 13.25
Page 46
APPENDIX C
ORIGINAL DOCUMENTS AND MAP
Page 83
Date from Date to: Axel Count Total
Actual Count on
Traffic Counter
Maintenance
Vehicles + Patrol (6
per day off season
& 10 per day busy
season)
Axel Count- Maintenance
Vehicles + Patrol (5 per
day)
Visiting Vehicles/
Boat
Axel Count Total
Vehicles
Axel
Count/Vehicle
(1.0 Axel Count/
Vehicle)= Number
of Vehicle
Average
Axel Count -
(Maintenance
Vehicle + Visiting
Vehicles) = Axel
Count Boats
Axel Count/ Vehicle +
Trailer (2.23 Axel
Count/Boat)= Boats
Weekend Boats
Counted
Number of
Days
Number of
Weekend
Days
Counted
Number of
Weekdays
Weekday Boats Only Average Daily Boat
During Week Provided
Total
Weekday
Boaters/M
onth
Average
Weekday
Boaters/
Month
Total
Weekend
Boaters/M
onth
Average
Weekend
Boats/
Month
2/5/2013 2/11/2013 435 435 42 393 7% 27.51 19.65 373.35 167 NA 7 0 NA 24 85.3 4 NA NA
2/12/2013 2/18/2013 462 27 42 -15 7% -1.05 -0.75 -14.25 -6 NA 7 0 NA 0
2/19/2013 2/25/2013 1150 688 42 646 7% 45.22 32.3 613.7 275 NA 7 0 NA 39
2/26/2013 3/4/2013 1554 404 42 362 7% 25.34 18.1 343.9 154 NA 7 0 NA 22
3/5/2013 3/11/2013 2069 515 54 461 7% 32.27 23.05 437.95 196 NA 9 0 NA 22 122.7 6 NA NA
3/12/2013 3/18/2013 479 479 42 437 7% 30.59 21.85 415.15 186 NA 7 0 NA 27
3/19/2013 3/25/2013 1156 677 42 635 7% 44.45 31.75 603.25 271 NA 7 0 NA 39
3/26/2013 4/1/2013 1784 628 42 586 7% 41.02 29.3 556.7 250 NA 7 0 NA 36
4/2/2013 4/10/2013 2269 485 54 431 7% 30.17 21.55 409.45 184 NA 9 0 NA 20 230.9 12 NA NA
4/11/2013 4/14/2013 708 708 24 684 7% 47.88 34.2 649.8 291 NA 4 0 NA 73
4/15/2013 4/21/2013 1324 616 42 574 7% 40.18 28.7 545.3 245 NA 7 0 NA 35
4/22/2013 4/28/2013 2196 872 42 830 7% 58.1 41.5 788.5 354 NA 7 0 NA 51
4/29/2013 5/5/2013 3096 900 42 858 7% 60.06 42.9 815.1 366 NA 7 0 NA 52
5/6/2013 5/27/2013 3939 843 210 633 7% 44.31 31.65 601.35 270 639 21 9 12 -369 -31 53.9 4 879 73
5/28/2013 6/3/2013 1011 1011 50 961 7% 67.27 48.05 912.95 409 240 5 3 2 169 85
6/4/2013 6/16/2013 2343 1332 120 1212 7% 84.84 60.6 1151.4 516 540 12 6 6 -24 -4 154.6 12 990 90
6/17/2013 6/23/2013 1402 1402 60 1342 7% 93.94 67.1 1274.9 572 270 6 3 3 302 101
6/24/2013 6/30/2013 2429 1027 60 967 7% 67.69 48.35 918.65 412 180 6 2 4 232 58
7/1/2013 7/4/2013 3933 1504 40 1464 7% 102.48 73.2 1390.8 624 84 4 1 2 540 270 544.3 34 1315 82
7/5/2013 7/8/2013 495 495 40 455 7% 31.85 22.75 432.25 194 252 4 3 1 -58 -58
7/9/2013 7/14/2013 1858 1363 50 1313 7% 91.91 65.65 1247.35 559 252 5 3 2 307 154
7/15/2013 7/28/2013 3023 1165 130 1035 7% 72.45 51.75 983.25 441 504 13 6 7 -63 -9
7/29/2013 8/4/2013 5381 2358 70 2288 7% 160.16 114.4 2173.6 975 223 7 3 4 752 188
8/5/2013 8/11/2013 6486 1105 60 1045 7% 73.15 52.25 992.75 445 223 6 3 3 222 74 429.1 31 888 74
8/12/2013 8/18/2013 983 983 60 923 7% 64.61 46.15 876.85 393 223 6 3 3 170 57
8/19/2013 8/29/2013 2245 1262 100 1162 7% 81.34 58.1 1103.9 495 223 10 3 7 272 39
8/30/2013 9/2/2013 3408 1163 40 1123 7% 78.61 56.15 1066.85 478 219 4 3 1 259 259
21
21
20
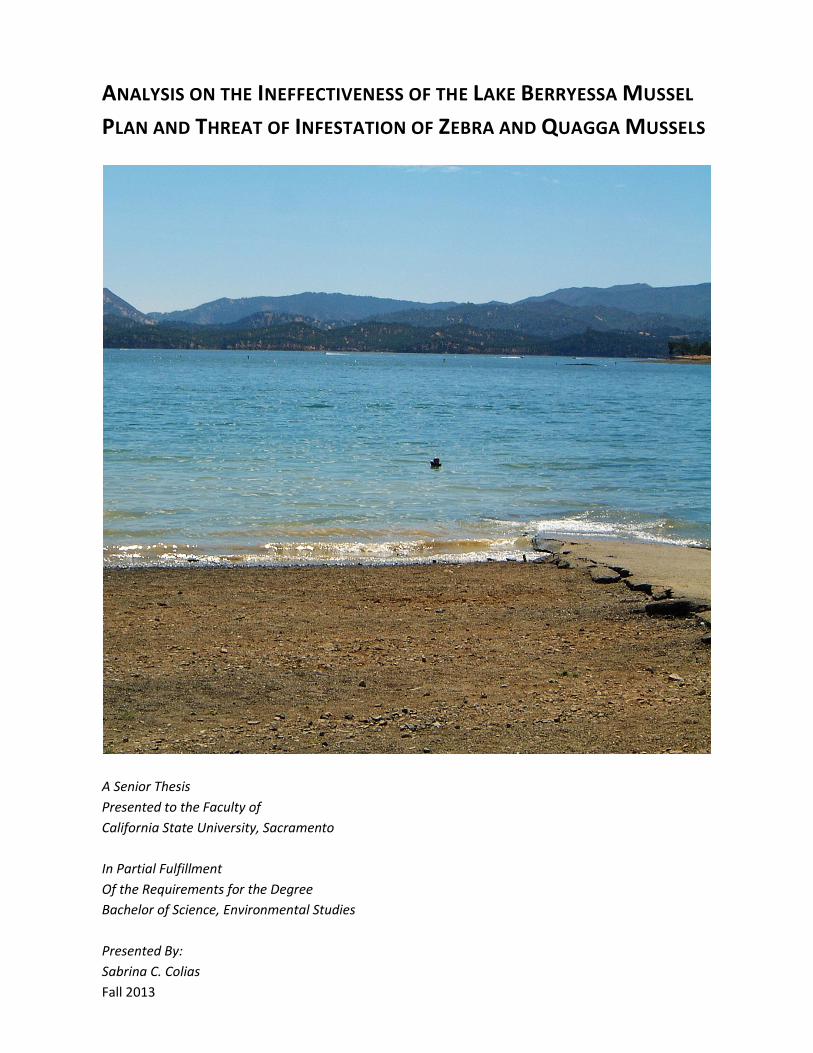
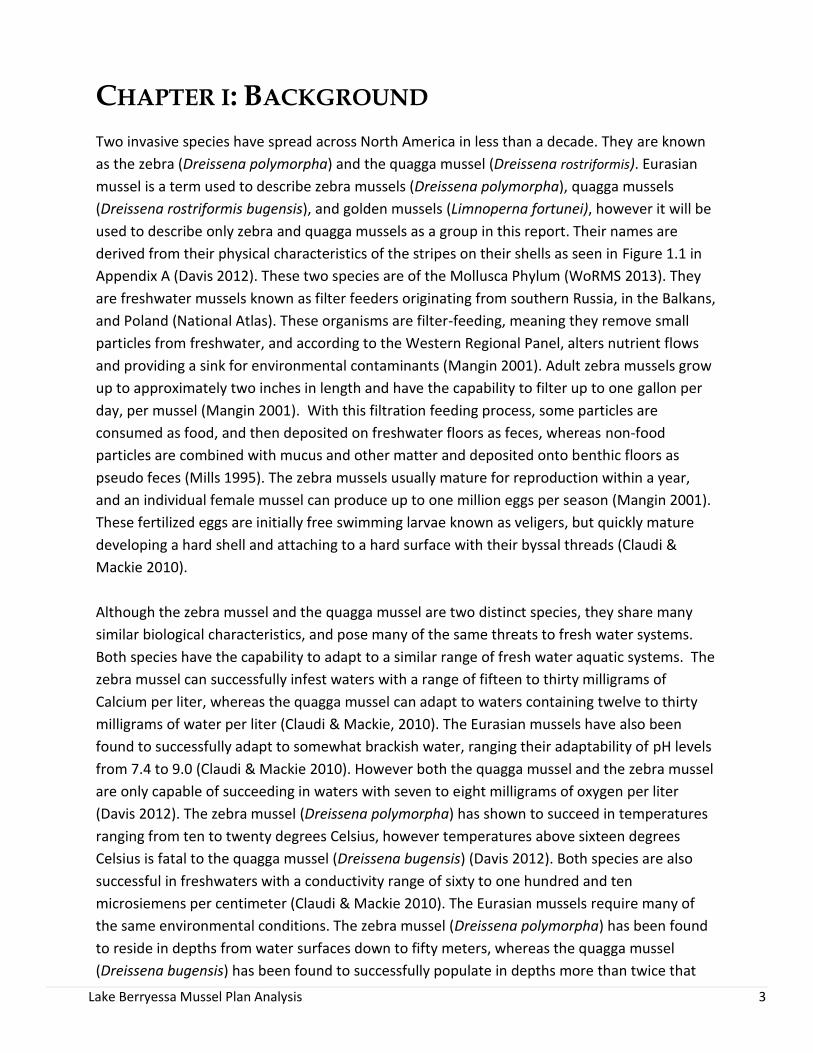
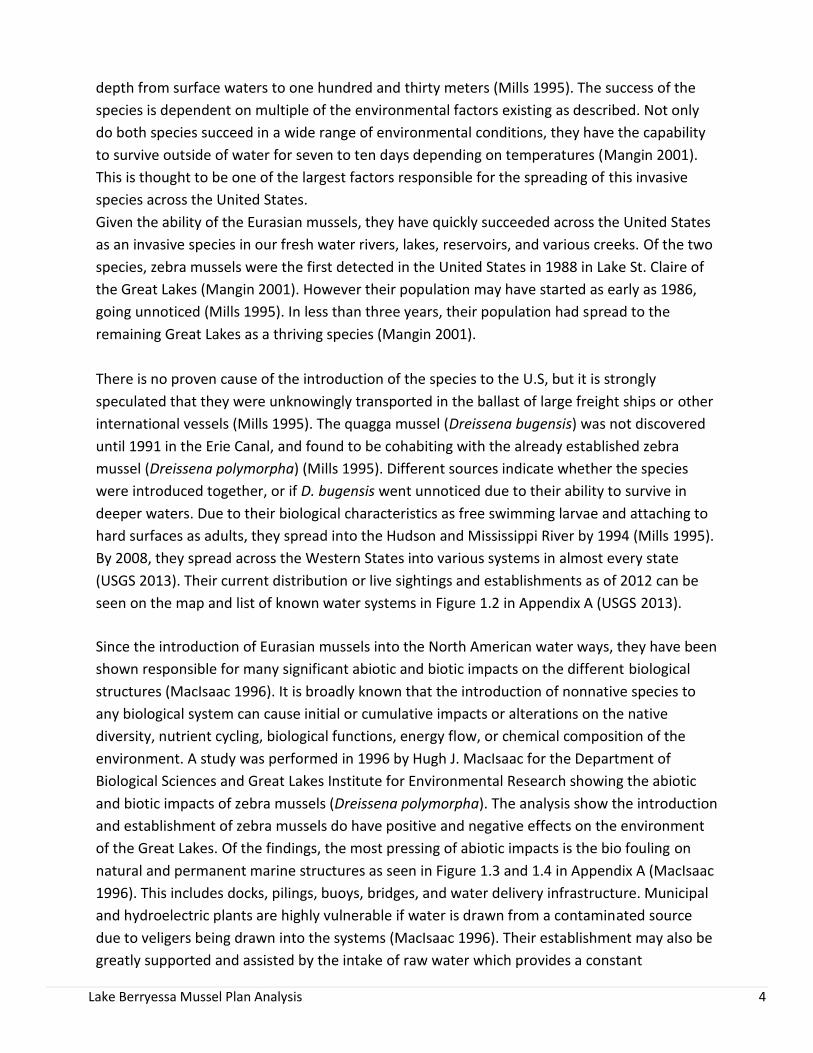
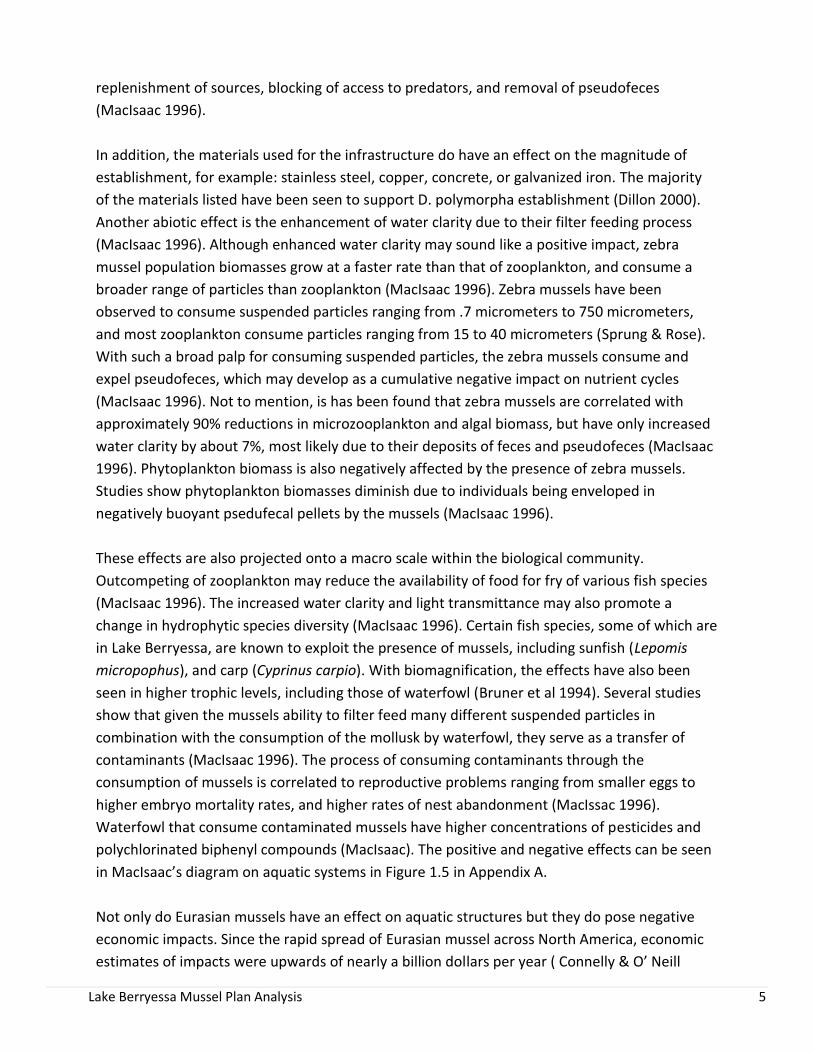
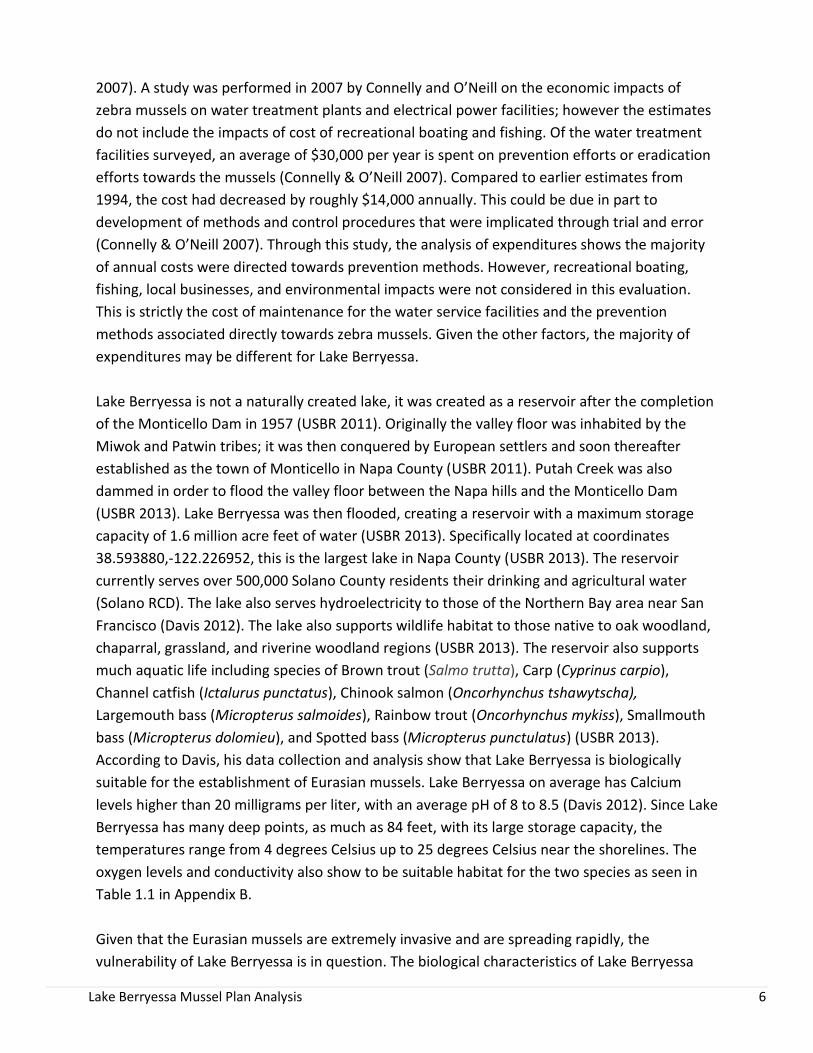


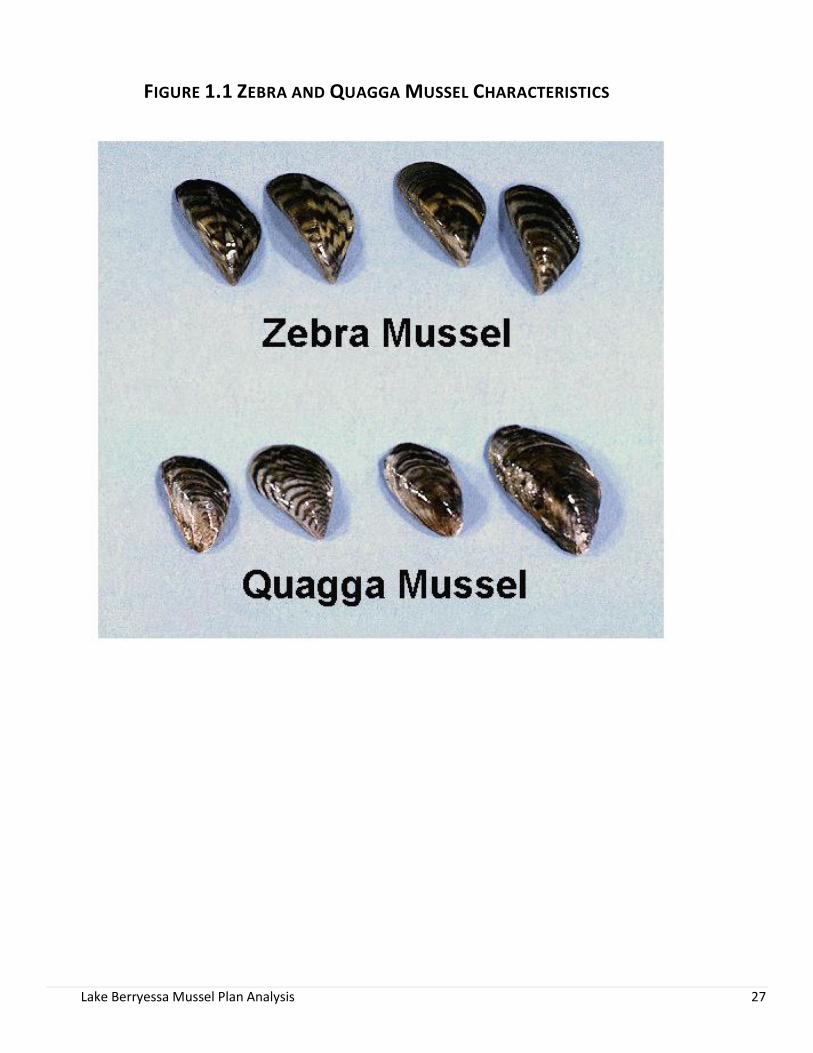
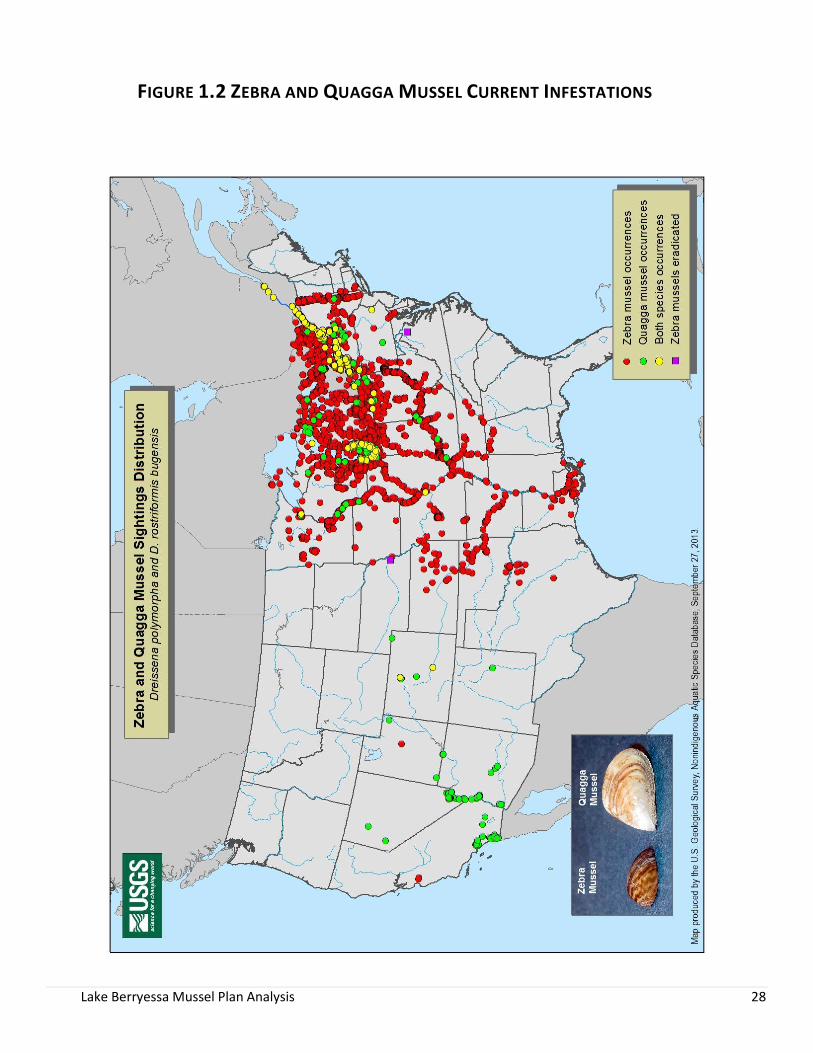
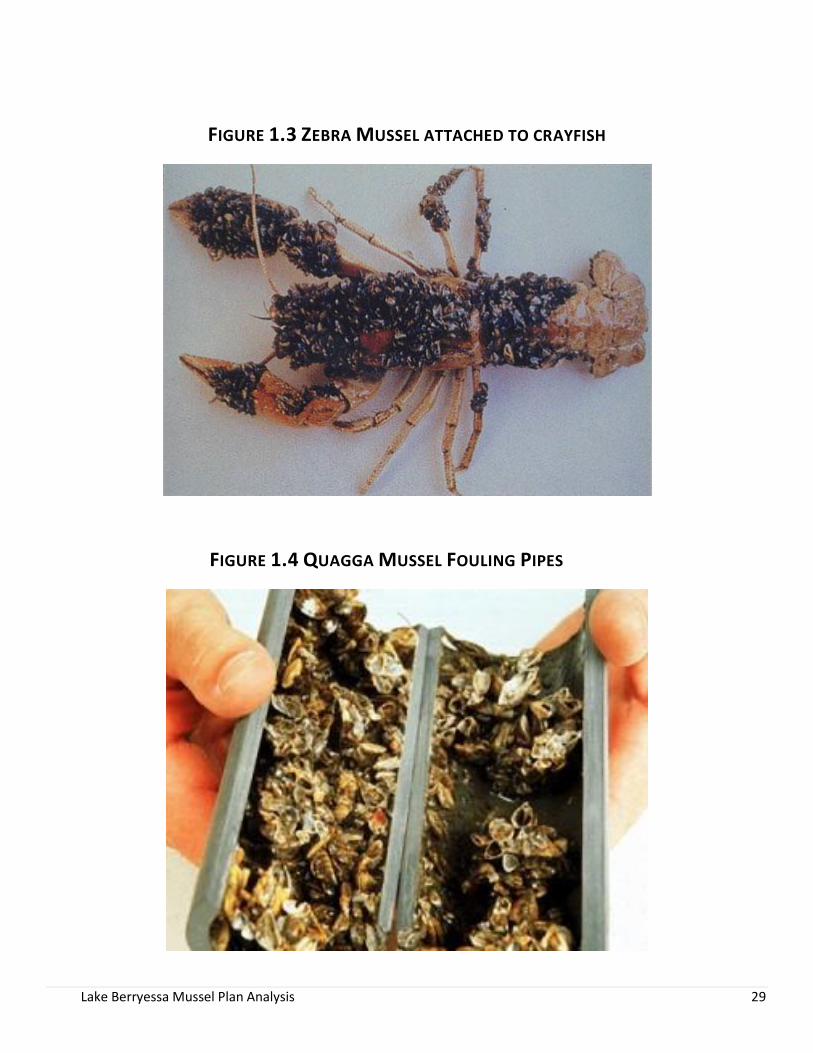
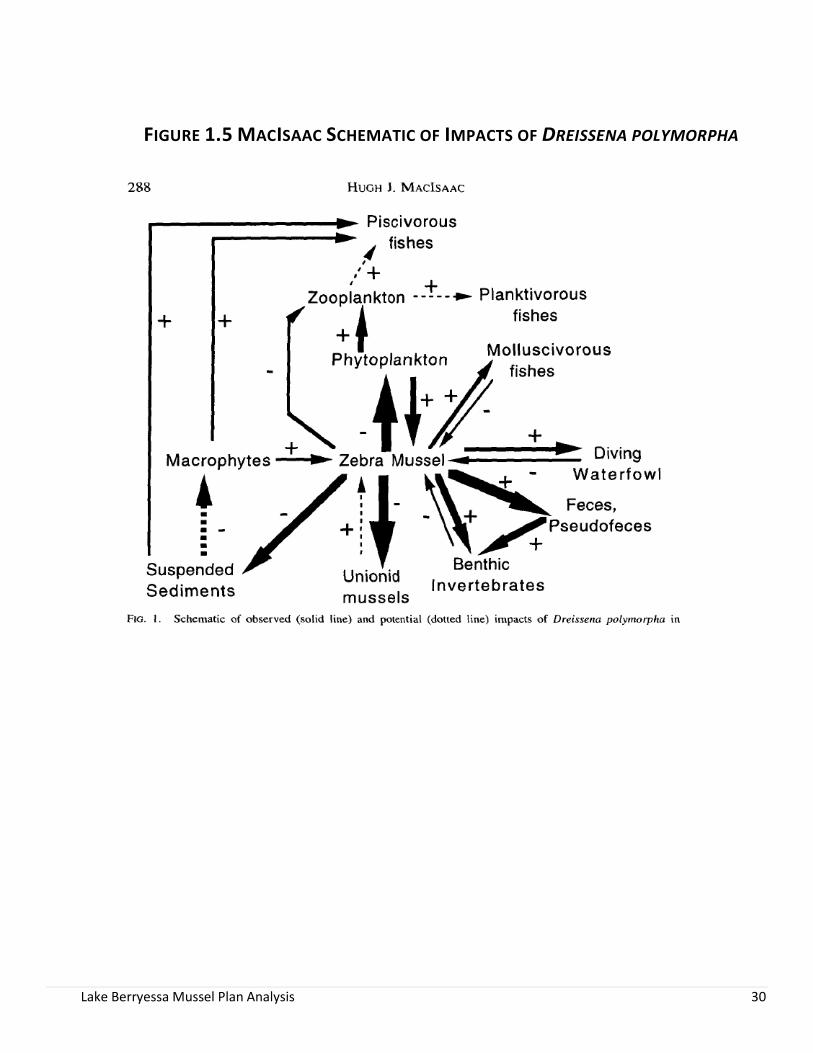
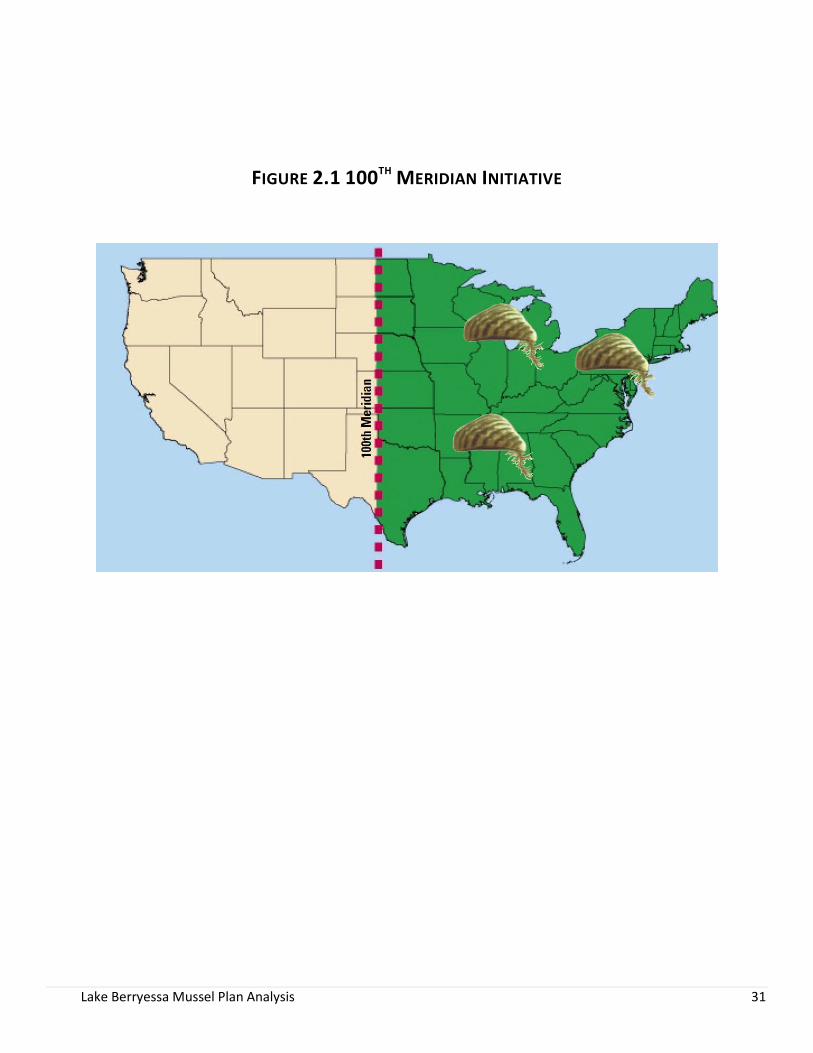

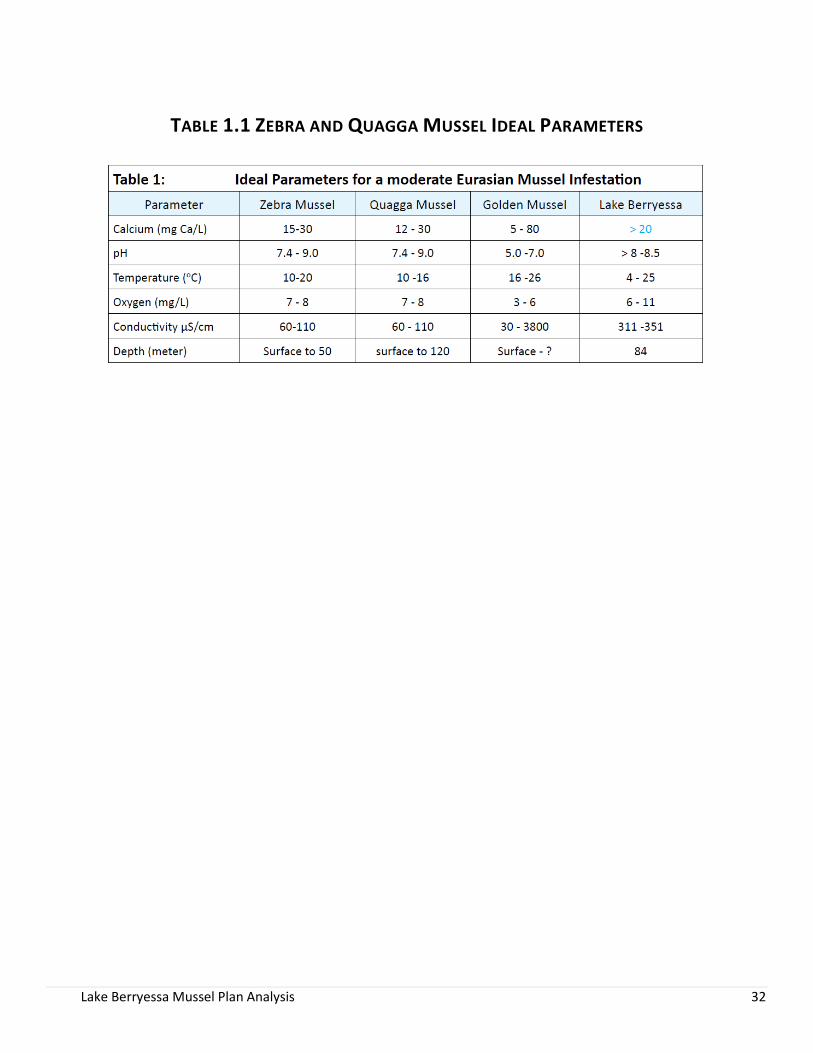
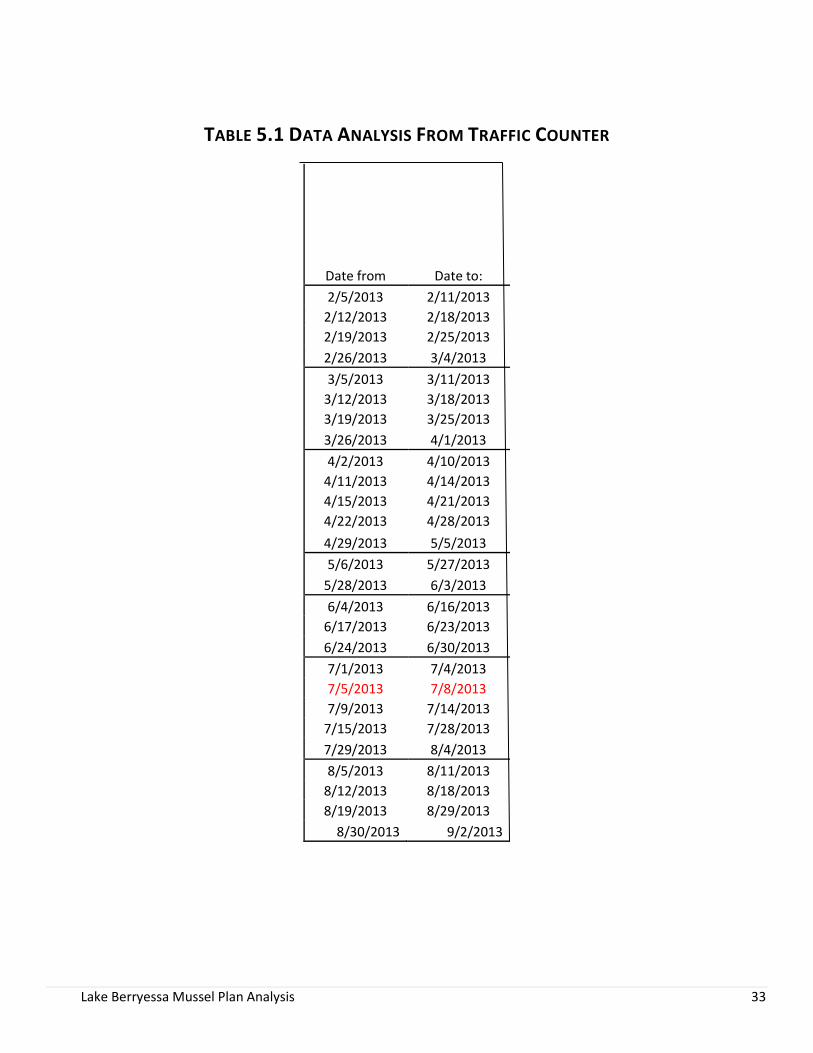
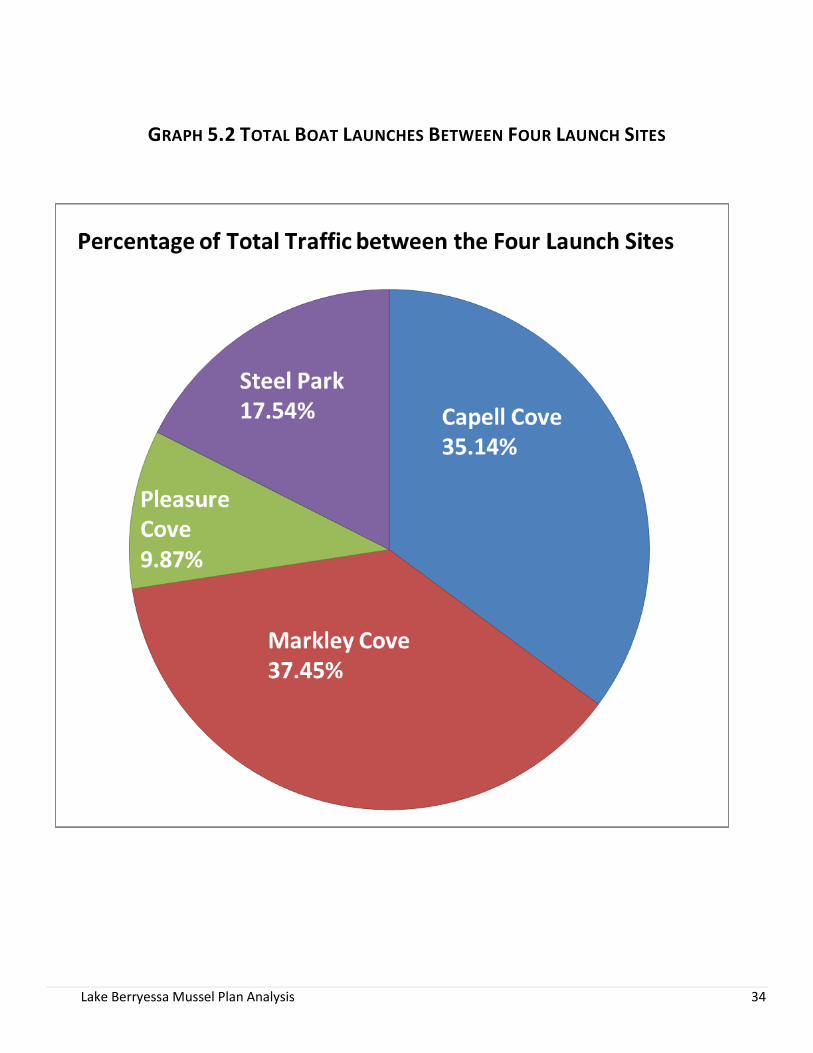
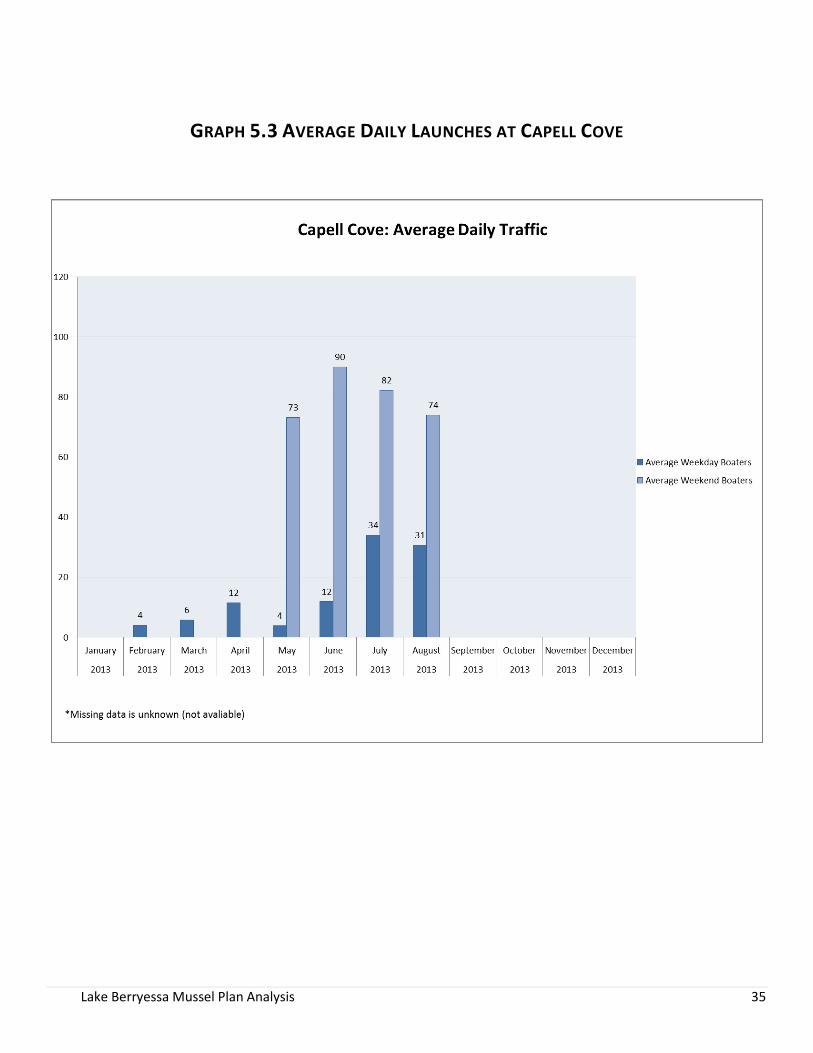
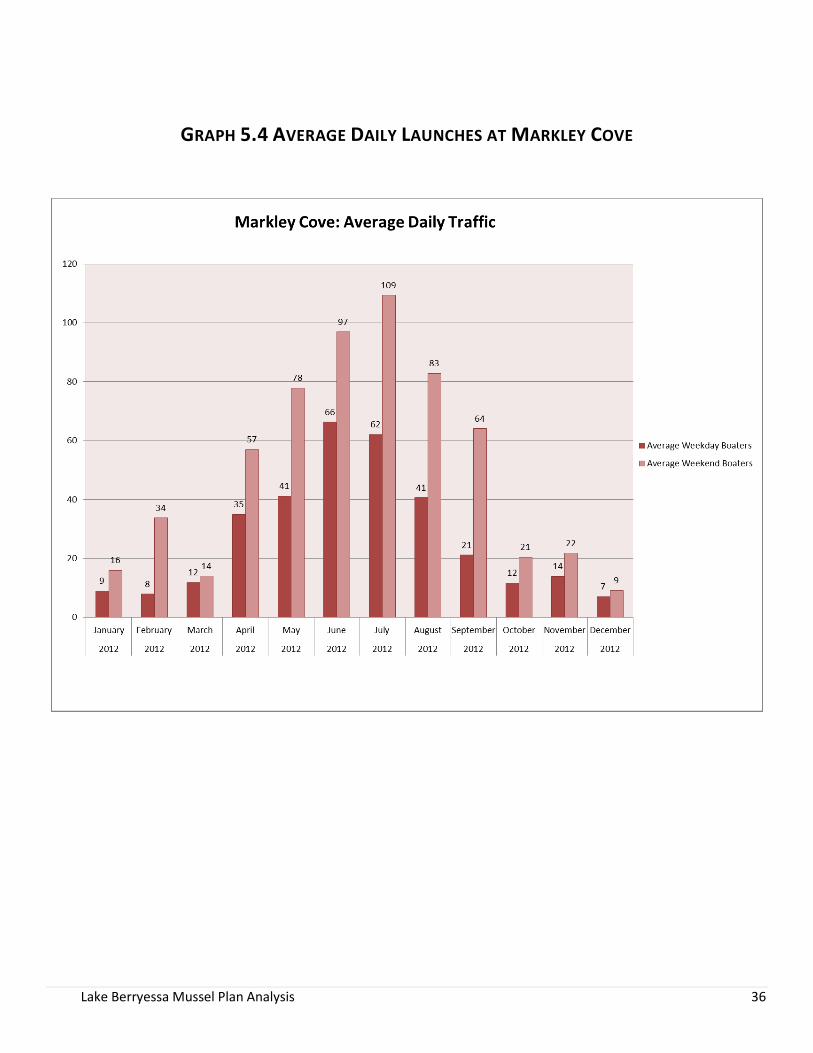
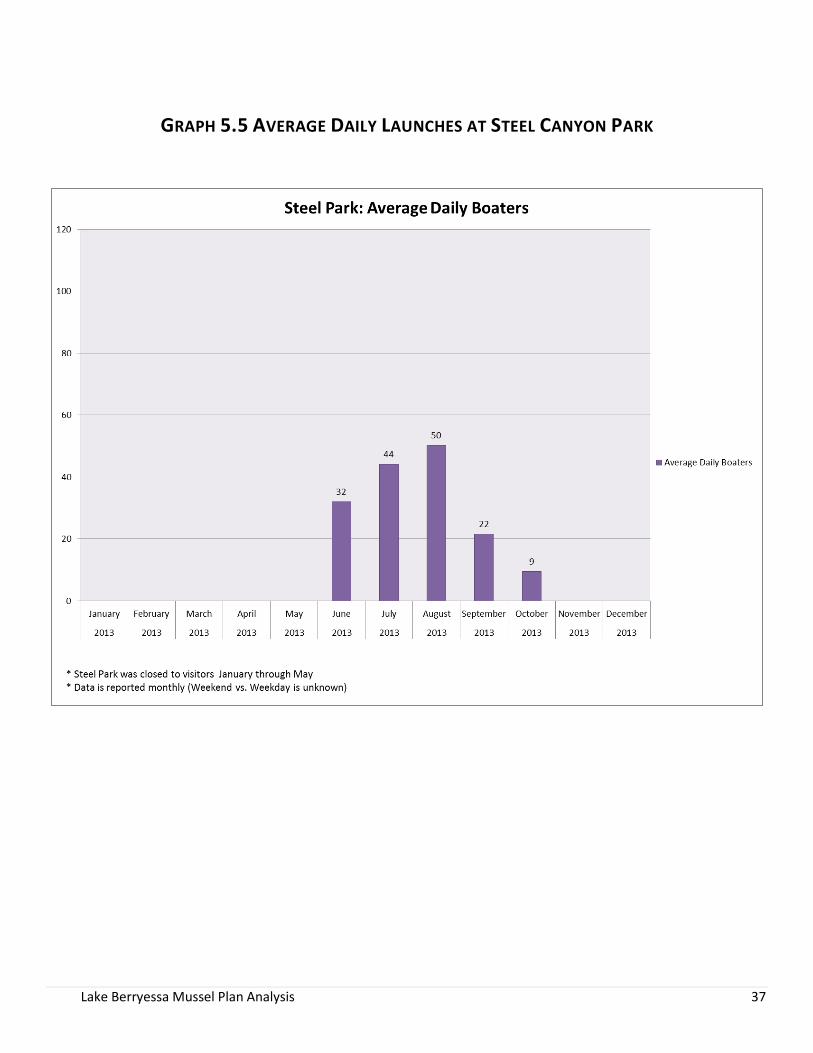
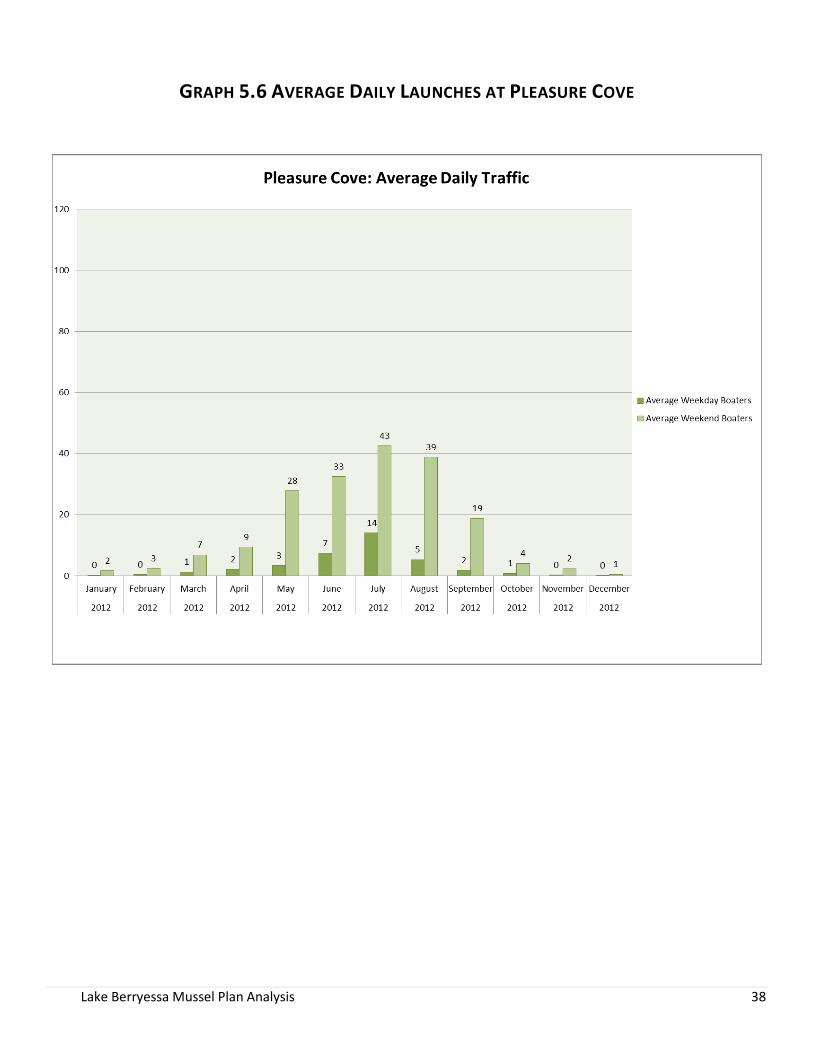
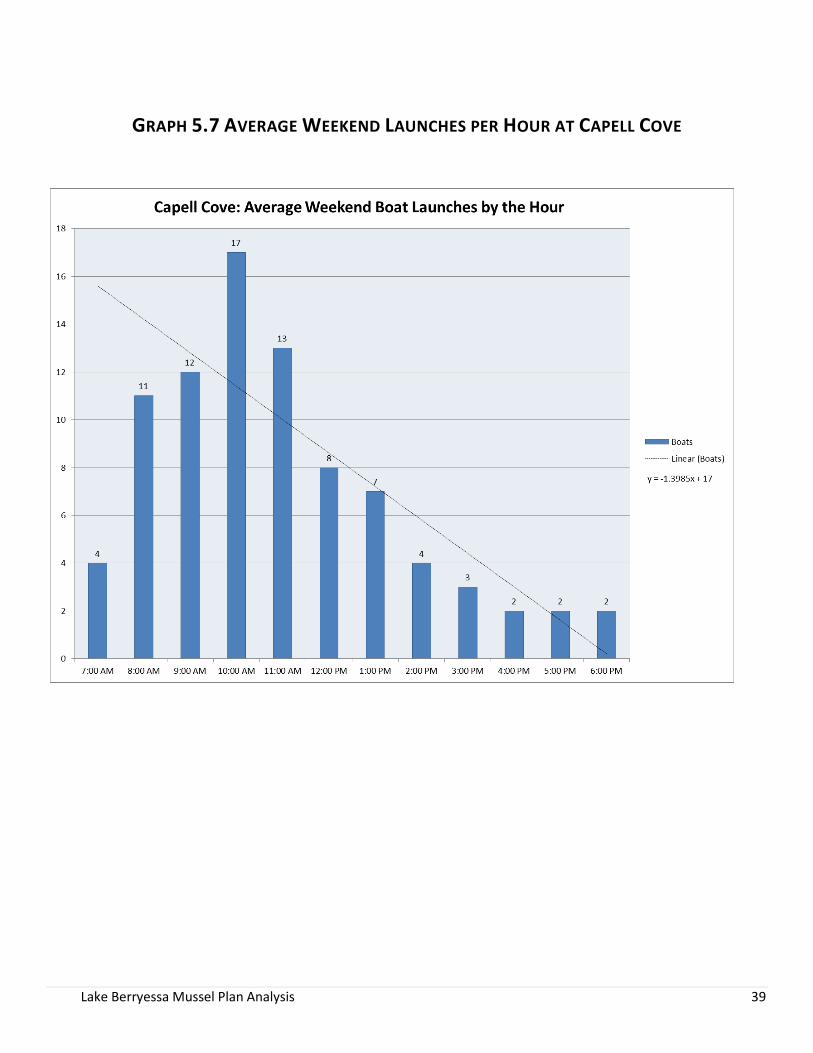
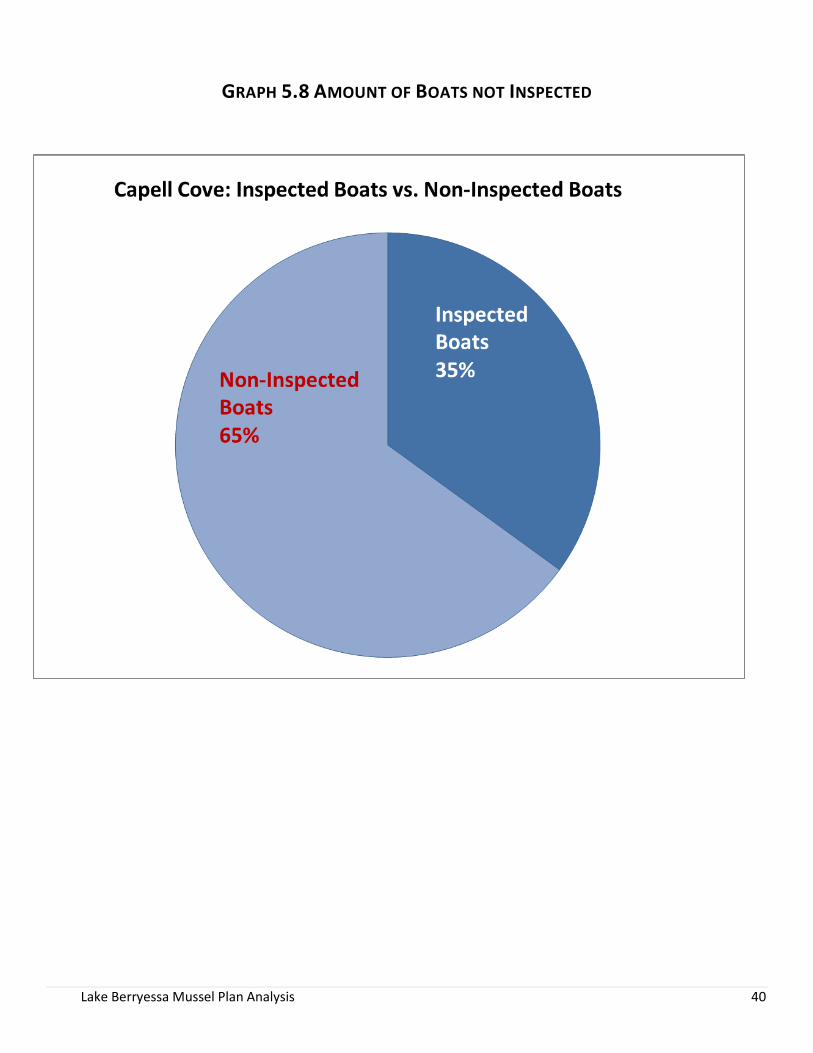
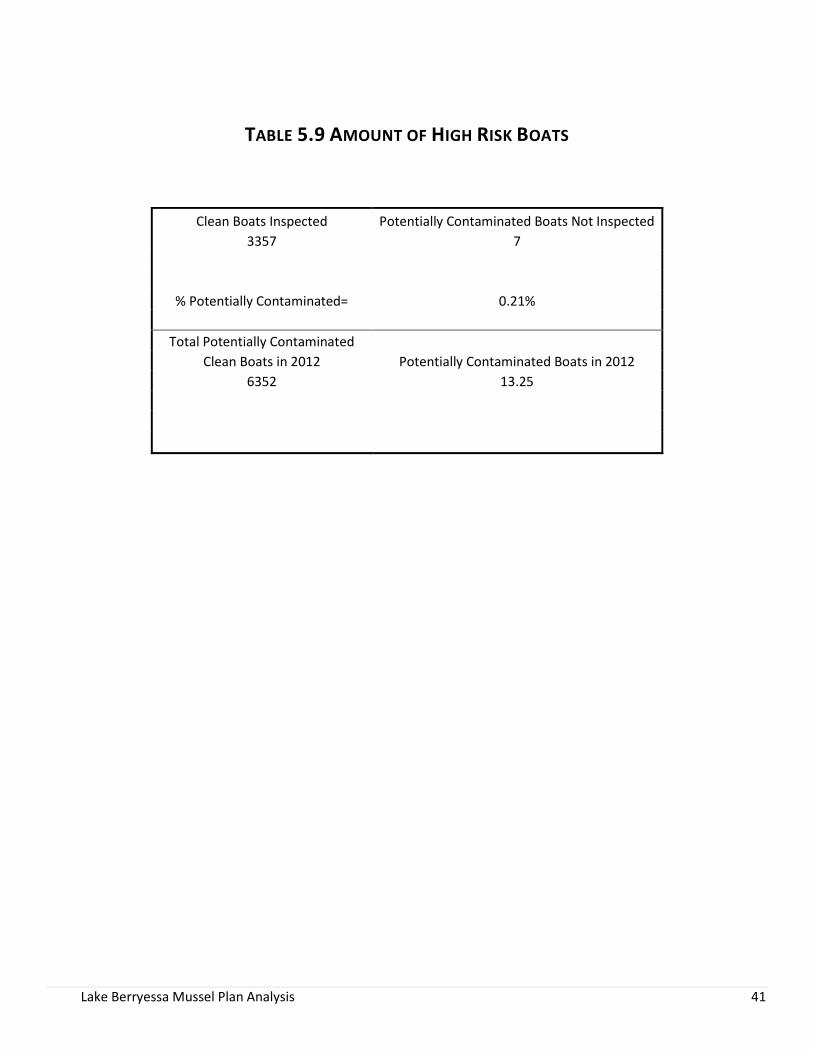
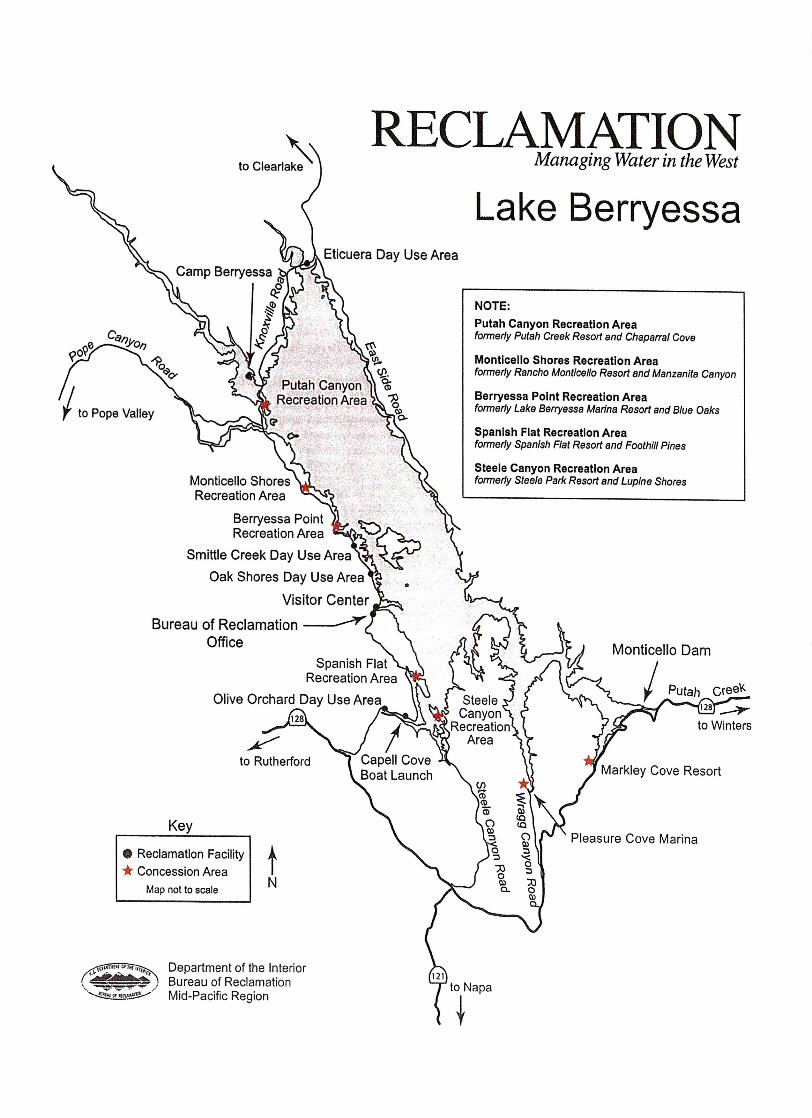
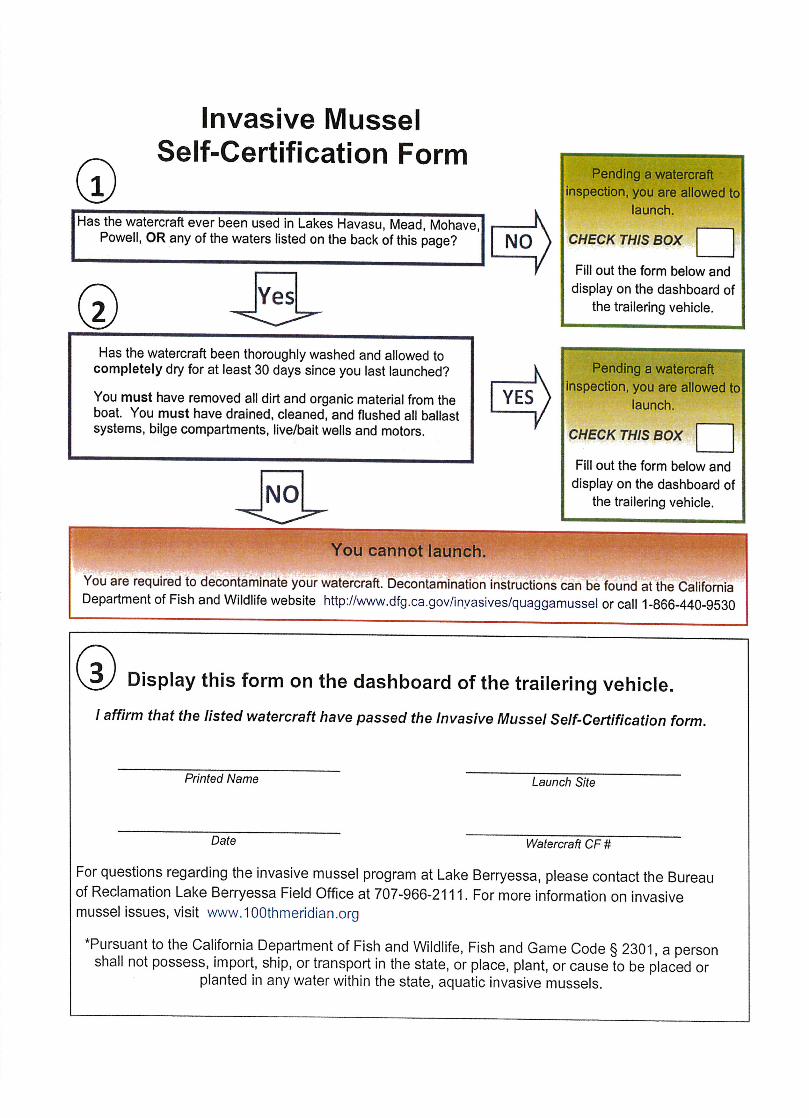
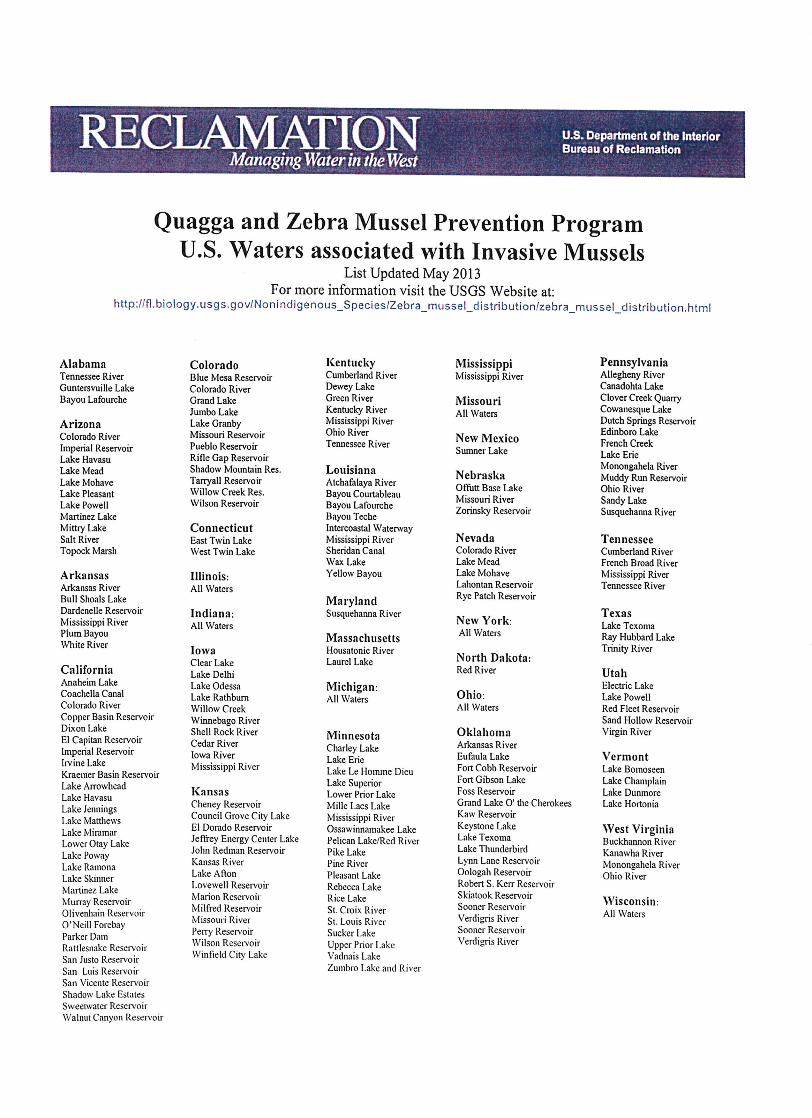
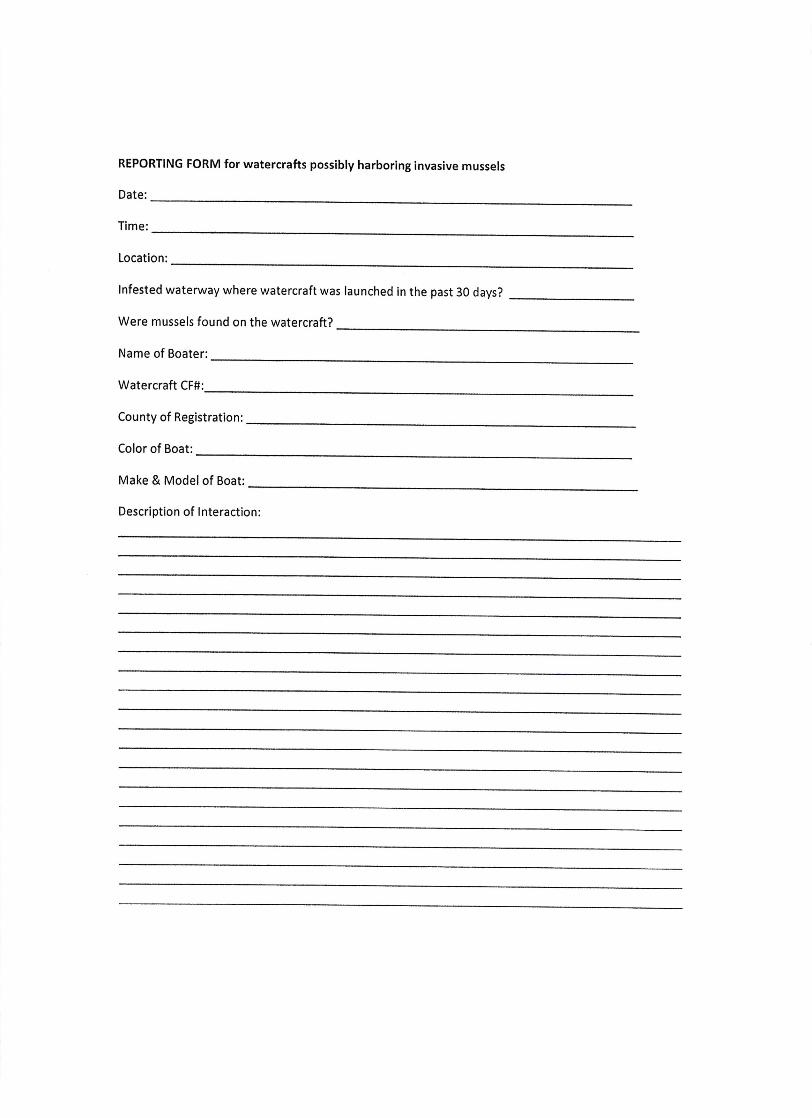
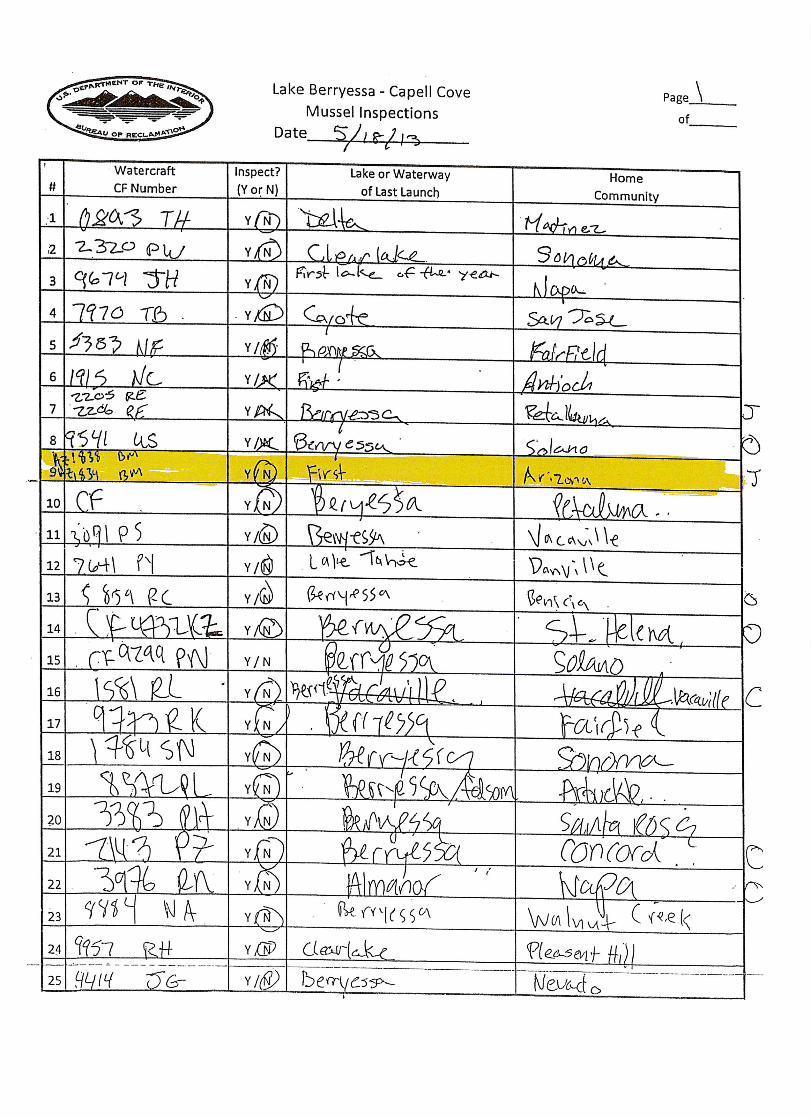
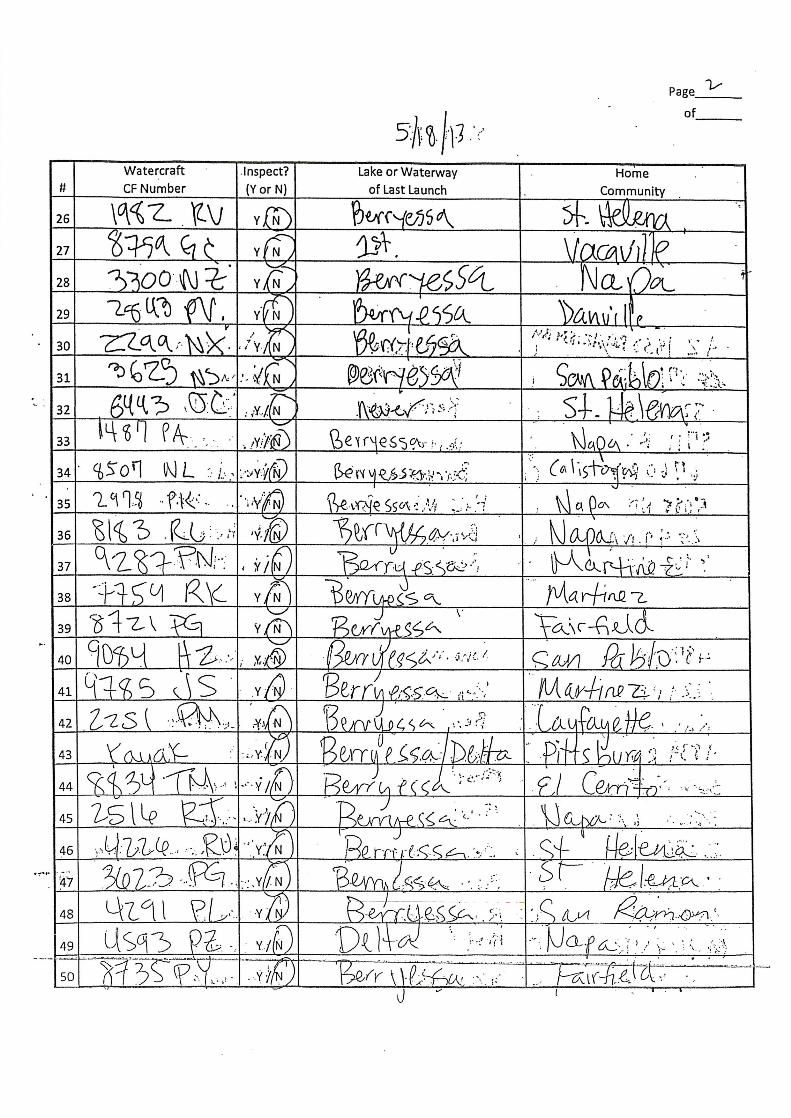
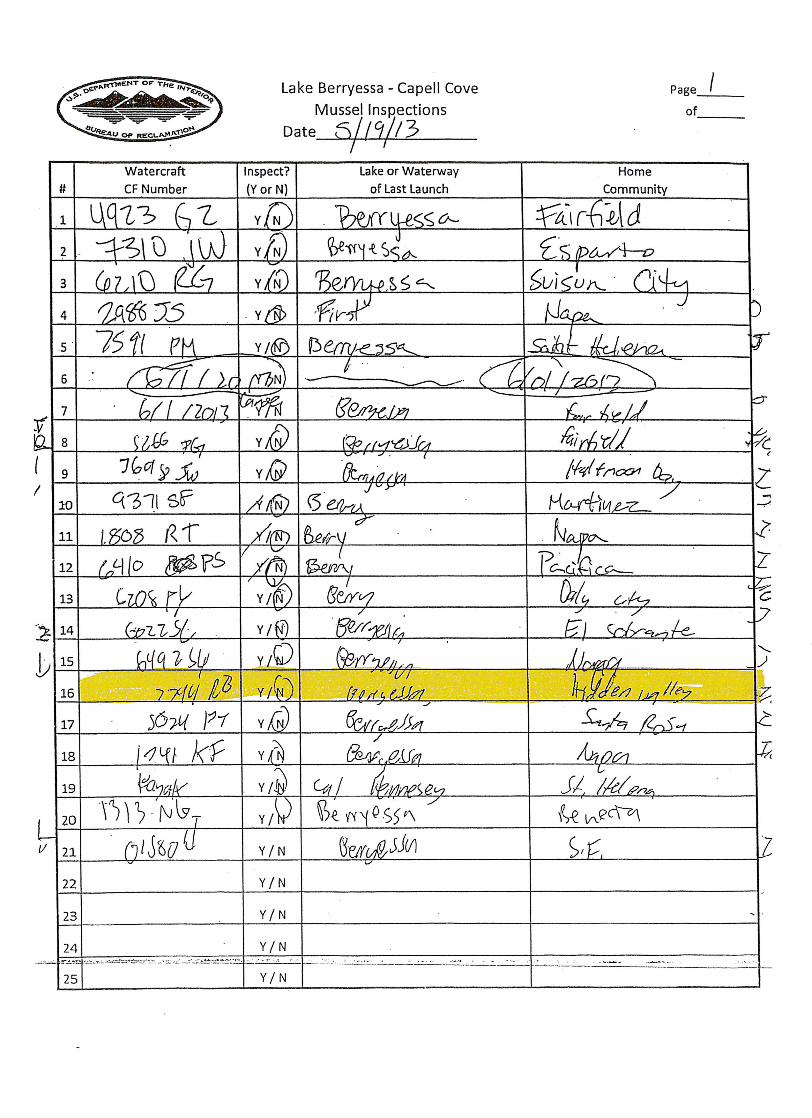
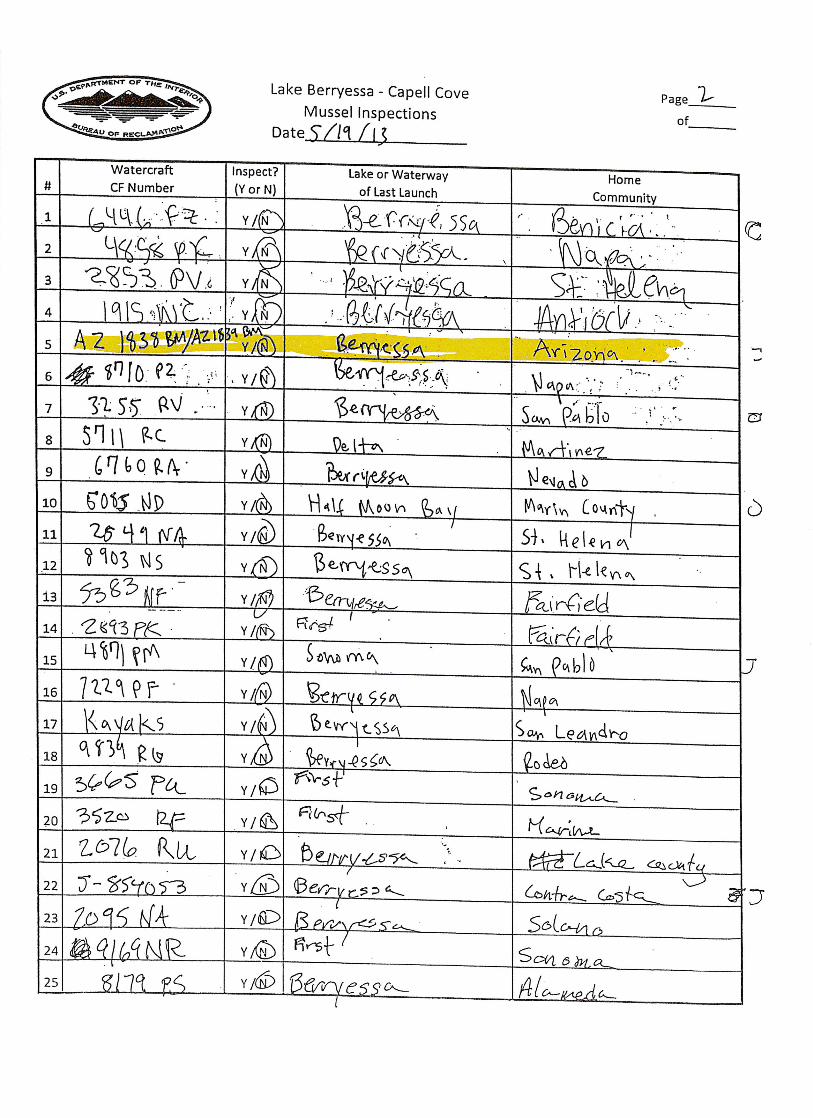
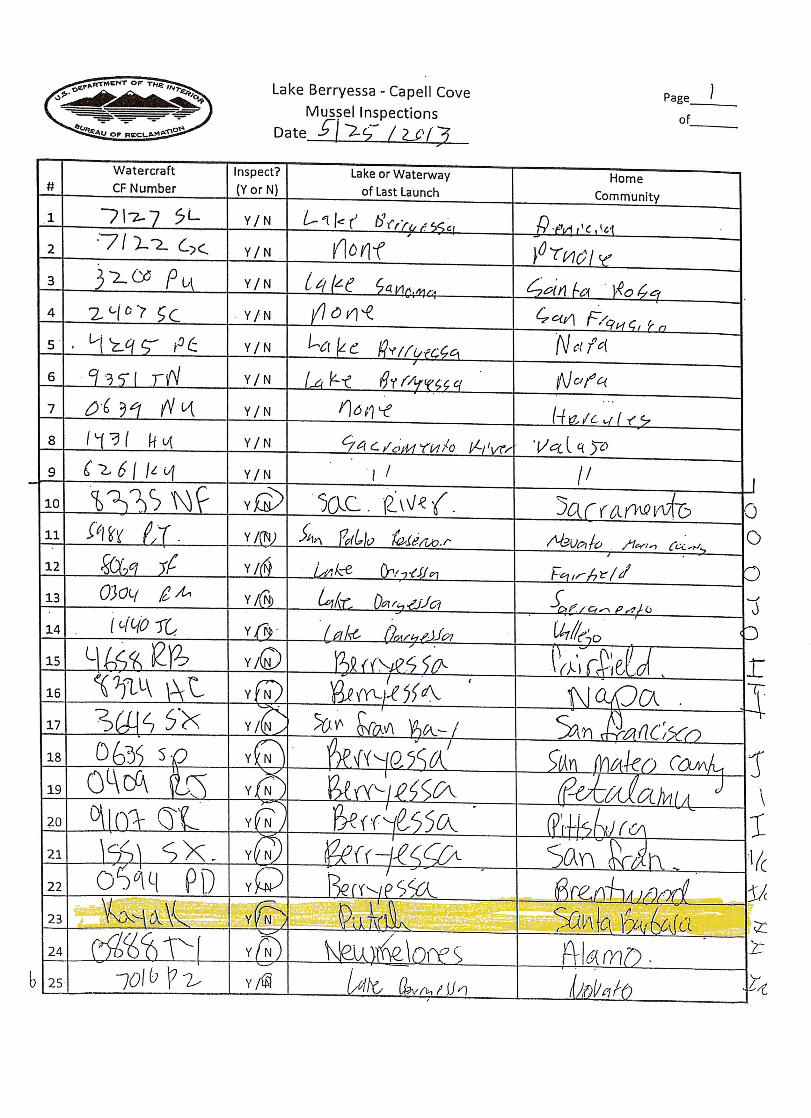
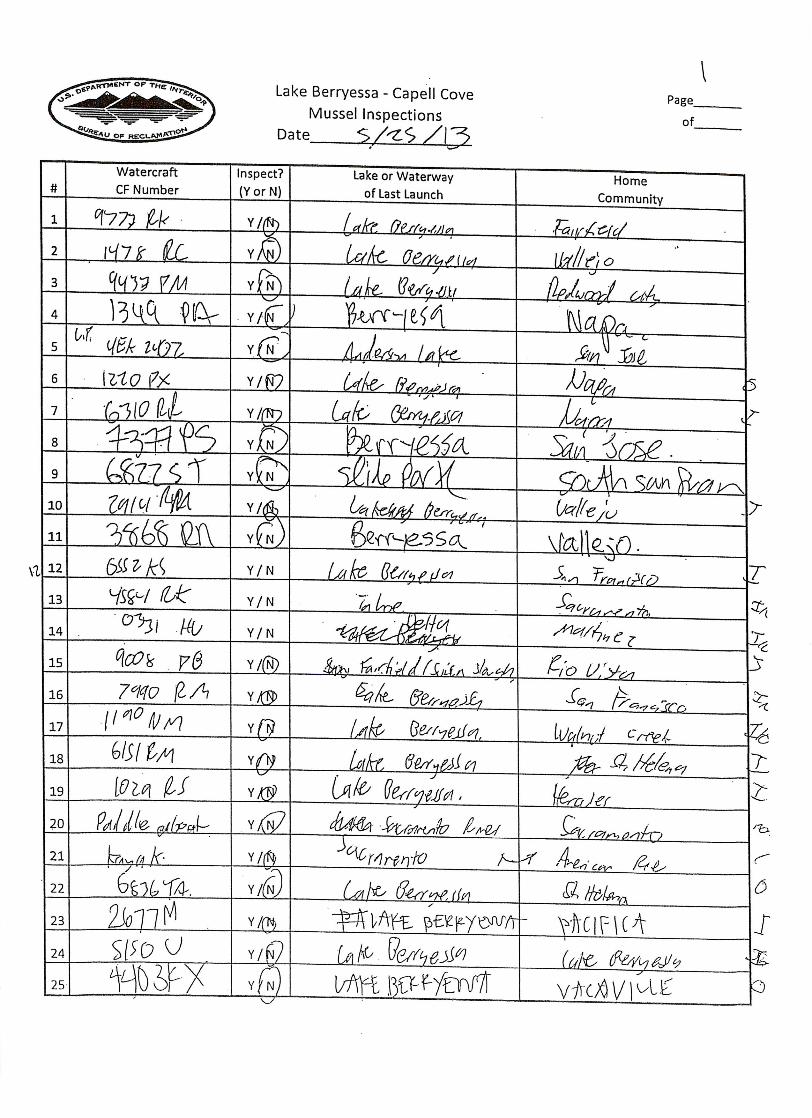
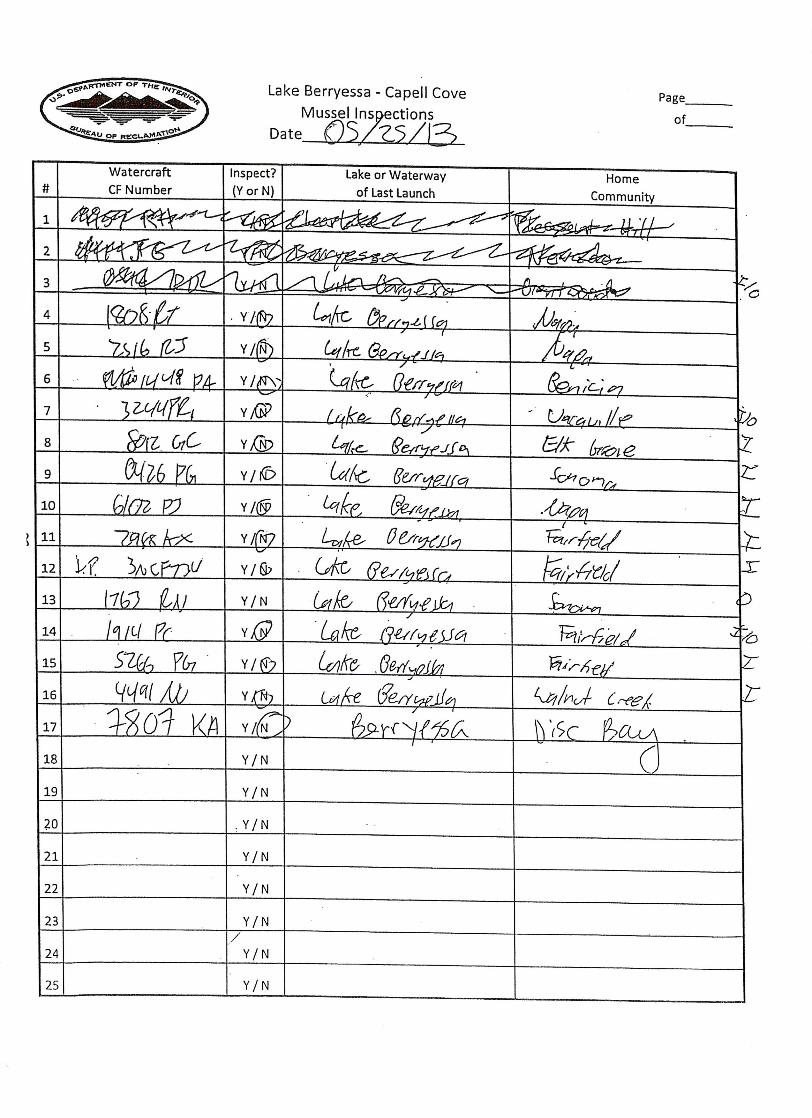
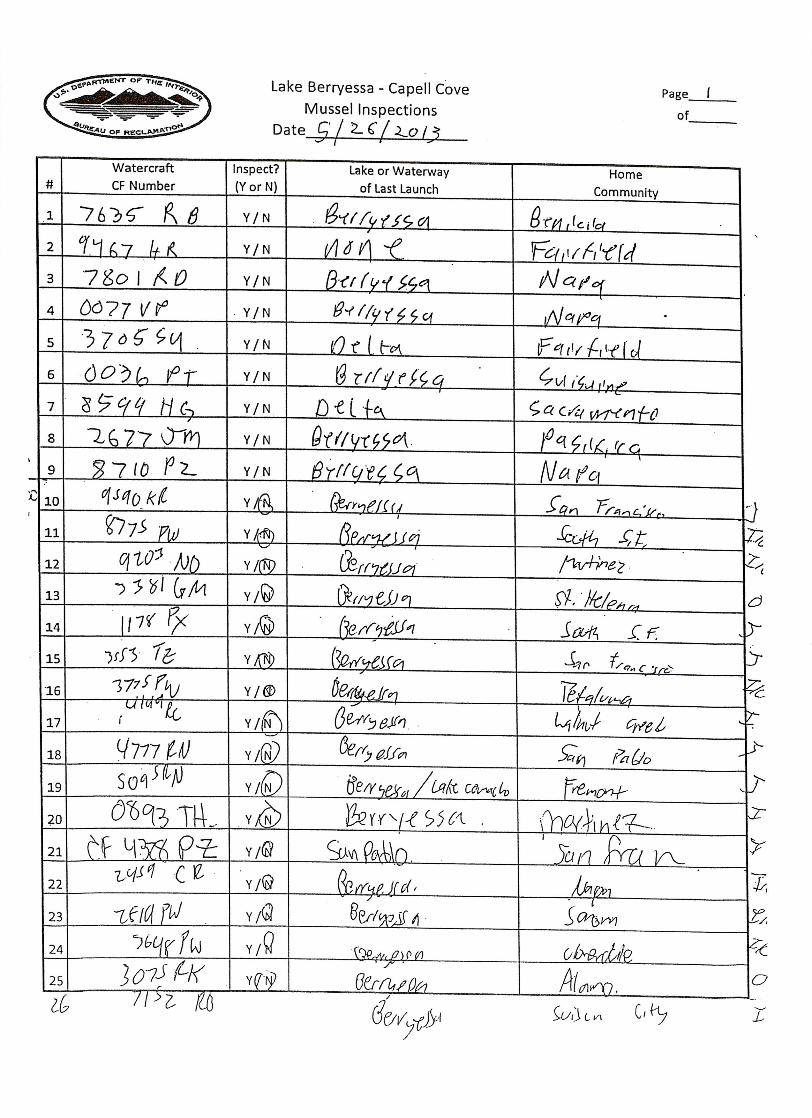
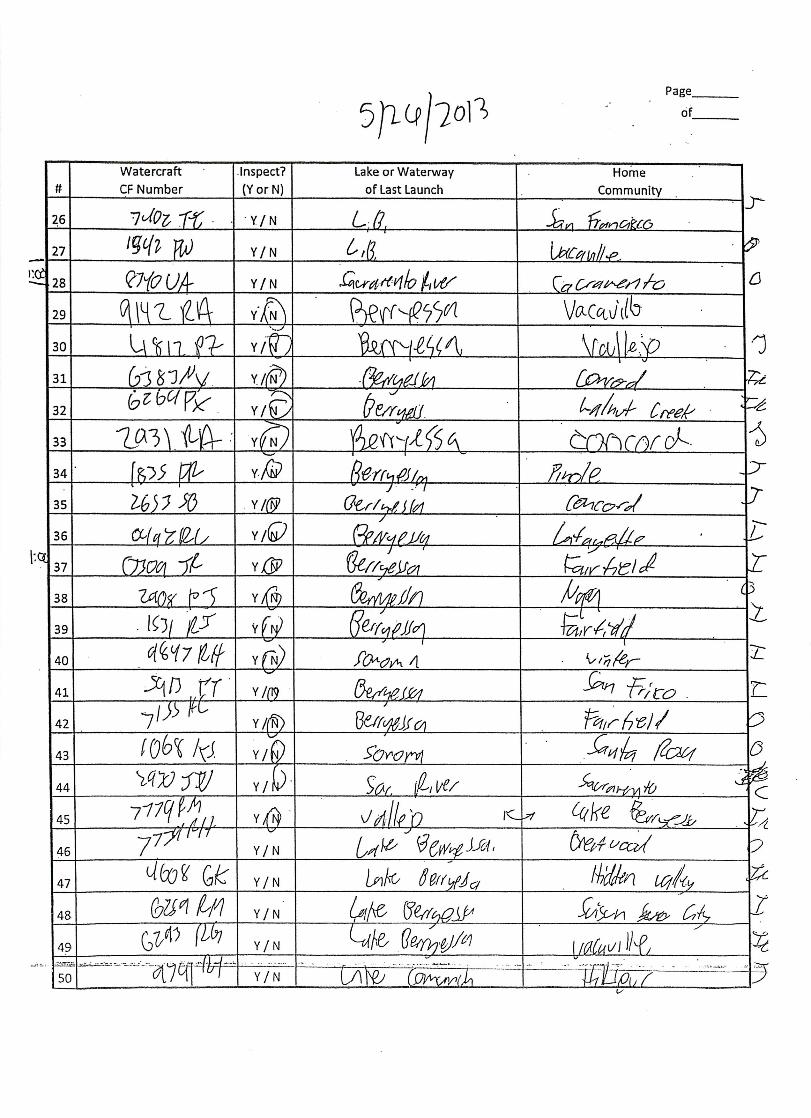
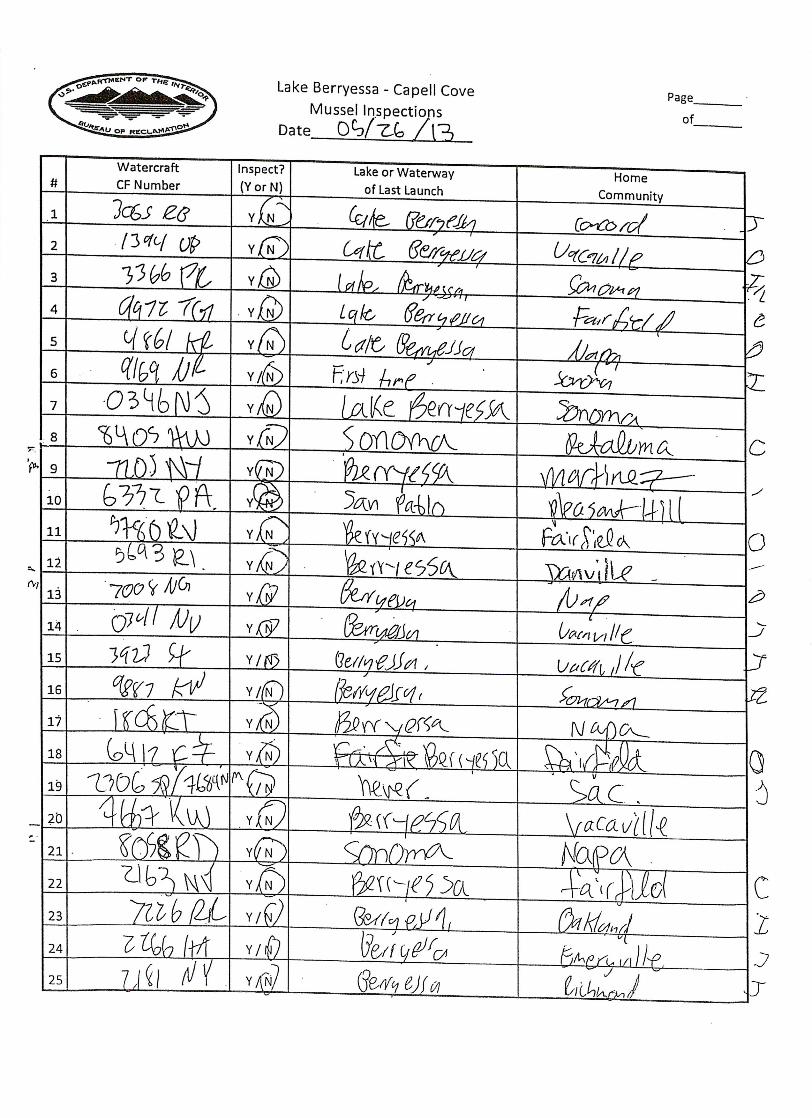
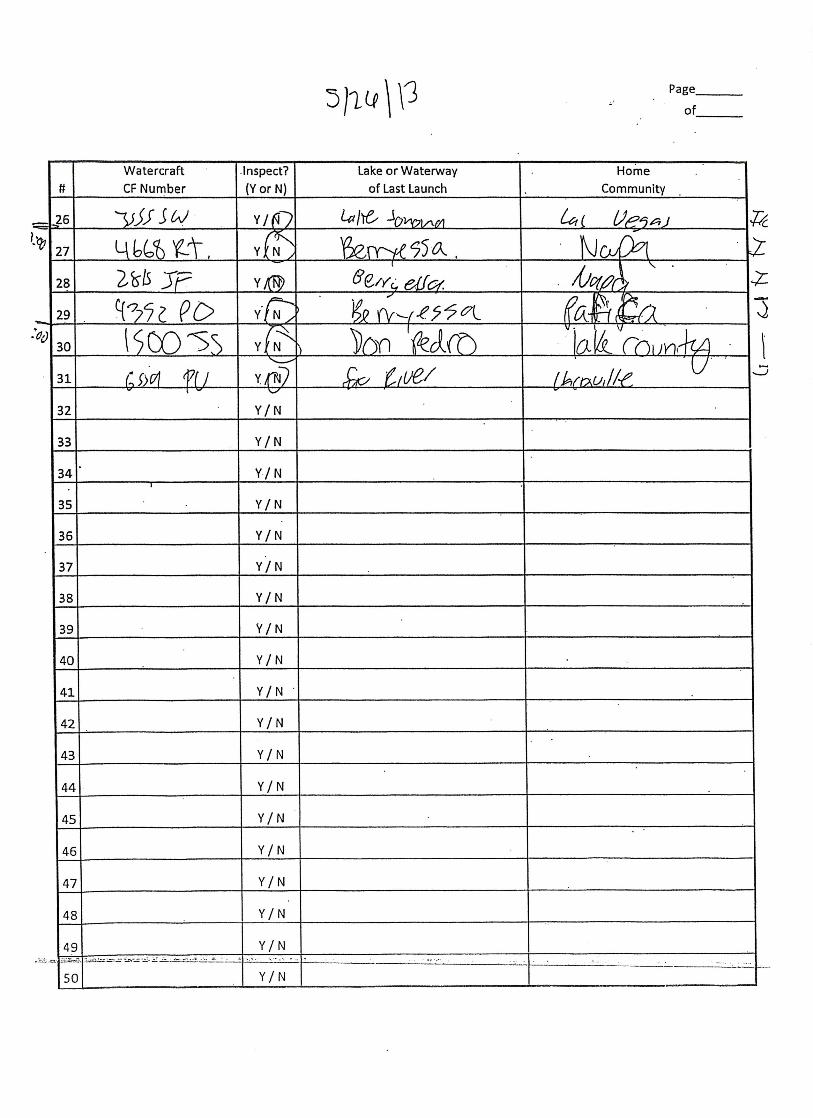
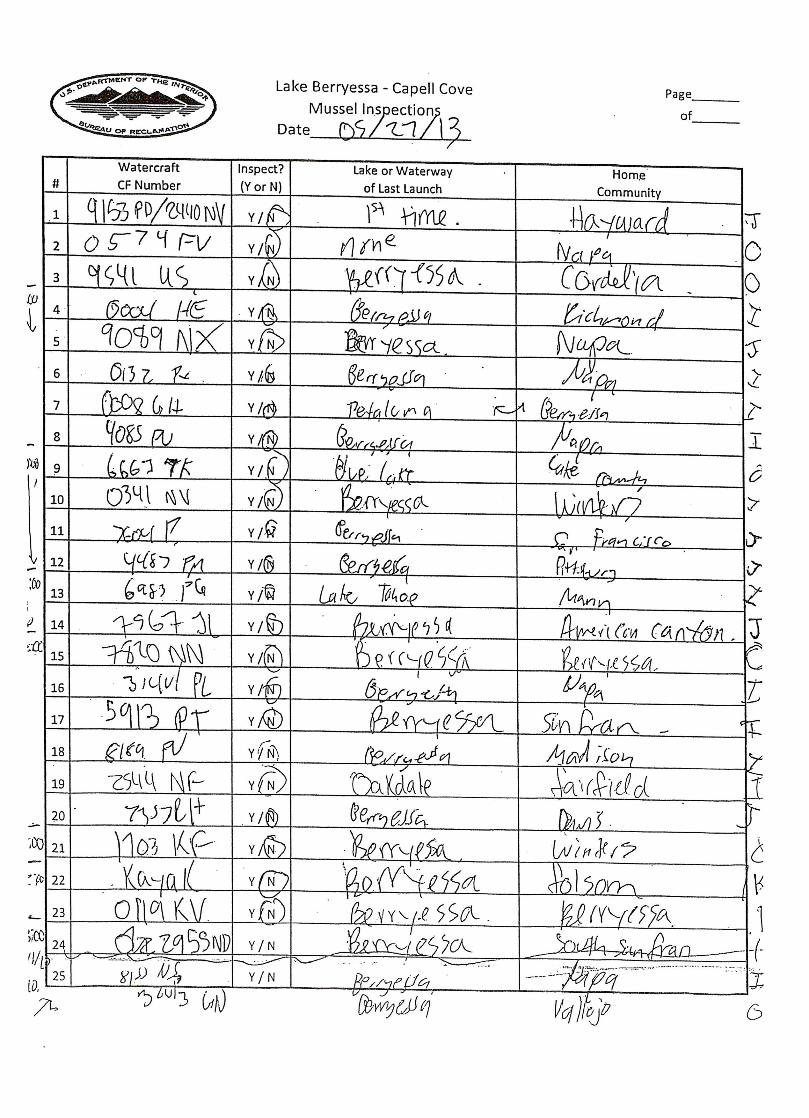
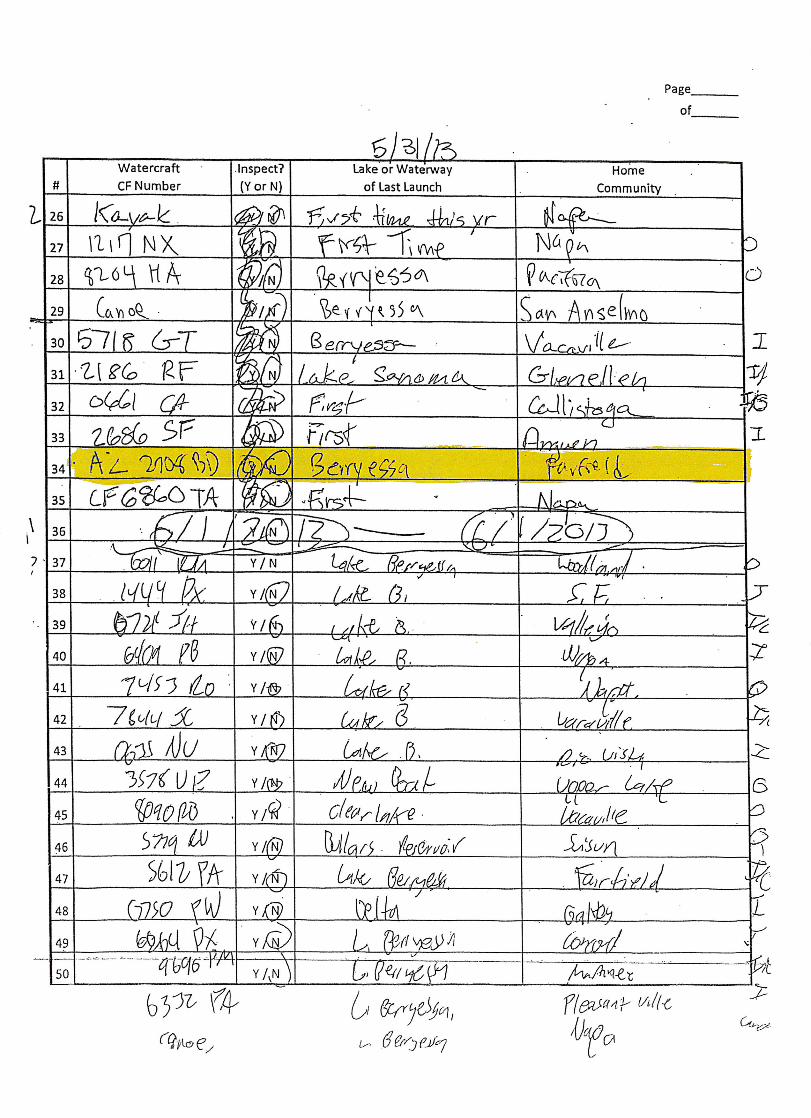
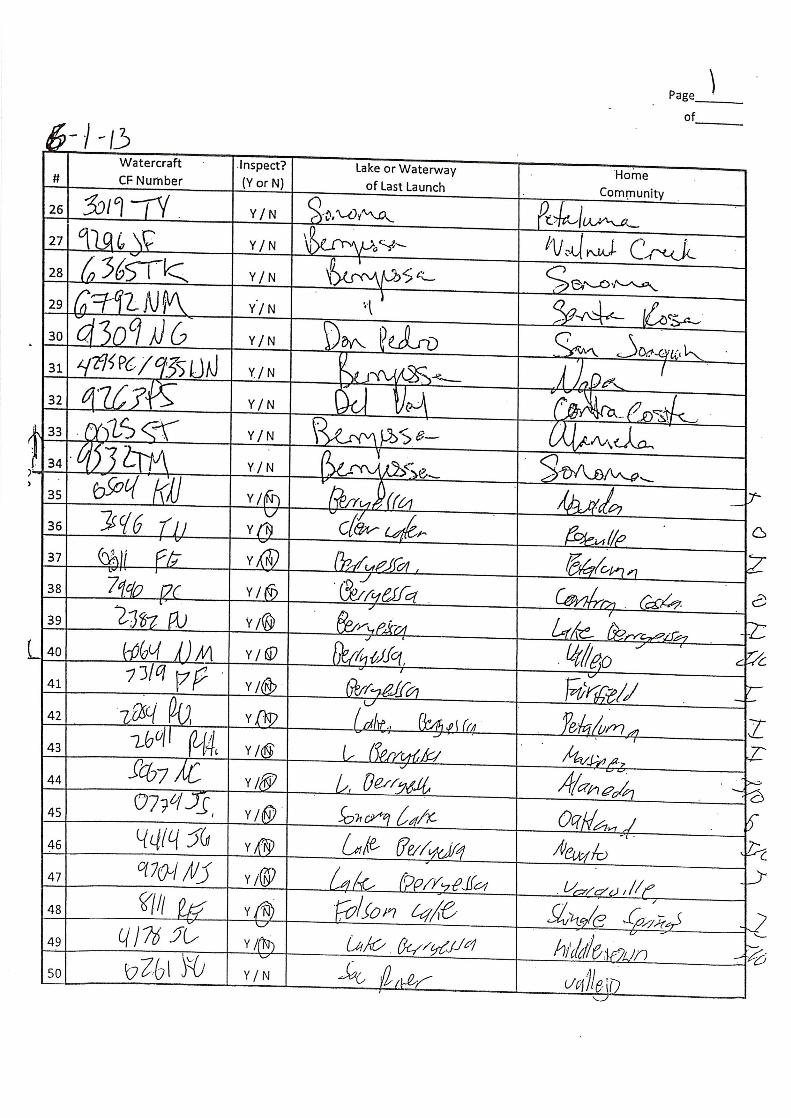
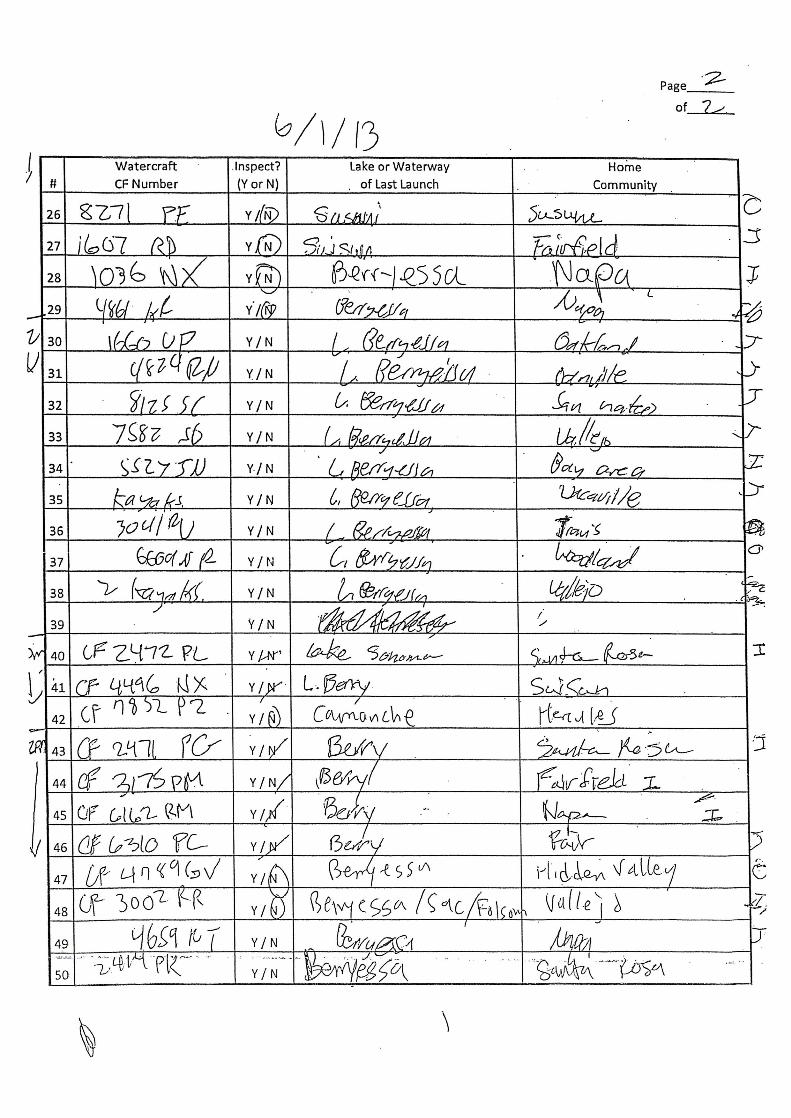
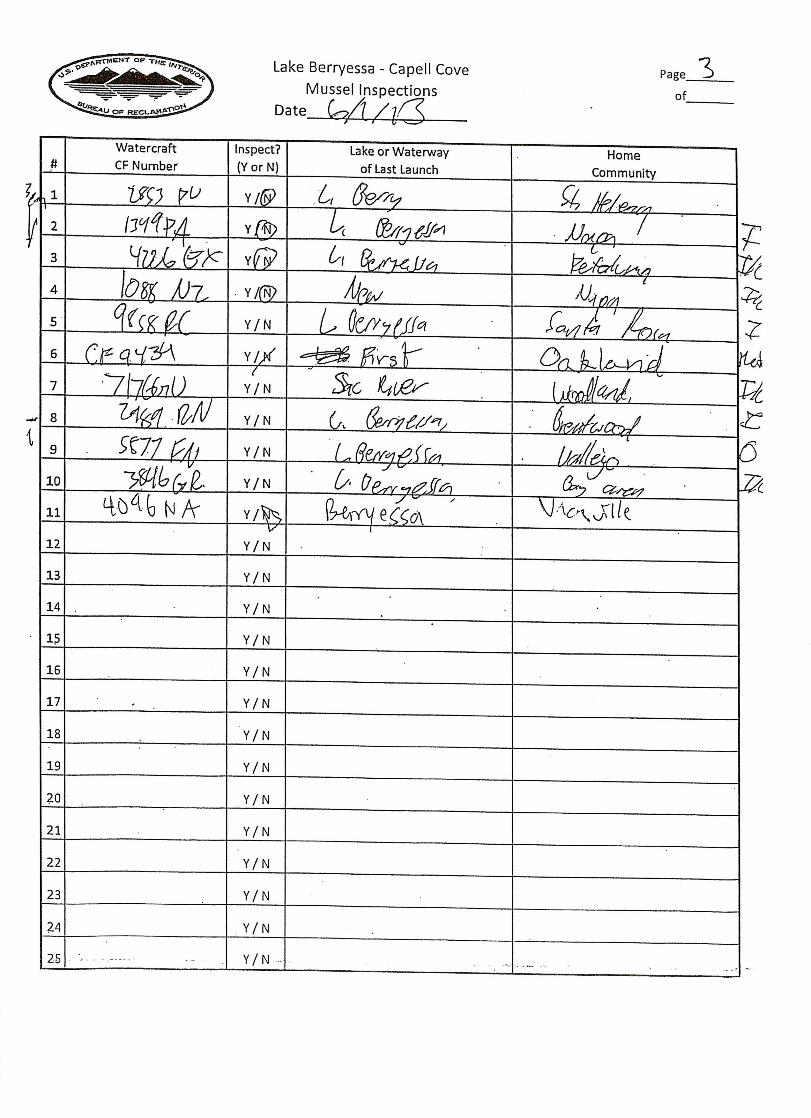
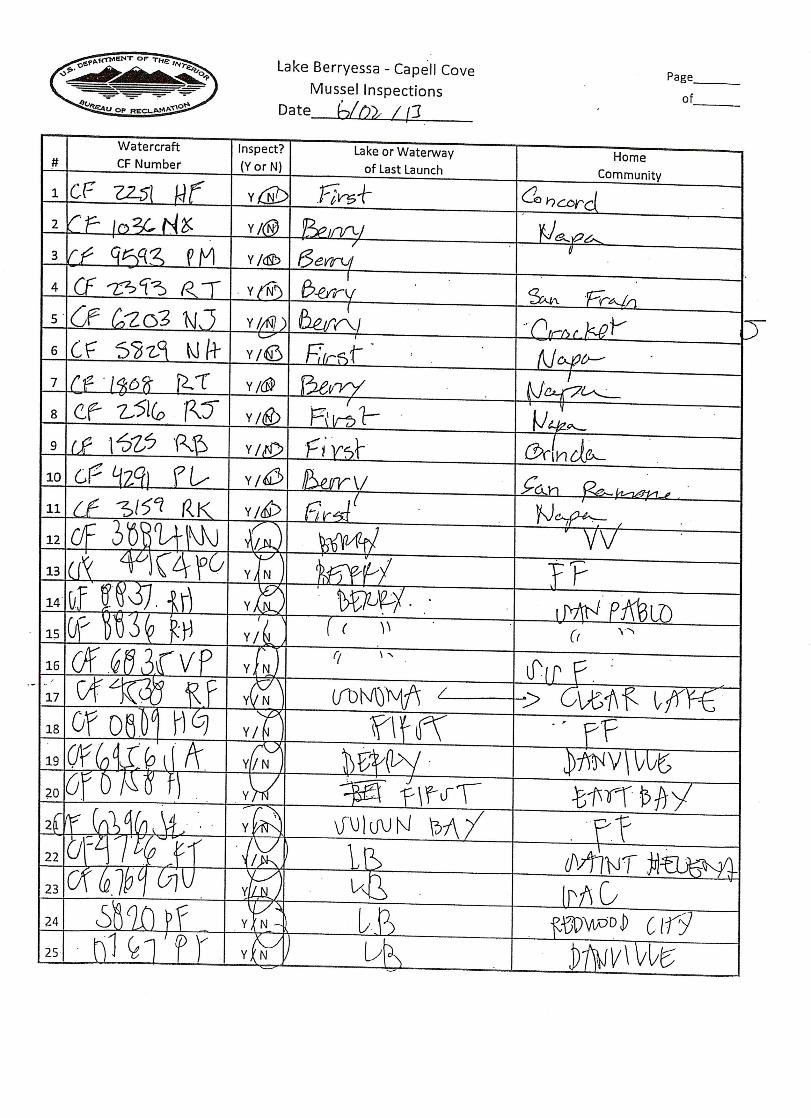
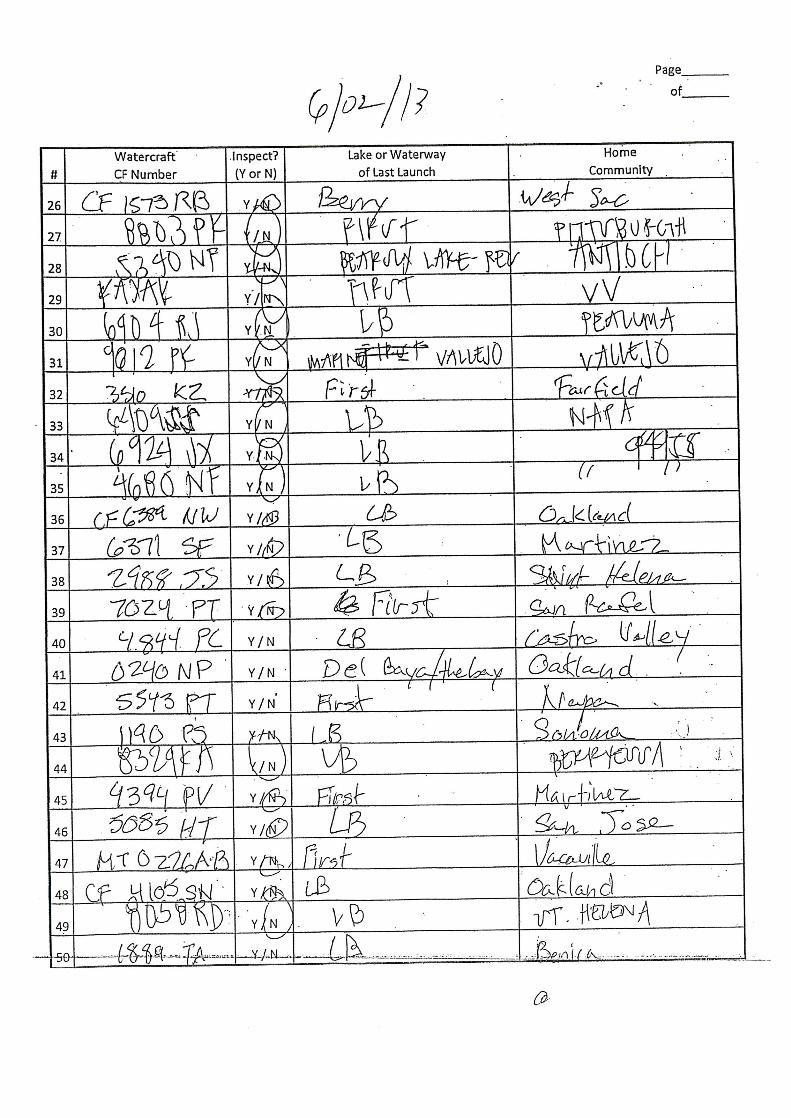
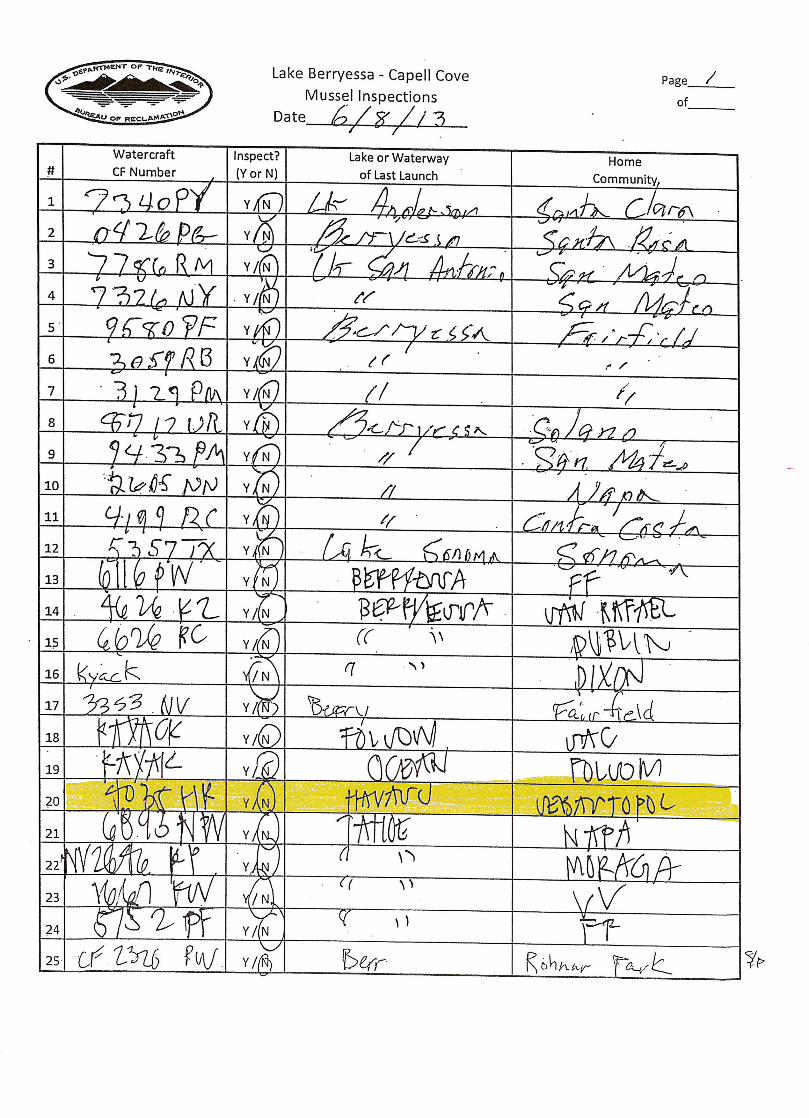
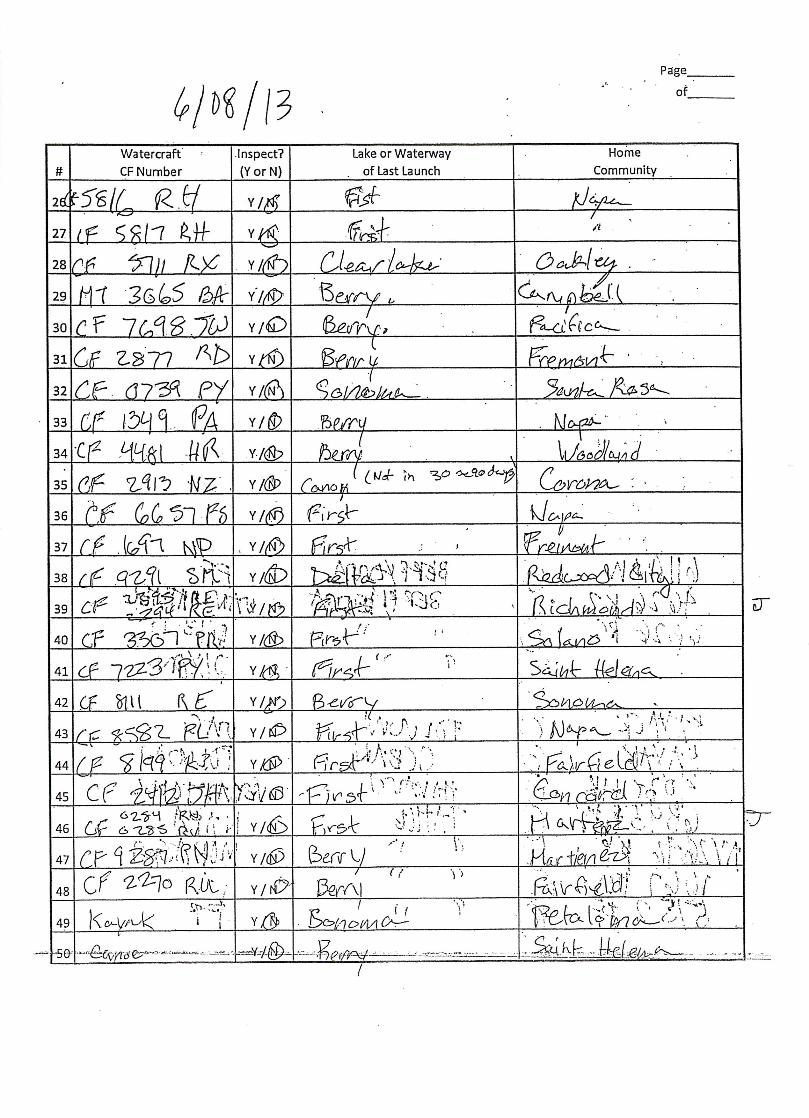
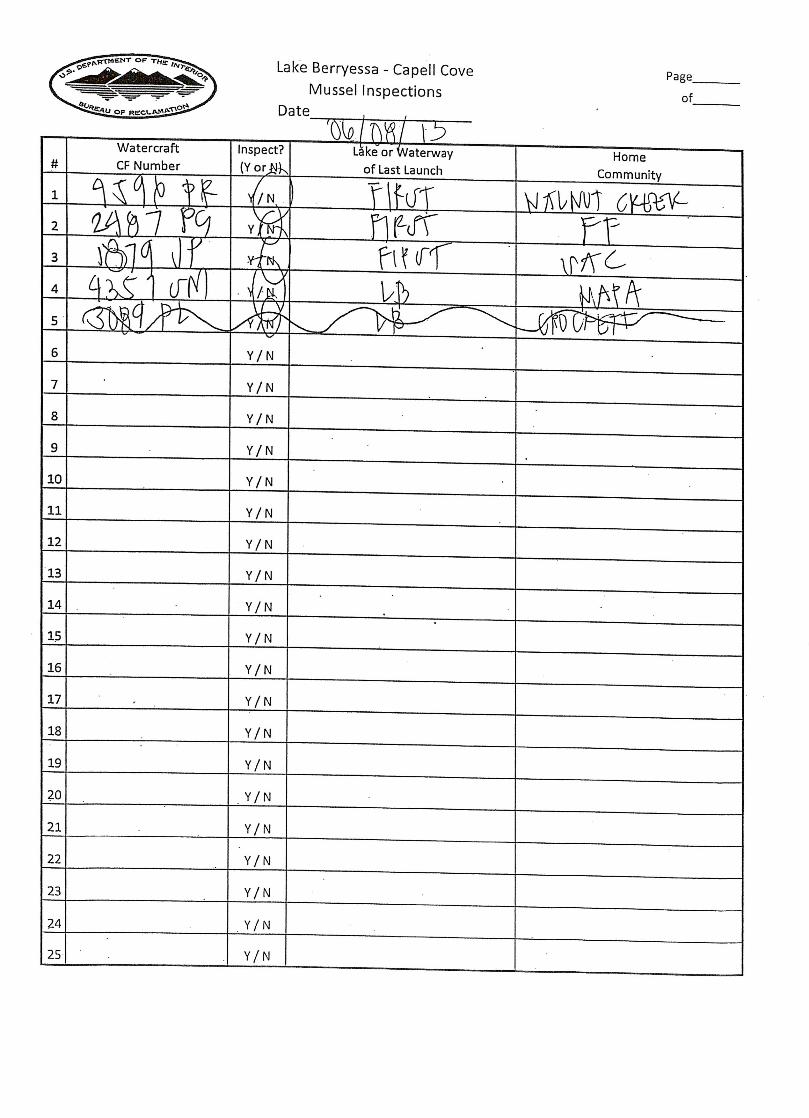
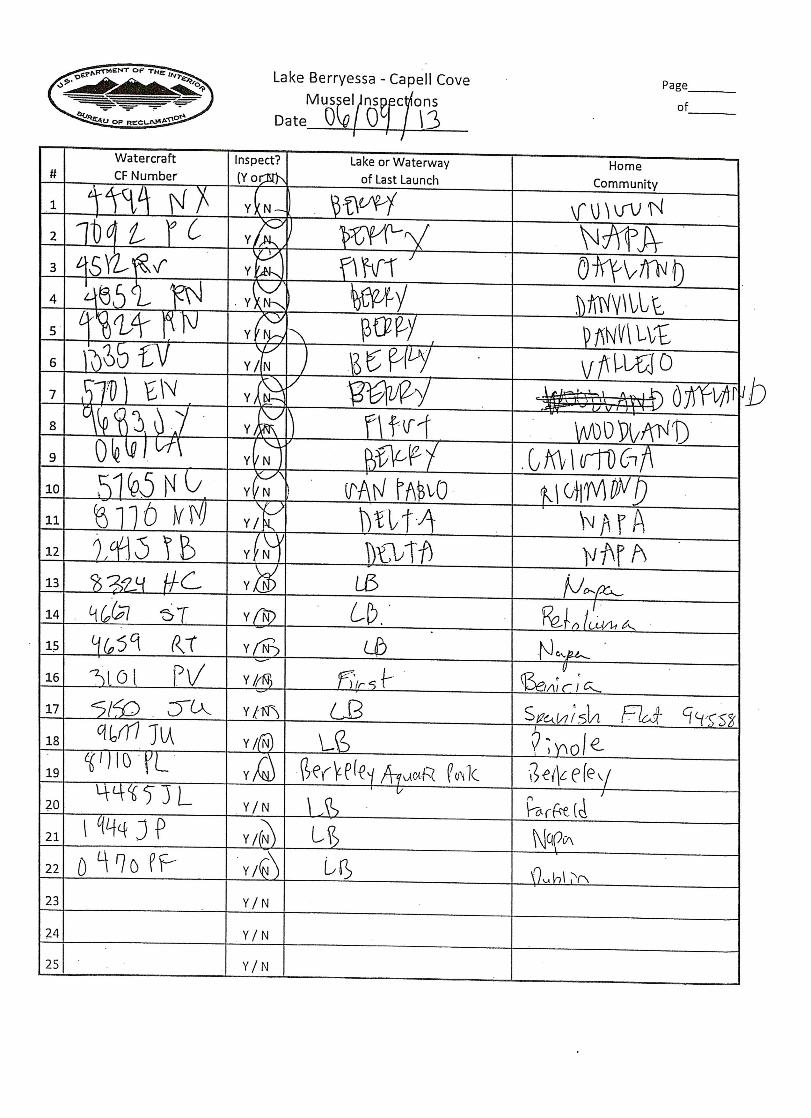
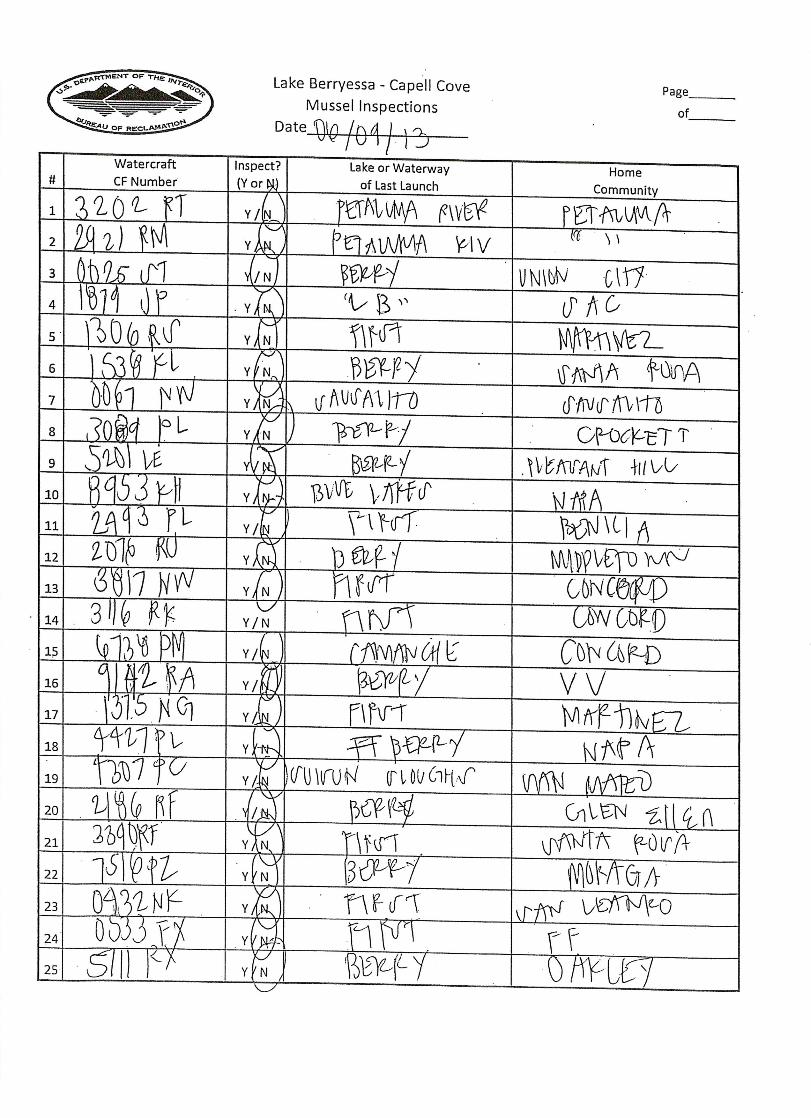
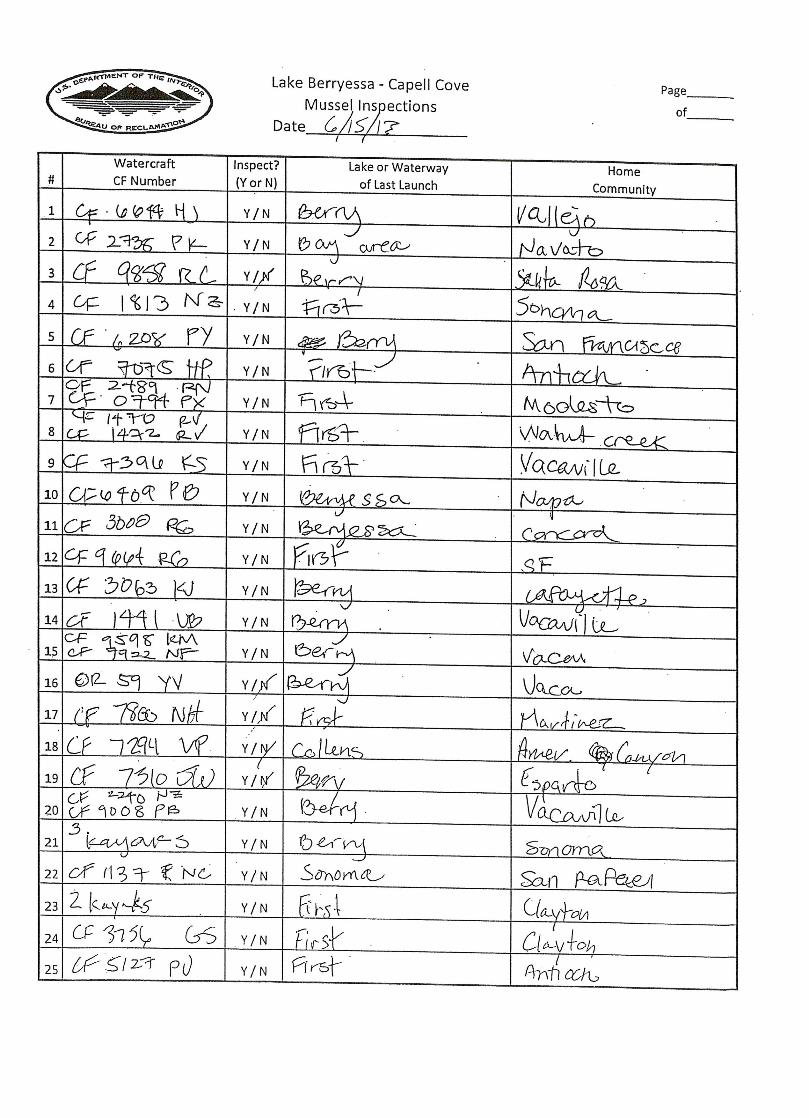
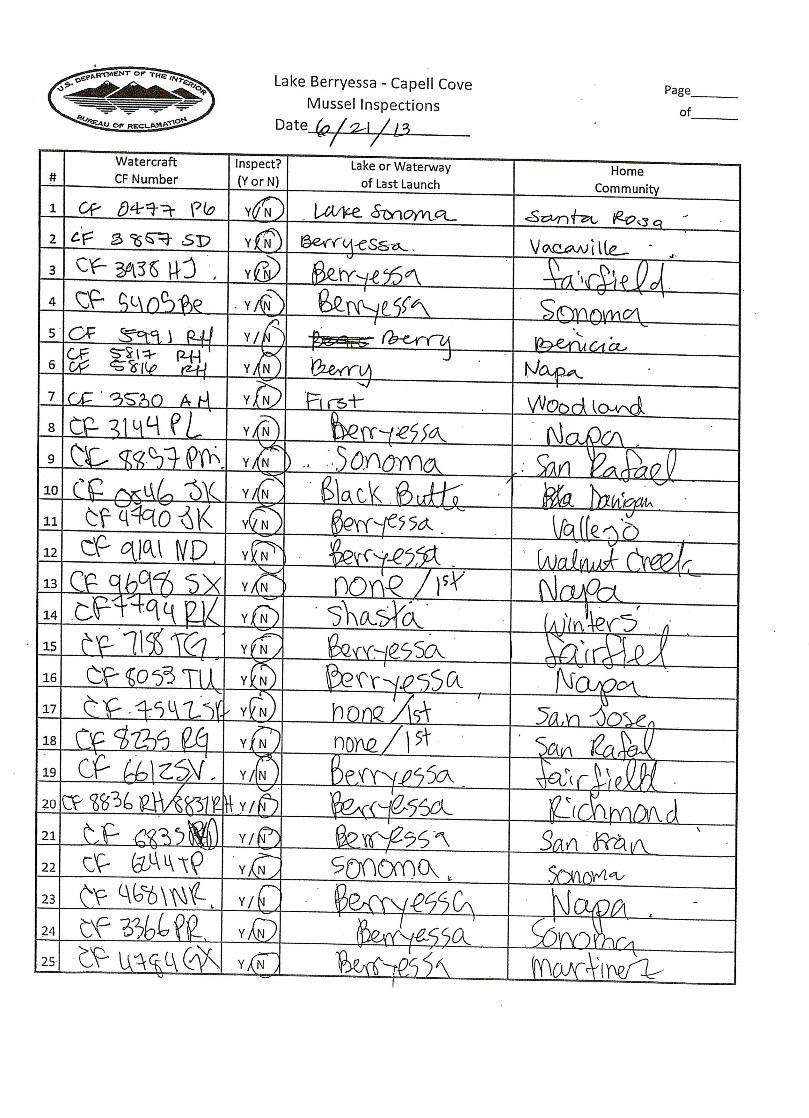
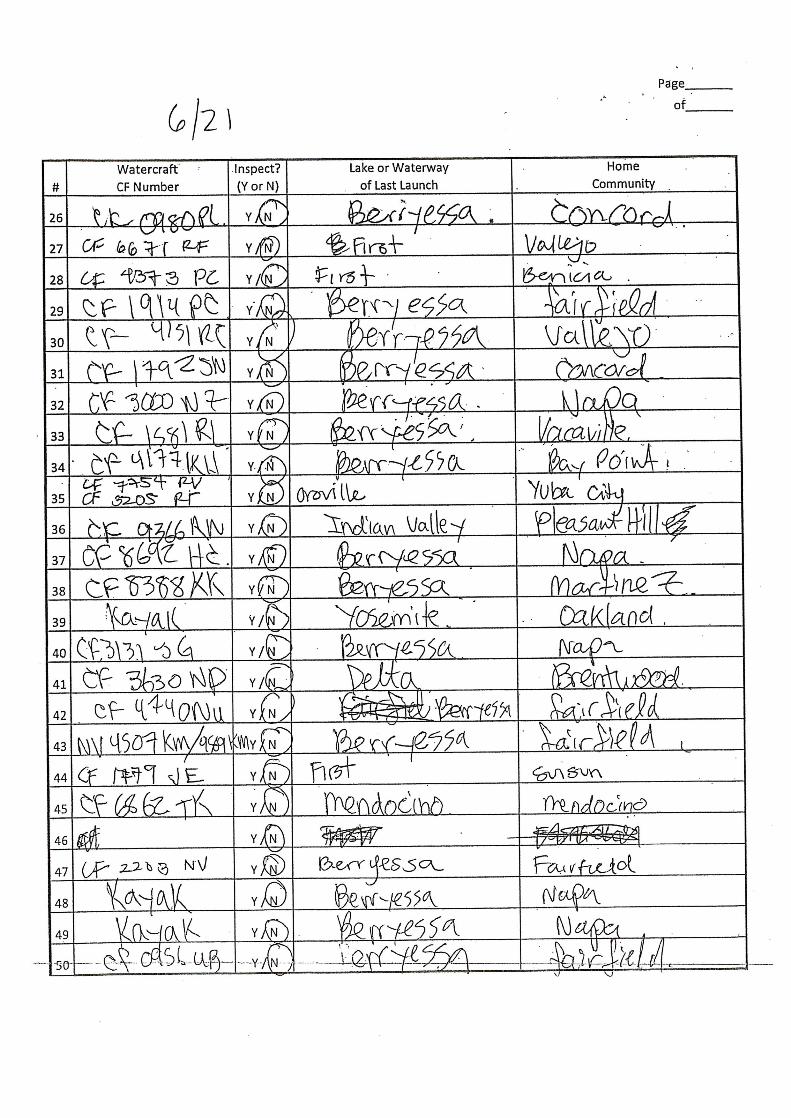
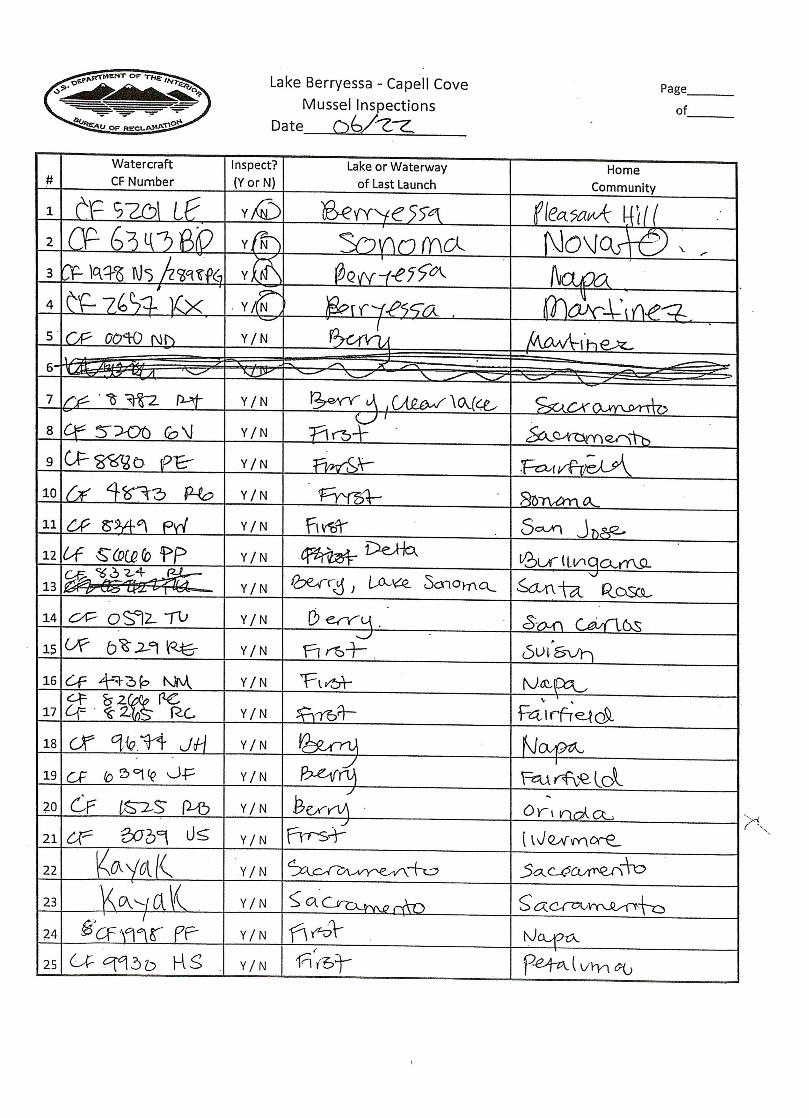
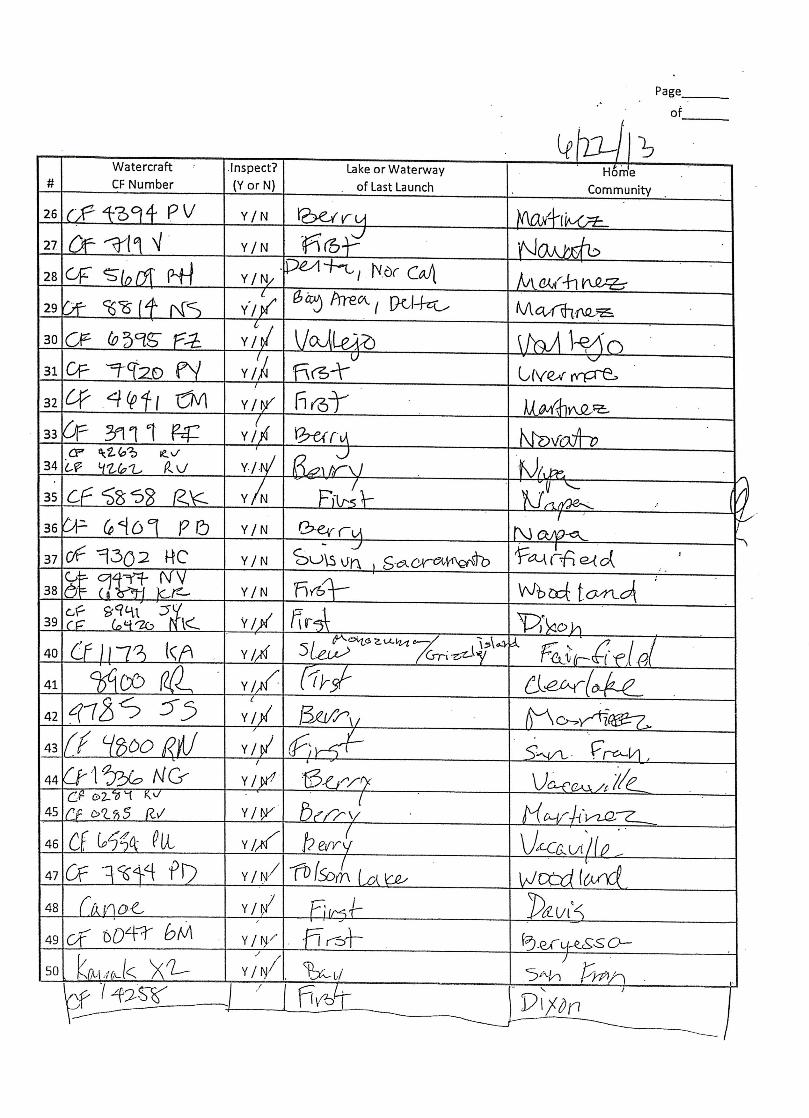
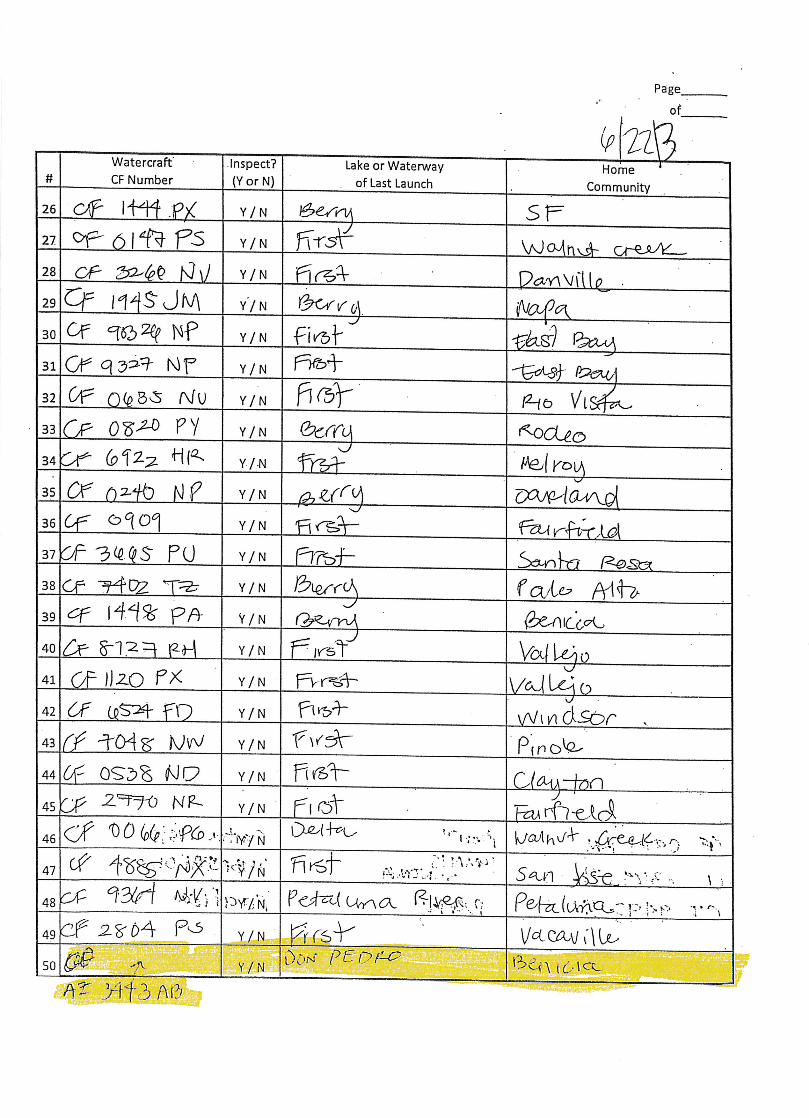
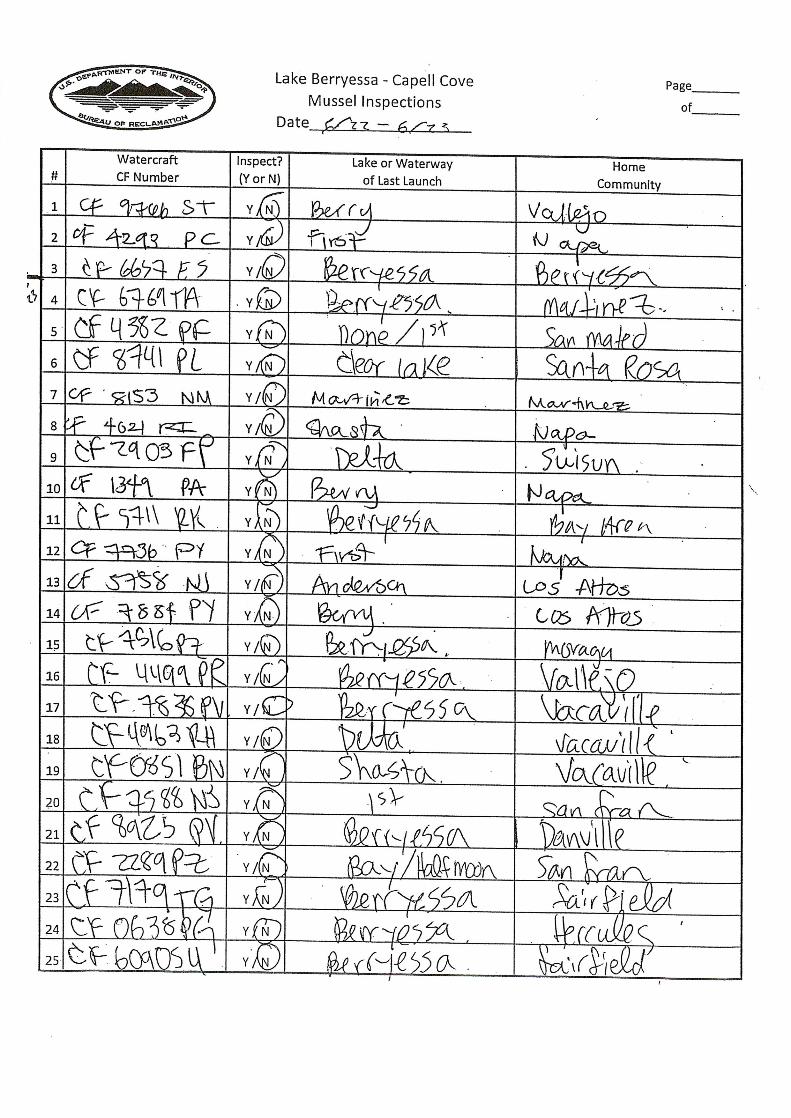
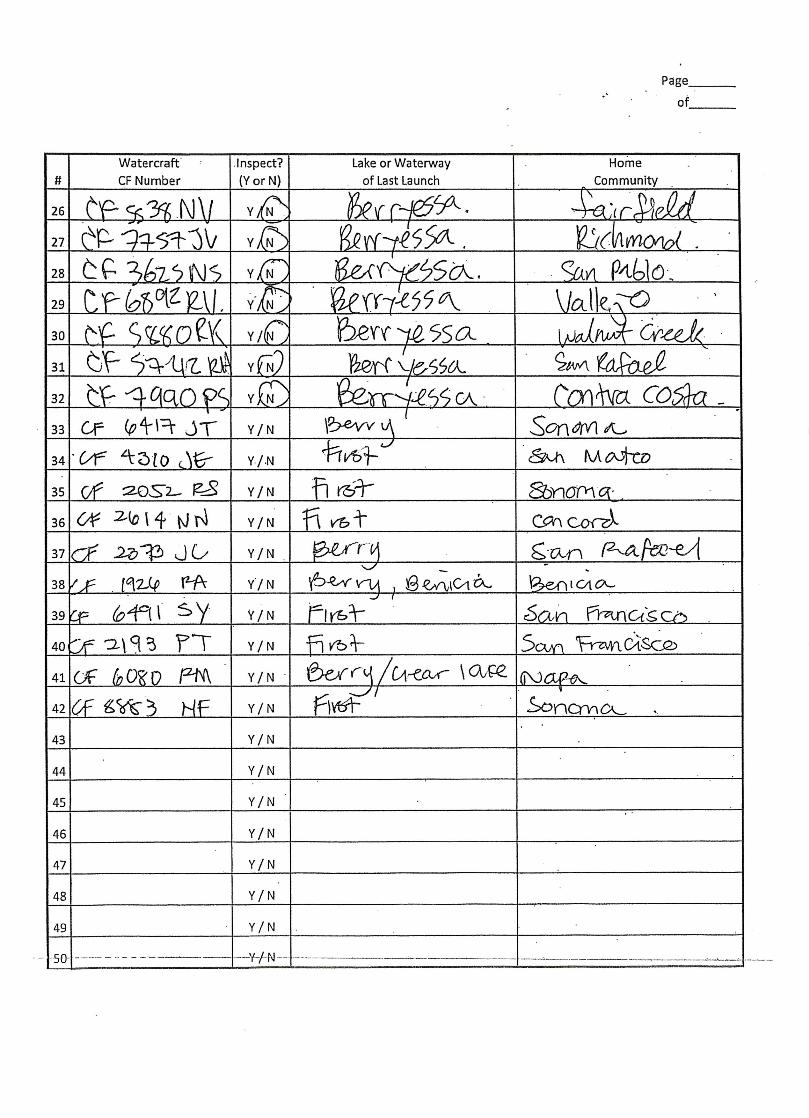
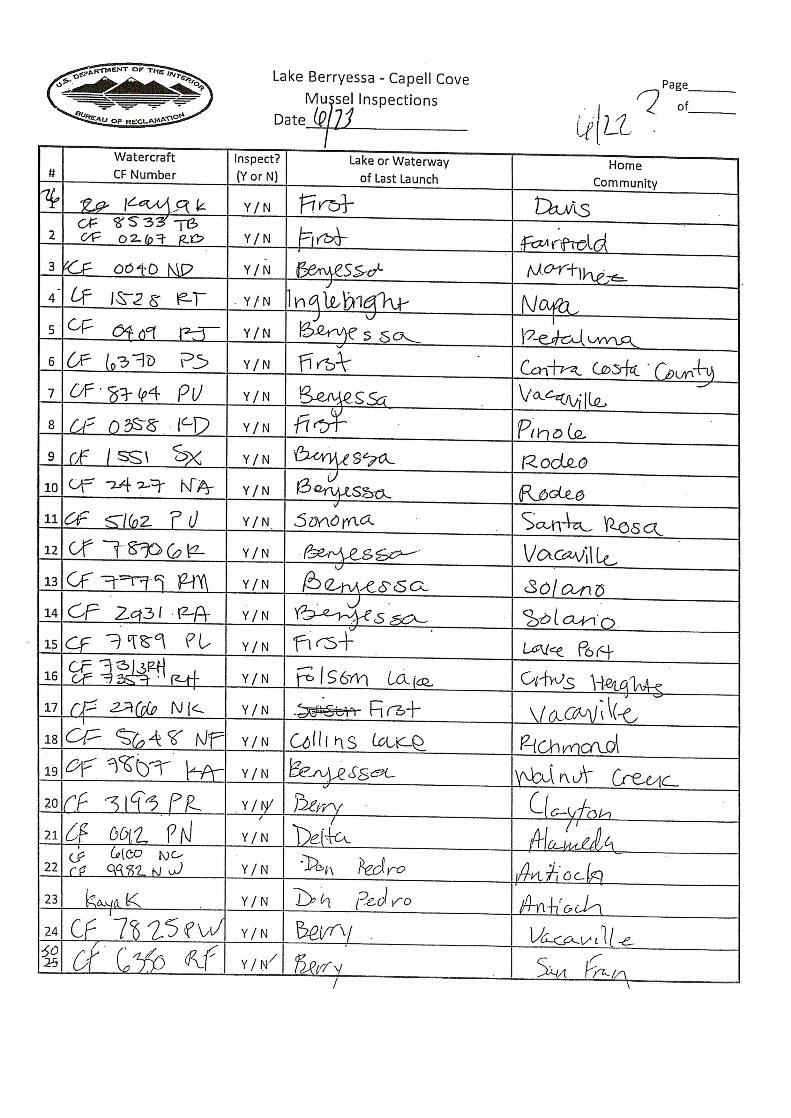
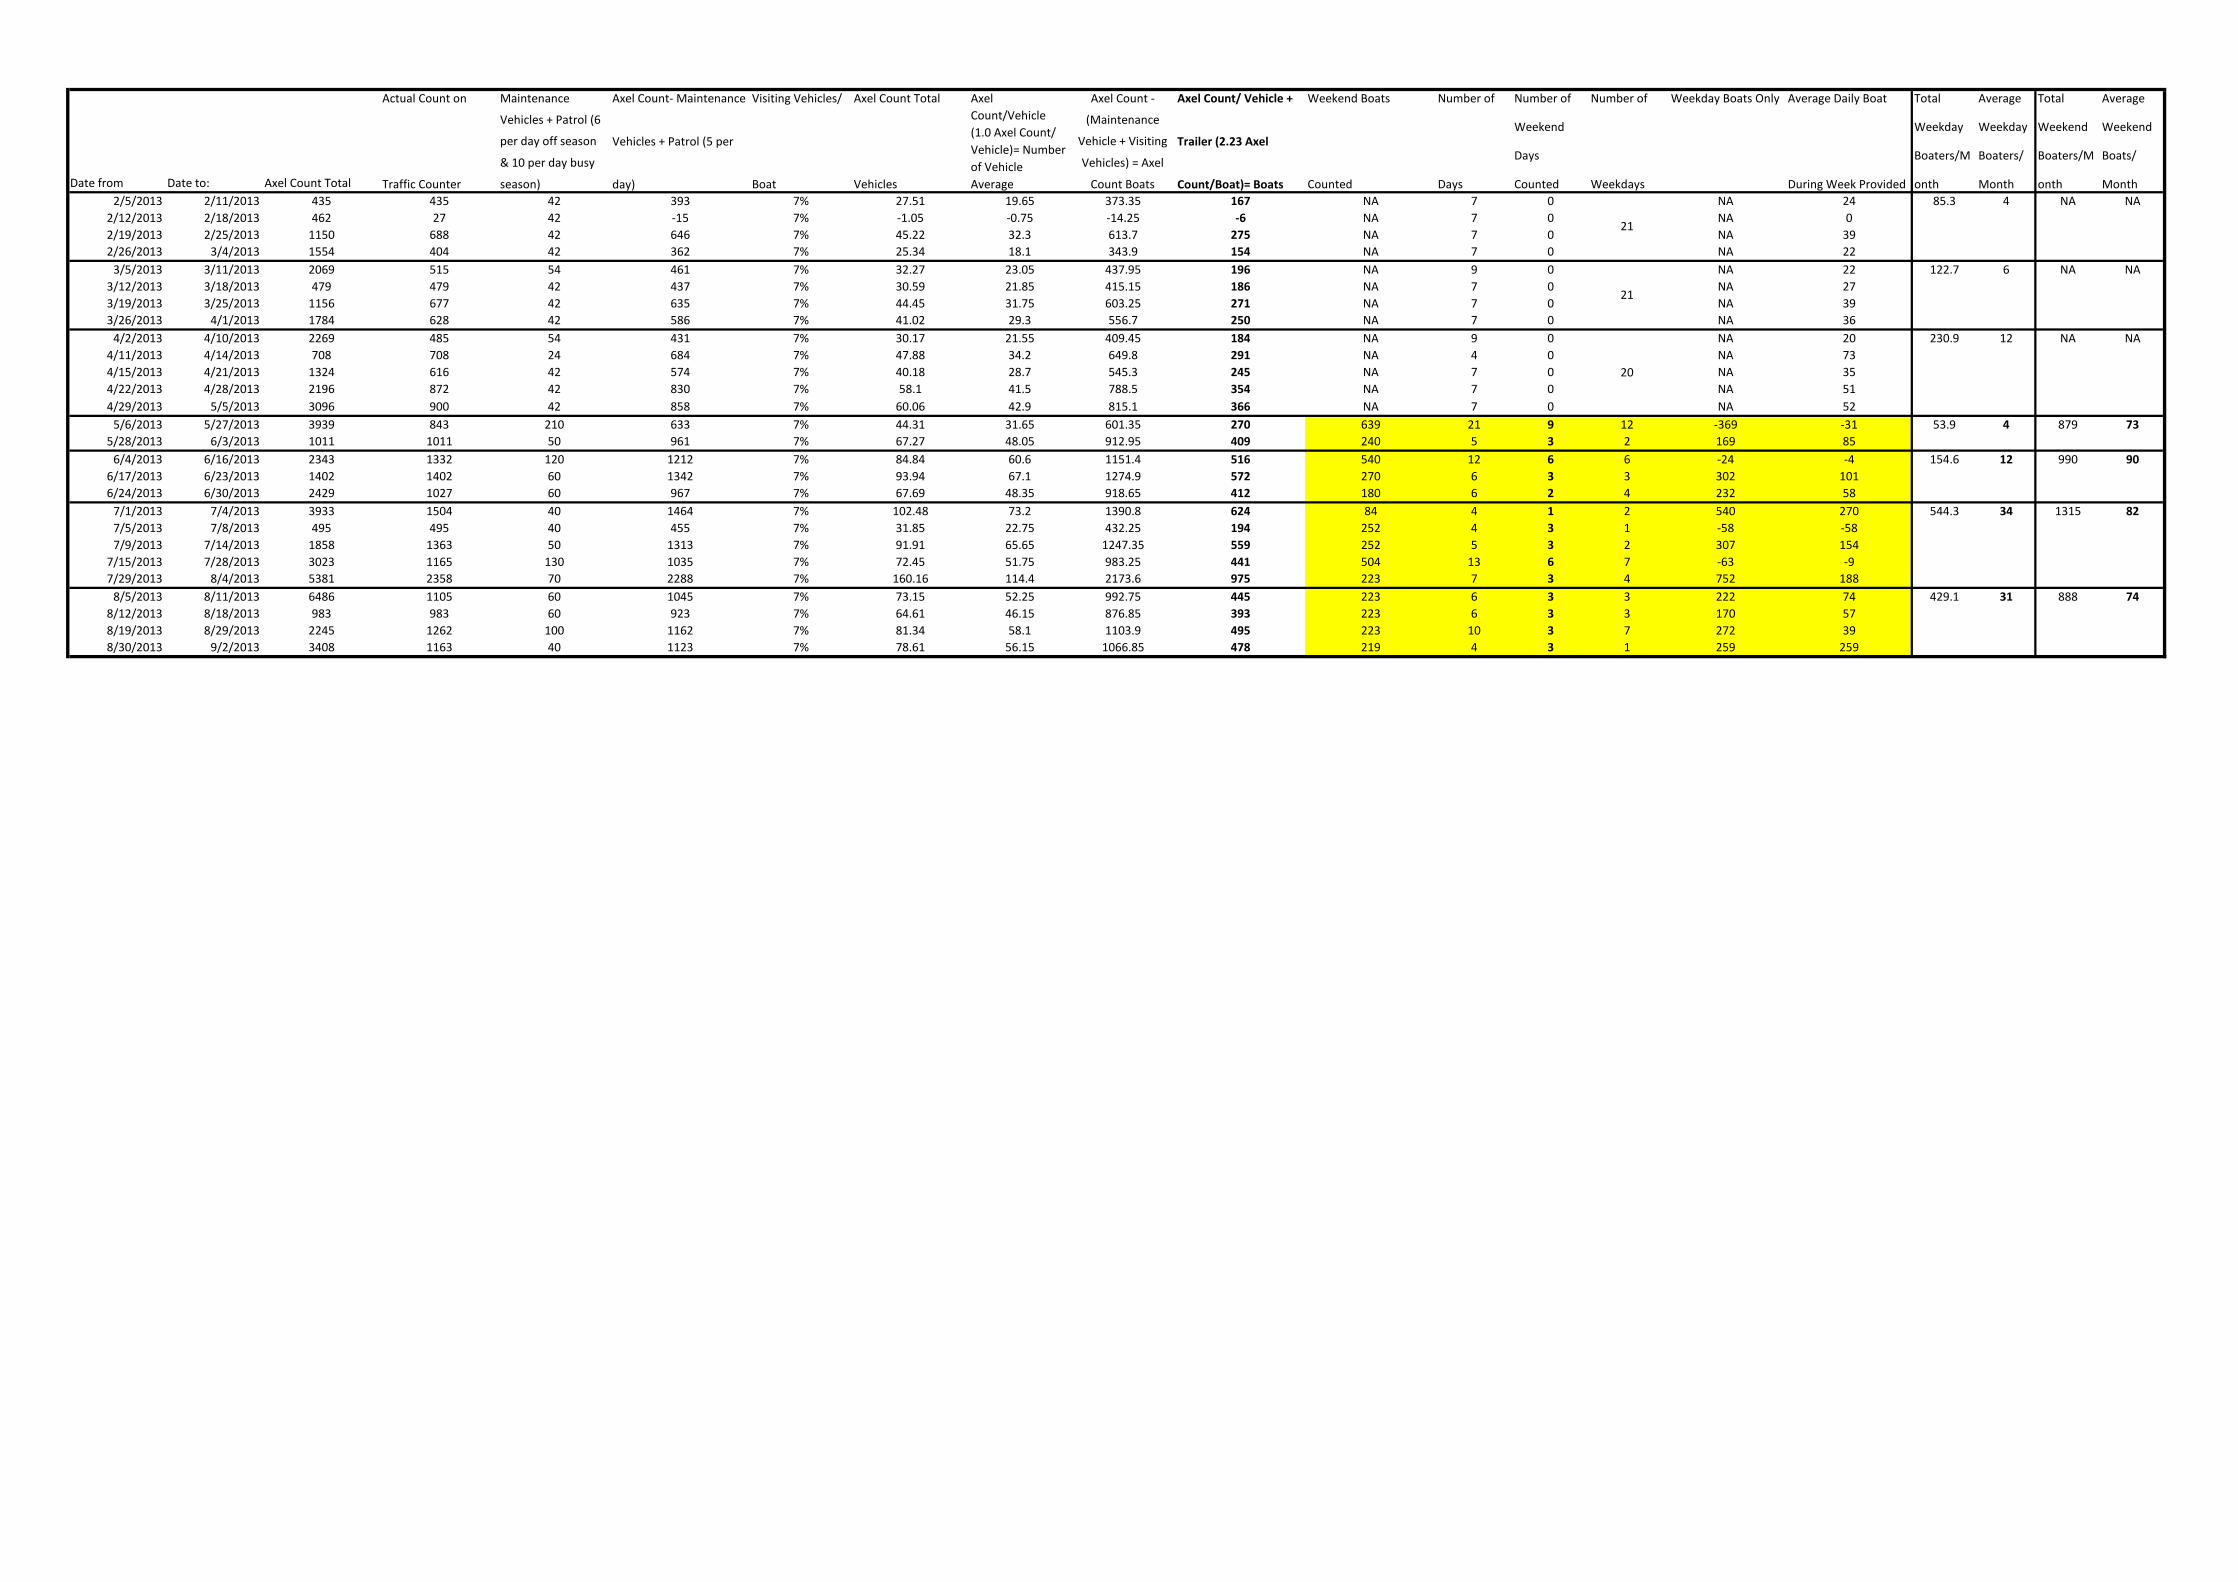


![Early detection of dreissenid species: Zebra/Quagga ... · The adult zebra mussel [Dreissena poly-morpha (Pallas, 1771)] has a definite angle, or carina, between the ventral and dorsal](https://static.documents.pub/doc/80x56/5ede0616ad6a402d666949c7/early-detection-of-dreissenid-species-zebraquagga-the-adult-zebra-mussel-dreissena.jpg)


