44
COLLABORATING TO REPLACE LEAD SERVICE LINES Counting and Communicating the Number and Location of Lead Service Lines

COLLABORATING TO REPLACE
LEAD SERVICE LINES
Counting and Communicating the Number and Location of Lead Service Lines

AGENDA
Background on the Collaborative
Lead Service Line (LSL) Surveys and Materials Inventory – Big Picture
Case study from Washington State on their LSL survey
Case study from Washington DC on their interactive map of LSLs
Communicating LSL information – known and unknown – online
Q & A


Current Members
American Public Health Association
American Water Works Association*
Association of Metropolitan Water Agencies*
Association of State Drinking Water
Administrators
Blue Green Alliance
Children’s Environmental Health Network*
Clean Water Action*
Environmental Defense Fund*
Green and Healthy Homes Initiative
Justice and Sustainability Associates
Learning Disabilities Association of America
National Center for Health Housing
National Association of County and City
Health Officials
National Association of State Utility Consumer Advocates
National Association of Water Companies
National Conference of State Legislatures
National Environmental Health Association
National League of Cities
National Rural Water Association
Natural Resources Defense Council
North East Midwest Institute
RESOLVE*
Rural Community Assistance Partnership
Trust for America’s Health
United Parents Against Lead
Water Research Foundation
* Steering Committee Members

How is the Collaborative funded?
Funding has been provided by the W.K. Kellogg Foundation and the Pisces Foundation.
The Collaborative is currently and will continue to be funded by in-kind contributions from its members.
Funding Sources

SPEAKER INTRODUCTIONS
Scott Torpie
Engineering Advisor, Washington State Department of Health
Maureen Schmelling
Director, Water Quality and Technology, DC Water
Tom Neltner
Chemicals Policy Director, Environmental Defense Fund

LSL Replacement Collaborative October 10, 2018
Tom Neltner
Chemicals Policy Director
Environmental Defense Fund
LSL Surveys and Materials Inventory – Big Picture

AWWA presentation, CEHN webinar; Cornwell et al., 2016. National Survey of Lead Service Line Occurrence. Journal of
American Water Works Association. Estimates there are 6.1 million LSLs in US based on 2013 survey of utilities.

GAO Report on LSL Inventory
• Congress told GAO to examine issue to identify what is known about number of LSLs and how states responded to EPA’s February 2016 letter asking states to work with utilities to publicize LSL inventories.
• GAO released report in September 2018.
• Total number of LSLs is unknown and national, state, and local estimates vary.
– EPA’s Lead and Copper Rule (LCR) does not generally require utilities to maintain complete information about LSLs or report the information to agency.
– Estimates of LSLs exist and those GAO reviewed had significant limitations.
– Methods used to arrive at the estimates vary.
• Most states reported fulfilling EPA’s request, but potential challenges remain that EPA information sharing could help address.
– 43 of 50 states said they would encourage utilities to publicize materials inventories.
– Most large utilities GAO reviewed (100 largest) did not publicize materials inventories as EPA requested.
– EPA identified potential challenges to publicizing materials inventories but has not followed up with all states about how to address challenges since 2016.
• Highlights Massachusetts, Ohio, and Washington State as well as Greater Cincinnati Water Works.

LCR Materials Inventory v. State Survey of Utilities
• LCR materials inventories:
– Limited – Identify sufficient LSLs to meet sampling requirements
– Comprehensive – Identify all LSLs if Lead Action Level exceeded
– CA and MI requiring comprehensive inventories sort of
– LA and TX posting inventories and updates online
• State survey of utilities:
– Counts of LSLs, leaded goosenecks, and unknowns
– Mandatory – IL
– Voluntary – IN, MD, MA, NH, NM, RI, WA
– Other – NC and OH

EDF Blogs on Inventories
• Developing accurate LSL inventories and making them public: Essential tasks – July 17, 2018
• Mandatory LSL inventories – Illinois and Michigan as strong models – July 30, 2018
• LSL inventories – Indiana as a good model of a voluntary survey – July 31, 2018
• Mapping state-level LSL information: Indiana as a model – October 8, 2018
• Map of Indiana – www.edf.org/Indiana-LSL-Map.

We work with others to protect the health of the people of
Washington State by ensuring safe and reliable drinking water.
LEAD COMPONENT SURVEY
Washington State Department of Health
Office of Drinking Water

WA State DOH | 13
Summary
Washington’s Experience:
Non-regulatory approach can be successful.
The Governor’s 2016 Lead Directive gave us entry.
Our survey revealed elimination of LSLs and LSCs
within our state is within reach.
Our large water systems have the capacity and
interest to pursue elimination of LSLs and LSCs.
1

WA State DOH | 14
Governor’s Directive 16-06
Signed May 2, 2016, directing state agencies to:
Address lead exposure in schools, child care settings,
and rental properties.
Improve state’s blood lead monitoring program.
Work with each water system to identify all lead
service lines and lead components within two years.
Work with stakeholders to develop policy and
budgetary proposals with goal of removing all lead
service lines and lead service components in water
systems within 15 years.
2
WA State DOH | 15
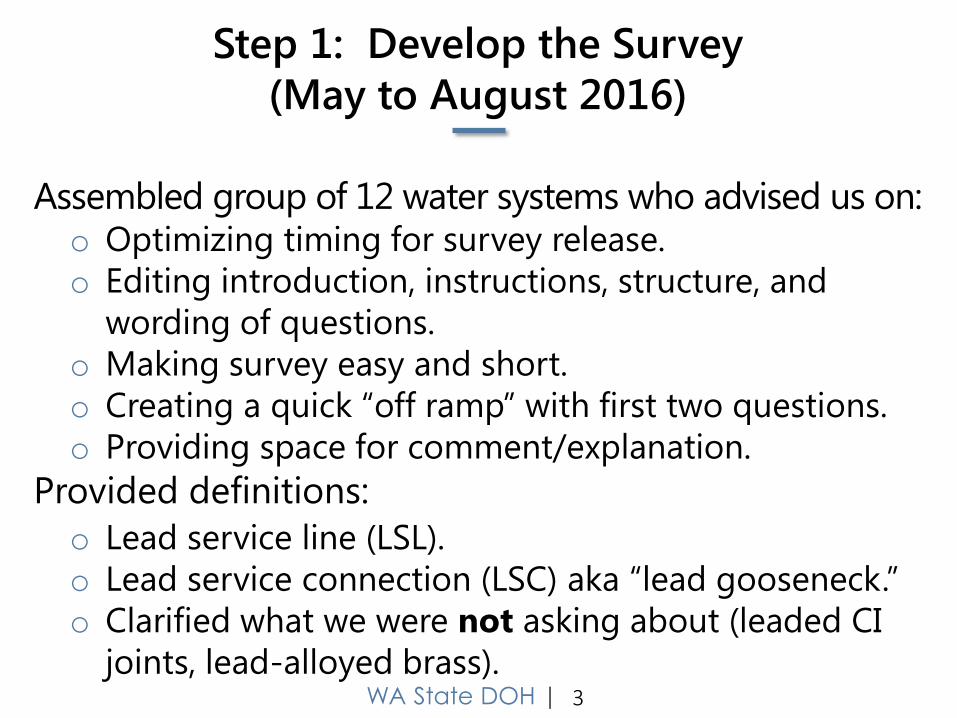
Step 1: Develop the Survey
(May to August 2016)
Assembled group of 12 water systems who advised us on: o Optimizing timing for survey release.
o Editing introduction, instructions, structure, and
wording of questions.
o Making survey easy and short.
o Creating a quick “off ramp” with first two questions.
o Providing space for comment/explanation.
Provided definitions:
o Lead service line (LSL).
o Lead service connection (LSC) aka “lead gooseneck.”
o Clarified what we were not asking about (leaded CI
joints, lead-alloyed brass). 3

WA State DOH | 16
Step 2: Conduct the Survey
(Sep. 2016 to Feb. 2017)
Marketed the survey.
Sent electronic survey to nearly all 4,100 water
systems.
Called each nonresponding water system serving
1,000+ connections.
Informed utilities survey results would be made public.
Wrote initial summary of survey findings.
Wrote full survey report.
4

WA State DOH | 17
Step 3: Review the Data
(April to June 2017)
686 water systems responded (17 percent).
Who we heard from and didn’t hear from.
Five water systems reported known or est. LSLs. o 916 LSLs (0.04% of connections).
Fifteen water systems reported known or est. LSCs. 6,370 LSCs (0.28% of connections).
Forty water systems serving more than 1,000
connections reported “unknown” for LSLs and/or
LSCs.
5

WA State DOH | 18
Step 4: Post-Survey Follow-up
(June 2017 to March 2018)
Sent survey report to DOH Secretary, Governor’s Office,
and the public through web page and publications
(October 2017).
Follow-up phone interviews (Jan to Mar 2018):
All systems reporting known or estimated number of
LSLs and/or LSCs.
Systems with 1,000+ connections answering
“unknown” for estimated LSLs and/or LSCs.
6

WA State DOH | 19
Step 5: Revise Survey Data: LSLs
(April to June 2018)
Of the five systems that originally reported LSL
estimates:
Three revised their original estimate to zero LSLs.
One completed replacement of all known LSLs.
One considers the original estimate of 300 LSLs
still valid.
LSL estimates constitute 0.01% of survey
respondent service connections.
7

WA State DOH | 20
Step 5a: Revise Survey Data: LSLs [Continued]
Of the 32 systems that originally reported “unknown”
LSLs:
Twenty-seven systems have no reason to believe
they have any active LSLs and changed their
answer to “none.”
Five systems believe there are a small number of
LSLs still in service, but have no basis to provide an
estimate.
8

WA State DOH | 21
Step 5b: Revise Survey Data: LSCs
Of the 15 systems that originally reported LSC
estimates:
Estimates changed based on work they’ve done over
the past 12 months. Total estimated is about 5,000
LSCs.
LSC estimates constitute 0.21% of survey respondent
service connections.
All but one system is interested in funding support
to replace their lead goosenecks and the old water
mains attached to them.
9

WA State DOH | 22
Step 5b: Revise Survey Data: LSCs [Continued]
Of the 30 systems that originally reported “unknown”
LSCs:
Eighteen systems have no reason to believe they
have any active LSLs.
Twelve systems believe LSCs are or might be still in
service but cannot estimate or quantify number.
Published update to the summary of survey findings.
10

WA State DOH | 23
Step 6: Funding LSL and LSC Replacement
(Fall 2018)
DWSRF Eligibility Criteria.
All work performed within 500 feet of a replaced
LSL or LSC is eligible for reimbursement. Eligible
work includes service line (main to the meter) and
water main replacement, regardless of pipe
material; OR…
At least 50.1% of the total service line replacement
costs (from main to the meter) are associated with
LSL or LSC removal and replacement.
11

WA State DOH | 24
What We Learned
Washington’s large utilities don’t have many active
LSLs. Small utilities have few, if any.
Gov’s Directive and survey gave us entry to
communicate with large utilities.
Despite no state authority to require lead
identification and removal, large utilities are
committed to doing so.
Surveys need follow up.
Uncertainty has to be acceptable.
12

WA State DOH | 25
Conclusions
Governor’s Initiative drove the survey.
Utilities doing much more than we knew.
Operators want to affect positive change in their
community.
Large utilities cooperated and were forthcoming.
Survey supported and, in some cases, trigged action.
The only help utilities need is money.
The survey helped align our loan program with
utility needs.
13
Service Line Map for
Public Use
Maureen Schmelling
Director of Water Quality and Technology
DC Water
1

Presentation Outline
View the Map
Sources of data
Translation of data for the map
Disclaimer
2
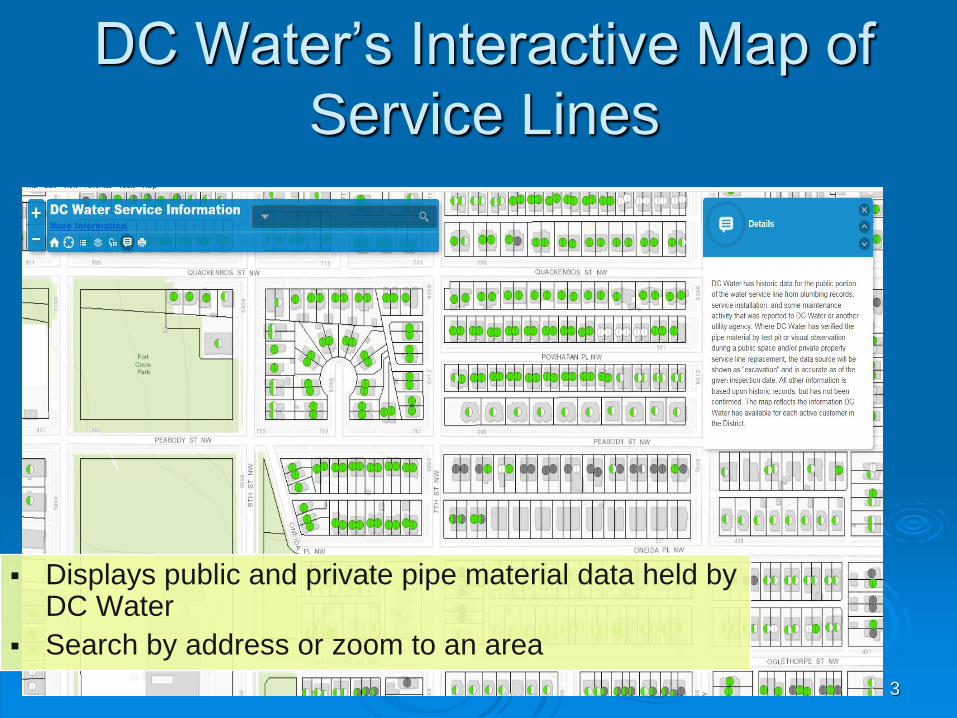
DC Water’s Interactive Map of
Service Lines
3
Displays public and private pipe material data held by DC Water
Search by address or zoom to an area

Service Line Sections
4

Sources of Data
Historical
Tap cards
EPA 1991 LCR Study
Researched beyond tap cards
5
Construction
Service line replacements, leak repairs
Meter pits
Service lines might be visible (DC’s are not)

Sources of Data (cont.)
Resident supplies information
Picture of pipe breaking through wall
• POE – update private side only
Documentation from plumber /
contractor
Verbal – do not update records
6
Copper Pipe – POE not visible
-Lead still possible Lead Pipe

Translating Data to Public
Information
7
Data Source
Public Service
Type
Tap Date /
Type of Work
Website Service Type
Viewed by Public Website description
Customer Service Copper <1985 or Null Copper Assess further for confirmation
Customer Service >=1985 Copper Copper likely based on water service connection yr
Customer Service Lead Lead likely Lead likely based on historic documentation
Customer ServiceNon-lead by
sizeNon-lead
Service line has 2" or greater diameter, therefore
not lead
Meter Changeout Copper Copper Assess further for confirmation
Service Replacement Copper Replacement Copper Service pipe replaced [insert date field]
Inspection Copper Test pit Copper [insert date field] excavation revealed copper pipe
Inspection Lead Test pit Lead [insert date field] excavation revealed lead pipe
Historical data Copper Copper Copper likely based on historic documentation
Historical data Lead Lead Lead likely based on historic documentation
Service Tap Copper Copper New service installed [insert date field]

Translating Data – Private Side
8
Data Source Private Service Type
Website Service
Type Viewed by
Public Website description
Customer Copper Copper Customer reported copper on private side or entering
home
Service
Replacement Lead Lead
Connected pipe in public space to lead pipe at the
property line
*Customer reported data is only reported when pictures or
plumber documentation is provided

Disclaimer for Data
9

10

Closing Remarks
Most data are not perfect, but still useful to
share
Plan for receiving information from
residents
Create business rules for updating
information
11

LSL Replacement Collaborative October 10, 2018
Tom Neltner
Chemicals Policy Director
Environmental Defense Fund
Communicating LSL information – known and unknown – online

Basic concepts
• Property sale or rental is prime opportunity to replace LSL, either proactively or as part of mortgage
• Utilities on-line maps and customers notices provide incentive to property owners to proactively replace or disclose to potential homebuyers and renters
• EPA LCR revision may require notice to property owners of some form

EDF/Cornell behavioral studies
Prospective Tenant
Home Inspector
Property Owner
Utility General Public
Prospective Homebuyer
Study 1
Study 2a Study 2b

Online, address-specific estimates
Cleveland
PDF Map
Cincinnati
Interactive
Map
Columbus
Interactive
Map
Cleveland
Database

Comparison of four tools
Tool Map
Individual
addresses or
buildings
displayed
Public Side
Info
available
Private Side
Info
Available
Indicates When
Material is
Unknown
Cleveland
PDF Yes, static No Yes No No
Cincinnati
Interactive Yes,
dynamic Yes Yes Yes Yes
Columbus
Interactive Yes,
dynamic Yes Yes No No
Cleveland
Database No Yes Yes No No

Which tool do you prefer?
• Respondents had seen three of the four tools.
• Everyone saw the Cleveland tools, but only one of the interactive maps (Cincinnati or Columbus).
Rank Group that saw Cincinnati
map Group that saw Columbus
map
1 Cincinnati
53.5% Cleveland Database
62.2%
2 Cleveland Database
37.0% Columbus Map
22.9%
4 Cleveland PDF
9.5% Cleveland PDF
14.8%
(% of respondents in that group that chose that map as their preference)

Our takeaways on utility communication tools
• Provide information about specific properties.
• Provide information on the private side, in addition to the public side, of the service line.
• Be explicit about what is not known.
• Consider the legend, colors, and icons carefully.

QUESTIONS?
www.lslr-collaborative.org


