Page 1
University of Nebraska - LincolnDigitalCommons@University of Nebraska - Lincoln
Library Philosophy and Practice (e-journal) Libraries at University of Nebraska-Lincoln
2014
Collaboration trend in Indian Business-Management research: A bibliometric perspectiveRakhi V [email protected]
Follow this and additional works at: http://digitalcommons.unl.edu/libphilprac
Part of the Business Commons, and the Library and Information Science Commons
V S, Rakhi, "Collaboration trend in Indian Business-Management research: A bibliometric perspective" (2014). Library Philosophy andPractice (e-journal). 1139.http://digitalcommons.unl.edu/libphilprac/1139
Page 2
1
Introduction
Collaboration is a significant factor in scholarly productivity. It is a process in which
knowledge and innovation flow among scientists, and individual scientists thus acquire
access to new ‘‘capital’’ directly through collaboration between individuals and indirectly
through the collaborators of their collaborators (Yin et al. 2006). Katz and Marin (1997)
define research collaboration as ‘the working together of researchers to achieve the common
goal of producing new scientific knowledge’. Research collaboration is a key mechanism that
links distributed knowledge and competencies into novel ideas and research avenues (Heinze
and Kuhlmann 2008). In other words, research collaboration connects different sets of talents
to produce a research output. Bordon & Gomez (2000) indicates that one among the various
reasons for the growth in collaboration is the increasing specialization within disciplines,
such that multiple partners are often needed to tackle complex research problems. Another is
economics, given the need to amortize expensive laboratory equipment, computers, data, and
other resources across multiple researchers and projects. Yet another is sources of funding
that encourage larger projects (Bordons & Gomez, 2000). There is ample evidence that
collaboration is a key factor influencing research productivity, and academics that prefer
independent or collaborative work tend to show differences in productivity as measured by
research publication (Katz & Martin, 1997). But the productivity counts may vary based on
the method of allocating authorship (one credit for each publication vs. partial credit based on
number of authors, etc.).Tibor Braun et al.(2001) has studied on the relation between the
productivity and co-operativity (collaboration) of authors in neuroscience journals and found
that there is a peak of productivity around the co-operativity value of 4-5 (papers with 5-6
authors). Persson et.al (2004) points that if productivity (papers per author) is growing faster
than the number of publications then an intensifying scientific collaboration and an increasing
density of co-publication networks is the only possible explanation.
Collaboration in Business Management
Collaboration is also to a large extent dependent on the characteristics of the research field.
Frame and Carpenter (1979) state that the fact that most disciplines differ in their
epistemological and methodological characteristics makes research collaboration a complex
matter. The nature of the discipline can restrain as well as encourage the degree of
collaboration. There are large differences across various academic disciplines with respect to
the extent of co-authorship in scholarly publishing. According to (Bordons & Gomez, 2000;
Page 3
2
Meadows, 1998 number of publications vary by discipline, so do collaborations and
coauthorships. Solo research is the norm in some disciplines, particularly in the humanities,
social sciences, and business (soft disciplines). Joint authorship is closely connected to
teamwork in research, which is much less common in soft sciences compared to hard
disciplines such as natural sciences, engineering, and medical science. (Kyvik, 2003).
Collaboration is a form of boundary crossing between disciplines (Pierce, 1999; Qin,
Lancaster, & Allen, 1997). As business management is of cross disciplinary in nature which
engulfs both social science and technology as it bears significant collaboration between
researchers of both social science and technological subjects and can be considered as a
bridge connecting the two fields. With the growth of multidiscipline/cross-discipline
collaboration, team members engage in more diverse types of academic interaction, conflict
resolution, and accountability.
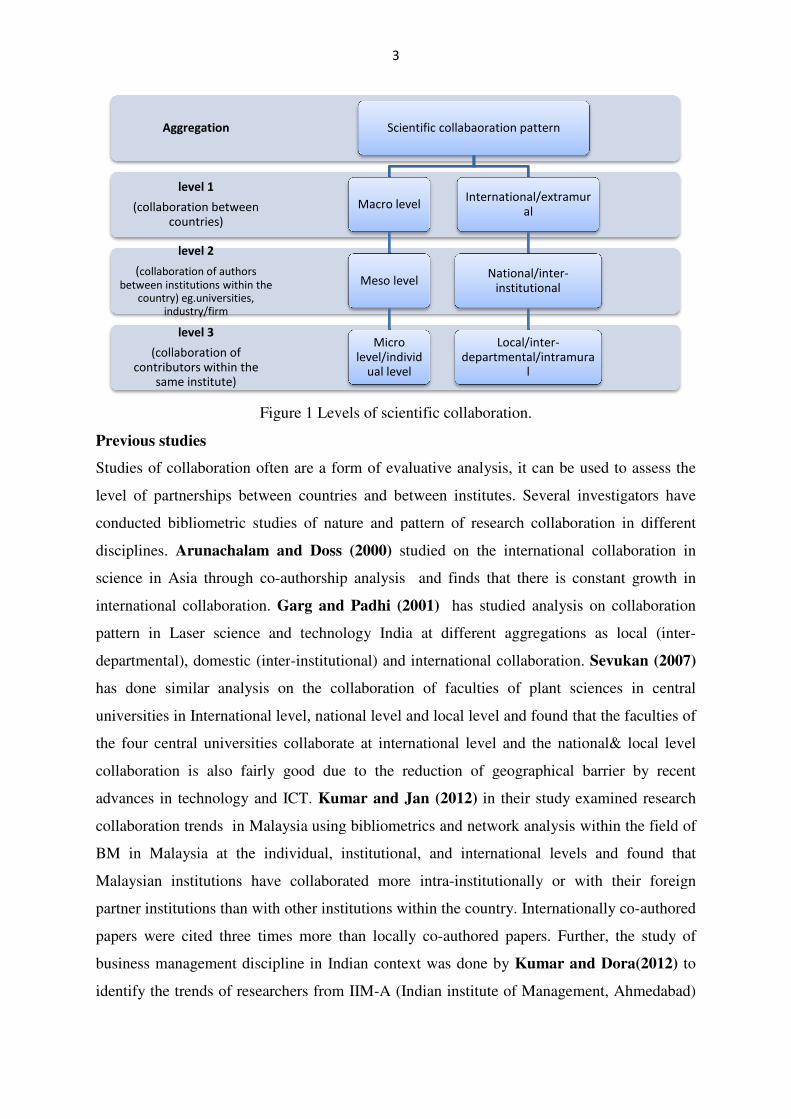
Facets and structure of scientific collaboration
Scientific collaboration is a complex social phenomenon in research that has been
systematically studied since the 1960s. ). Bibliometric methods offer a convenient and non-
reactive tool for studying collaboration in research by co-authorship statistics. Bibliometric
studies of collaboration generally assesses the scientific cooperation between scholars usually
as evidenced by number of co-authors(individual), between institutes(institutional) and
between countries(international) of collaborating institutes. According to Persson et.al.(2004) Scientific collaboration as measured by means of co-authorship patterns has considerably
increased during the last decades and studied at all levels of aggregation.Many of the
researchers have studied the collaboration at different levels such as macro level
Glanzel(2001, meso level) Gomez(1995) and micro level (Ding, 1999); Glanzel, 2002).
Kretschmer (1997) has analysed aspects of social stratification in scientific collaboration at
the micro (individual) level and finds that extramural collaboration is characterised by
similarity of the social status whereas intramural collaboration shows significant differences
of the social status of the co-authors. Co-operation between different sectors such as
university(academic), industry and government(non-academic) is studied as a sectoral
collaboration. Institutional collaboration is shaped by institutional sectors (scientific co-
operation between universities and between firms, respectively) and this collaboration across
sectors is characterized by regional or national peculiarities.
Page 4
Figure 1 Levels of scientific collaboration.
Previous studies
Studies of collaboration often are a form of evaluative analysis, it can be
level of partnerships between countries and between institutes. Several investigators have
conducted bibliometric studies of nature and pattern of research collaboration in different
disciplines. Arunachalam and Doss (2000)
science in Asia through co-authorship analysis and finds that there is constant growth in
international collaboration. Garg and Padhi (2001)
pattern in Laser science and technology In
departmental), domestic (inter
has done similar analysis on the collaboration of faculties of plant sciences in central
universities in International level, national level and local level and found that the faculties of
the four central universities collaborate at international level and the national& local level
collaboration is also fairly good due to the reduction of geographical barrier by recent
advances in technology and ICT.
collaboration trends in Malaysia
BM in Malaysia at the individual, institutional, and international levels
Malaysian institutions have collaborated more intra
partner institutions than with other institutions within the country. Internationally co
papers were cited three times more than locally co
business management discipline in Indian context was done by
identify the trends of researchers from IIM
level 3
(collaboration of contributors within the
same institute)
level 2
(collaboration of authors
between institutions within the country) eg.universities,
industry/firm
level 1
(collaboration between countries)
Aggregation
3
Figure 1 Levels of scientific collaboration.
Studies of collaboration often are a form of evaluative analysis, it can be
level of partnerships between countries and between institutes. Several investigators have
conducted bibliometric studies of nature and pattern of research collaboration in different
Arunachalam and Doss (2000) studied on the international collaboration in
authorship analysis and finds that there is constant growth in
Garg and Padhi (2001) has studied analysis on collaboration
pattern in Laser science and technology India at different aggregations as local (inter
departmental), domestic (inter-institutional) and international collaboration.
has done similar analysis on the collaboration of faculties of plant sciences in central
al level, national level and local level and found that the faculties of
the four central universities collaborate at international level and the national& local level
collaboration is also fairly good due to the reduction of geographical barrier by recent
advances in technology and ICT. Kumar and Jan (2012) in their study
collaboration trends in Malaysia using bibliometrics and network analysis within the field of
BM in Malaysia at the individual, institutional, and international levels
Malaysian institutions have collaborated more intra-institutionally or with their foreign
partner institutions than with other institutions within the country. Internationally co
papers were cited three times more than locally co-authored papers. Further, the study of
business management discipline in Indian context was done by Kumar and Dora(2012)
identify the trends of researchers from IIM-A (Indian institute of Management, Ahmedabad)
Scientific collabaoration pattern
Macro level
Meso level
Micro level/individ
ual level
International/extramural
National/inter-institutional
Local/inter-departmental/intramura
l
Studies of collaboration often are a form of evaluative analysis, it can be used to assess the
level of partnerships between countries and between institutes. Several investigators have
conducted bibliometric studies of nature and pattern of research collaboration in different
e international collaboration in
authorship analysis and finds that there is constant growth in
has studied analysis on collaboration
dia at different aggregations as local (inter-
institutional) and international collaboration. Sevukan (2007)
has done similar analysis on the collaboration of faculties of plant sciences in central
al level, national level and local level and found that the faculties of
the four central universities collaborate at international level and the national& local level
collaboration is also fairly good due to the reduction of geographical barrier by recent
examined research
using bibliometrics and network analysis within the field of
BM in Malaysia at the individual, institutional, and international levels and found that
institutionally or with their foreign
partner institutions than with other institutions within the country. Internationally co-authored
thored papers. Further, the study of
Kumar and Dora(2012) to
A (Indian institute of Management, Ahmedabad)
International/extramur
departmental/intramura
Page 5
4
for the period 1999 to 2010 and the results shows that the single authored papers have
reduced over a period of time and the collaboration with authors from abroad(international
collaboration was highest in 2003 and 2006 and afterwards shows a decline. The present
study projects to measure the nature and pattern of collaboration in Business Management
research in India considering the whole country’s output, not limiting to a particular institute,
with special focus given to international level collaborations.
Bibliometric indicators for measuring the extent of scientific collaboration
Scientific collaboration has become one of the favourite topics in bibliometric research.
Bibliometrics offers a powerful set of methods and measures for studying the structure and
process of scholarly communication. Some important bibliometric parameters and indices
employed to analyze the data are defined below.
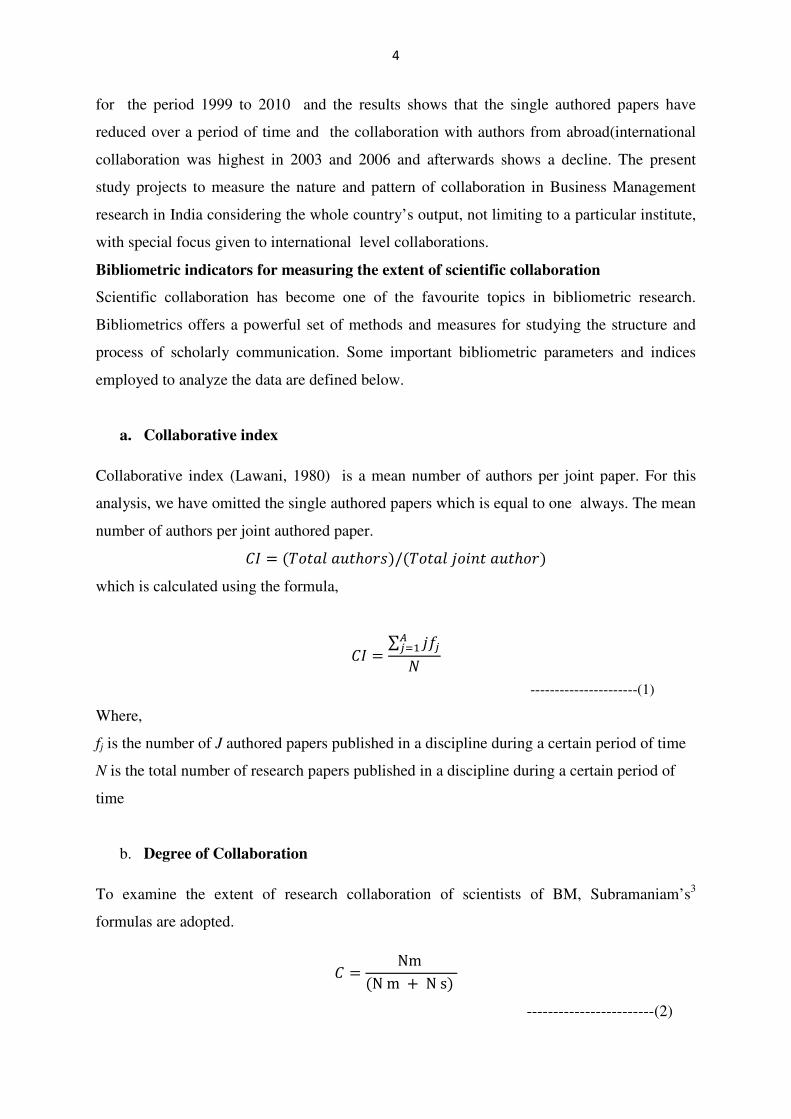
a. Collaborative index
Collaborative index (Lawani, 1980) is a mean number of authors per joint paper. For this
analysis, we have omitted the single authored papers which is equal to one always. The mean
number of authors per joint authored paper.
�� � ����� ����� ��/����� ����� ����� �
which is calculated using the formula,
�� � ∑ ��������
----------------------(1)
Where,
fj is the number of J authored papers published in a discipline during a certain period of time
N is the total number of research papers published in a discipline during a certain period of
time
b. Degree of Collaboration
To examine the extent of research collaboration of scientists of BM, Subramaniam’s3
formulas are adopted.
� � Nm �N m � N s�
------------------------(2)
Page 6
5
C= Degree of collaboration of scientists
N m = Number of multiple authored Papers
N s = Number of single authored papers
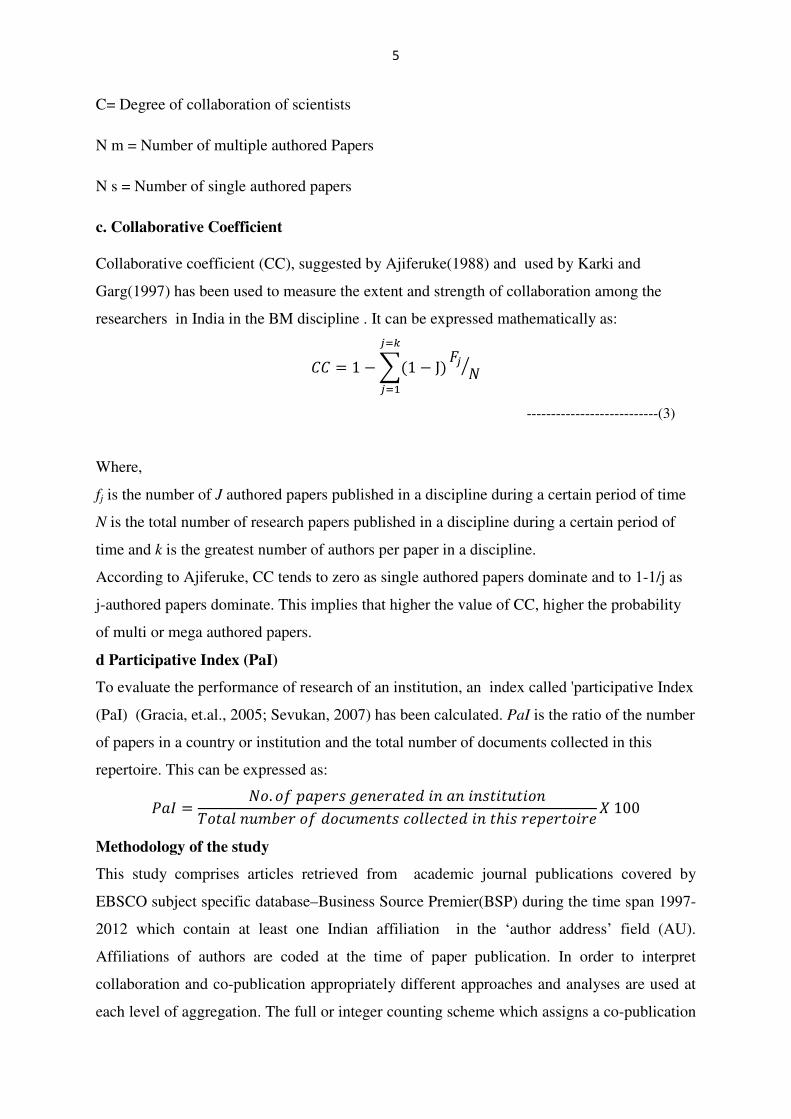
c. Collaborative Coefficient
Collaborative coefficient (CC), suggested by Ajiferuke(1988) and used by Karki and
Garg(1997) has been used to measure the extent and strength of collaboration among the
researchers in India in the BM discipline . It can be expressed mathematically as:
�� � 1 !�1 J� #� �$��%
���
---------------------------(3)
Where,
fj is the number of J authored papers published in a discipline during a certain period of time
N is the total number of research papers published in a discipline during a certain period of
time and k is the greatest number of authors per paper in a discipline.
According to Ajiferuke, CC tends to zero as single authored papers dominate and to 1-1/j as
j-authored papers dominate. This implies that higher the value of CC, higher the probability
of multi or mega authored papers.
d Participative Index (PaI)
To evaluate the performance of research of an institution, an index called 'participative Index
(PaI) (Gracia, et.al., 2005; Sevukan, 2007) has been calculated. PaI is the ratio of the number
of papers in a country or institution and the total number of documents collected in this
repertoire. This can be expressed as:
&�� � ��. �� (�() � *)�) ��)+ �� �� ��������������� ��,-) �� +�.�,)��� .�).�)+ �� ���� )() ��� ) / 100
Methodology of the study
This study comprises articles retrieved from academic journal publications covered by
EBSCO subject specific database–Business Source Premier(BSP) during the time span 1997-
2012 which contain at least one Indian affiliation in the ‘author address’ field (AU).
Affiliations of authors are coded at the time of paper publication. In order to interpret
collaboration and co-publication appropriately different approaches and analyses are used at
each level of aggregation. The full or integer counting scheme which assigns a co-publication
Page 7
6
fully to each contributing unit is used for measuring the authorship since for the analysis of
collaboration patterns as well as comparisons of relative publication activity requires full-
address counts. The institutional affiliation entered in the original data from the bibliographic
data sources is to serve as the basis for crediting publications to different institutions. For the
purpose of studying institutional collaboration entries from different departments within an
institution have been grouped under the name of parent institution to which they belong.
International collaboration is assigned if there is atleast one foreign address in the affiliation
of contributers. When the co-authors from a given country were more than one, collaboration
between the countries was attributed only once. For instance, an article published in co-
authorship by two institutions in India, one in France and two in the USA has been assigned
as one article for India, one for France and one for the USA. On analysis of the downloaded
bibliographic data using endnote programme and MS-Excel, it is observed that 17514 authors
have contributed 7998 articles. For studying the aggregations of collaboration, only papers
which are co-authored (5440) are considered. Further, to display the micro structure of
collaboration pattern tools such as Bibexcel and GPS visualizer is used .The study also
compiles the productive institutions in India which have contributed 15 or more research
publications.
Objectives of the study
The present study is aimed to examine the influence of research collaboration on research
Business management research productivity using co-authored papers. The following are the
specific objectives of the study
1. To examine the quantum and growth of single and co-authored papers in the
discipline
2. To measure the extent of scientific collaboration using bibliometric indices
3. To check whether the collaboration leads to an increase in the total productivity
4. To analyse the collaboration trends at different aggregations such local, national and
international level.
5. To identify the collaborations between academics and non academics in the discipline.
6. To identify the geographical(country) preference of Indian authors in International
collaboration
7. To rank prolific institutions contributing to BM research in India.
Page 8
7
Analysis and discussion
The data sample comprises 7998 articles retrieved from the EBSCO- Business Source
Premier database during the time span 1997-2012 containing at least one Indian affiliation.
The summary of the descriptive statistics are given in table 1. A total of 17514 contributors in
the dataset, of which 54.3 percent are co-authors. The mean author per paper is 2.24, where
as the mean collaborator per paper is calculated as 1.24. In the data set , only 31.98 articles
are single authored and rest 68.02% is written by two and more authors, which shows that
that there is a clear trend towards collaboration.
Table 1
Descriptive statistics of co-publication behaviour of Indian business management researchers
Publication Count Percentage Total publication 7998 100.00
Single author 2258 31.98 Co-authored 5440 68.02
Authors Total contributors 17514 100.00 No. of main authors 7998 45.67 No. of collaborating authors(co-authors)
9516 54.33
Mean author per paper 2.24 Mean co-author per paper 1.77 Authorship
One author 2258 31.98 Two author 3066 38.33
Three author 1582 19.78 Four author 488 6.1
1Five author 304 3.8
Collaboration level International 1652 20.66*
National 1938 24.23 Local 1850 23.13
* (Out of total publication)
Collaboration and productivity
The year wise distribution of co-authored publication reports a gradual increase from 0.44
percent in 1997 to 11.08 percent in 2012. The growth of co-authored publications during the
Page 9
8
study period is calculated as 37.94 percent and single authored papers as 42.7 percent using
the log- linear model. From Figure 1, it is apparent that the single authored publications also
show a gradual increase during the period. Hence, it was checked if collaboration on papers
led to an actual increase in the total number of papers (productivity) produced using the
correlation statistics.The correlation analysis between the number co-authored publications
and total productivity from 1997-2012 shows the high positive correlation with the
correlation co-efficient(r) of 0.99 between the collaboration and productivity.
Figure 1 Single authored and co-authored papers
Authorship pattern in co-authored publications
Figure 2 reveals the authorship pattern of co-authored publications. Among the 5440
publications which are joint authored, the largest group of 38.33 percent of papers was
contributed by 2 authors, followed by 19.78 per cent papers by 3 authors and 6.1 per cent of
papers by 4 authors. Figure 2 presents the percentage share of author producing 1, 2 …
papers a year. It also clearly reveals that as the number of authors collaborating increases the
number of papers decreases. A significant portion of the papers, about 96 per cent, are
covered by single author, two-author, and three-author and four-author partnerships.
0
100
200
300
400
500
600
700
800
900
1000
19
97
19
98
19
99
20
00
20
01
20
02
20
03
20
04
20
05
20
06
20
07
20
08
20
09
20
10
20
11
20
12
Single authored
co-authored
Page 10
9
Figure 2 Authorship pattern in co-authored publications.
Collaboration indices
The strength and extent of collaboration in BM research are further analysed by the
indices using the equations 1, 2 & 3 and presented in the table 2. The three indices shows
highest value in 1998 and 1999.The degree of collaboration shows an decrease from 0.78 in
1997 to 0.68 in 2012. According to Ajiferuke collaboration co-efficient tends to zero as
single authored papers dominate. This implies that higher the value of CC, higher the
probability of multi or mega authored papers. In this study we found mean value of CC as
0.415 which is far from 0. Hence, in Business Management the number of multi or mega
authored papers could be considerable. The analysis shows that all the three indices gradual
decline during the period of study which indicates an overall decreasing trend of
collaborative research in Business Management research in India.
Table 2
Year wise distribution of co-authorship patten and collaborative indices
Year 1 2 3 4 5 6 7 8 9 10 & above
Total authors
Total articles
CI CC DC
1997 10 22 8 4 1 0 0 0 0 0 99 45 2.2 0.45 0.78
1998 7 8 4 3 0 0 0 0 0 1 57 23 2.48 0.43 0.7
1999 4 18 5 2 0 1 0 0 0 0 69 30 2.3 0.49 0.87
2000 9 21 5 0 1 0 0 0 0 0 71 36 1.97 0.41 0.75
2001 16 18 7 5 0 0 1 0 0 1 113 48 2.29 0.4 0.67
2002 15 13 18 7 0 1 0 0 0 129 54 2.39 0.45 0.72
0.0
10.0
20.0
30.0
40.0
50.0
60.0
1 2 3 4 5 6 7 8 9 10
authorship
1997
2012
Page 11
10
2003 57 56 30 10 2 3 1 0 0 1 348 160 2.15 0.38 0.64
2004 89 135 62 15 5 0 1 3 2 3 724 315 2.25 0.42 0.72
2005 120 140 88 24 8 6 1 1 2 1 880 391 2.24 0.42 0.69
2006 146 165 108 26 13 6 2 0 2 11 1203 479 2.39 0.42 0.66
2007 223 239 130 27 19 7 3 3 4 0 1417 655 2.16 0.39 0.66
2008 354 400 179 65 13 5 0 3 0 6 2144 1025 2.08 0.38 0.66
2009 342 404 196 68 8 8 3 3 0 8 2255 1040 2.14 0.39 0.67
2010 347 434 193 77 21 7 2 2 1 4 2335 1088 2.14 0.4 0.68
2011 402 511 278 70 21 8 9 4 1 2 2817 1306 2.16 0.41 0.69
2012 417 482 271 85 26 6 3 5 1 7 2853 1303 2.18 0.4 0.68
Total 2558 3066 1582 488 138 58 26 24 13 45 17514 7998 Mean
% 31.98 38.33 19.78 6.1 1.73 0.73 0.33 0.3 0.16 0.56 100 2.2 0.415 0.702
(Columns in blue shows the maximum value) Levels of collaboration
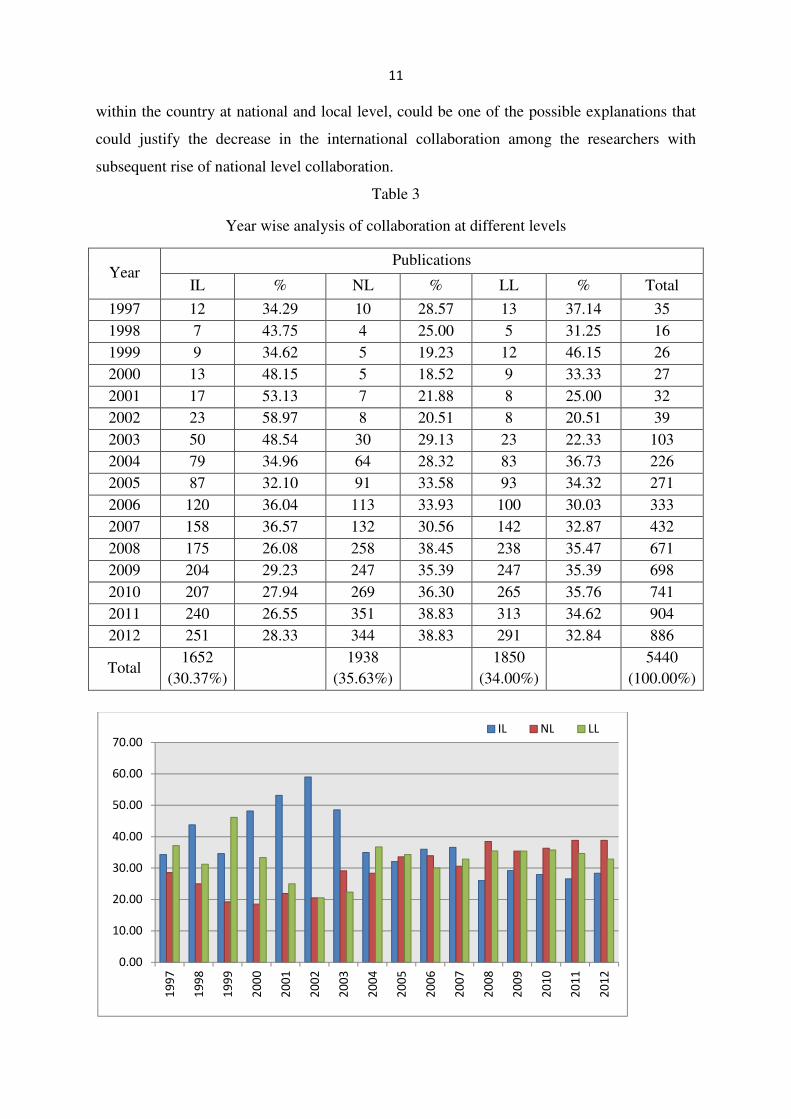
The data collected for the study is further analysed for looking at the collaboration level
undertaken by BM researchers. The affiliation of co-authors was explored in three levels of
collaboration as IL–International level (collaboration between Indian and foreign
contributors). International collaboration is assigned to publications if there is atleast one
address from country other than India in the address by-line) NL-National level
(collaboration of authors between different institutions within India) and LL-local level
(collaboration of contributors within the same institute or department). Table 3 shows that
collaboration at national level comprises of 35.63 percent of the co-authored publications and
was followed by collaboration at local level with 34 per cent of publications. The
international level collaboration is reported by 30.37 percent of publications. It is interesting
to note that although there has been a overall increase in international collaborative papers,
the number of papers with international collaboration category have declined from 2008
onwards in relation to the national and local collaborated papers which indicates a decrease in
the international collaboration trend of Indian researchers. But a subsequent increase of
national level collaboration is also observed from 2008 onwards. The collaboration with
authors from abroad was highest in 2000 to 2002, though the number of papers published
during those years was relatively less. According to Luukkonen, Persson and Sivertsen
(1992) countries with less developed scientific infrastructure tend to have higher rates of
international collaboration as they have practically no other choice than to find collaborating
partners from outside their borders. In India, percentage of international level collaboration
decreases from 34.29 percent in 1997 to 28.33 percent in 2012. The proliferation of Business
schools in the private sector in India, which have created ample collaboration opportunities
Page 12
11
within the country at national and local level, could be one of the possible explanations that
could justify the decrease in the international collaboration among the researchers with
subsequent rise of national level collaboration.
Table 3
Year wise analysis of collaboration at different levels
Year Publications
IL % NL % LL % Total
1997 12 34.29 10 28.57 13 37.14 35 1998 7 43.75 4 25.00 5 31.25 16 1999 9 34.62 5 19.23 12 46.15 26 2000 13 48.15 5 18.52 9 33.33 27 2001 17 53.13 7 21.88 8 25.00 32 2002 23 58.97 8 20.51 8 20.51 39 2003 50 48.54 30 29.13 23 22.33 103 2004 79 34.96 64 28.32 83 36.73 226 2005 87 32.10 91 33.58 93 34.32 271 2006 120 36.04 113 33.93 100 30.03 333 2007 158 36.57 132 30.56 142 32.87 432 2008 175 26.08 258 38.45 238 35.47 671 2009 204 29.23 247 35.39 247 35.39 698 2010 207 27.94 269 36.30 265 35.76 741 2011 240 26.55 351 38.83 313 34.62 904 2012 251 28.33 344 38.83 291 32.84 886
Total 1652
(30.37%) 1938
(35.63%) 1850
(34.00%) 5440
(100.00%)
0.00
10.00
20.00
30.00
40.00
50.00
60.00
70.00
19
97
19
98
19
99
20
00
20
01
20
02
20
03
20
04
20
05
20
06
20
07
20
08
20
09
20
10
20
11
20
12
IL NL LL
Page 13
12
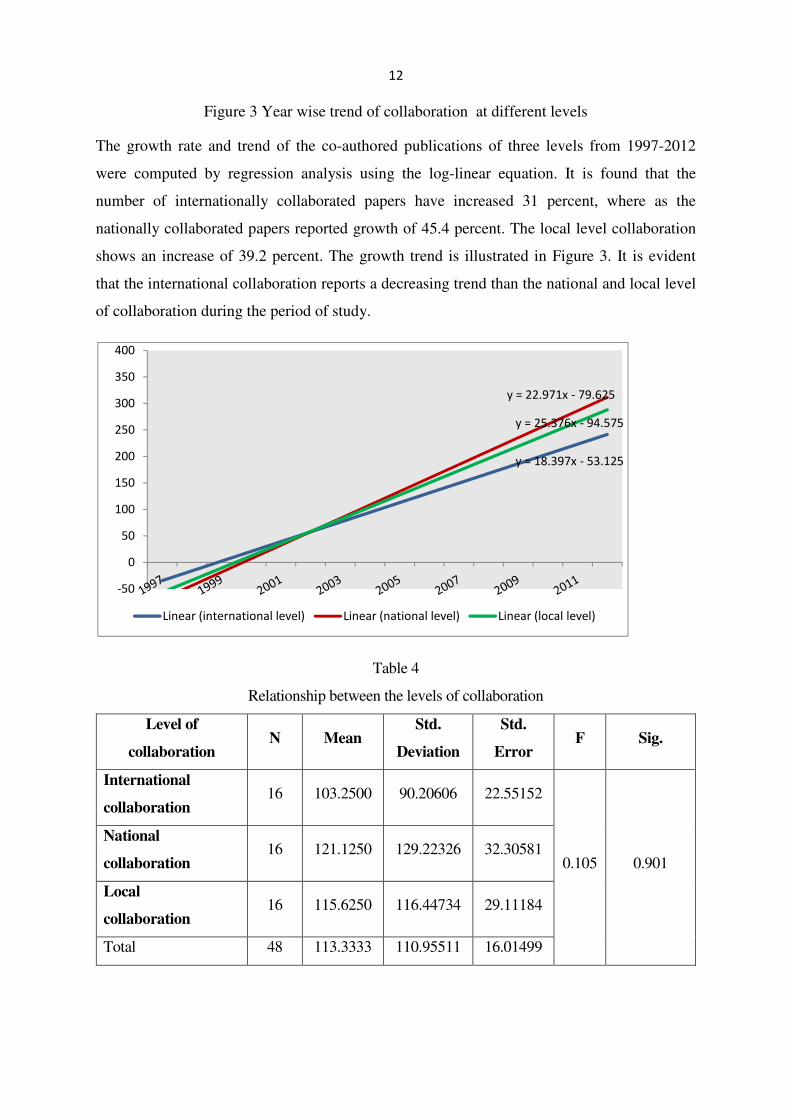
Figure 3 Year wise trend of collaboration at different levels
The growth rate and trend of the co-authored publications of three levels from 1997-2012
were computed by regression analysis using the log-linear equation. It is found that the
number of internationally collaborated papers have increased 31 percent, where as the
nationally collaborated papers reported growth of 45.4 percent. The local level collaboration
shows an increase of 39.2 percent. The growth trend is illustrated in Figure 3. It is evident
that the international collaboration reports a decreasing trend than the national and local level
of collaboration during the period of study.
Table 4
Relationship between the levels of collaboration
Level of
collaboration N Mean
Std.
Deviation
Std.
Error F Sig.
International
collaboration 16 103.2500 90.20606 22.55152
0.105 0.901
National
collaboration 16 121.1250 129.22326 32.30581
Local
collaboration 16 115.6250 116.44734 29.11184
Total 48 113.3333 110.95511 16.01499
y = 18.397x - 53.125
y = 25.376x - 94.575
y = 22.971x - 79.625
-50
0
50
100
150
200
250
300
350
400
Linear (international level) Linear (national level) Linear (local level)
Page 14
13
The one way ANOVA is carried out to find out the relationship between the level of
collaboration based on time based on the number of collaborative publications from 1997-2012
(Table 4). From the mean value it is evident that national level collaboration is more when
compared to international and local level. From the observed F-value 0.105 and its corresponding
P-value 0.901 it is concluded that there is no significant difference in all the three levels of
collaboration, but the mean value shows there exist difference in their level of collaboration.
Collaboration pattern at international level
International scientific collaboration has witnessed dramatic quantitative and structural
change since the last decades of the 20th century (Gla¨nzel and Schubert 2005). Advent of
ICT has globalised the research blurring national borders, making research more globalized.
Collaboration with international counterparts can occur because authors obtain better
opportunities to share resources and expertise. In BM research, out of the 5440 joint authored
papers, 1652 (30.36%) are co-authored at international level. The publications with
international level collaboration are examined in detail to identify the collaborating countries
with India. A total of 83 countries collaborate with India during 1997-2012. There shows
dramatic increase in the number of collaborating countries who participate in BM research
with Indian colleagues. In 1997 only six countries collaborate with India which rises to 50 in
2012 (Figure 4) and observes seven fold rise in the number of collaborating nations with
India. On examining the co-operation pattern, it is observed that, most of the articles (79.7%)
are written by authors from two countries; 15.8 percent of the articles show three countries in
co-publication; and 2.5 percent four or more countries involved, considering one of them to
be necessarily India. From this it is apparent that most of the collaborative papers have
resulted by bilateral collaboration of the countries.
Figure 4 Collaborating countries with India
6 5 6 6
14
8
19
29 28
42
27
38
4542
55
50
0
10
20
30
40
50
60
Co
lla
bo
rati
ng
co
un
trie
s
Page 15
14
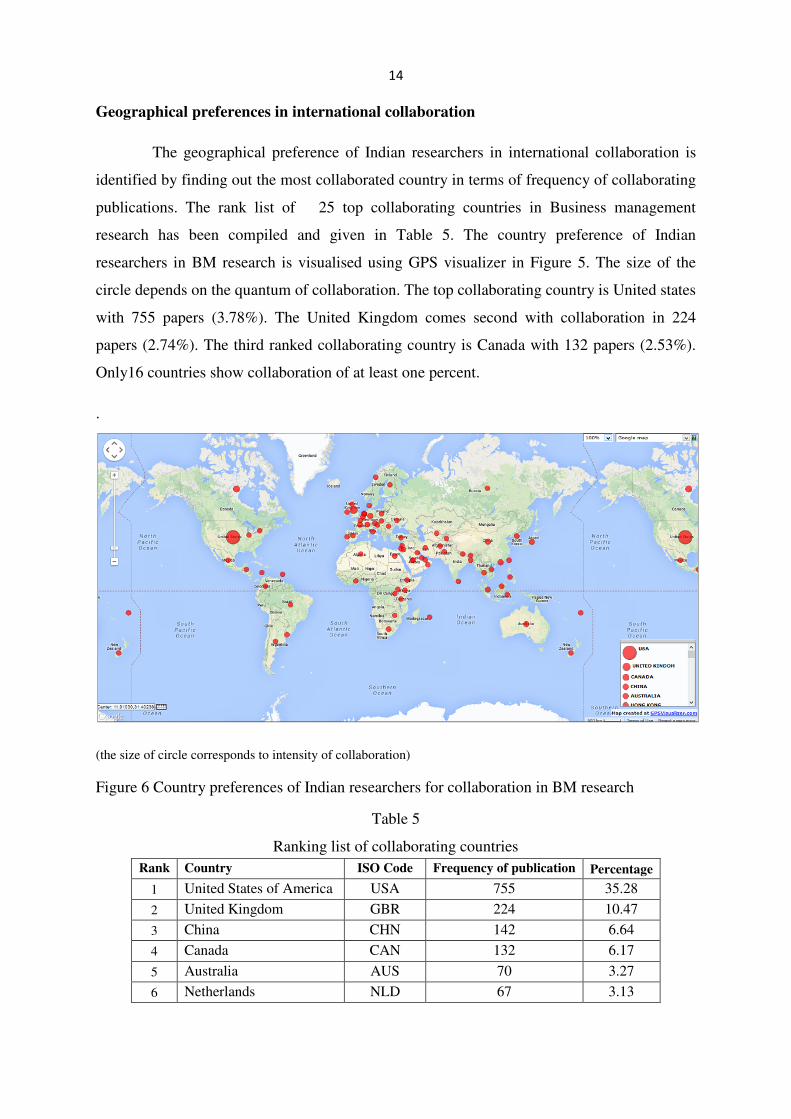
Geographical preferences in international collaboration
The geographical preference of Indian researchers in international collaboration is
identified by finding out the most collaborated country in terms of frequency of collaborating
publications. The rank list of 25 top collaborating countries in Business management
research has been compiled and given in Table 5. The country preference of Indian
researchers in BM research is visualised using GPS visualizer in Figure 5. The size of the
circle depends on the quantum of collaboration. The top collaborating country is United states
with 755 papers (3.78%). The United Kingdom comes second with collaboration in 224
papers (2.74%). The third ranked collaborating country is Canada with 132 papers (2.53%).
Only16 countries show collaboration of at least one percent.
.
(the size of circle corresponds to intensity of collaboration)
Figure 6 Country preferences of Indian researchers for collaboration in BM research
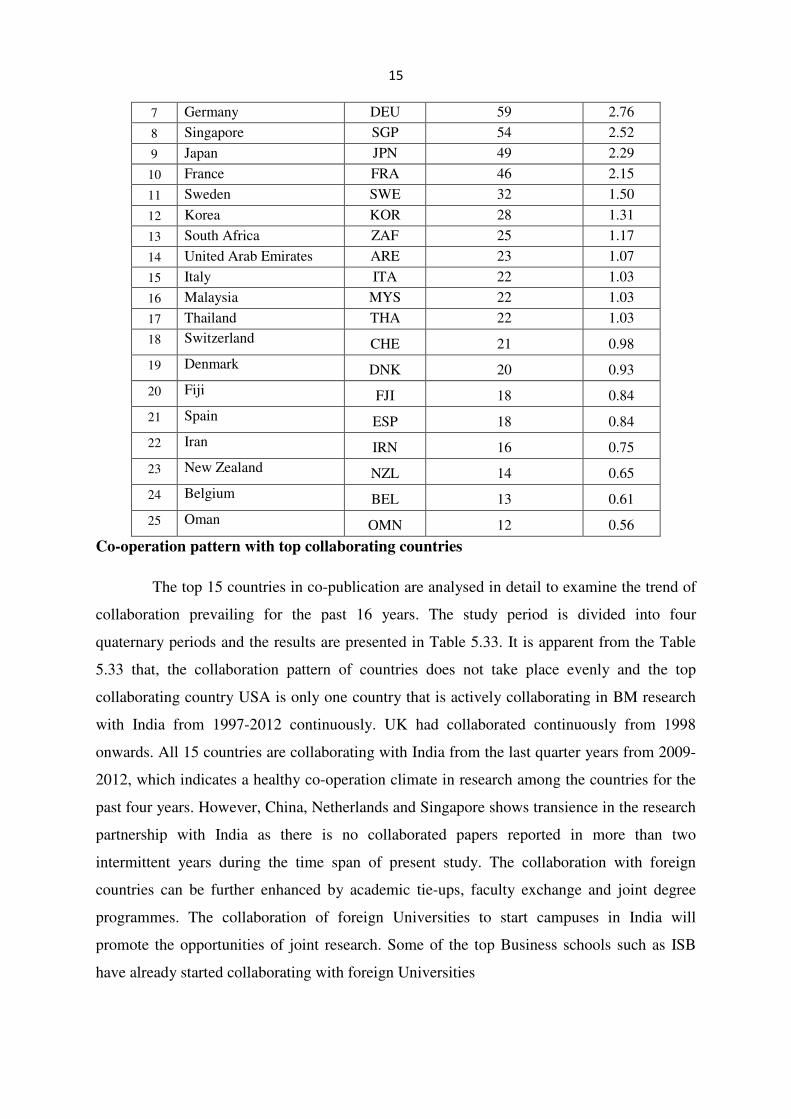
Table 5
Ranking list of collaborating countries Rank Country ISO Code Frequency of publication Percentage
1 United States of America USA 755 35.28
2 United Kingdom GBR 224 10.47
3 China CHN 142 6.64
4 Canada CAN 132 6.17
5 Australia AUS 70 3.27
6 Netherlands NLD 67 3.13
Page 16
15
7 Germany DEU 59 2.76
8 Singapore SGP 54 2.52
9 Japan JPN 49 2.29
10 France FRA 46 2.15
11 Sweden SWE 32 1.50
12 Korea KOR 28 1.31
13 South Africa ZAF 25 1.17
14 United Arab Emirates ARE 23 1.07
15 Italy ITA 22 1.03
16 Malaysia MYS 22 1.03
17 Thailand THA 22 1.03
18 Switzerland CHE 21 0.98
19 Denmark DNK 20 0.93
20 Fiji FJI 18 0.84
21 Spain ESP 18 0.84
22 Iran IRN 16 0.75
23 New Zealand NZL 14 0.65
24 Belgium BEL 13 0.61
25 Oman OMN 12 0.56
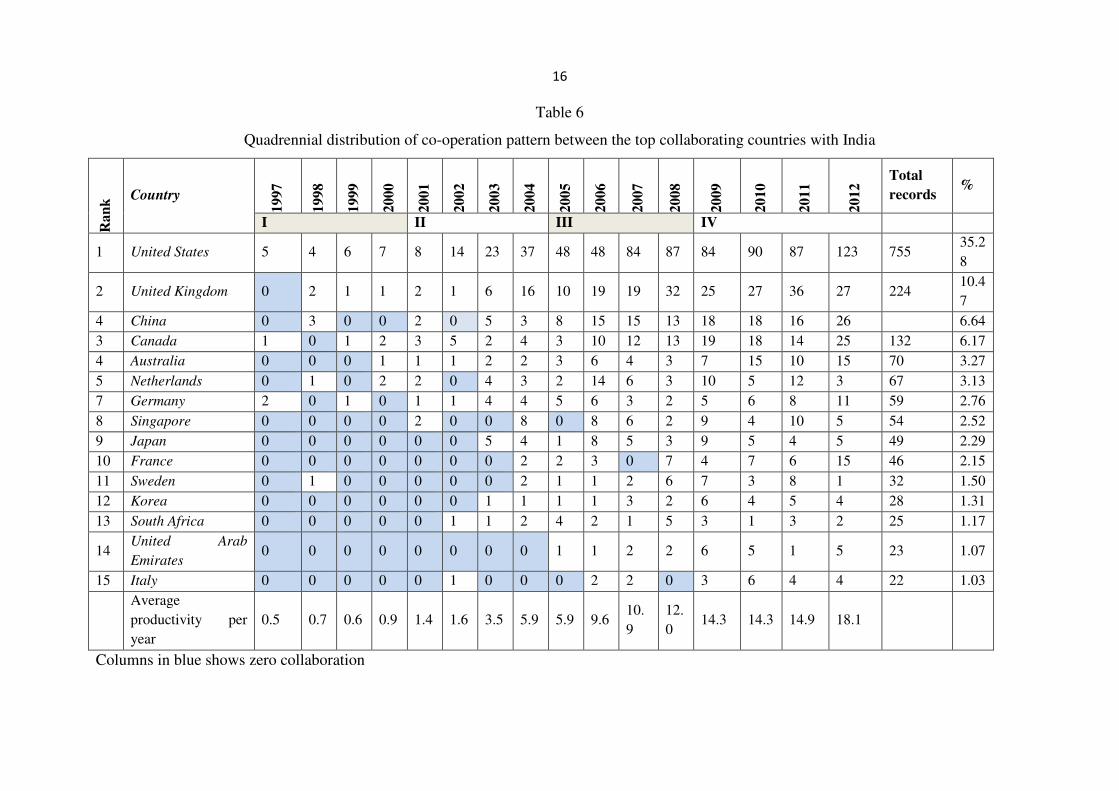
Co-operation pattern with top collaborating countries
The top 15 countries in co-publication are analysed in detail to examine the trend of
collaboration prevailing for the past 16 years. The study period is divided into four
quaternary periods and the results are presented in Table 5.33. It is apparent from the Table
5.33 that, the collaboration pattern of countries does not take place evenly and the top
collaborating country USA is only one country that is actively collaborating in BM research
with India from 1997-2012 continuously. UK had collaborated continuously from 1998
onwards. All 15 countries are collaborating with India from the last quarter years from 2009-
2012, which indicates a healthy co-operation climate in research among the countries for the
past four years. However, China, Netherlands and Singapore shows transience in the research
partnership with India as there is no collaborated papers reported in more than two
intermittent years during the time span of present study. The collaboration with foreign
countries can be further enhanced by academic tie-ups, faculty exchange and joint degree
programmes. The collaboration of foreign Universities to start campuses in India will
promote the opportunities of joint research. Some of the top Business schools such as ISB
have already started collaborating with foreign Universities
Page 17
16
Table 6
Quadrennial distribution of co-operation pattern between the top collaborating countries with India
Ra
nk
Country
1997
1998
1999
2000
2001
2002
2003
2004
2005
2006
2007
2008
2009
2010
2011
2012 Total
records %
I II III IV
1 United States 5 4 6 7 8 14 23 37 48 48 84 87 84 90 87 123 755 35.28
2 United Kingdom 0 2 1 1 2 1 6 16 10 19 19 32 25 27 36 27 224 10.47
4 China 0 3 0 0 2 0 5 3 8 15 15 13 18 18 16 26
6.64 3 Canada 1 0 1 2 3 5 2 4 3 10 12 13 19 18 14 25 132 6.17 4 Australia 0 0 0 1 1 1 2 2 3 6 4 3 7 15 10 15 70 3.27 5 Netherlands 0 1 0 2 2 0 4 3 2 14 6 3 10 5 12 3 67 3.13 7 Germany 2 0 1 0 1 1 4 4 5 6 3 2 5 6 8 11 59 2.76 8 Singapore 0 0 0 0 2 0 0 8 0 8 6 2 9 4 10 5 54 2.52 9 Japan 0 0 0 0 0 0 5 4 1 8 5 3 9 5 4 5 49 2.29 10 France 0 0 0 0 0 0 0 2 2 3 0 7 4 7 6 15 46 2.15 11 Sweden 0 1 0 0 0 0 0 2 1 1 2 6 7 3 8 1 32 1.50 12 Korea 0 0 0 0 0 0 1 1 1 1 3 2 6 4 5 4 28 1.31 13 South Africa 0 0 0 0 0 1 1 2 4 2 1 5 3 1 3 2 25 1.17
14 United Arab
Emirates 0 0 0 0 0 0 0 0 1 1 2 2 6 5 1 5 23 1.07
15 Italy 0 0 0 0 0 1 0 0 0 2 2 0 3 6 4 4 22 1.03
Average productivity per year
0.5 0.7 0.6 0.9 1.4 1.6 3.5 5.9 5.9 9.6 10.9
12.0
14.3 14.3 14.9 18.1
Columns in blue shows zero collaboration
Page 18
17
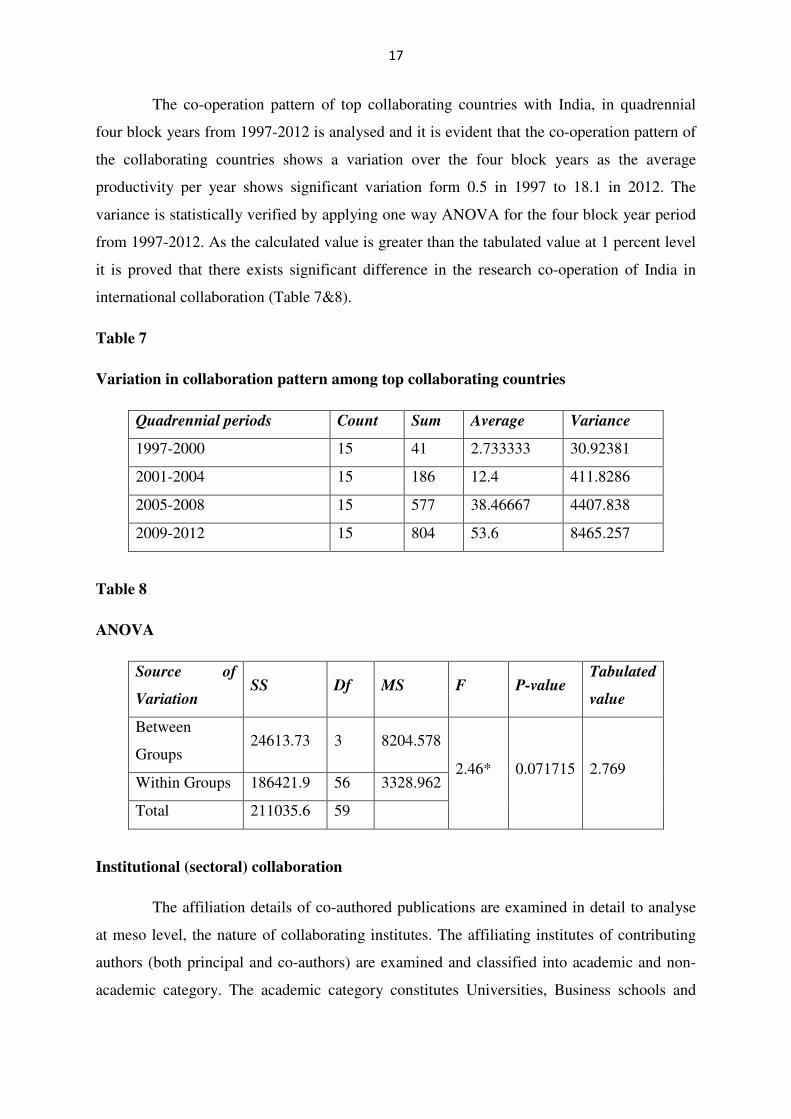
The co-operation pattern of top collaborating countries with India, in quadrennial
four block years from 1997-2012 is analysed and it is evident that the co-operation pattern of
the collaborating countries shows a variation over the four block years as the average
productivity per year shows significant variation form 0.5 in 1997 to 18.1 in 2012. The
variance is statistically verified by applying one way ANOVA for the four block year period
from 1997-2012. As the calculated value is greater than the tabulated value at 1 percent level
it is proved that there exists significant difference in the research co-operation of India in
international collaboration (Table 7&8).
Table 7
Variation in collaboration pattern among top collaborating countries
Quadrennial periods Count Sum Average Variance
1997-2000 15 41 2.733333 30.92381
2001-2004 15 186 12.4 411.8286
2005-2008 15 577 38.46667 4407.838
2009-2012 15 804 53.6 8465.257
Table 8
ANOVA
Source of
Variation SS Df MS F P-value
Tabulated
value
Between
Groups 24613.73 3 8204.578
2.46* 0.071715 2.769 Within Groups 186421.9 56 3328.962
Total 211035.6 59
Institutional (sectoral) collaboration
The affiliation details of co-authored publications are examined in detail to analyse
at meso level, the nature of collaborating institutes. The affiliating institutes of contributing
authors (both principal and co-authors) are examined and classified into academic and non-
academic category. The academic category constitutes Universities, Business schools and
Page 19
18
research institutes of academic character that venture in scholarly research and non-academic
category constitutes industries and service organisations. The non academics primarily
involve the management practitioners/professionals who involved in scholarly
Collaboration of academic and non-academic researchers
From the institute wise categorisation of research productivity given in Table 9, it is evident
that the lion shares of the co-authored articles (85.07%) are from academic institutions in
which both the principle author and co-authors are affiliated to the academic institutes. Only
4.49 percent are contributed by non academics/ researchers affiliated to (industries or service
organisations). Tijssen et al. (2009) tried to analyze performance measurements and
indicators based on university–industry research collaboration and from their study; the focus
was made on which university is the best providers of research services to the business sector.
The reason for low productivity of researchers in non–academic sector is the isolation of non-
academics from research due to the less academic–industry interface. Hence in order to foster
research among non-academics it is recommended to promote research collaboration with the
academic sector. For this the industry can provide funding for University/ academic research
and conduct exchange programme of professionals. Only 10.44 percent of publications are
produced from the collaboration between academic and non-academic authors. This
substantiates the above fact of less interaction between the academics and non academics in
the research.
Aggregations of academic and non-academic collaboration
On analysing the level of collaboration, the academics in Business management
discipline prefers more local collaboration i.e., collaboration within the same institute, than
international level collaboration while non-academic researchers are more biased to the local
research collaboration with 116 publications. The year wise distribution of academic level
collaborations are observed in detail to examine the collaboration trend during the study
period which shows a decline in internationally collaborated papers from the year 2002 in
relation to the national and local level collaboration. It is interesting to note that, in case of
inter collaboration between authors of academic and industry, internationally collaborated
papers (256 papers) shows the highest frequency and it depicts that there is ample invisible
colleges exits between the academic-industrial linked research activities involving India and
foreign nationals.
Page 20
19
Table 9
Distribution of collaborative papers in different aggregations
Nature of collaboration
Level of collaboration*
IL NL LL Total (%)
Between academics 1318 1585 1725 4628 (85.07%)
Between non academics 78 50 116 244 (4.49%)
Between academics and
non-academics 256 303 9 568 (10.44%)
Total 1652 1938 1850 5440
*IL-International level, NL-National level, LL-Local level
Table 10
Relationship between nature of collaboration and levels of collaboration
Nature of
collaboration N Mean Std. Deviation Std. Error F Sig.
Scheffe
value
between
academics 3 1542.6667 206.77605 119.38221
86.544 .000
1Vs2,
1Vs3
between non
academics 3 81.3333 33.12602 19.12532
between
academics and non
academics
3 190.0000 158.35719 91.42757
Total 9 604.6667 717.18826 239.06275
The one way ANOVA is carried out to find out the relationship between nature of
collaboration and levels of collaboration (Table 10). From the mean value it is evident that
‘collaboration between academics’ is very high when compared to between non-academics
Page 21
20
and between academics and non academics. From the Table 5.36 it is further noted that the F-
value is 86.54 which is significant at 0.01 percent level. Hence it is concluded that there is a
significant relationship between nature of collaboration and levels of collaboration. From the
scheffe value it is observed that this significant difference is due to the difference in between
academics and between non-academics, between academics and between academics and non-
academics.
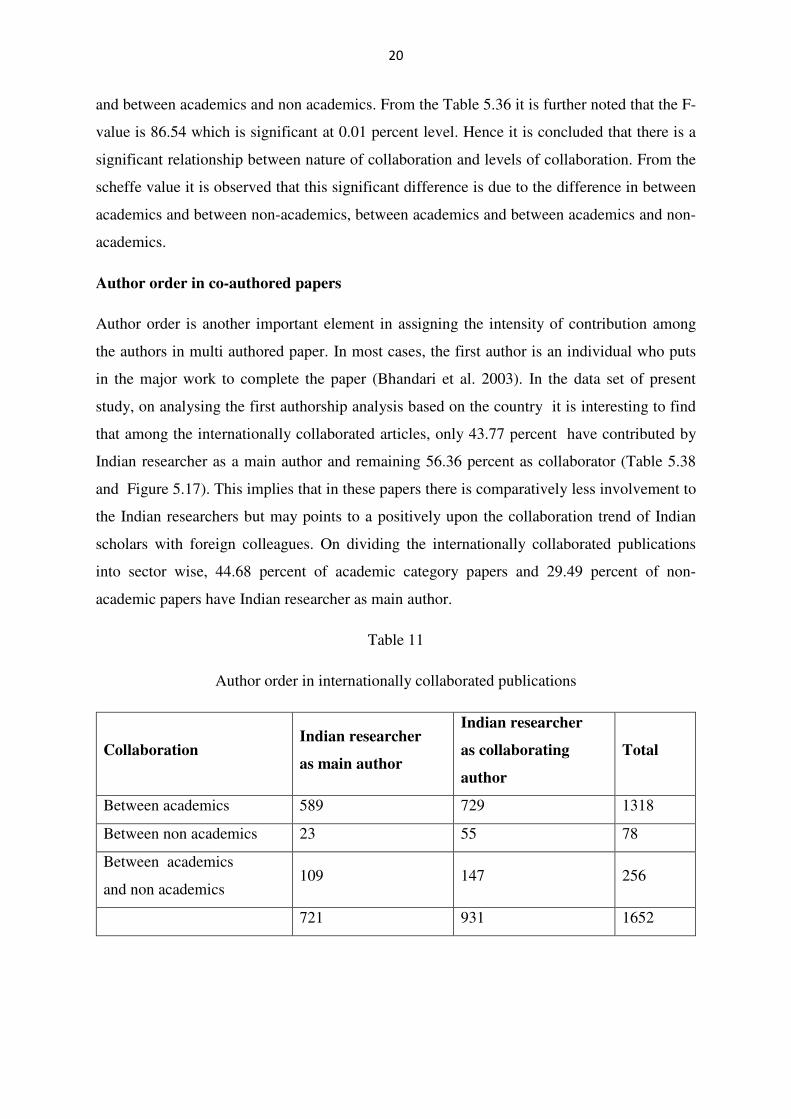
Author order in co-authored papers
Author order is another important element in assigning the intensity of contribution among
the authors in multi authored paper. In most cases, the first author is an individual who puts
in the major work to complete the paper (Bhandari et al. 2003). In the data set of present
study, on analysing the first authorship analysis based on the country it is interesting to find
that among the internationally collaborated articles, only 43.77 percent have contributed by
Indian researcher as a main author and remaining 56.36 percent as collaborator (Table 5.38
and Figure 5.17). This implies that in these papers there is comparatively less involvement to
the Indian researchers but may points to a positively upon the collaboration trend of Indian
scholars with foreign colleagues. On dividing the internationally collaborated publications
into sector wise, 44.68 percent of academic category papers and 29.49 percent of non-
academic papers have Indian researcher as main author.
Table 11
Author order in internationally collaborated publications
Collaboration Indian researcher
as main author
Indian researcher
as collaborating
author
Total
Between academics 589 729 1318
Between non academics 23 55 78
Between academics
and non academics 109 147 256
721 931 1652
Page 22
21
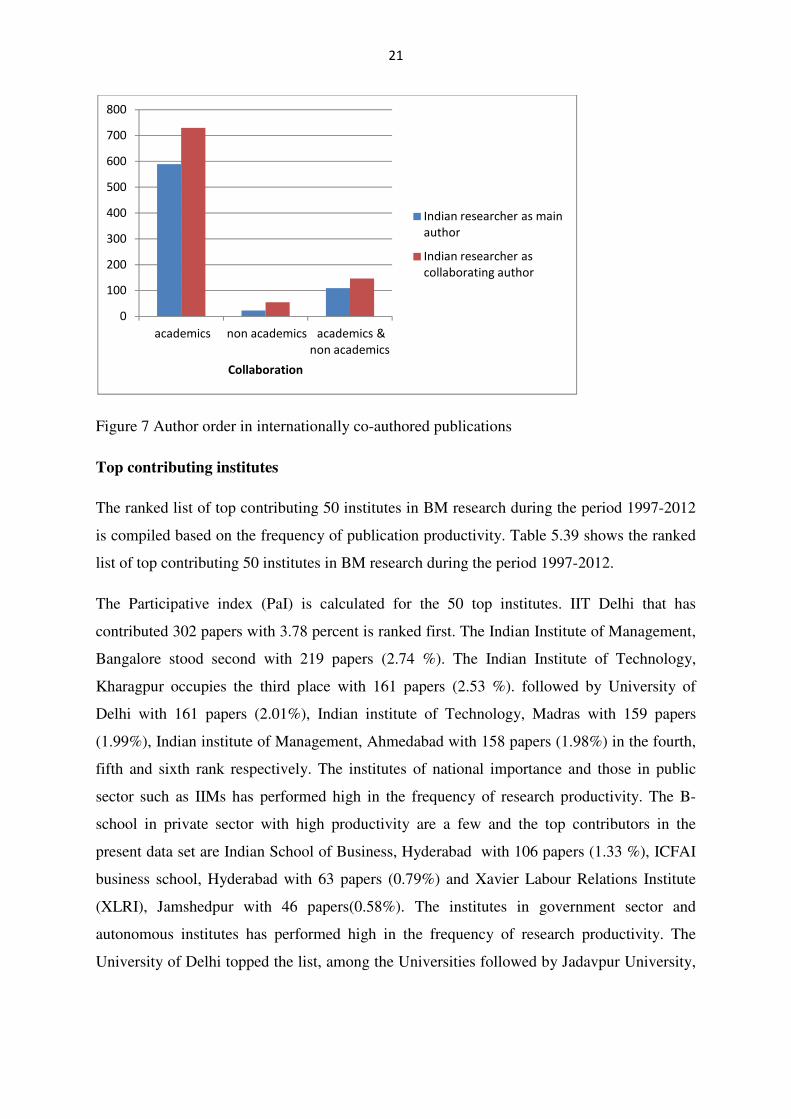
Figure 7 Author order in internationally co-authored publications
Top contributing institutes
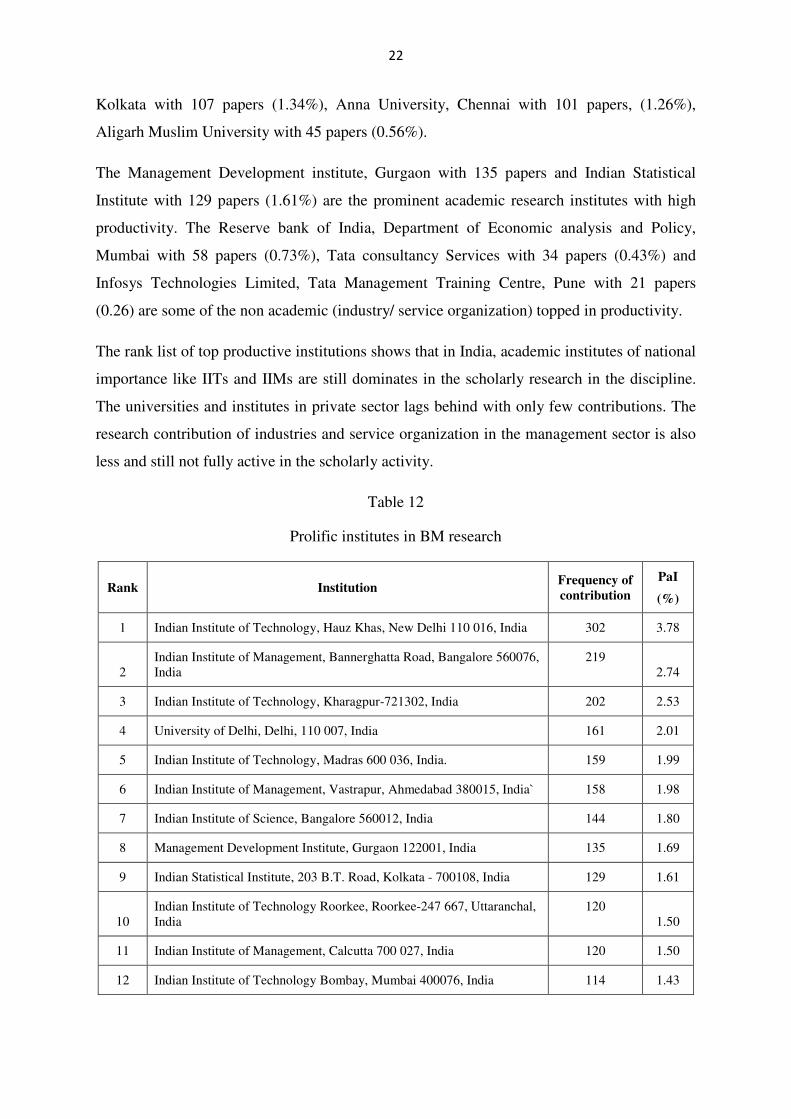
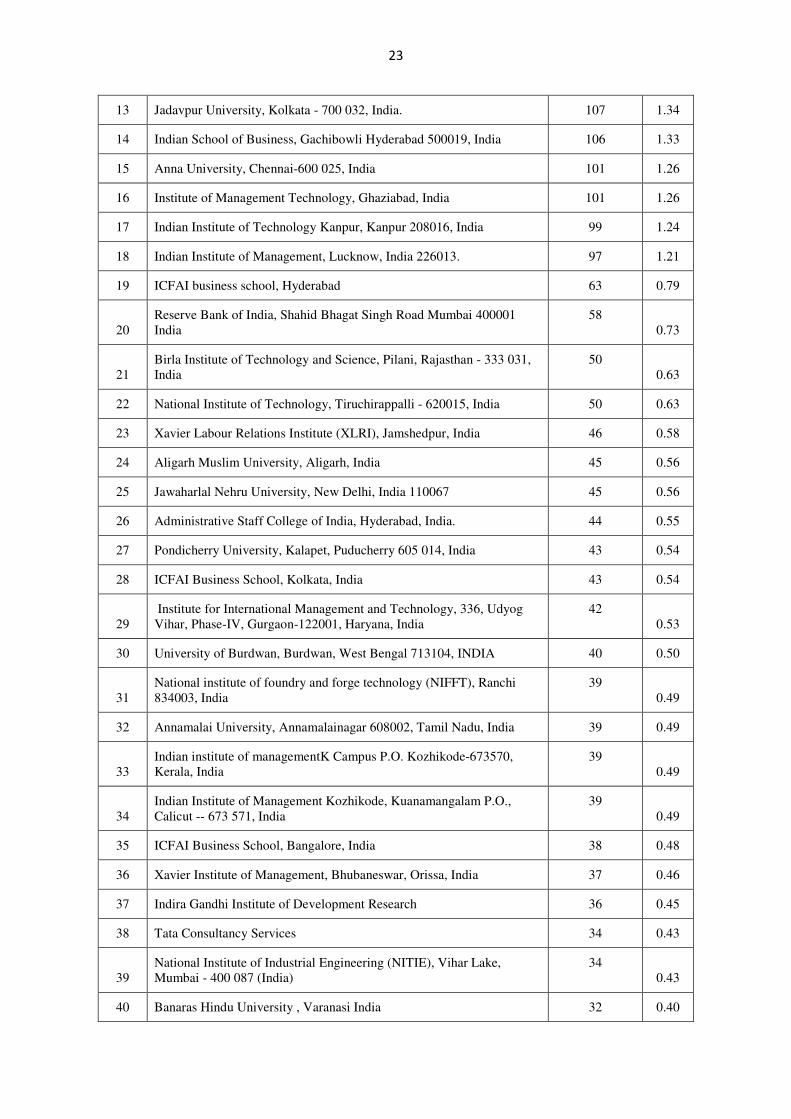
The ranked list of top contributing 50 institutes in BM research during the period 1997-2012
is compiled based on the frequency of publication productivity. Table 5.39 shows the ranked
list of top contributing 50 institutes in BM research during the period 1997-2012.
The Participative index (PaI) is calculated for the 50 top institutes. IIT Delhi that has
contributed 302 papers with 3.78 percent is ranked first. The Indian Institute of Management,
Bangalore stood second with 219 papers (2.74 %). The Indian Institute of Technology,
Kharagpur occupies the third place with 161 papers (2.53 %). followed by University of
Delhi with 161 papers (2.01%), Indian institute of Technology, Madras with 159 papers
(1.99%), Indian institute of Management, Ahmedabad with 158 papers (1.98%) in the fourth,
fifth and sixth rank respectively. The institutes of national importance and those in public
sector such as IIMs has performed high in the frequency of research productivity. The B-
school in private sector with high productivity are a few and the top contributors in the
present data set are Indian School of Business, Hyderabad with 106 papers (1.33 %), ICFAI
business school, Hyderabad with 63 papers (0.79%) and Xavier Labour Relations Institute
(XLRI), Jamshedpur with 46 papers(0.58%). The institutes in government sector and
autonomous institutes has performed high in the frequency of research productivity. The
University of Delhi topped the list, among the Universities followed by Jadavpur University,
0
100
200
300
400
500
600
700
800
academics non academics academics &
non academics
Collaboration
Indian researcher as main
author
Indian researcher as
collaborating author
Page 23
22
Kolkata with 107 papers (1.34%), Anna University, Chennai with 101 papers, (1.26%),
Aligarh Muslim University with 45 papers (0.56%).
The Management Development institute, Gurgaon with 135 papers and Indian Statistical
Institute with 129 papers (1.61%) are the prominent academic research institutes with high
productivity. The Reserve bank of India, Department of Economic analysis and Policy,
Mumbai with 58 papers (0.73%), Tata consultancy Services with 34 papers (0.43%) and
Infosys Technologies Limited, Tata Management Training Centre, Pune with 21 papers
(0.26) are some of the non academic (industry/ service organization) topped in productivity.
The rank list of top productive institutions shows that in India, academic institutes of national
importance like IITs and IIMs are still dominates in the scholarly research in the discipline.
The universities and institutes in private sector lags behind with only few contributions. The
research contribution of industries and service organization in the management sector is also
less and still not fully active in the scholarly activity.
Table 12
Prolific institutes in BM research
Rank Institution Frequency of
contribution
PaI
(%)
1 Indian Institute of Technology, Hauz Khas, New Delhi 110 016, India 302 3.78
2 Indian Institute of Management, Bannerghatta Road, Bangalore 560076, India
219 2.74
3 Indian Institute of Technology, Kharagpur-721302, India 202 2.53
4 University of Delhi, Delhi, 110 007, India 161 2.01
5 Indian Institute of Technology, Madras 600 036, India. 159 1.99
6 Indian Institute of Management, Vastrapur, Ahmedabad 380015, India` 158 1.98
7 Indian Institute of Science, Bangalore 560012, India 144 1.80
8 Management Development Institute, Gurgaon 122001, India 135 1.69
9 Indian Statistical Institute, 203 B.T. Road, Kolkata - 700108, India 129 1.61
10 Indian Institute of Technology Roorkee, Roorkee-247 667, Uttaranchal, India
120 1.50
11 Indian Institute of Management, Calcutta 700 027, India 120 1.50
12 Indian Institute of Technology Bombay, Mumbai 400076, India 114 1.43
Page 24
23
13 Jadavpur University, Kolkata - 700 032, India. 107 1.34
14 Indian School of Business, Gachibowli Hyderabad 500019, India 106 1.33
15 Anna University, Chennai-600 025, India 101 1.26
16 Institute of Management Technology, Ghaziabad, India 101 1.26
17 Indian Institute of Technology Kanpur, Kanpur 208016, India 99 1.24
18 Indian Institute of Management, Lucknow, India 226013. 97 1.21
19 ICFAI business school, Hyderabad 63 0.79
20 Reserve Bank of India, Shahid Bhagat Singh Road Mumbai 400001 India
58 0.73
21 Birla Institute of Technology and Science, Pilani, Rajasthan - 333 031, India
50 0.63
22 National Institute of Technology, Tiruchirappalli - 620015, India 50 0.63
23 Xavier Labour Relations Institute (XLRI), Jamshedpur, India 46 0.58
24 Aligarh Muslim University, Aligarh, India 45 0.56
25 Jawaharlal Nehru University, New Delhi, India 110067 45 0.56
26 Administrative Staff College of India, Hyderabad, India. 44 0.55
27 Pondicherry University, Kalapet, Puducherry 605 014, India 43 0.54
28 ICFAI Business School, Kolkata, India 43 0.54
29 Institute for International Management and Technology, 336, Udyog Vihar, Phase-IV, Gurgaon-122001, Haryana, India
42 0.53
30 University of Burdwan, Burdwan, West Bengal 713104, INDIA 40 0.50
31 National institute of foundry and forge technology (NIFFT), Ranchi 834003, India
39 0.49
32 Annamalai University, Annamalainagar 608002, Tamil Nadu, India 39 0.49
33 Indian institute of managementK Campus P.O. Kozhikode-673570, Kerala, India
39 0.49
34 Indian Institute of Management Kozhikode, Kuanamangalam P.O., Calicut -- 673 571, India
39 0.49
35 ICFAI Business School, Bangalore, India 38 0.48
36 Xavier Institute of Management, Bhubaneswar, Orissa, India 37 0.46
37 Indira Gandhi Institute of Development Research 36 0.45
38 Tata Consultancy Services 34 0.43
39 National Institute of Industrial Engineering (NITIE), Vihar Lake, Mumbai - 400 087 (India)
34 0.43
40 Banaras Hindu University , Varanasi India 32 0.40
Page 25
24
41 Indian Institute of Management Indore, Indore-453 331, India 32 0.40
42 Osmania University, Hyderabad - 500 007, AP. India 30 0.38
43 Gujarat University, Ahmedabad 380009, Gujarat, India 29 0.36
44 University of Mumbai, Matunga Road, Mumbai - 400 019, INDIA 29 0.36
45 Kurukshetra University, Kurukshetra 136 119, Haryana, India 28 0.35
46 Institute of Economic Growth, Delhi University Enclave, Delhi - 110 007, India.
28 0.35
47 Infosys Technologies Limited, India 25 0.31
48 National Institute of Bank Management (NIBM), Pune, Maharashtra 24 0.30
49 Tata Management Training Centre, Pune, 411 011, India 21 0.26
50 National Institute of Technology, Calicut 673601, Kerala, India 21 0.26
Suggestions and conclusion
Collaboration has been the salient feature of current science research organizations and
academic institutes. The change from little science to big science has resulted in a shift from
solo research to team research. The reason for collaboration in scholarly activity is
compounded by several variables such as institutional policies, financial support, and nature
of subject of investigation. Evaluating the scientific output using, that is, published paper as
an indicator has been a conventional practice since long in scientometric studies and the
research collaboration is indicated by the frequency of co-authored papers. The present study
has investigated on the current scenario of scholarly collaboration in the field of Business
management research in India in terms of co-authored publication in multiple perspectives.
As there is wide felt variation in collaboration trend in various disciplines, it is apparent from
the study that the collaboration plays significant role in the research scenario even in soft
discipline like Business management. As the study has found there is significant correlation
between collaboration and productivity, it is necessary to promote the collaboration ventures
in Business Management discipline to increase the scholarly productivity. Unlike pure
science disciplines, less funding is allotted at present to disciplines under Social sciences and
Humanities. But, due to the emerging importance to the social science disciplines such as
Business Management, sociology, Ecology adequate funding should be given according the
significance of research projects. The measure should be taken to promote collaboration at
academic level and between academic and non-academic sectors. The collaboration in the
academic sector can be encouraged by exchange programmes and adequate funding. The
industry-academic tie-ups should be motivated by initiating the policies for funding from
Page 26
25
industries to carry out academic research for the mutual benefit of both. The research
collaboration especially at international level is found decreasing and it is the need of the
hour to promote the Indian management research to global arena. The publication in
international level journals will helps in improving the visibility of Indian research in the
discipline. The international level collaborations need to encourage further bringing out
quality publications as well as diversity in research. It also helps in better visibility of Indian
management problems at global level which would also increase the citation rate of
publication. The academic tie up in education should be extended to research also by
partnering with global business schools. The International Faculty development Programme,
student exchange programmes, teaching forums with international institutes will provide
ample opportunities to reach with foreign researchers. The ISB has made the following
initiatives such as visiting faculty from the leading global B-schools — Wharton, Kellogg,
London Business School, Cornell, Chicago, Duke, UCLA, etc, Joint faculty exchange
programmes with MIT Sloan and participation of faculty members of the Kellogg School of
Management and the Wharton School in designing curricula, research conferences as well as
in recruitment of faculty. This could be achieved by more scientists attending and presenting
their research results in international conferences which would lead to more collaboration.
References
1. Yin, L. C., Kretschmer, H., Hanneman, R. A., & Liu, Z. Y. (2006). Connection and
stratification in research collaboration: An analysis of the COLLNET network.
Information Processing and Management, 42(6), 1599–1613.
doi:10.1016/j.ipm.2006.03.021.
2. Katz J.S., B.R. Martin (1997). What is research collaboration?, Research Policy, 26,
1-18.
3. Heinze, T., & Kuhlmann, S. (2008). Across institutional boundaries? Research
collaboration in German public sector nanoscience. Research Policy, 37(5), 888–899.
doi:10.1016/j.respol.2008.01.009
4. Bordons, M., & Gomez, I. (2000). Collaboration networks in science. In B. Cronin &
H. B. Atkins (Eds.), The web of knowledge: A festschrift in honor of Eugene Garfield
(pp. 197-213). Medford, NJ: Information Today.
5. Tibor Braun, Wolfgang Gla�nzel, and András Schubert.(2001) Publication and
cooperation patterns of the authors of neuroscience journals. Scientometrics,
50(3):499–510
Page 27
26
6. Meadows, A. J. (1998). Communicating research. San Diego, CA: Academic Press.
7. Kyvik, S. (2003). Changing trends in publishing behavior among university faculty,
1980-2000. Scientometrics, 58(1), 35-48. http://dx.doi.org/10.1023/A:1025475423482
8. Pierce, S. J. (1999). Boundary crossing in research literatures as a means of
interdisciplinary information transfer. Journal of the American Society for
Information Science, 50, 271-279.
9. Qin, J., Lancaster, F. W., & Allen, B. (1997). Types and levels of collaboration in
interdisciplinary research in the sciences. Journal of the American Society for
Information Science, 48, 893-916.
10. Persson, O., Glänzel, W., Danell, R.,(2004) Inflationary bibliometric values: the role
of scientific collaboration and the need for relative indicators in evaluative
studies.Scientometrics, 60, 3, 421-432.
11. Glanzel, W. National characteristics in international scientific co-authorship.
Scientometrics, 2001, 51(1), 69-115.
12. Gomez, I; Fernandez, M.T. & Mendez, A(1995). Collaboration patterns of Spanish
scientific publications in different research areas and disciplines. In Biennial
Conference of the International Society for Scientometrics and Informetrics, edited by
M.E.D. Koeing and A.Bookstein, 187-96.
13. Ding, Y.; Foo, S. & Choudhury, G. A bibliometric analysis of collaboration in the
field of information retrieval. Internat. Inf. Lib. Rev., 1999, 30, 367-76.
14. Glanzel, W. Co-authorship patterns and trends in the sciences (1980-1998): A
bibliometric study with implications for database indexing and search strategies.
Library Trends, 2002, 50(3), 461-73.
15. KRETSCHMER, H (1997), Patterns of behaviour in coauthorship networks in
invisible colleges. Scientometrics, 40: 579-591.
16. LAUDEL, G., What do we measure by co-authorships? Research Evaluation, 11 (1),
2002, 3-15.
17. Garg, K.C. & Padhi, P. A study of collaborations in laser science and technology.
Scientometrics, 2001, 51, 415-27.
18. Sevukan, R; Nagarajan, M and Sharma, Jaideep(2007)Research output of faculties of
plant sciences in central universities of India: A bibliometric study Annals of library
and Information studies 54(3)p.129-139
Page 28
27
19. Nishtha, A (2013) Publication Pattern of scientists of Physical Research Laboratory
(PRL), Ahmedabad, India" (2013). Library Philosophy and Practice (e-journal). Paper
901.Accessed from http://digitalcommons.unl.edu/libphilprac/901
20. Kumar, S. & Jan, J. M. (2013). Mapping research collaborations in the business and
management field in Malaysia, 1980-2010.. Scientometrics, 97, 491-517
21. Kumar, H. Anil and Dora, Mallikarjun (2012)Research Productivity in a
Management Institute: An Analysis of Research Performance of Indian Institute of
Management Ahmedabad during 1999-2010.DESIDOC Journal of Library &
Information Technology, 32, 4, 365-372
22. Lawani, S.M. (1980) Quality, collaboration, and citations in cancer research: a
bibliometric study (PhD thesis). Florida: Florida State University.
23. Subramanyam, K. (1983) Bibliometric studiesof research collaboration: A review.
Journal of Information Science 6(1)p: 33-38.
24. Ajiferuke, I; Burrel, Q. & Taque, J. Collaborative coefficient: A single measure of
the degree of collaboration in research. Scientometrics, 1988, 14(5-6), 421.
25. Karki, M.M.S. & Garg, K.C. Bibliometrics of alkaloid chemistry research in India. J.
Chem. Inf. Comput. Sci. 1997, 37, 157-61.
26. Pilar García-García, Francisco López-Muñoz, Justo Callejo, Belén Martín-Águeda,
Cecilio Álamo, Evolution of Spanish scientific production in international obstetrics
and gynecology journals during the period 1986–2002, European Journal of
Obstetrics & Gynecology and Reproductive Biology, Volume 123, Issue 2, 1
December 2005, Pages 150-156, ISSN 0301-2115,
http://dx.doi.org/10.1016/j.ejogrb.2005.06.039.
27. Luukkonen, T, Persson, O, Sivertsen, G. Understanding patterns of international
scientific collaboration. Science, Technology & Human Values, Vol. 17, 1992, pp.
101–126.
28. Gla¨nzel, W., & Schubert, A. (2005). Analysing scientific networks through co-
authorship. In H. F. Moed, et al. (Eds.), Handbook of quantitative science and
technology research (pp. 257–276). Dordrecht:Kluwer.
29. Planning commision, I. (2012). Higher Education in India: Twelfth Five Year Plan
(2012–2017) and beyond. Available at:
http://www.ey.com/Publication/vwLUAssets/Higher_Education_in_India/$File/EY-
FICC_Higher_Education_Report_Nov12.pdf. [Accessed: 16 Apr 2013].
Page 29
28
30. Bhandari, M., Einhorn, T. A., Swiontkowski, M. F., & Heckman, J. D. (2003). Who
did what?: (Mis) perceptions about authors’ contributions to scientific articles based
on order of authorship. The Journal of Bone and Joint Surgery, 85(8), 1605.
31. Serenko, A., Bontis, N., & Grant, J. (2009). A scientometric analysis of the
proceedings of the McMaster World Congress on the Management of Intellectual
Capital and Innovation for the 1996–2008 period. Journal of Intellectual Capital,
10(1), 8–21.
32. Abrizah, A., & Wee, M. C. (2011). Malaysia’s computer science research productivity
based on publications in the Web of Science, 2000–2010. Malaysian Journal of
Library & Information Science, 16(1), 109–124.